PHYSIK-DEPARTMENT
Nonlinear Phenomena during Bulk CO Electrooxidation on Pt Electrodes
Dissertation
von
Souradip Malkhandi
TECHNISCHE UNIVERSITÄT
MÜNCHEN
Technische Universität München Fakultät für Physik
Lehrstuhl für Grenzflächen und Energieumwandlung E19
Nonlinear Phenomena during Bulk CO Electrooxidation on Pt Electrodes
Souradip Malkhandi
Vollständiger Abdruck der von der Fakultät für Physik der Technischen Universität
München zur Erlangung des akademischen Grades eines
Doktors der Naturwissenschaften (Dr. rer. nat.)
genehmigten Dissertation.
Vorsitzender: Univ.-Prof. Dr. Ralf Metzler
Prüfer der Dissertation:
1. Univ.-Prof. Dr. Katharina Krischer
2. Prof. D. Sci. Elena R. Savinova,
Université Louis Pasteur, Straßburg/Frankreich
Die Dissertation wurde am 11.08.2008 bei der Technischen Universität München eingereicht und durch die Fakultät für Physik am 23.10.2008 angenommen.
i
Abstract
This experimental thesis deals with cooperative phenomena that occur during the
electrodissolution of CO on Pt electrodes. Three aspects are considered. Using a self-
designed electronic control device, evidence for the existence of a postulated chemical
positive feedback loop in the reaction mechanism is obtained. Measurements at both, low
concentration of supporting electrolyte and low CO bulk concentration yielded
information about the competitive adsorption of CO, OH and anions. Thereby, conditions
could be established that promoted CO oxidation at surprisingly low potentials. Further,
the interaction of strongly adsorbing anions with the elementary steps of CO
electrooxidation is shown to cause an oscillatory instability in wide parameter ranges.
The oscillations are chemical in nature and present the first experimental example of a
so-called strictly potentiostatic oscillator where the electrode potential acts as a
parameter.
ii
Zusammenfassung
In dieser Arbeit werden kooperative Phänomene, die bei der Elektrooxidation von CO an
Platinelektroden auftreten, untersucht. Mithilfe einer Rückkopplungskontrolle wird die
Existenz einer positiven Rückkopplungsschleife im Reaktionsmechanismus
nachgewiesen. Messungen bei niedrigen Konzentrationen von Leitelektrolyten und CO
liefern Information über Wechselwirkungen bei der Adsorption von CO, OH and
Anionen. Hierbei werden Bedingungen identifiziert, die die Oxidation von CO bei
erstaunlich niedrigen Potentialen begünstigen. Des Weiteren wird gezeigt, dass die
Wechselwirkung von stark adsorbierenden Anionen mit den Elementarschritten der CO-
Elektrooxidation in weiten Parameterbereichen zu einer oszillatorischen Instabilität führt.
Die Oszillationen entstehen aufgrund des Wechselspiels zweier chemischer
Rückkopplungsschleifen und stellen das erste experimentelle Beispiel eines so genannten
strikt potentiostatischen Oszillators dar.
iii
Contents
Contents ........................................................................................................................... iii
Chapter 1: Introduction .................................................................................................. 1
Chapter 2: Background ................................................................................................... 5
2.1 The electrochemical interface & electrochemistry.............................................. 5
2.1.1 The electrochemical interface .................................................................... 5
2.1.2 Electrochemical reaction & reaction rate theory........................................ 8
2.1.3 Forced convection: The rotating electrode............................................... 11
2.2 Nonlinear dynamics........................................................................................... 14
2.2.1 Dynamical system .................................................................................... 14
2.2.2 Fixed point of the dynamical system and its stability .............................. 14
2.2.3 Bifurcation ............................................................................................... 16
2.2.4 Saddle node bifurcation ........................................................................... 17
2.2.5 Hopf bifurcation....................................................................................... 18
2.2.6 Reaction diffusion system........................................................................ 19
2.3 Nonlinear dynamics of the electrochemical interface ....................................... 20
2.3.1 Bistability in an electrochemical system.................................................. 20
iv
2.3.1.1 Bistability and N-NDR systems....................................................... 20
2.3.1.2 Bistability and S-NDR systems........................................................ 22
2.3.2 Oscillations and electrochemical systems................................................ 23
2.3.2.1 Oscillations and N-NDR systems .................................................... 23
2.3.2.2 Oscillations and S-NDR systems ..................................................... 24
2.3.3 Pattern formation in electrochemical systems...................................... 25
2.4 CO electrooxidation on Pt ................................................................................. 27
2.4.1 Adsorption of CO on Pt ........................................................................... 27
2.4.2 Adsorbed oxygenated species .................................................................. 29
2.4.3 Surface reaction mechanism .................................................................... 31
2.4.4 The electrooxidation of CO...................................................................... 33
Chapter 3: Experimental methods ............................................................................... 36
3.1 Electrochemical cell .......................................................................................... 36
3.2 Instrumentation.................................................................................................. 37
3.3 Chemicals and electrolyte solution.................................................................... 38
3.4 Cleaning procedure and electrode preparation.................................................. 38
3.4.1 Polycrystalline Pt electrode...................................................................... 39
3.4.2 Single crystalline Pt electrode.................................................................. 39
3.4.3 Base CV of rotating Pt(110), Pt(100), and Pt(111) in 0.5 M H2SO4 ....... 42
Chapter 4: Application of Derivative Control during Bulk CO Electrooxidation... 44
4.1 Introduction ....................................................................................................... 44
4.2 Theoretical background..................................................................................... 45
4.3 Experiments....................................................................................................... 48
4.3.1 Realization of the control strategy ........................................................... 48
v
4.3.2 Experimental procedure ........................................................................... 49
4.4 Experimental results .......................................................................................... 50
4.5 Modelling and simulation.................................................................................. 53
4.6 Summary ........................................................................................................... 58
Chapter 5: Effect of Low CO Concentration and Diluted Supporting Electrolyte . 59
5.1 Impact of low CO and anion concentrations on the CO electrooxidation rate on
Pt single crystal surfaces ............................................................................................ 60
5.1.1 Experimental results................................................................................. 60
5.1.2 Discussion ................................................................................................ 69
5.2 Effect of CO and anion concentration on the negative potential limit of the
reactive branch ........................................................................................................... 73
5.2.1 Experimental results................................................................................. 73
5.2.2 Modelling of CO bulk electrooxidation ................................................... 78
Chapter 6: Strictly Potentiostatic Oscillations during Bulk CO Electrooxidation.. 83
6.1 Introduction ....................................................................................................... 83
6.2 Experiments....................................................................................................... 85
6.3 Experimental Results......................................................................................... 85
6.3.1 Inhibiting effect of BF4− anions ............................................................... 85
6.3.2 Current oscillations with BF4− anions ...................................................... 86
6.3.3 Current oscillations with chloride ............................................................ 88
6.3.4 Effect of the rotation rate on the oscillatory behaviour............................ 94
6.3.5 Effect of the base electrolyte concentration on the oscillatory behaviour 96
6.3.6 Impact of a series resistance................................................................... 102
vi
6.3.7 Current oscillations with bromide and iodide ........................................ 104
6.3.8 Current oscillations with Pt single crystal electrodes ............................ 106
6.3.8.1 Pt(110)............................................................................................ 106
6.3.8.2 Pt(100)............................................................................................ 107
6.3.8.3 Pt(111)............................................................................................ 109
6.4 Model and simulation...................................................................................... 111
6.4.1 Strictly potentiostatic oscillator ............................................................. 111
6.4.2 Comparison between simulations and experimental results .................. 114
6.4.2.1 Electrode rotation rate .................................................................... 116
6.4.2.2 Anion concentration....................................................................... 117
6.4.2.3 Electrolyte resistance ..................................................................... 118
6.4.3 Spatial structure and irregular oscillations............................................. 119
6.4.4 Discussion .............................................................................................. 122
6.5 Summary ......................................................................................................... 123
Chapter 7: Conclusions ............................................................................................... 125
References ..................................................................................................................... 129
Acknowledgment.......................................................................................................... 149
List of Publications....................................................................................................... 151
Chapter 1: Introduction 1
Chapter 1: Introduction
CO electrooxidation is among the most intensively studied electro-catalytic reactions [1-
4]; yet, it still receives unbroken attention. This outstanding position reflects its
fundamental and practical importance. CO as a relatively simple molecule has served as
a prototype system for studies of chemisorption phenomena and of electron, proton and
oxygen transfer processes [5, 6]. It is an intermediate in the electrooxidation of most
organic molecules, starting with the next simple C1-species formic acid or formaldehyde.
Understanding the basic steps of CO electrooxidation is thus also the first step towards a
better understanding of electrooxidation of many other organic compounds. Furthermore,
it is a contaminant in industrial hydrogen or hydrogen feed streams from carbon-based
fuels (e.g. reformed natural gas or methanol), but even traces of CO cause a dramatic
deactivation of an Pt anode, which is the most active catalyst for hydrogen
electrooxidation. Thus, Pt anodes in low-temperature fuel cells suffer from unacceptable
high overpotentials. Therefore, a thorough understanding of CO electrooxidation is also
of foremost importance in the development of improved low temperature fuel cells. This
thesis aims at making a contribution to a better understanding of the dynamics of this
reaction.
Most of the more recent studies of CO electrooxidation on Pt have employed a surface
science approach and have focused on microscopic structural features and elementary
steps. Investigations have been done with single-crystals, utilizing in-situ
electrochemical measurements such as 'classical' potentiodynamic techniques [5-21],
scanning tunnelling microscopy [22-24], Fourier transform infrared spectroscopy [25-
37], surface x-ray scattering [18, 38, 39], sum frequency generation [40, 41] as well as
ex-situ surface science techniques on emersed electrodes in UHV [42, 43]. Initially,
mainly so-called stripping experiments were performed, i.e. CO was adsorbed on the
Chapter 1: Introduction 2
electrode from CO-containing electrolytes and then the CO dissolved in the electrolyte
was driven out by purging the electrolyte with argon. Subsequently, the electrooxidation
or 'stripping' of the adsorbed CO molecules was studied [6, 44]. More recent experiments
also involve steady state conditions, i.e. CO remains dissolved in the bulk of the
electrolyte while adsorbed CO is oxidized [26, 45-47]. This type of experiments is often
referred to as CO bulk electrooxidation. A comprehensive review of all these studies can
be found in [3].
Besides many details on microscopic structural features and structure reactivity
relationships, which differ for different electrode orientations, the studies revealed that
independent of the surface structure the main route through which CO is oxidized is a
simple Langmuir Hinshelwood surface reaction. This means that adsorbed CO is
oxidized by reacting with a second adsorbed species, which is either OH or activated
water, depending on the electrode potential and other experimental conditions. Thus,
there is a competition of CO and OH (or water) for free surface sites. In a wide parameter
range, this feature causes the occurrence of an autocatalytic or positive feedback loop,
which in turn promotes dynamic instabilities. In fact, bistability between high and low
current branches has been observed, the most fundamental manifestation of a self-
enhancing reaction cycle [45, 48].
Bistability is one example of a dynamic instability. In general, dynamics instabilities may
arise in open systems that are kept far from thermodynamic equilibrium [49-60]. They
are studied in the interdisciplinary field of Nonlinear Dynamics and always involve
cooperative phenomena. This implies that the system's behaviour cannot be understood
by studying only the properties of the individual molecules making up the system.
Rather, the behaviour is determined by nonlinear interactions between the system's
variables, thus impeding a description that is based on any linear approximation.
Therefore, also CO electrooxidation cannot be fully understood without studying the
interaction of all the different reactions and transport steps. However, so far, despite the
many studies on CO electrooxidation, this 'nonlinear point of view' has hardly been
taken. Besides the above mentioned reports of bistability, there are only very few further
publications in which attention was paid to nonlinear behaviour [61-63]. Azevedo et al.
[63] observe oscillatory current densities, however, without being able to offer a
plausible explanation for the oscillatory instability. Oscillations under galvanostatic
conditions are reported in [45], but again their origin is unsolved. Bonnefont et al. [61]
demonstrate that the positive feedback cycle can lead to a Turing instability, and thus to
Chapter 1: Introduction 3
spatially inhomogeneous adsorbate distributions if the electrolyte resistance exceeds a
critical value. Also from a different perspective can the study of diluted supporting
electrolytes contribute to an understanding of the dynamics of CO electrooxidation.
Often it is assumed that the supporting electrolyte only ensures that the electrolyte is
conductive, but does not chemically interact with the electrode surface. However, this
picture is strongly idealized. Most anions adsorb to some extent on the electrode surface.
This is also true for the most frequently used anions of the base electrolyte, namely
sulphate and perchlorate, though to a very different extent. While sulphate ions are
known to strongly adsorb on Pt electrodes, the interaction between perchlorate ions and
most noble metal surfaces is much weaker. However, any adsorption of anions on the
electrode will reduce the number of free surface sites for CO electrooxidation. Thus, not
only CO and OH but also anions compete for free surface sites. The importance of anions
for the mechanism of CO electrooxidation has been pointed out in some papers [17, 20,
64], but a systematic study is still missing. Hence, it is also unknown whether the
interaction can be reduced to a pure Langmuirian one, i.e. is restricted to the competition
for free adsorption sites, or whether there are attractive or repulsive interactions between
anions and adsorbed CO and OH molecules. But in any case, the interaction between
anion dynamics and CO and OH dynamics might introduce further feedback loops or
alter the effect of existing ones and thus might lead to fundamentally different dynamic
instabilities, a point of view that had been completely neglected before the beginning of
this thesis.
The goal of this thesis was to study CO electrooxidation on Pt from a nonlinear dynamics
point of view, with special emphasis on the role of anion adsorption for the dynamic
instabilities. In particular, the following questions were addressed:
1) Can the above mentioned positive feedback loop in the dynamics of CO
electrooxidation be proven in independent experiments?
This seemed to be of particular importance, since the postulated feedback loop is of
chemical nature. This is in contrast to almost all oscillating electrochemical systems
whose dynamic instabilities were shown to be linked to a self-enhancing feedback loop
of the electrode potential. Thus, the autocatalytic cycle of these systems is of electrical
rather than chemical nature, leading to qualitatively different dynamic manifestations.
2) Does the interaction of anions with CO and OH adsorption lead to qualitatively
different behaviour or to so-far uncovered cooperative effects? This is a comprehensive
Chapter 1: Introduction 4
problem, which comprises several aspects, such as: What is the role of the surface
structure? Does the nature of the anion matter for the qualitative behaviour?
The first question obviously requires experiments with single crystals. To approach the
second one, experiments with anions with widely different adsorption strengths have to
be carried out. One aspect of all studies of CO electrooxidation is also to understand
under which conditions CO electrooxidation causes the least poisoning effect, and thus in
a fuel cell the least overpotential at the anode. Hence, in our context we would like to
deduce the relative concentrations of CO, OH and anions that support the most negative
electrode potentials at which CO is still oxidized. Here, conditions that have received
only little attention so far seem to be promising, namely, low concentrations of both, the
electrolyte and dissolved CO.
These questions are addressed in chapters 4-6 below and are preceded by a concise
introduction to those basic concepts of nonlinear dynamics and electrochemistry that are
essential for an understanding of the following chapters (chapter 2) and a description of
the experimental set-up and methods employed (chapter 3). In chapter 4, it is shown that
oscillations during CO electrooxidation can be induced by using a feedback control
scheme that changes the effective electrode capacitance, proving the existence of the
chemical positive feedback loop. Chapter 5 deals with CO electrooxidation in diluted
electrolytes and low CO bulk concentrations on single crystal electrodes. In section 5.1
surprisingly low, though transient, onset-potentials of CO electrooxidation are discussed.
Section 5.2 concentrates on stationary electrooxidation rates and discusses conditions
under which the potential that still supports steady reaction rates in the bistable region is
minimized. In chapter 6, CO electrooxidation is studied in concentrated supporting
electrolytes (0.5 M H2SO4 and 0.5 M HClO4) that contain small amounts of strongly
adsorbing anions, such as halides. It is shown that these anions introduce a further
feedback loop and thus alter the dynamics of the system qualitatively. The behaviour on
poly-crystalline Pt electrodes is compared with the one of the three low-indexed single
crystal surfaces. Chapter 7, finally, summarizes the main results and gives an outlook of
future challenges that have to be tackled to eventually have full control over the CO
electrooxidation reaction.
Chapter 2: Background 5
Chapter 2: Background
In this chapter, a brief introduction to electrochemistry, nonlinear dynamical systems,
nonlinear dynamics of electrochemical systems and CO electrooxidation on platinum is
given; hereby only those aspects are considered that form the basis of the following
chapters.
2.1 The electrochemical interface & electrochemistry
2.1.1 The electrochemical interface
One of the primary concerns of electrochemistry is how a charge transfer process takes
place across the electrode|electrolyte interface. The interface is the region in which
characteristic properties, most importantly the electrostatic potential, differ from their
values in the two bulk volume phases.
It is experimentally found that an electrode|electrolyte interface behaves like a capacitor
when no charge transfer across the interface takes place [65, 66]. The interface is the
region in which free net charge accumulates. The charges on the electrode represent an
excess or deficiency of electrons and reside in a thin layer of less than 0.1 Å. The charges
in the solution are made of an excess of either cations or anions near the electrode
surface. This interfacial region is called electrical double layer [67-70]. The solution side
of the double layer can be modelled as several parallel layers [71-73], which are shown
in Figure 2.1. The layer closest to the electrode contains solvent molecules and
specifically adsorbed species, which can be ions or neutral molecules.
Chapter 2: Background 6
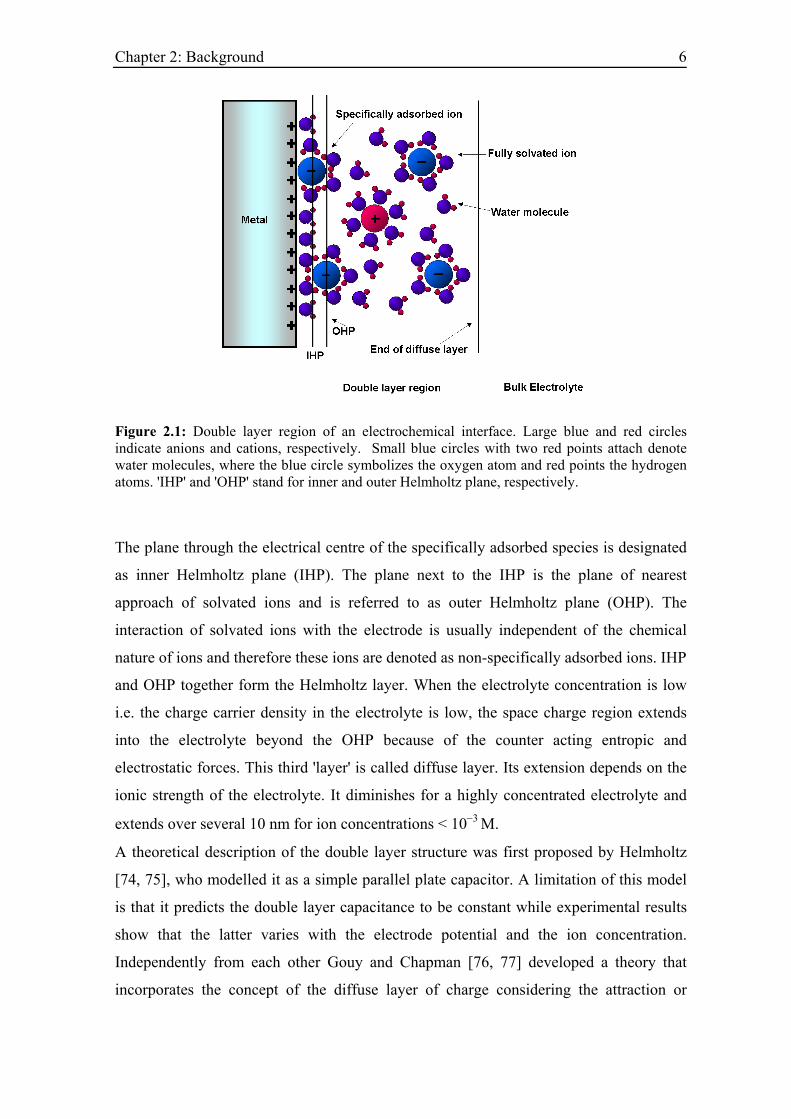
Figure 2.1: Double layer region of an electrochemical interface. Large blue and red circles indicate anions and cations, respectively. Small blue circles with two red points attach denote water molecules, where the blue circle symbolizes the oxygen atom and red points the hydrogen atoms. 'IHP' and 'OHP' stand for inner and outer Helmholtz plane, respectively.
The plane through the electrical centre of the specifically adsorbed species is designated
as inner Helmholtz plane (IHP). The plane next to the IHP is the plane of nearest
approach of solvated ions and is referred to as outer Helmholtz plane (OHP). The
interaction of solvated ions with the electrode is usually independent of the chemical
nature of ions and therefore these ions are denoted as non-specifically adsorbed ions. IHP
and OHP together form the Helmholtz layer. When the electrolyte concentration is low
i.e. the charge carrier density in the electrolyte is low, the space charge region extends
into the electrolyte beyond the OHP because of the counter acting entropic and
electrostatic forces. This third 'layer' is called diffuse layer. Its extension depends on the
ionic strength of the electrolyte. It diminishes for a highly concentrated electrolyte and
extends over several 10 nm for ion concentrations < 10−3 M.
A theoretical description of the double layer structure was first proposed by Helmholtz
[74, 75], who modelled it as a simple parallel plate capacitor. A limitation of this model
is that it predicts the double layer capacitance to be constant while experimental results
show that the latter varies with the electrode potential and the ion concentration.
Independently from each other Gouy and Chapman [76, 77] developed a theory that
incorporates the concept of the diffuse layer of charge considering the attraction or
Chapter 2: Background 7
repulsion of ions to or from the electrode (depending on their polarity) and
randomisation due to thermal motion. These considerations yield the Poisson Boltzmann
equation
2
0
iz ekT
i iir
e n z eφ
φε ε
−
∇ = − ∑ (2.1)
where φ is the electrostatic potential, e the electronic charge, k the Boltzmann constant, T
the absolute temperature, ni the bulk concentration of ith ion with charge number zi, ε0
the permittivity of the vacuum and εr the relative permittivity of the solution.
Considering a plane electrode and an electrolyte that consists of one anionic and one
cationic species with both charge number z, the potential distribution at a distance x from
the electrode (i.e. the solution of equation 2.1.) is given by
/
0
tanh( / 4 )tanh( / 4 )
xze kT eze kT
λφφ
−= (2.2)
where φ0 is the potential at x = 0 and λ is the characteristic thickness of the double layer
and is given by
1/ 2
022 ( )
r kTn ze
ε ελ
=
(2.3)
Whenever φ0 is sufficiently low, equation (2.2) reduces to an exponential form
0 exp( / )xφ φ λ= − (2.4)
The Gouy-Chapmann model - though correctly capturing the relation of double layer
capacitance with the concentration and φ - predicts an unlimited rise in differential
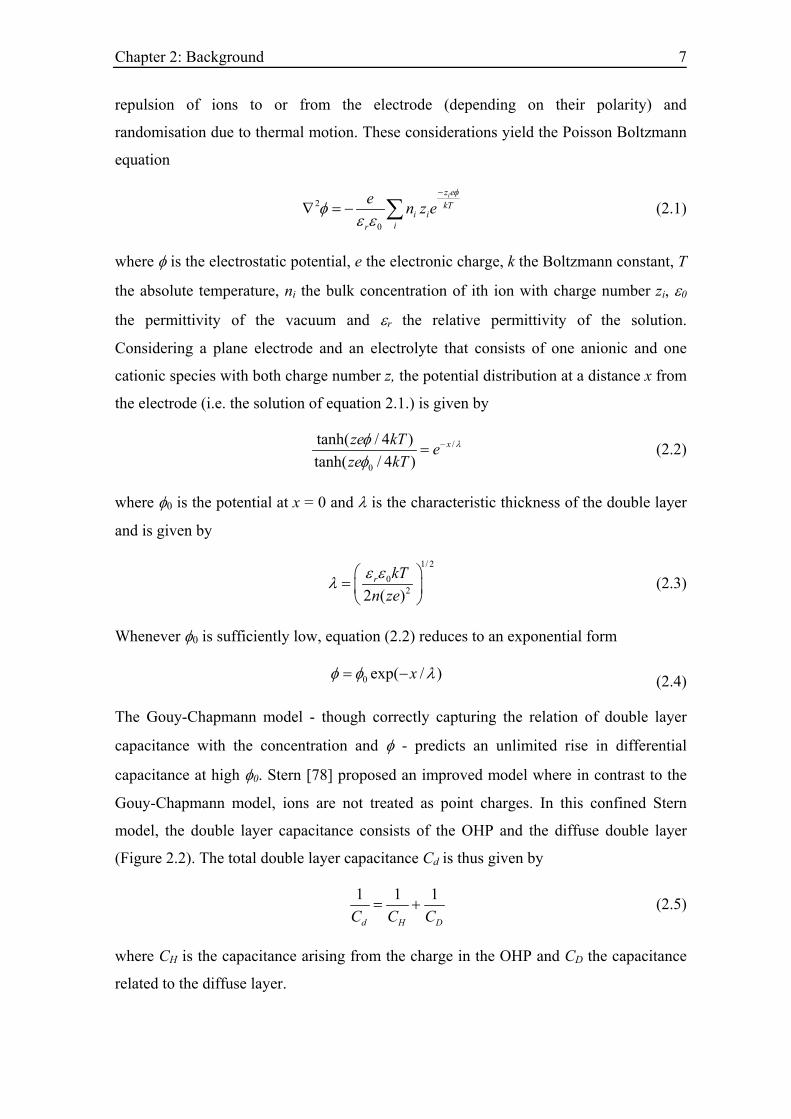
capacitance at high φ0. Stern [78] proposed an improved model where in contrast to the
Gouy-Chapmann model, ions are not treated as point charges. In this confined Stern
model, the double layer capacitance consists of the OHP and the diffuse double layer
(Figure 2.2). The total double layer capacitance Cd is thus given by
1 1 1
d HC C C= +
D
(2.5)
where CH is the capacitance arising from the charge in the OHP and CD the capacitance
related to the diffuse layer.
Chapter 2: Background 8
Figure 2.2: Double layer capacitance as a series network of Helmholtz and diffuse layer capacitance (top) and potential profile as a function of the distance from the electrode surface x, for a dilute electrolyte. φ2 is the potential at the outer Helmholtz plane (OHP) situated at x2.
2.1.2 Electrochemical reaction & reaction rate theory
In the following, the basic principle of an elementary reaction rate theory is presented,
which allows an easy understanding of the kinetics of electrochemical reactions.
Consider two substances A and B, which undergo the following elementary reactions
Af
b
k
kB (2.6)
where kf and kb are the forward and reverse rate constants, respectively. Then, the rates of
the reactions are given by
f fv k C= A B and v kb bC= (2.7)
where fν and bν are the forward and reverse reaction rates, respectively, and CA and CB
are the concentrations of species A and B. Therefore, the expression for the net reaction
rate netν , which is the difference between the forward and the reverse reaction rate, reads
net f A b Bv k C k C= − (2.8)
At equilibrium, the net reaction rate is zero, that is, the forward and the reverse reaction
rates are equal.
Experimentally, it is well established that the rate constant depends exponentially on the
temperature:
Chapter 2: Background 9
/AE RTk Ae−= (2.9)
where EA is the activation energy, A the frequency factor or pre-exponential term, R the
gas constant, and T the absolute temperature. The pre-exponential factor A and the
activation energy EA can be interpreted as the number of trials attempted on a reaction
and the probability for the reaction to occur, respectively. Equation (2.9) can also be
interpreted in the framework of the activated complex theory [79]. In this theory, the
reactant and the product occupy minima on the potential energy surface (PES), and the
reaction coordinate progresses along a complex favoured path on the PES. This energy
path contains an energy barrier that has to be crossed, which is called the activation
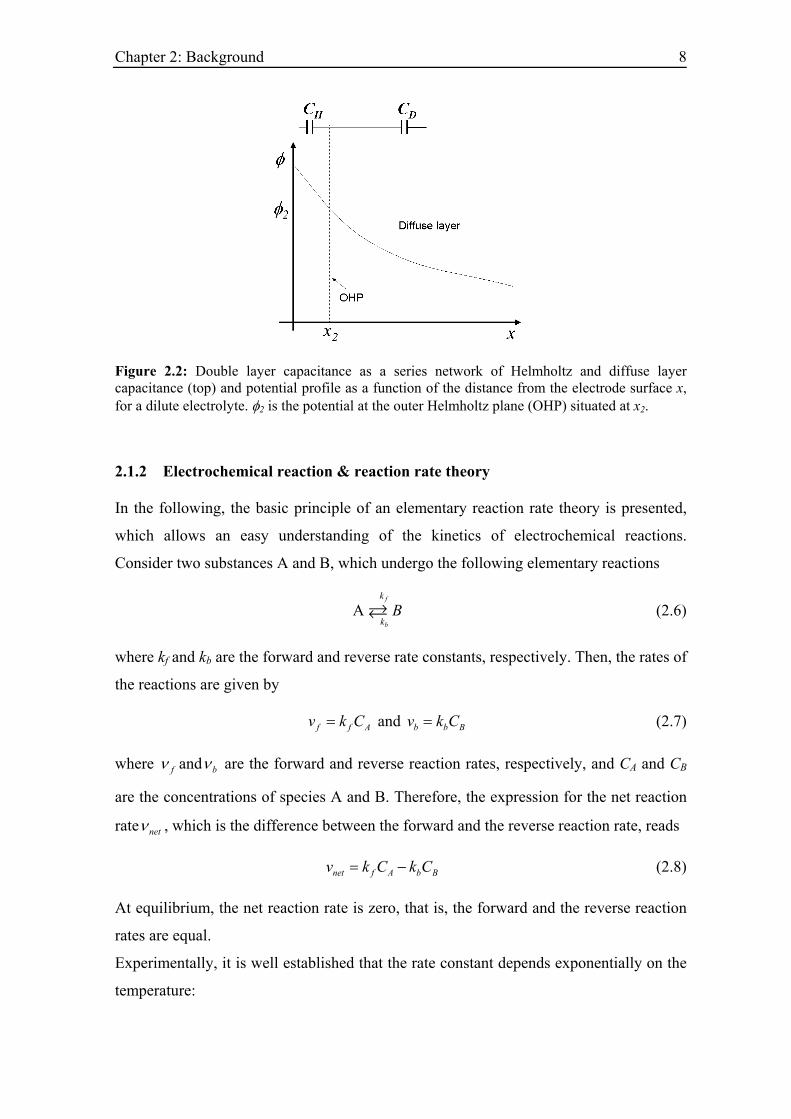
energy. A sketch of a 1D potential energy curve as a function of the reaction coordinate
is shown in Figure 2.3. The heights of the energy barriers measured from the energy
level of the reactant and product are called activation energy for the forward (EAF) and
backward (EAB) reaction, respectively.
Figure 2.3: Simplified schematic of a reaction path on a one dimensional potential energy surface illustrating the idea of the activated complex.
This idea of the theory of the activated complex is applicable to an electrochemical
reaction also. However, the PES becomes a function of the electrode potential [80].
Therefore, the activation energy changes with the applied voltage and the direction and
the rate of an electrode reaction can be altered by changing the sign or magnitude of the
applied voltage [65]. Consider a simple electron transfer reaction, where n electrons are
transferred to an oxidized species O.
O + e Rn → (2.10)
Chapter 2: Background 10
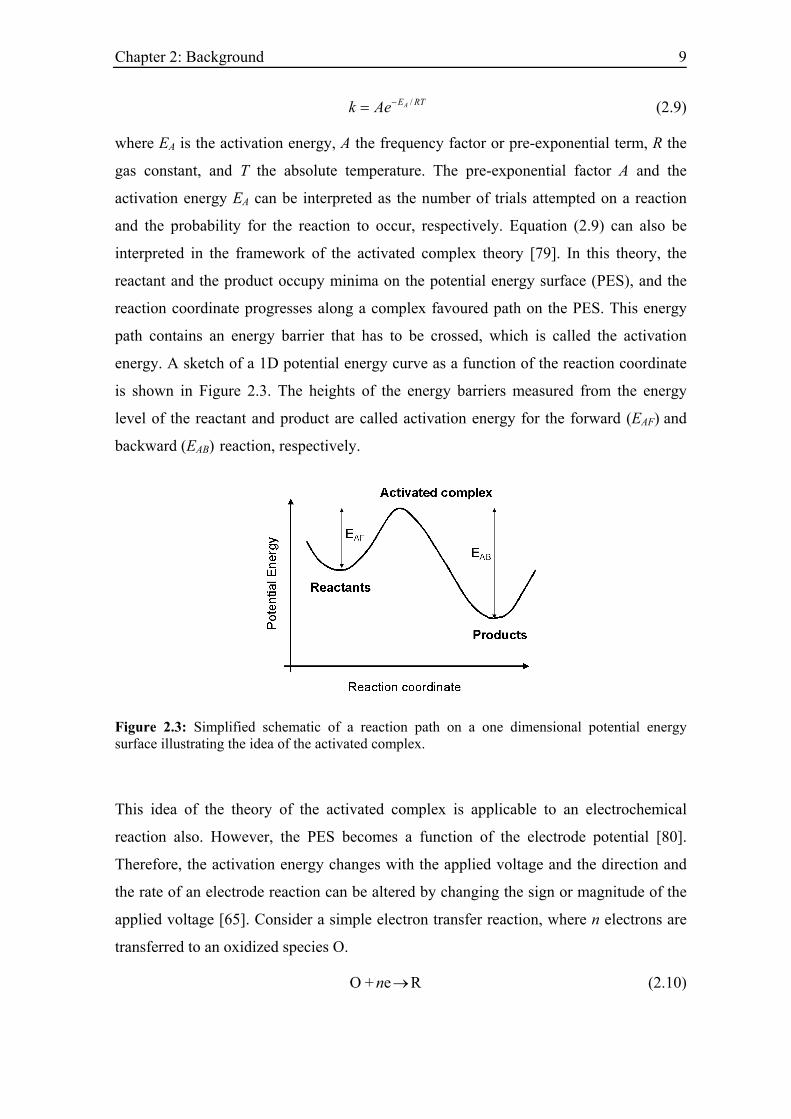
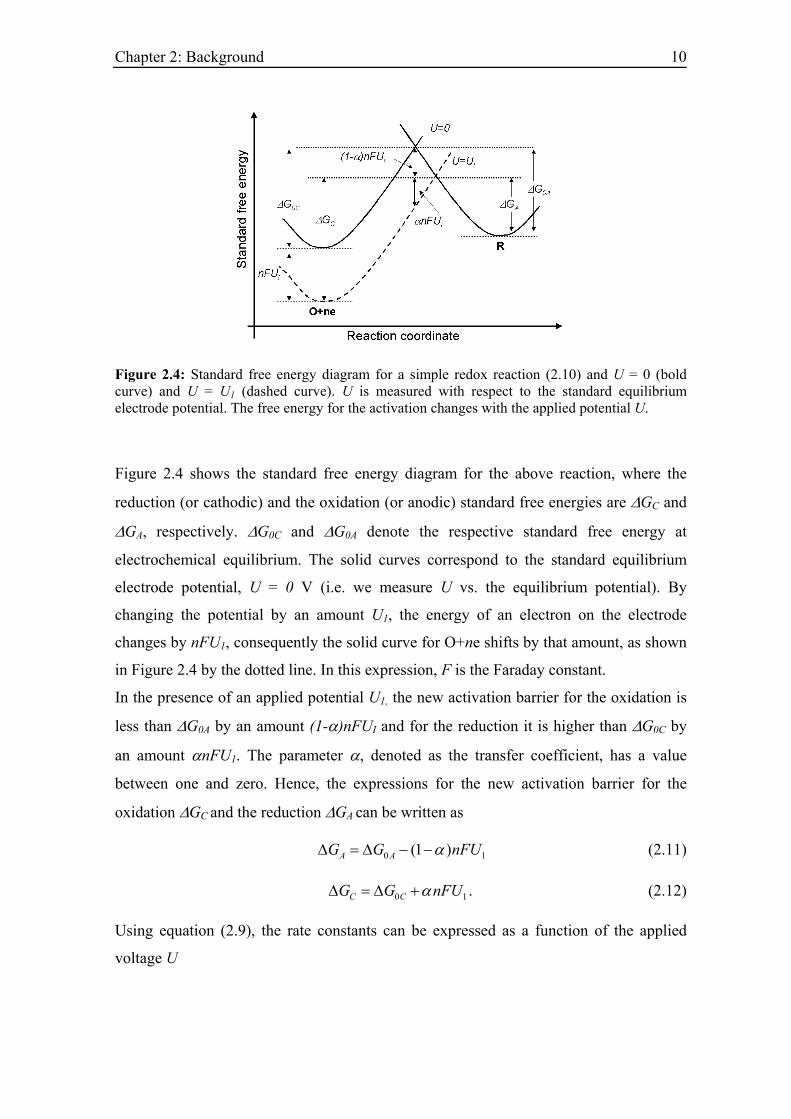
Figure 2.4: Standard free energy diagram for a simple redox reaction (2.10) and U = 0 (bold curve) and U = U1 (dashed curve). U is measured with respect to the standard equilibrium electrode potential. The free energy for the activation changes with the applied potential U.
Figure 2.4 shows the standard free energy diagram for the above reaction, where the
reduction (or cathodic) and the oxidation (or anodic) standard free energies are ∆GC and
∆GA, respectively. ∆G0C and ∆G0A denote the respective standard free energy at
electrochemical equilibrium. The solid curves correspond to the standard equilibrium
electrode potential, U = 0 V (i.e. we measure U vs. the equilibrium potential). By
changing the potential by an amount U1, the energy of an electron on the electrode
changes by nFU1, consequently the solid curve for O+ne shifts by that amount, as shown
in Figure 2.4 by the dotted line. In this expression, F is the Faraday constant.
In the presence of an applied potential U1, the new activation barrier for the oxidation is
less than ∆G0A by an amount (1-α)nFUI and for the reduction it is higher than ∆G0C by
an amount αnFU1. The parameter α, denoted as the transfer coefficient, has a value
between one and zero. Hence, the expressions for the new activation barrier for the
oxidation ∆GC and the reduction ∆GA can be written as
0 (1 )A AG G nF 1Uα∆ = ∆ − − (2.11)
0C CG G nF 1Uα∆ = ∆ + . (2.12)
Using equation (2.9), the rate constants can be expressed as a function of the applied
voltage U
Chapter 2: Background 11
0/ / /C CG RT G RT nFU RTf f fk A e A e e α−∆ −∆ −= = (2.13)
0 // (1 ) /AA G RTG RT nFU RTb b bk A e A e e α−∆−∆ −= = (2.14)
Here Af and Ab denote the pre-exponential factor of the forward and the backward
reaction, respectively. Now, when the interface is at equilibrium, we can write
O f R bC k C k= (2.15)
where the concentrations of ‘O’ and ‘R’ are denoted as CO and CR, respectively. For
equal concentrations CO = CR it follows
fk kb= (2.16)
or
0 0 0 0/ / / (1 ) /0
C AG RT nFU RT G RT nFU RTf bA e e A e e kα α−∆ − −∆ −= = (2.17)
The quantity k0 is known as a standard rate constant. Rewriting the rate constants in
terms of the standard rate constant
0( ) /0
nF U U RTfk k e α− −= (2.18)
0(1 ) ( ) /0
nF U U RTbk k e α− −= , (2.19)
the expression for the net current i for an electrode of effective area A is obtained:
0( ) / (1 ) ( ) /0[ ]nF U U RT nF U U RT
O Ri nAFk C e C eα α− − − −= − 0 (2.20)
2.1.3 Forced convection: The rotating electrode
An electro-catalytic surface reaction involves a convective or diffusive transport of the
reactants and the products. If the mass transport rate is comparable to or slower than the
rate of the surface reactions, the electrode kinetic is not rate determining, what is under
most circumstances undesirable. A slow mass transfer can be enhanced by using a forced
convection method. In a forced convection system, either the electrode moves with
respect to the solution (rotating or vibrating electrode) or the electrolyte flows over the
electrode, e.g., by employing an external pump. The advantages of a controlled
convective mass transport method are that
(a) a steady state is attained quickly and high precision measurements are possible;
Chapter 2: Background 12
(b) the rate of the mass transfer to the electrode can be altered by changing a control
parameter such as the flow rate or the rotation rate of the electrode; and
(c) known and reproducible mass transfer conditions are easily achievable, which is
difficult otherwise.
Among the various forced convection systems, the rotating disk electrode (RDE) is
widely used. It is easy to manufacture and for steady state conditions the Navier-Stokes
equation can be solved analytically to predict the fluid dynamics near the electrode.
Usually an RDE is cylindrical in shape, made of a chemically inert material, such as
PTFE, and the working electrode is embedded in that inert material. The electrode is
connected to a controlled stepper motor through a metal shaft and a brush contact is used
to make the electrical connection. The rotation rate of the motor is a control parameter
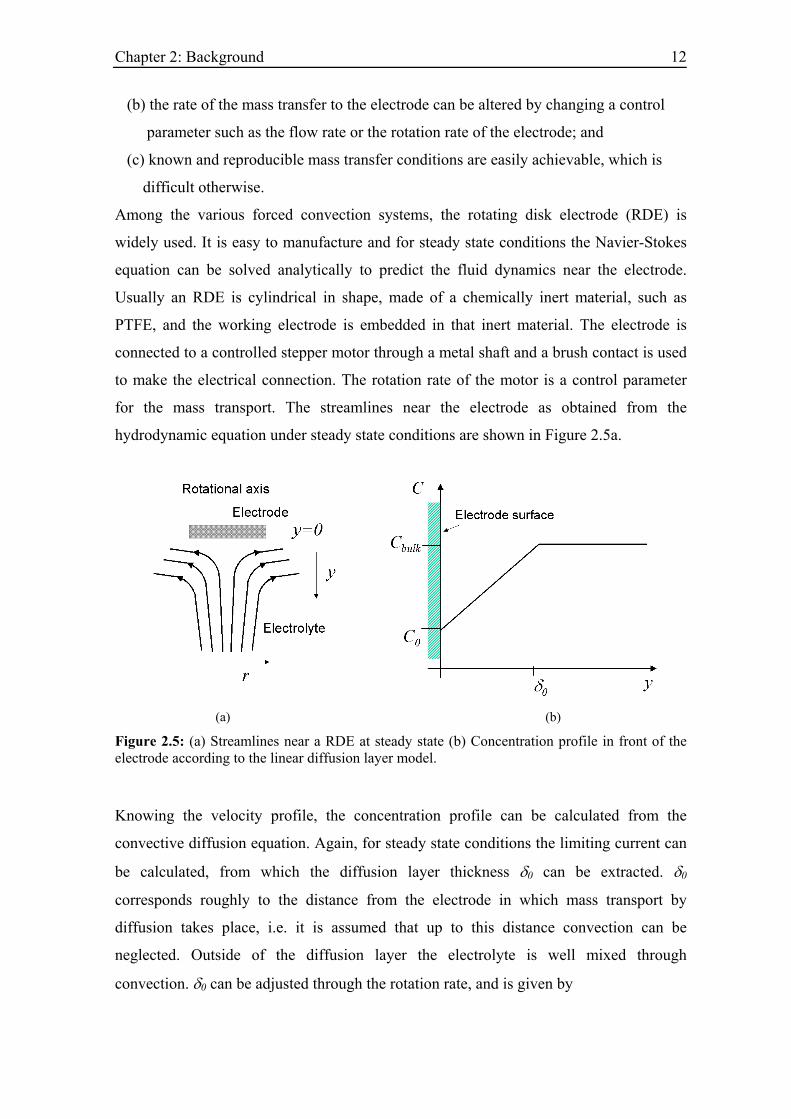
for the mass transport. The streamlines near the electrode as obtained from the
hydrodynamic equation under steady state conditions are shown in Figure 2.5a.
(a) (b)
Figure 2.5: (a) Streamlines near a RDE at steady state (b) Concentration profile in front of the electrode according to the linear diffusion layer model.
Knowing the velocity profile, the concentration profile can be calculated from the
convective diffusion equation. Again, for steady state conditions the limiting current can
be calculated, from which the diffusion layer thickness δ0 can be extracted. δ0
corresponds roughly to the distance from the electrode in which mass transport by
diffusion takes place, i.e. it is assumed that up to this distance convection can be
neglected. Outside of the diffusion layer the electrolyte is well mixed through
convection. δ0 can be adjusted through the rotation rate, and is given by

Chapter 2: Background 13
1/ 3 1/ 2 1/ 60 1.61D vδ ω−= (2.21)
where D is the diffusion coefficient of the reacting species in the electrolyte, ω the
angular frequency of the rotor, and ν the kinematic viscosity of the electrolyte.
The linear diffusion layer model assumes that the concentration is equal to the bulk
concentration up to a distance δ0 and varies linearly between δ0 and the electrode surface,
where the concentration c0 at the electrode surface adjusts according to the reaction rate
and mass transport (Figure 2.5b). Here cbulk is the concentration of the species in the
bulk. Assuming further that δ0 is constant, the temporal change of c0 can be obtained [81,
82] as illustrated in Figure 2.6 . The dashed line indicates the concentration profile at a
time t and the solid line indicates the profile at a time t+dt. The shaded area is equal to
the difference between the amount of matter that diffuses towards the electrode surface
and the amount of matter that reacts at the surface in dt. Hence,
00 0 0 0
0
( )1 [ ( ) ( )] ( )2
bulkr
D c cc t dt c t dt k c t dtδδ
−+ − = − (2.22)
Therefore, within the linear diffusion layer approximation the temporal evolution of c0 is
governed by
0 020 0
2 ( ) 2bulk rdc D c c k cdt
0
δ δ−
= − (2.23)
Figure 2.6: Schematic illustrating the temporal changes of c0 with the linear diffusion layer model for a RDE.
Chapter 2: Background 14
2.2 Nonlinear dynamics
2.2.1 Dynamical system
In this work, we denote by the term dynamical system a continuous system that evolves
in time. The state of the system is described by a state vector X whose components are
the phase space variables such that
nX ∈
and the evolution law is given by,
( , )X f X α= with α ∈ (2.24)
where α is a parameter and the function f is
: n nf →
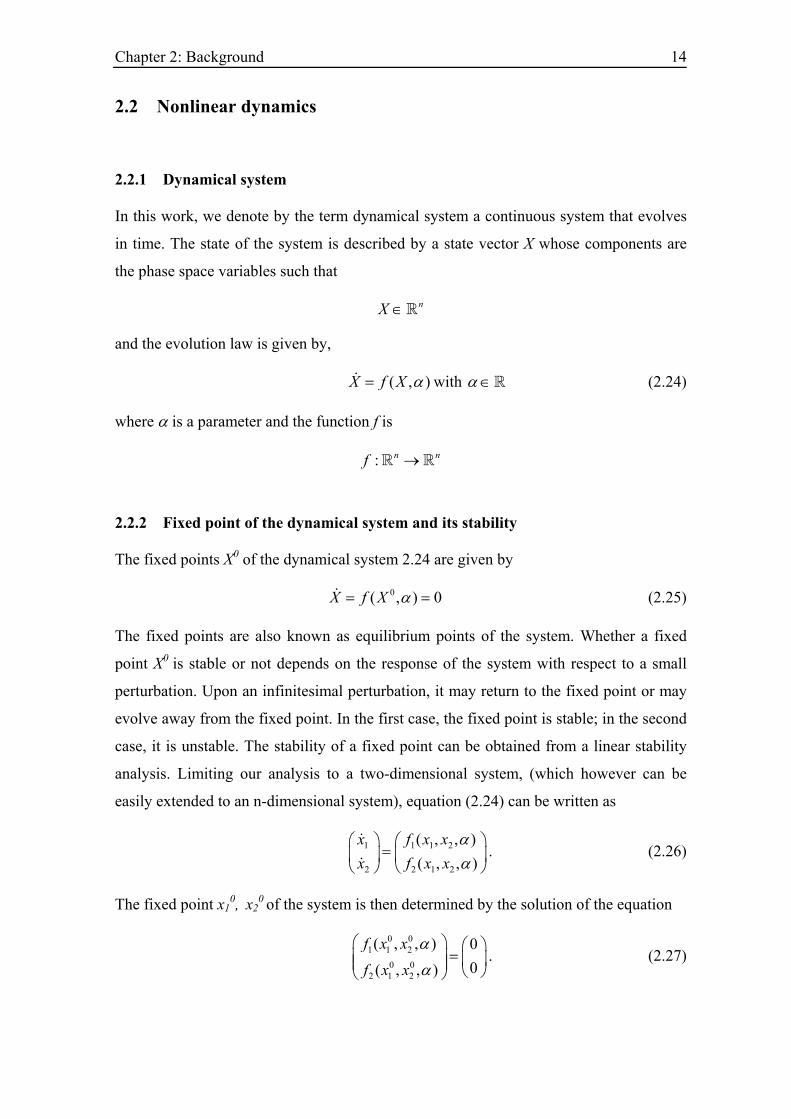
2.2.2 Fixed point of the dynamical system and its stability
The fixed points X0 of the dynamical system 2.24 are given by
0( , )X f X α 0= = (2.25)
The fixed points are also known as equilibrium points of the system. Whether a fixed
point X0 is stable or not depends on the response of the system with respect to a small
perturbation. Upon an infinitesimal perturbation, it may return to the fixed point or may
evolve away from the fixed point. In the first case, the fixed point is stable; in the second
case, it is unstable. The stability of a fixed point can be obtained from a linear stability
analysis. Limiting our analysis to a two-dimensional system, (which however can be
easily extended to an n-dimensional system), equation (2.24) can be written as
1 1 1 2
2 2 1 2
( , , )( , , )
x f x xx f x x
αα
=
. (2.26)
The fixed point x10, x2
0 of the system is then determined by the solution of the equation
0 01 1 2
0 02 1 2
( , , ) 00( , , )
f x x
f x x
α
α
=
. (2.27)
Chapter 2: Background 15
Expanding the function ( , )f X α in a Taylor series around 01 2, 0x x , the temporal evolution
of a small perturbation h = X-X0 can be expressed as
0 0
0 0 1 11 1 1 2 1 2
1 2
( , , ) .X X
f fh f x x h h
x xα
∂ ∂.= + +
∂ ∂+ higher order terms (2.28)
and
0 0
0 0 2 22 2 1 2 1 2
1 2
( , , ) .X X
f fh f x x h h
x xα
∂ ∂.= + +
∂ ∂+ higher order terms (2.29)
where the partial derivatives are evaluated at the fixed point.
Neglecting the higher order terms in equations (2.28, 2.29), we can write
1 1
1 1 2
2 2 22
1 2
f fh x x h1
f f hhx x
∂ ∂ ∂ ∂ = ∂ ∂ ∂ ∂
(2.30)
or
1
22
h hhh
= J 1 (2.31)
where J is the Jacobi matrix. These linear equations admit solutions of the form
teµ=h v (2.32)
and we arrive at the Eigenvalue problem,
[ ] 0µ− =J I ν (2.33)
where I is the identity matrix. For a nontrivial solution, it is necessary that
det( ) 0µ− =J I (2.34)
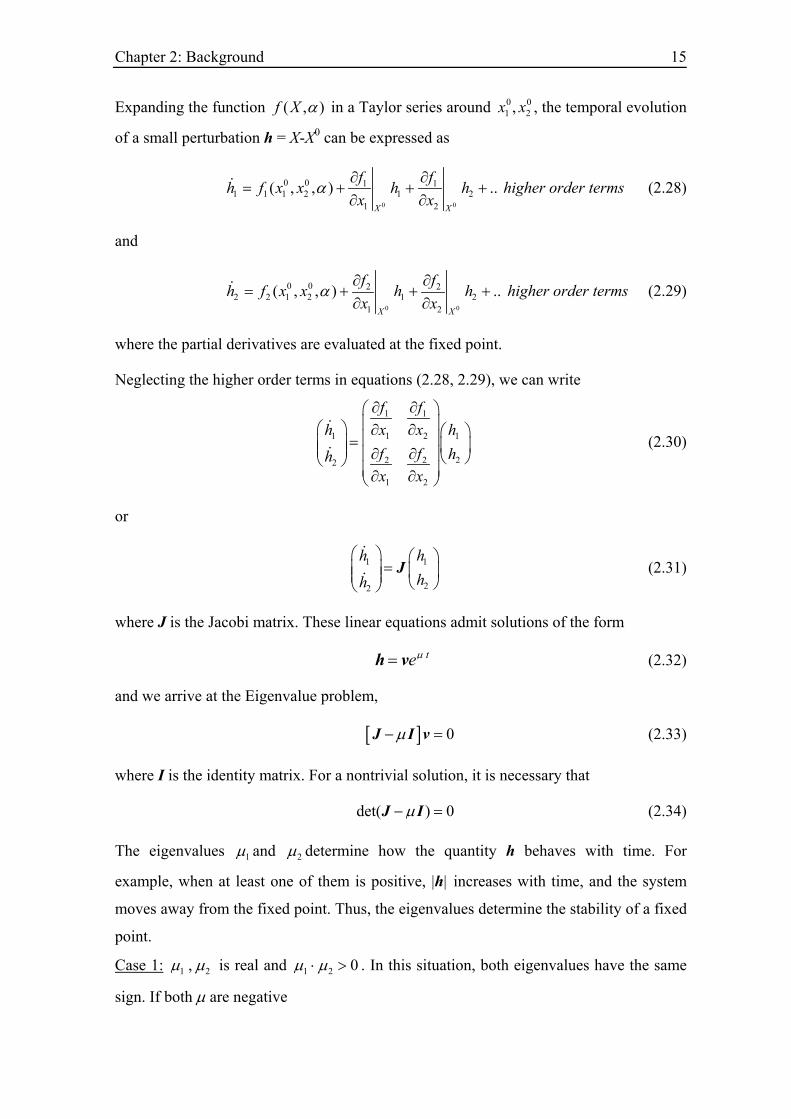
The eigenvalues 1µ and 2µ determine how the quantity h behaves with time. For
example, when at least one of them is positive, |h| increases with time, and the system
moves away from the fixed point. Thus, the eigenvalues determine the stability of a fixed
point.
Case 1: 1 2,µ µ is real and 1 2 0µ µ⋅ > . In this situation, both eigenvalues have the same
sign. If both µ are negative
Chapter 2: Background 16
0i t
tlim eµ
→∞=
Thus, |h| decreases with time and the fixed point is stable. In this case, the fixed point is
known as a stable node. If they are both positive
i t
tlim eµ
→∞= ∞
Thus, |h| increases with time and the fixed point is unstable. The fixed point is known as
an unstable node.
Case 2: 1 2,µ µ is real and 1 2 0µ µ⋅ < . In this situation, the eigenvalues have opposite
signs. The fixed point is unstable and is called a saddle point.
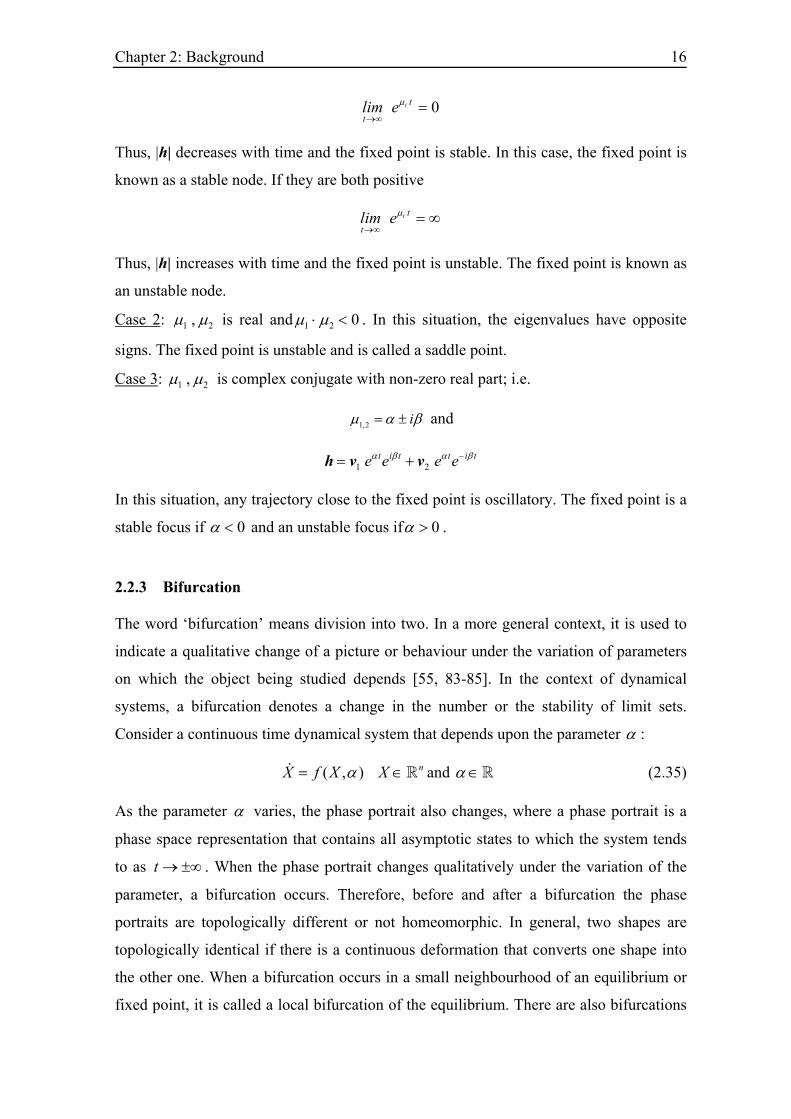
Case 3: 1 2,µ µ is complex conjugate with non-zero real part; i.e.
1,2 iµ α β= ± and
1 2t i t t i te e e eα β α −= +h ν ν β
In this situation, any trajectory close to the fixed point is oscillatory. The fixed point is a
stable focus if 0α < and an unstable focus if 0α > .
2.2.3 Bifurcation
The word ‘bifurcation’ means division into two. In a more general context, it is used to
indicate a qualitative change of a picture or behaviour under the variation of parameters
on which the object being studied depends [55, 83-85]. In the context of dynamical
systems, a bifurcation denotes a change in the number or the stability of limit sets.
Consider a continuous time dynamical system that depends upon the parameter α :
( , )X f X α= nX ∈ and α ∈ (2.35)
As the parameter α varies, the phase portrait also changes, where a phase portrait is a
phase space representation that contains all asymptotic states to which the system tends
to as t . When the phase portrait changes qualitatively under the variation of the
parameter, a bifurcation occurs. Therefore, before and after a bifurcation the phase
portraits are topologically different or not homeomorphic. In general, two shapes are
topologically identical if there is a continuous deformation that converts one shape into
the other one. When a bifurcation occurs in a small neighbourhood of an equilibrium or
fixed point, it is called a local bifurcation of the equilibrium. There are also bifurcations
→ ±∞
Chapter 2: Background 17
that cannot be detected by looking only at a small neighbourhood of an equilibrium; such
a bifurcation is called a global bifurcation [86]. It is associated with a global
configuration change in phase space. Generally, in a two dimensional system the
following bifurcations may occur:
1) a saddle node bifurcation of fixed points
2) a Hopf bifurcation
3) a saddle loop bifurcation
4) a saddle node bifurcation of limit cycles
5) a saddle node bifurcation with infinite period.
The first two kinds are local bifurcations; which implies that they can be detected with a
linear stability analysis around a fixed point. The remaining ones are the global
bifurcations, and more sophisticated methods are required for their detection.
2.2.4 Saddle node bifurcation
In the case of a saddle node bifurcation, two stationary states, a saddle point and a node
merge at the bifurcation point. This degenerate saddle-node pair disappears when the
parameter is changed in one direction and two fixed points separate when the parameter
changes in the other direction. Thus, in a saddle node bifurcation, a pair of fixed points is
created or destroyed. A saddle node bifurcation occurs when one eigenvalue of the
Jacobi matrix J becomes zero, which implies that the determinant of the linear
eigenvalue problem is zero.
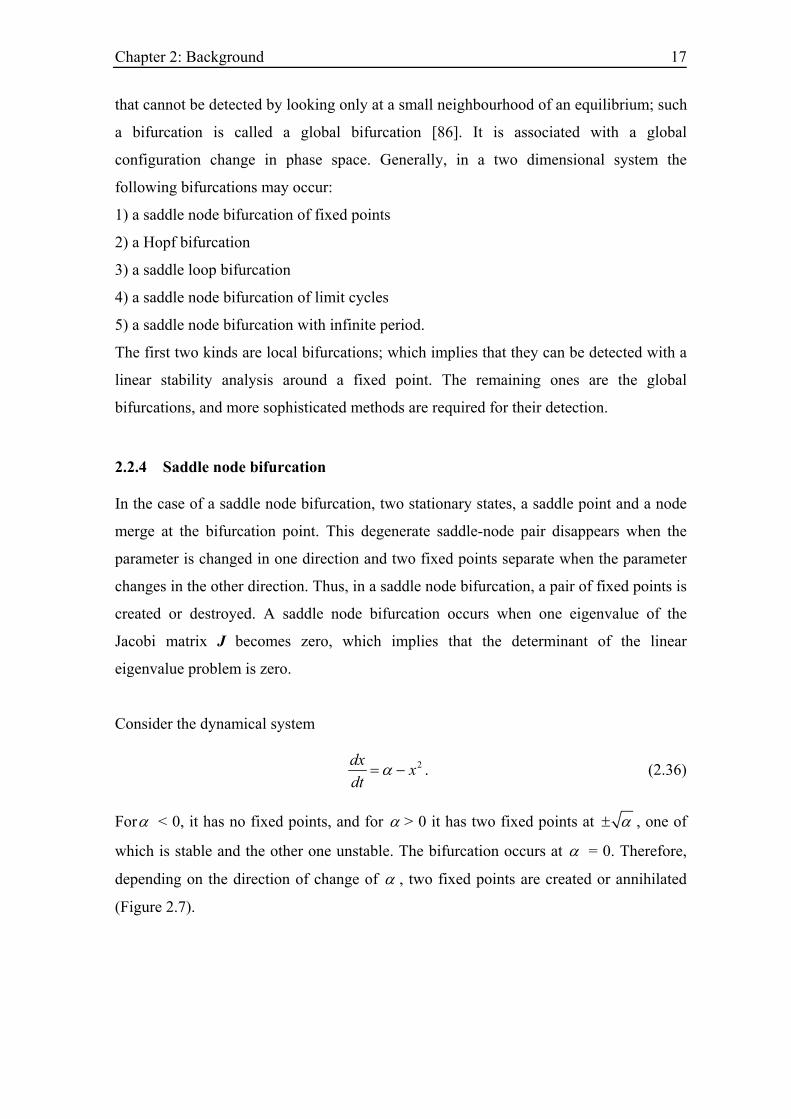
Consider the dynamical system
2dx xdt
α= − . (2.36)
Forα < 0, it has no fixed points, and for α > 0 it has two fixed points at α± , one of
which is stable and the other one unstable. The bifurcation occurs at α = 0. Therefore,
depending on the direction of change of α , two fixed points are created or annihilated
(Figure 2.7).
Chapter 2: Background 18
Figure 2.7: A simple example of a saddle node bifurcation. The green and red dot indicates a stable and an unstable fixed point, respectively.
2.2.5 Hopf bifurcation
In a Hopf bifurcation a limit cycle is born or destroyed. The Hopf bifurcation can be
conveniently detected in a linear stability analysis of fixed points [55, 87, 88]. It occurs
when the eigenvalues of a linearized system become purely imaginary: 1,2 iµ β= ± and
0Re ( ) 0ddµ αα
≠ (2.37)
where α is the parameter value at which 0Re ( ) 0µ α = . At 0α α= the fixed point changes
its stability and the Hopf theorem guarantees that a limit cycle is born with zero
amplitude and a period
02T πβ
= (2.38)
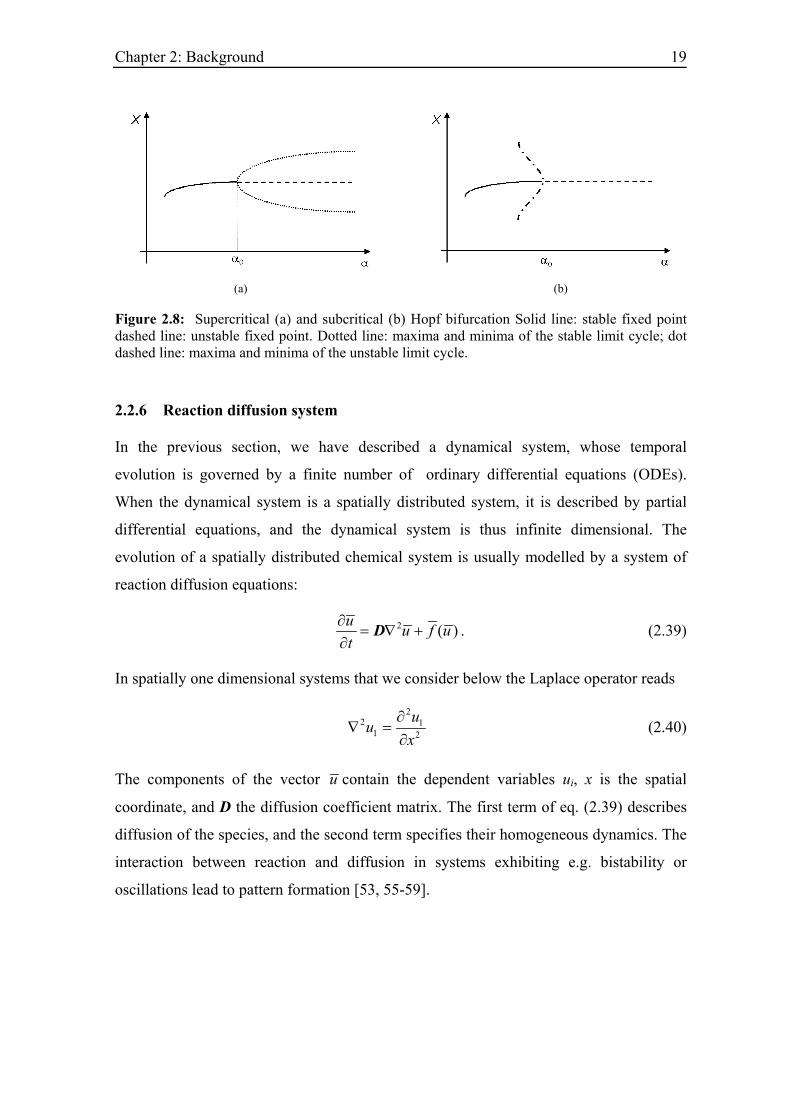
There are two types of Hopf bifurcations, so-called supercritical and subcritical Hopf
bifurcations, which are shown in Figure 2.8. In a supercritical Hopf bifurcation, the limit
cycle is stable and exists at parameter values at which the fixed point is unstable. In case
of a subcritical bifurcation, the limit cycle is unstable and coexists with the stable
equilibrium point.
Chapter 2: Background 19
(a) (b)
Figure 2.8: Supercritical (a) and subcritical (b) Hopf bifurcation Solid line: stable fixed point dashed line: unstable fixed point. Dotted line: maxima and minima of the stable limit cycle; dot dashed line: maxima and minima of the unstable limit cycle.
2.2.6 Reaction diffusion system
In the previous section, we have described a dynamical system, whose temporal
evolution is governed by a finite number of ordinary differential equations (ODEs).
When the dynamical system is a spatially distributed system, it is described by partial
differential equations, and the dynamical system is thus infinite dimensional. The
evolution of a spatially distributed chemical system is usually modelled by a system of
reaction diffusion equations:
2 ( )u u f ut
∂= ∇ +
∂D . (2.39)
In spatially one dimensional systems that we consider below the Laplace operator reads
2
2 11 2
uux
∂∇ =
∂ (2.40)
The components of the vector u contain the dependent variables ui, x is the spatial
coordinate, and D the diffusion coefficient matrix. The first term of eq. (2.39) describes
diffusion of the species, and the second term specifies their homogeneous dynamics. The
interaction between reaction and diffusion in systems exhibiting e.g. bistability or
oscillations lead to pattern formation [53, 55-59].
Chapter 2: Background 20
2.3 Nonlinear dynamics of the electrochemical interface
2.3.1 Bistability in an electrochemical system
A bistable system can exist in two different stable states for identical experimental
conditions. These stable states can be fixed points, limit cycles, or limit cycles with fixed
point etc [52, 89]. They are stable under sufficiently small perturbations, but a stronger
perturbation may cause a transition between the states. One component is sufficient to
exhibit bistability. A positive feedback is a necessary condition for bistability to occur.
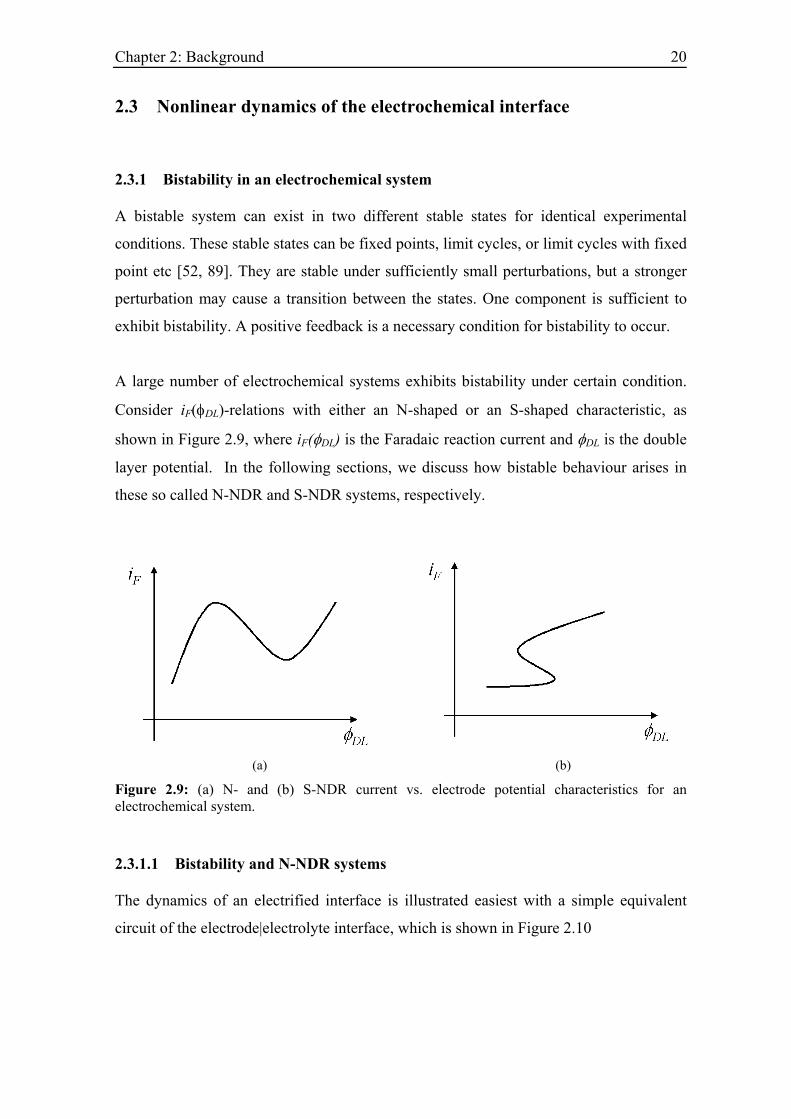
A large number of electrochemical systems exhibits bistability under certain condition.
Consider iF(φDL)-relations with either an N-shaped or an S-shaped characteristic, as
shown in Figure 2.9, where iF(φDL) is the Faradaic reaction current and φDL is the double
layer potential. In the following sections, we discuss how bistable behaviour arises in
these so called N-NDR and S-NDR systems, respectively.
(a) (b)
Figure 2.9: (a) N- and (b) S-NDR current vs. electrode potential characteristics for an electrochemical system.
2.3.1.1 Bistability and N-NDR systems
The dynamics of an electrified interface is illustrated easiest with a simple equivalent
circuit of the electrode|electrolyte interface, which is shown in Figure 2.10
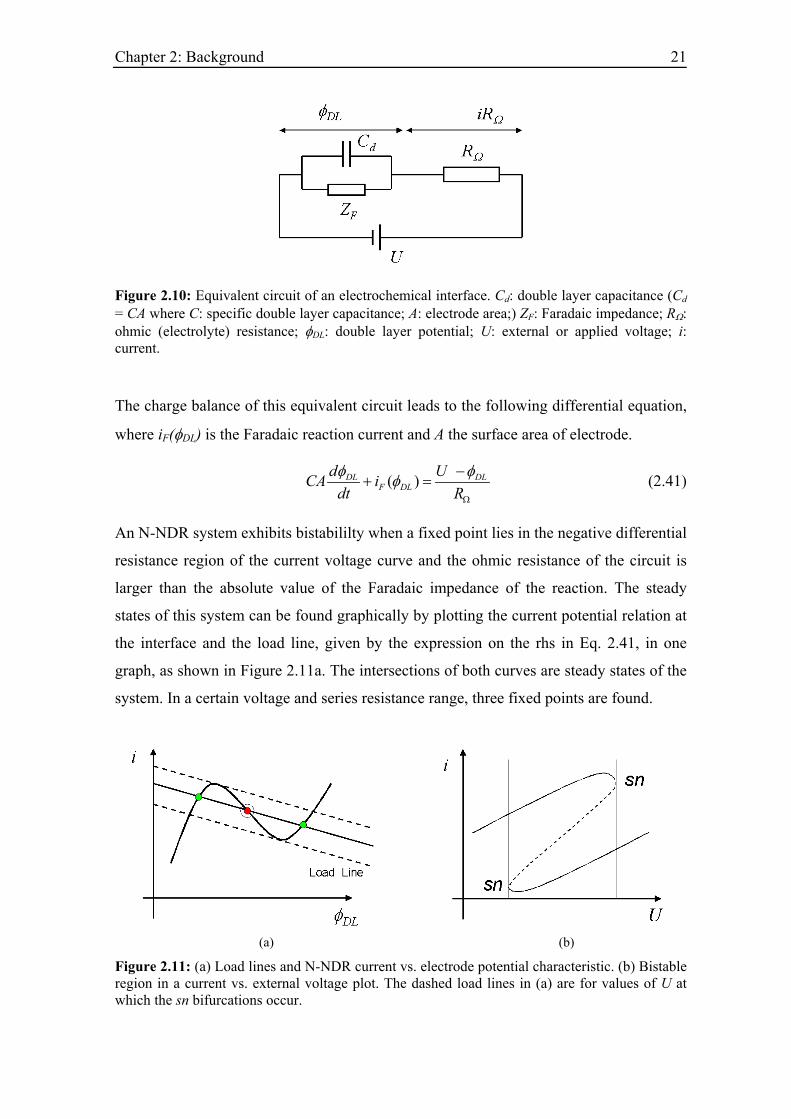
Chapter 2: Background 21
Figure 2.10: Equivalent circuit of an electrochemical interface. Cd: double layer capacitance (Cd = CA where C: specific double layer capacitance; A: electrode area;) ZF: Faradaic impedance; RΩ: ohmic (electrolyte) resistance; φDL: double layer potential; U: external or applied voltage; i: current.
The charge balance of this equivalent circuit leads to the following differential equation,
where iF(φDL) is the Faradaic reaction current and A the surface area of electrode.
( )DLF DL
d UCA idt R
DLφ φφΩ
−+ = (2.41)
An N-NDR system exhibits bistabililty when a fixed point lies in the negative differential
resistance region of the current voltage curve and the ohmic resistance of the circuit is
larger than the absolute value of the Faradaic impedance of the reaction. The steady
states of this system can be found graphically by plotting the current potential relation at
the interface and the load line, given by the expression on the rhs in Eq. 2.41, in one
graph, as shown in Figure 2.11a. The intersections of both curves are steady states of the
system. In a certain voltage and series resistance range, three fixed points are found.
(a) (b)
Figure 2.11: (a) Load lines and N-NDR current vs. electrode potential characteristic. (b) Bistable region in a current vs. external voltage plot. The dashed load lines in (a) are for values of U at which the sn bifurcations occur.

Chapter 2: Background 22
The two outer fixed points are stable and the middle one is unstable. Figure 2.11b shows
the bistable region in a U-i plot. The origin of the bistability can be easily seen when one
assumes that the system is operated galvanostatically, i.e. the current is kept constant.
Consider a fixed point on the middle (unstable) branch of the iF- DLφ characteristic. If DLφ
increases slightly due to a perturbation, the current decreases and consequently DLφ
increases further. This increase of DLφ continues until the system reaches the outer branch
of the N. The argumentation is exactly the same in case of the potentiostatic mode if the
ohmic series resistance is sufficiently large. Thus, the parameters U and RΩ determine the
bistable region.
2.3.1.2 Bistability and S-NDR systems
The stationary current voltage curve of an S-NDR system shows a bistability in the iF -
DLφ curve in a potentiostatic experiment with a vanishing ohmic resistance. The
existence of the bistability in the iF- DLφ characteristic, where DLφ takes on the role of a
parameter, indicates the presence of an autocatalytic chemical variable, on which the
current depends. Thus, in an S-NDR system the dynamic equations contain a chemical
autocatalytic loop [61, 90]. Electrochemical systems belonging to the class of S-NDR
systems are complementary in most dynamic properties to N-NDR systems. S-shaped
current-potential characteristics may arise in systems with a potential-dependent surface
phase transitions between a disordered (dilute) and an ordered (condensed) adsorption
state [91] or due to attractive interactions among the adsorbed molecules. They are
characterized by
(a) an S-shaped current potential characteristic of the interface. As discussed before, this
characteristic exhibits bistability;
the unstable branch or the middle, sandwiched branch is unstable and cannot be detected
in a potentiostatic experiment; and
(b) the current voltage characteristic becomes single-valued if an ohmic series resistance
is present in the system and exceeds a critical value.
Chapter 2: Background 23
2.3.2 Oscillations and electrochemical systems
From a more physical point of view, oscillations often emerge owing to the interaction of
a positive and a negative feedback loop between two variables of the system. The
positive feedback loop acts destabilizing, the negative one stabilizing [49, 57].
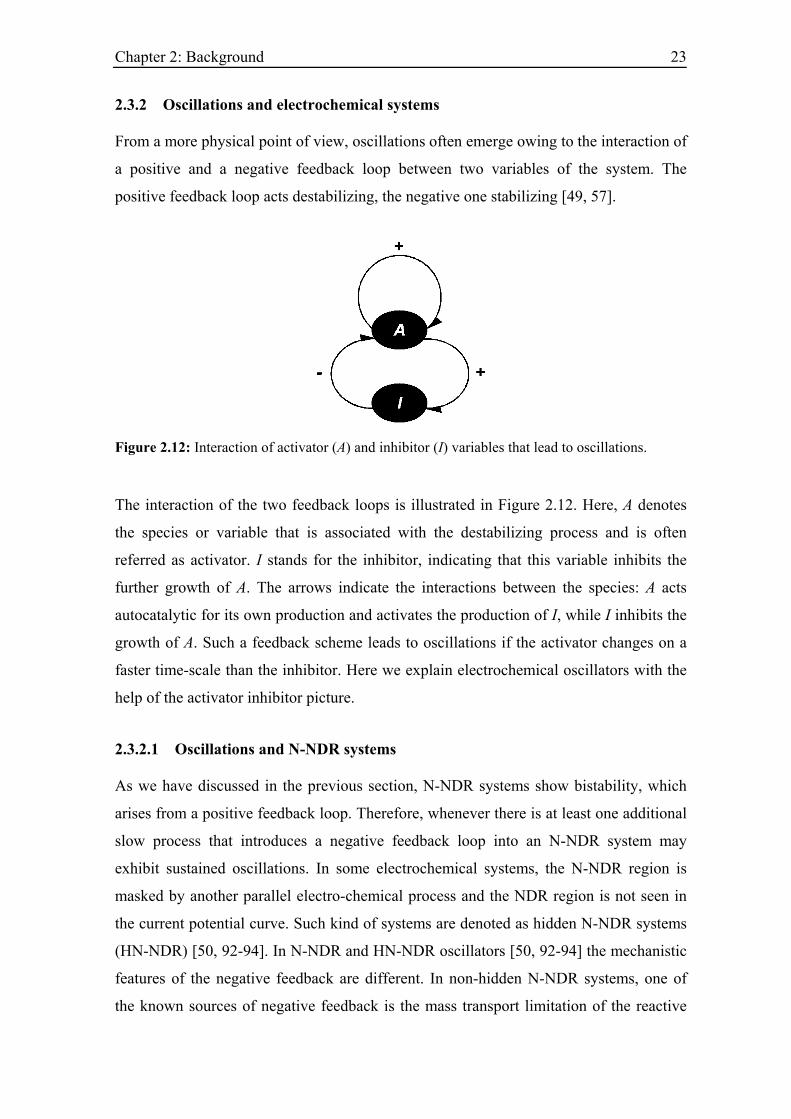
Figure 2.12: Interaction of activator (A) and inhibitor (I) variables that lead to oscillations.
The interaction of the two feedback loops is illustrated in Figure 2.12. Here, A denotes
the species or variable that is associated with the destabilizing process and is often
referred as activator. I stands for the inhibitor, indicating that this variable inhibits the
further growth of A. The arrows indicate the interactions between the species: A acts
autocatalytic for its own production and activates the production of I, while I inhibits the
growth of A. Such a feedback scheme leads to oscillations if the activator changes on a
faster time-scale than the inhibitor. Here we explain electrochemical oscillators with the
help of the activator inhibitor picture.
2.3.2.1 Oscillations and N-NDR systems
As we have discussed in the previous section, N-NDR systems show bistability, which
arises from a positive feedback loop. Therefore, whenever there is at least one additional
slow process that introduces a negative feedback loop into an N-NDR system may
exhibit sustained oscillations. In some electrochemical systems, the N-NDR region is
masked by another parallel electro-chemical process and the NDR region is not seen in
the current potential curve. Such kind of systems are denoted as hidden N-NDR systems
(HN-NDR) [50, 92-94]. In N-NDR and HN-NDR oscillators [50, 92-94] the mechanistic
features of the negative feedback are different. In non-hidden N-NDR systems, one of
the known sources of negative feedback is the mass transport limitation of the reactive
Chapter 2: Background 24
species, which is governed by equation (2.21). The negative feedback is easily seen: If
DLφ increases, the current decreases and, thus, the consumption of the reactive species is
reduced and the mass transfer replenishes its concentration in front of the electrode.
However, as the concentration in the vicinity of the electrode increases, the current
increases, which prompts a decrease in DLφ .
In HN-NDR systems, the most common mechanism, which masks the N-NDR
behaviour, is the adsorption of a species, which inhibits the main Faradaic reactions. If
the isotherm of the poisoning species is such that its coverage decreases with the
increasing DLφ around the N-NDR region, it introduces a negative feedback into the
system. Thus, the system again possesses a stabilizing and destabilizing loop that causes
oscillations: An initial increase in DLφ leads to a decrease in current because of the N-
NDR characteristics. This is because the coverage reacts upon a change in DLφ much
more slowly than the electron transfer process.
Under an external control, i.s. under potentiostatic control and a sufficiently high series
resistance or under galvanostatic control, the decrease in current prompts a further
increase of DLφ and establishes a positive feedback loop. Again, increasing DLφ causes a
decrease in the coverage of the poisoning species, which in turn leads to an increase in
current since more surface becomes available for the current carrying reaction, which
establishes the negative feedback loop. Therefore, the system can oscillate under both
potentiostatic and galvanostatic control, which is the essential difference to an N-NDR
system, which only oscillates under potentiostatic condition and moderate electrolyte
(ohmic) resistance.
2.3.2.2 Oscillations and S-NDR systems
As already said, an S-NDR system has a chemical autocatalysis and the electrode
potential may behave as a negative feedback variable. Thus, also in an S-NDR system
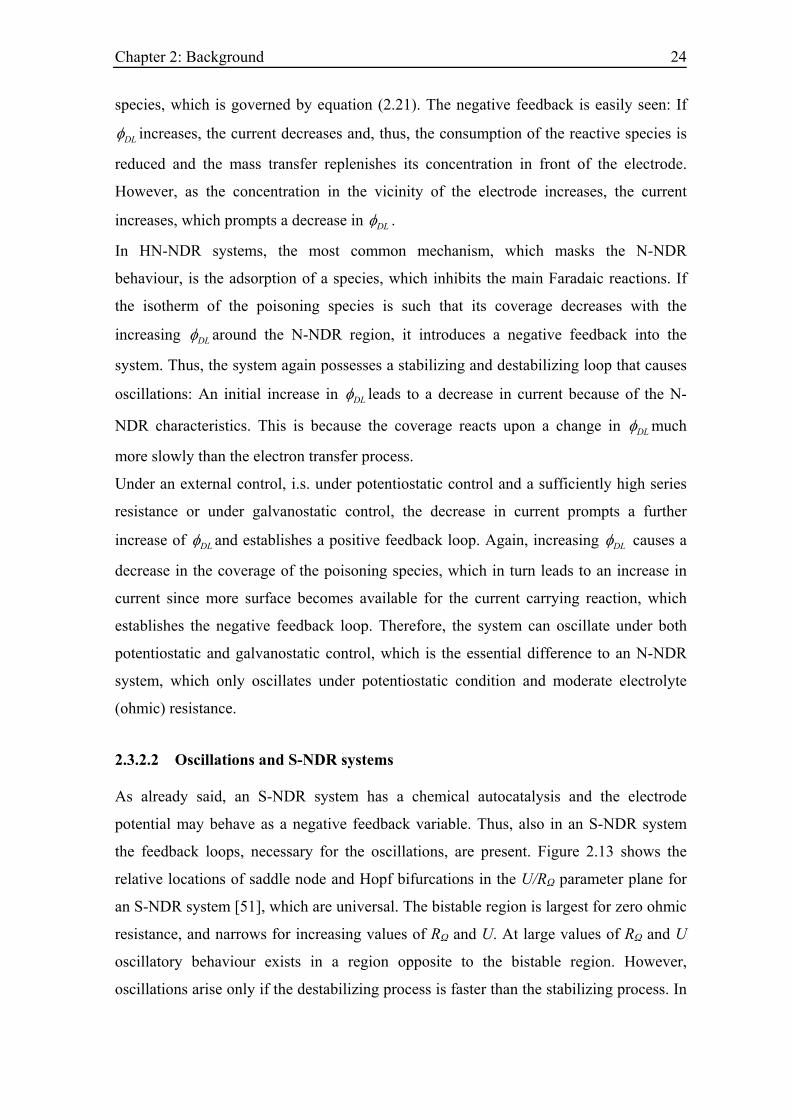
the feedback loops, necessary for the oscillations, are present. Figure 2.13 shows the
relative locations of saddle node and Hopf bifurcations in the U/RΩ parameter plane for
an S-NDR system [51], which are universal. The bistable region is largest for zero ohmic
resistance, and narrows for increasing values of RΩ and U. At large values of RΩ and U
oscillatory behaviour exists in a region opposite to the bistable region. However,
oscillations arise only if the destabilizing process is faster than the stabilizing process. In
Chapter 2: Background 25
other words, the typical time scale on which the autocatalytic species changes has to be
faster than the double layer charging.
Figure 2.13: Region of saddle node and Hopf bifurcation in an S-NDR system.
This is possible only for the extremely fast reactions or adsorption steps, or large values
of the double layer capacitance, which makes oscillations in any S-NDR system very
unlikely, and in fact, up to now there is no S-NDR system known, which exhibits
oscillations.
2.3.3 Pattern formation in electrochemical systems
So far, we have assumed that there are no spatial variations parallel to the electrode, i.e.,
the electrode potential and all chemical concentrations or coverages are uniform along
the electrode surface. However, the interaction of the reaction dynamics and spatial
transport processes might also induce pattern formation, like it is known of reaction
diffusion systems. However, in electrochemical systems the dominant spatial coupling
was shown not to be diffusion of chemical species, but so-called migration coupling
mediated by the electrostatic potential. The corresponding reaction migration equation
results from a local charge balance and reads [50]
WEzF
DL
zi
tC
=∂∂
−−=∂
∂ φσφ (2.42)
Here, σ is the conductivity of the electrolyte, φ the electrostatic potential in the
electrolyte. iF denotes the Faradaic current density and z is the spatial direction
perpendicular to the electrolyte, the positive direction pointing into the electrolyte. z =
Chapter 2: Background 26
WE is at the working electrode. Thus, the last term of Eq. (2.42) is the local migration
current density entering the interface.
Since the electrolyte is an electroneutral medium, the potential distribution outside the
double layer obeys to a very good approximation Laplace’s equation. Hence, φ (x.y.z)
can be calculated when appropriate boundary conditions to Laplace’s equation are
specified. The knowledge of the potential distribution, in turn, allows the local migration
current density at the interface to be calculated.
The migration coupling was shown to be nonlocal, i.e., a change of the electrostatic
potential at a specific position (x0, y0)z=WE at the interface changes the migration current
density not only in the direct neighborhood of (x0, y0)z=WE but in an entire neighboring
range [50, 51]. Physically, the nonlocal coupling results from the tendency of the
electrolyte to stay electroneutral: A change of the electrostatic potential at a position at
the interface (in mathematical terms of a boundary condition to Laplace’s equation) leads
to a simultaneous adjustment of the potential distribution in the entire electrolyte, and
thus also of the electric field at the interface. The coupling range depends on the distance
between the working electrode and the counter electrode. Thus, it depends on the
geometry of the electrochemical cell.
Depending on the experimental operation mode and the cell design, besides migration
coupling, all positions of the electrode might also be globally coupled. As defined in [51]
“A global coupling exists if a local change of a variable is felt by all the other locations
with the same strength independent of their distance to the locations of the local
variations.” In an electrochemical experiment, there are two sources of global coupling.
First, any external series resistance leads to a global coupling under constant outer
voltage conditions. This can be seen easily: Assume that there is a local fluctuation of the
current density at the electrode, which changes the total current slightly. Then, also the
voltage drop across the Ohmic resistance in series to the cell changes. The outer applied
voltage is equal to the sum of the voltage drop across the external resistor and the
electrochemical cell. Hence, when the voltage drop across the resistor changes, the
voltage drop between any location of the WE and the RE also has to change. Realizing
that constant current conditions, or the galvanostatic operation mode, can be seen as the
limit of the potentiostatic operation mode with a resistor in series to the cell and the outer
Chapter 2: Background 27
voltage as well as the series resistance approaching infinity, it is obvious that a global
coupling exists also under galvanostatic conditions.
Finally, it could be shown that whenever the RE is postioned between the WE and the
CE, a (weighted) global feedback is introduced [51]. For the case of a ring WE and the
RE positioned on the axis of the ring, we are again dealing with a global coupling in the
strict sense.
In summary, at the electrode|electrolyte interface the interaction between the uniform
dynamics of the electrochemical system and migration coupling mediated by the
electrostatic potential in the electrolyte or global coupling introduced through the
external control of the system might lead to the spontaneous formation of potential
and/or concentration patterns.
2.4 CO electrooxidation on Pt
CO electrooxidation proceeds through the reaction of adsorbed CO and an oxygenated
surface species, most likely OH. In the following, the surface electrochemical processes
of the different reaction steps are shortly summarized.
2.4.1 Adsorption of CO on Pt
In a heterogeneously catalysed reaction, at least one of the reactants has to adsorb on the
catalyst surface before the reaction takes place. This is true for a heterogeneous gas
phase reaction as well as an electro-catalytic reaction. Thus, the study of adsorption is
fundamental for the understanding of electro-catalytic reactions [95]. Two types of
adsorption processes have to be distinguished: physisorption and chemisorption.
Physisorption is the weakest form of adsorption, in which the main attraction is caused
by van der Waals forces. The equilibrium positions of the atoms result from the balance
between Pauli repulsion and van der Waals attraction. In chemisorption, a significant
hybridization between the adsorbate and the substrate electronic state occurs and a
chemical bond is created. The concept of the highest occupied molecular orbital
(HOMO) and the lowest un-occupied molecular orbital (LUMO) are conveniently used
to explain the formation of chemical bonds. However, in case of a solid surface, energy
bands instead of discrete energy levels have to be considered. In case of a solid without a
Chapter 2: Background 28
band gap, the HOMO and LUMO can be considered as an electronic state at the Fermi
level. In Refs. [95-97] the importance of the local density of states at the Fermi surface
for chemisorption is discussed.
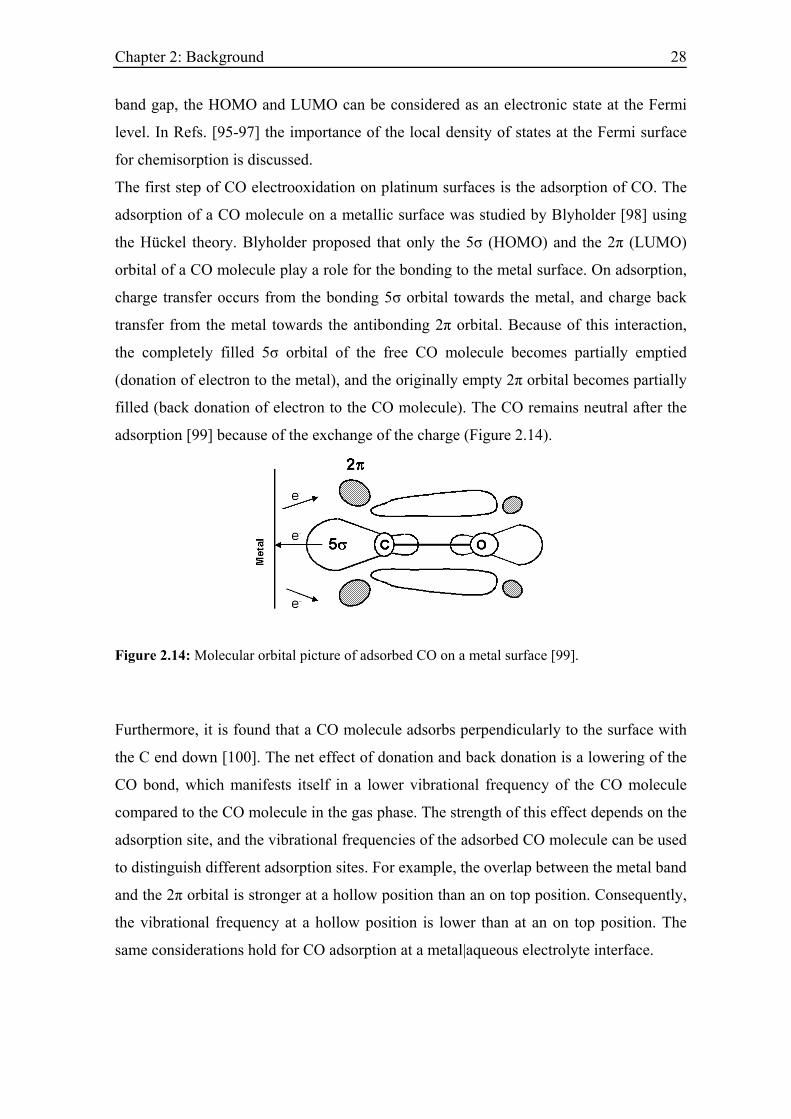
The first step of CO electrooxidation on platinum surfaces is the adsorption of CO. The
adsorption of a CO molecule on a metallic surface was studied by Blyholder [98] using
the Hückel theory. Blyholder proposed that only the 5σ (HOMO) and the 2π (LUMO)
orbital of a CO molecule play a role for the bonding to the metal surface. On adsorption,
charge transfer occurs from the bonding 5σ orbital towards the metal, and charge back
transfer from the metal towards the antibonding 2π orbital. Because of this interaction,
the completely filled 5σ orbital of the free CO molecule becomes partially emptied
(donation of electron to the metal), and the originally empty 2π orbital becomes partially
filled (back donation of electron to the CO molecule). The CO remains neutral after the
adsorption [99] because of the exchange of the charge (Figure 2.14).
Figure 2.14: Molecular orbital picture of adsorbed CO on a metal surface [99].
Furthermore, it is found that a CO molecule adsorbs perpendicularly to the surface with
the C end down [100]. The net effect of donation and back donation is a lowering of the
CO bond, which manifests itself in a lower vibrational frequency of the CO molecule
compared to the CO molecule in the gas phase. The strength of this effect depends on the
adsorption site, and the vibrational frequencies of the adsorbed CO molecule can be used
to distinguish different adsorption sites. For example, the overlap between the metal band
and the 2π orbital is stronger at a hollow position than an on top position. Consequently,
the vibrational frequency at a hollow position is lower than at an on top position. The
same considerations hold for CO adsorption at a metal|aqueous electrolyte interface.
Chapter 2: Background 29
2.4.2 Adsorbed oxygenated species
CO electrooxidation on Pt takes place through the reaction of adsorbed CO with OH or
other oxygenated species on the surface. In the following a brief introduction in the
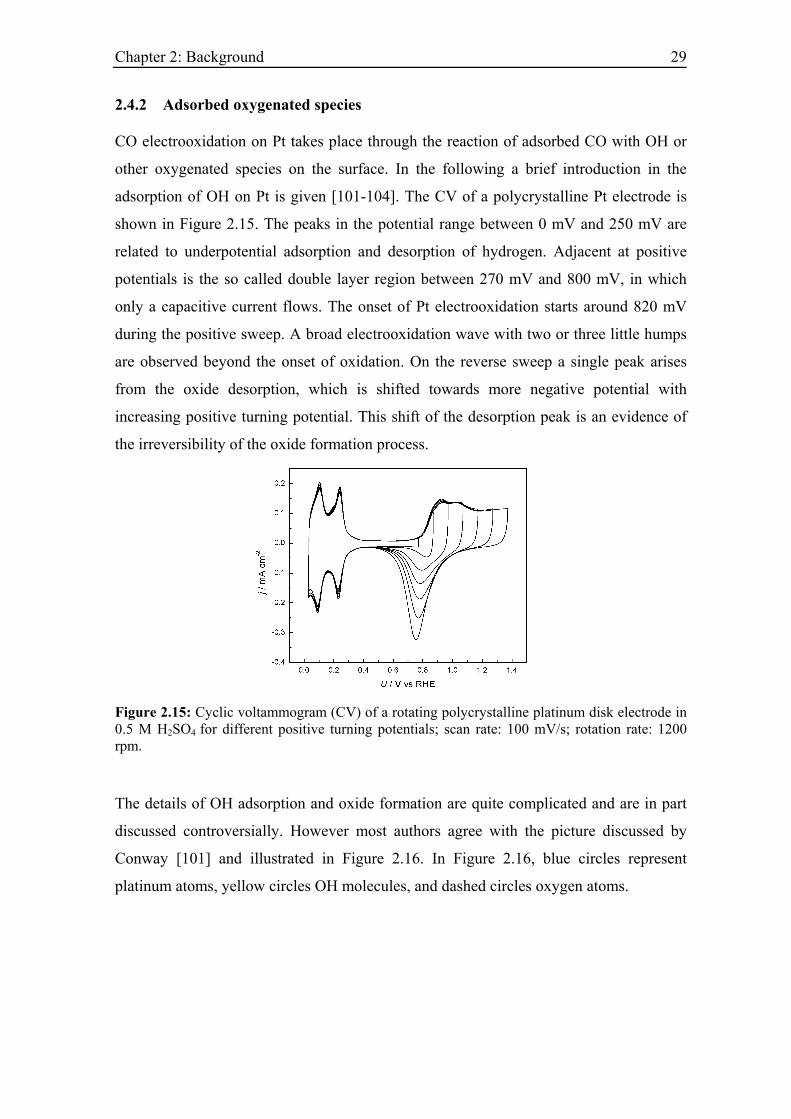
adsorption of OH on Pt is given [101-104]. The CV of a polycrystalline Pt electrode is
shown in Figure 2.15. The peaks in the potential range between 0 mV and 250 mV are
related to underpotential adsorption and desorption of hydrogen. Adjacent at positive
potentials is the so called double layer region between 270 mV and 800 mV, in which
only a capacitive current flows. The onset of Pt electrooxidation starts around 820 mV
during the positive sweep. A broad electrooxidation wave with two or three little humps
are observed beyond the onset of oxidation. On the reverse sweep a single peak arises
from the oxide desorption, which is shifted towards more negative potential with
increasing positive turning potential. This shift of the desorption peak is an evidence of
the irreversibility of the oxide formation process.
Figure 2.15: Cyclic voltammogram (CV) of a rotating polycrystalline platinum disk electrode in 0.5 M H2SO4 for different positive turning potentials; scan rate: 100 mV/s; rotation rate: 1200 rpm.
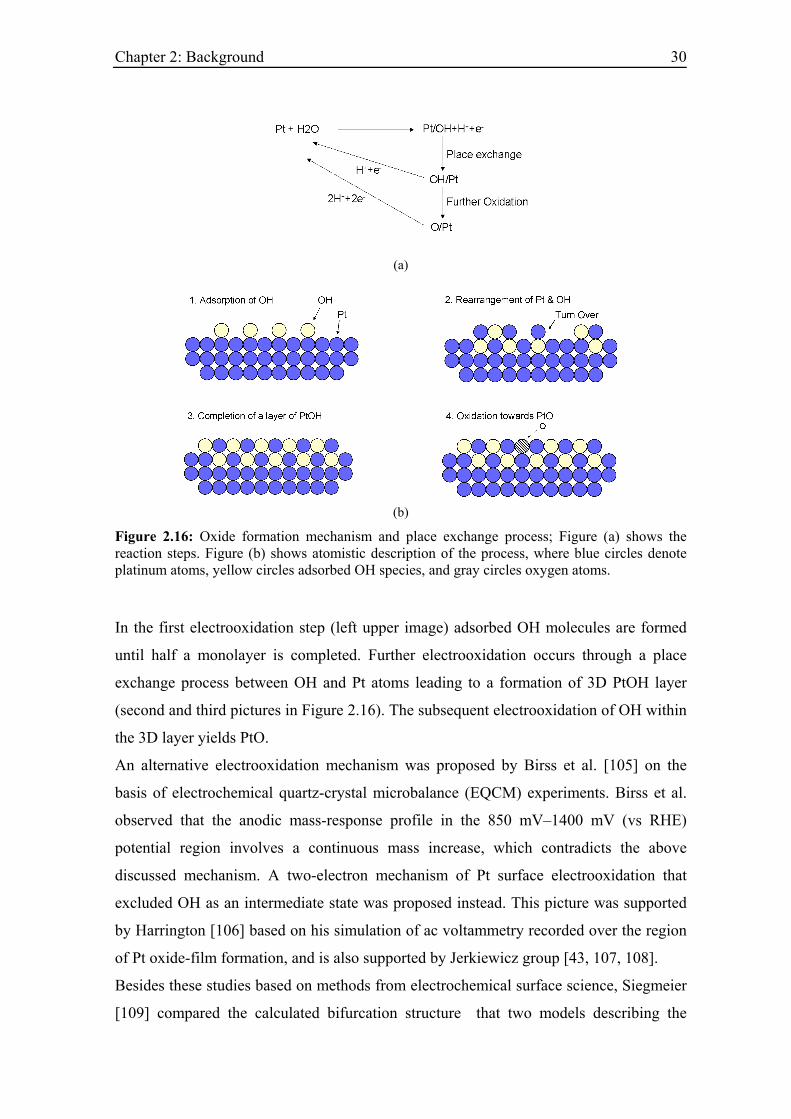
The details of OH adsorption and oxide formation are quite complicated and are in part
discussed controversially. However most authors agree with the picture discussed by
Conway [101] and illustrated in Figure 2.16. In Figure 2.16, blue circles represent
platinum atoms, yellow circles OH molecules, and dashed circles oxygen atoms.
Chapter 2: Background 30
(a)
(b)
Figure 2.16: Oxide formation mechanism and place exchange process; Figure (a) shows the reaction steps. Figure (b) shows atomistic description of the process, where blue circles denote platinum atoms, yellow circles adsorbed OH species, and gray circles oxygen atoms.
In the first electrooxidation step (left upper image) adsorbed OH molecules are formed
until half a monolayer is completed. Further electrooxidation occurs through a place
exchange process between OH and Pt atoms leading to a formation of 3D PtOH layer
(second and third pictures in Figure 2.16). The subsequent electrooxidation of OH within
the 3D layer yields PtO.
An alternative electrooxidation mechanism was proposed by Birss et al. [105] on the
basis of electrochemical quartz-crystal microbalance (EQCM) experiments. Birss et al.
observed that the anodic mass-response profile in the 850 mV–1400 mV (vs RHE)
potential region involves a continuous mass increase, which contradicts the above
discussed mechanism. A two-electron mechanism of Pt surface electrooxidation that
excluded OH as an intermediate state was proposed instead. This picture was supported
by Harrington [106] based on his simulation of ac voltammetry recorded over the region
of Pt oxide-film formation, and is also supported by Jerkiewicz group [43, 107, 108].
Besides these studies based on methods from electrochemical surface science, Siegmeier
[109] compared the calculated bifurcation structure that two models describing the
Chapter 2: Background 31
oxidation of H2-CO mixtures on Pt yield with experiments. One model assumes the
formation of OH as the first step in Pt electrooxidation and the other one the direct two-
electron oxidation to oxide. In case of the ´OH- model´, he obtained a nearly qualitative
agreement while in case of the oxide model the discrepancy between simulations and
experiments remained huge. Based on these recent results and the large body of literature
that presents support of the ´OH -model´, we also base our discussion in this work on this
more common model.
Finally, we mention that the onset potential of surface electrooxidation is also very
sensitive to the electrolyte concentration and the presence of further anions in the
electrolyte. The effect of the presence of halides on the OH formation was first
mentioned by Breiter [110] and later investigated thoroughly by other groups [111-113].
This issue will be discussed in detail in the fifth chapter.
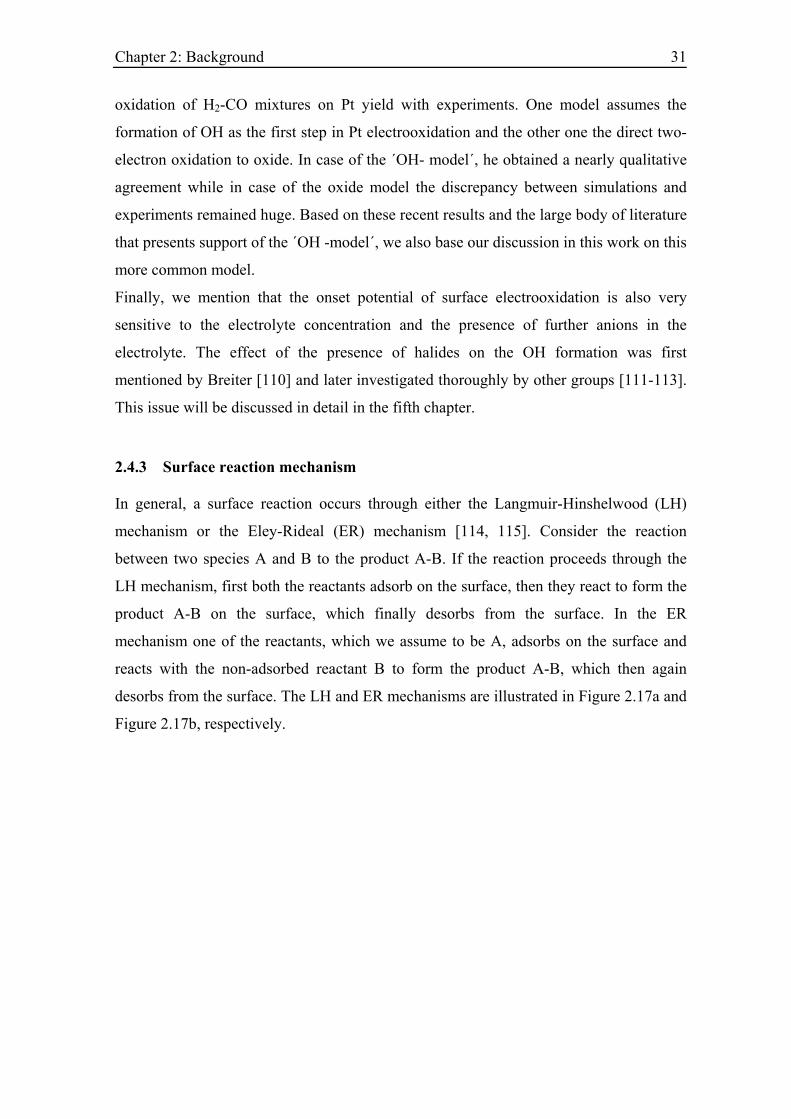
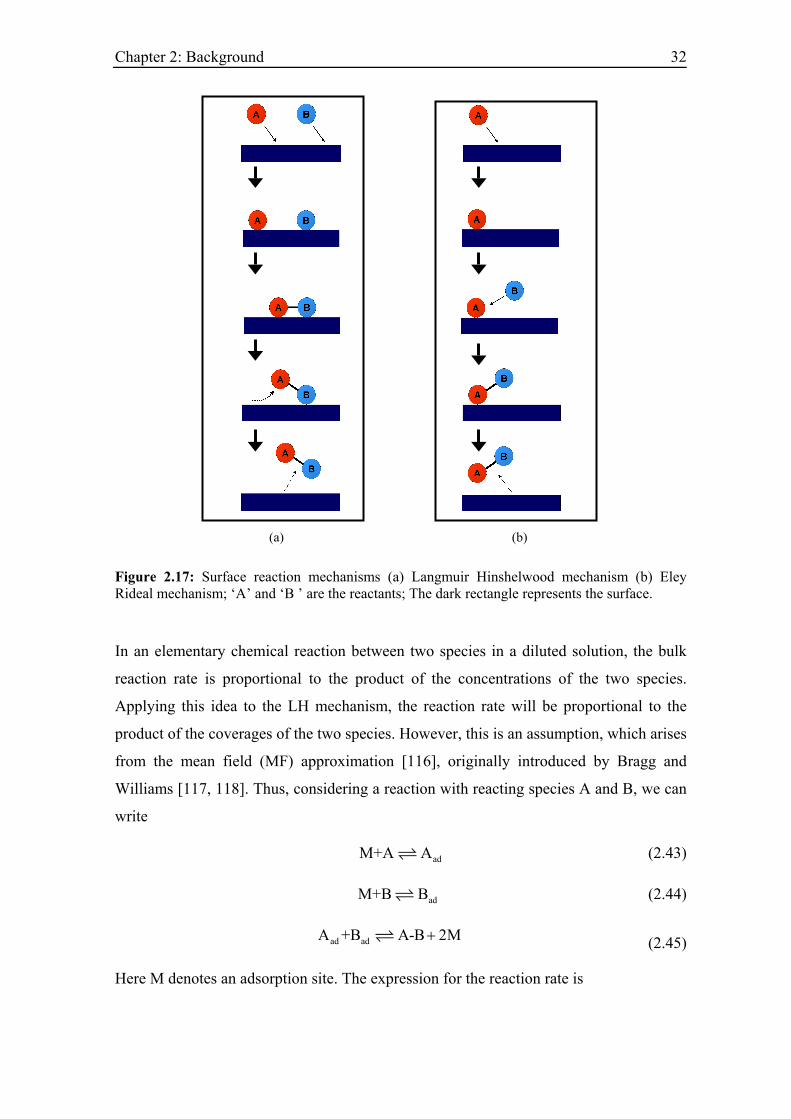
2.4.3 Surface reaction mechanism
In general, a surface reaction occurs through either the Langmuir-Hinshelwood (LH)
mechanism or the Eley-Rideal (ER) mechanism [114, 115]. Consider the reaction
between two species A and B to the product A-B. If the reaction proceeds through the
LH mechanism, first both the reactants adsorb on the surface, then they react to form the
product A-B on the surface, which finally desorbs from the surface. In the ER
mechanism one of the reactants, which we assume to be A, adsorbs on the surface and
reacts with the non-adsorbed reactant B to form the product A-B, which then again
desorbs from the surface. The LH and ER mechanisms are illustrated in Figure 2.17a and
Figure 2.17b, respectively.
Chapter 2: Background 32
(a) (b)
Figure 2.17: Surface reaction mechanisms (a) Langmuir Hinshelwood mechanism (b) Eley Rideal mechanism; ‘A’ and ‘B ’ are the reactants; The dark rectangle represents the surface.
In an elementary chemical reaction between two species in a diluted solution, the bulk
reaction rate is proportional to the product of the concentrations of the two species.
Applying this idea to the LH mechanism, the reaction rate will be proportional to the
product of the coverages of the two species. However, this is an assumption, which arises
from the mean field (MF) approximation [116], originally introduced by Bragg and
Williams [117, 118]. Thus, considering a reaction with reacting species A and B, we can
write
adM+A A (2.43)
adM+B B (2.44)
ad adA +B A-B 2M+ (2.45)
Here M denotes an adsorption site. The expression for the reaction rate is
Chapter 2: Background 33
AB r A Br k θ θ= (2.46)
The quantities θA, θB, and kr are the coverages of the two reactants A and B, and the
reaction rate constant, respectively. (In case of an electrochemical reaction, kr is potential
dependent). In MF theory, one of the basic assumptions is that the adsorbed species are
uniformly distributed over the surface as a two-dimensional lattice gas. It neglects spatial
correlations (the correlation between distributions of molecules on the surface) and
fluctuations among the reactants [119]. However, often the spatial distribution of the
reactants cannot be neglected in the calculation of the surface reaction rate [120, 121].
For example, if one species forms an island, and the reaction takes place only on the
circumference of the island, (preferential reactivity at the perimeter of the adsorbate
islands) [122], the reaction rate will not be proportional to the product of the coverages
of the reactants.
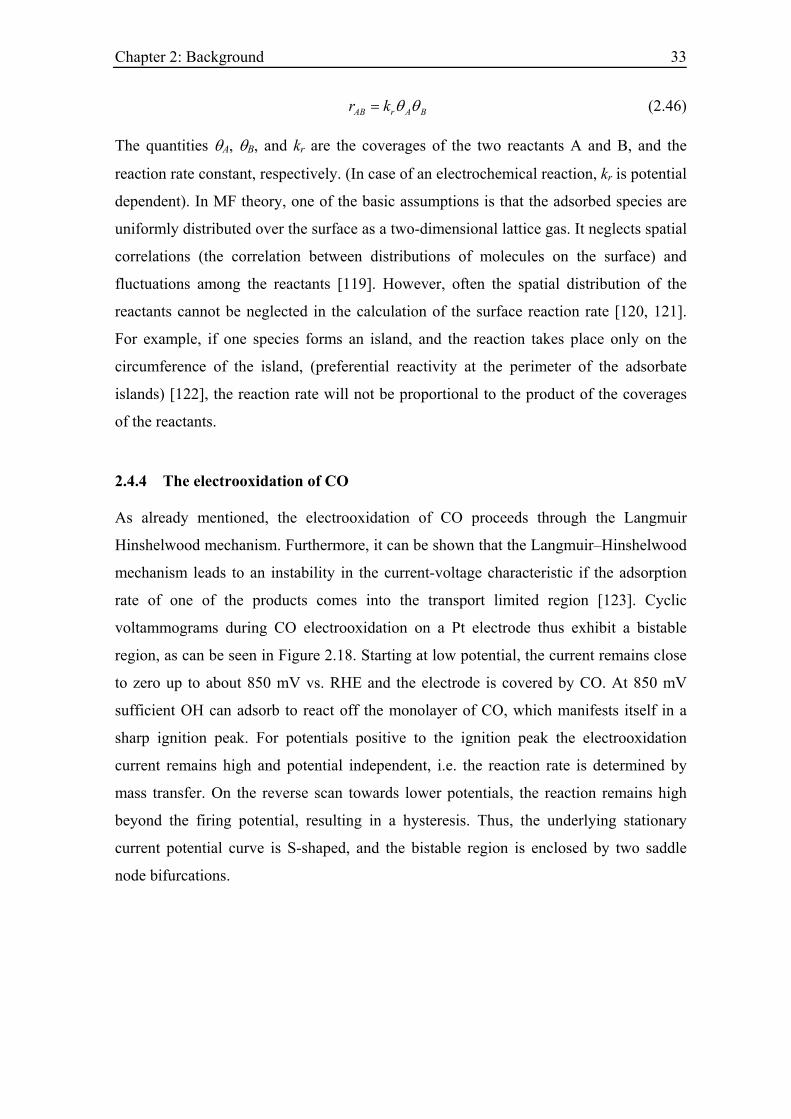
2.4.4 The electrooxidation of CO
As already mentioned, the electrooxidation of CO proceeds through the Langmuir
Hinshelwood mechanism. Furthermore, it can be shown that the Langmuir–Hinshelwood
mechanism leads to an instability in the current-voltage characteristic if the adsorption
rate of one of the products comes into the transport limited region [123]. Cyclic
voltammograms during CO electrooxidation on a Pt electrode thus exhibit a bistable
region, as can be seen in Figure 2.18. Starting at low potential, the current remains close
to zero up to about 850 mV vs. RHE and the electrode is covered by CO. At 850 mV
sufficient OH can adsorb to react off the monolayer of CO, which manifests itself in a
sharp ignition peak. For potentials positive to the ignition peak the electrooxidation
current remains high and potential independent, i.e. the reaction rate is determined by
mass transfer. On the reverse scan towards lower potentials, the reaction remains high
beyond the firing potential, resulting in a hysteresis. Thus, the underlying stationary
current potential curve is S-shaped, and the bistable region is enclosed by two saddle
node bifurcations.
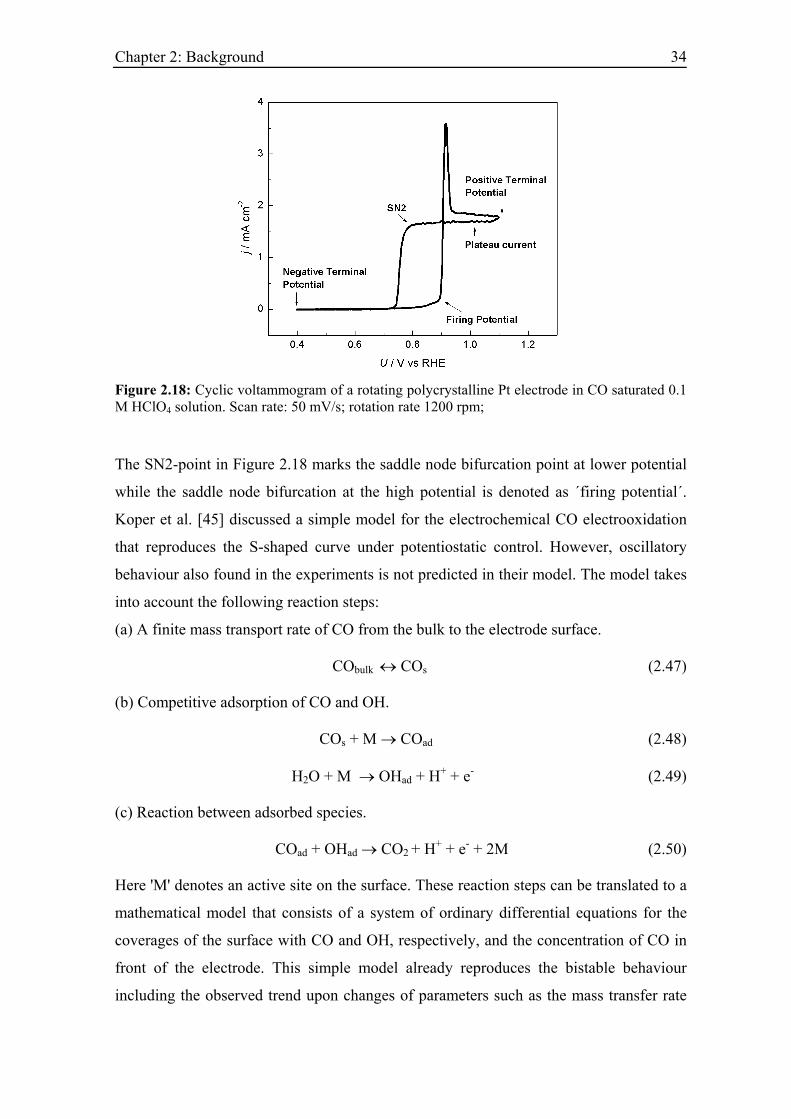
Chapter 2: Background 34
Figure 2.18: Cyclic voltammogram of a rotating polycrystalline Pt electrode in CO saturated 0.1 M HClO4 solution. Scan rate: 50 mV/s; rotation rate 1200 rpm;
The SN2-point in Figure 2.18 marks the saddle node bifurcation point at lower potential
while the saddle node bifurcation at the high potential is denoted as ´firing potential´.
Koper et al. [45] discussed a simple model for the electrochemical CO electrooxidation
that reproduces the S-shaped curve under potentiostatic control. However, oscillatory
behaviour also found in the experiments is not predicted in their model. The model takes
into account the following reaction steps:
(a) A finite mass transport rate of CO from the bulk to the electrode surface.
CObulk ↔ COs (2.47)
(b) Competitive adsorption of CO and OH.
COs + M → COad (2.48)
H2O + M → OHad + H+ + e- (2.49)
(c) Reaction between adsorbed species.
COad + OHad → CO2 + H+ + e- + 2M (2.50)
Here 'M' denotes an active site on the surface. These reaction steps can be translated to a
mathematical model that consists of a system of ordinary differential equations for the
coverages of the surface with CO and OH, respectively, and the concentration of CO in
front of the electrode. This simple model already reproduces the bistable behaviour
including the observed trend upon changes of parameters such as the mass transfer rate
Chapter 2: Background 35
of CO. As outlined in [51], a reaction mechanism giving rise to bistability must have a
positive or autocatalytic feedback loop. In our case, the feedback loop is produced by the
Langmuir Hinshelwood mechanism together with slow transport of CO: Consider a CO
covered state close to the firing potential. Assume that owing to a fluctuation there is a
critical number of free surface sites onto which CO and OH will adsorb. Adsorbed OH
however, which has initially still a low coverage, will react with adsorbed CO,
recovering two free surface sites per reaction and leading to a finite reaction current. The
latter, however will decrease the concentration of CO in front of the electrode somewhat,
and as a consequence, the rate of OH formation relative to the adsorption rate of CO
increases. This, in turn, will lead to a higher reaction rate that causes the concentration of
CO in front of the electrode to decrease further; Hence, the fact that CO adsorption
becomes diffusion controlled while OH adsorption is always reaction controlled
constitutes a positive feedback and causes the primary instability. An analogous
consideration holds close to the SN2 point. Starting point for the investigation of this
thesis is thus an understanding of this primary instability during CO bulk
electrooxidation.
Chapter 3: Experimental methods 36
Chapter 3: Experimental methods
In this chapter, the description of the experimental instruments, procedures, methods, and
the specifications of chemicals and gases is presented. A detailed description of the
electrode preparation for both, polycrystalline and single crystal Pt electrodes is given
with the results of the pre-treatment of single crystals in a rotating disk electrode system.
3.1 Electrochemical cell
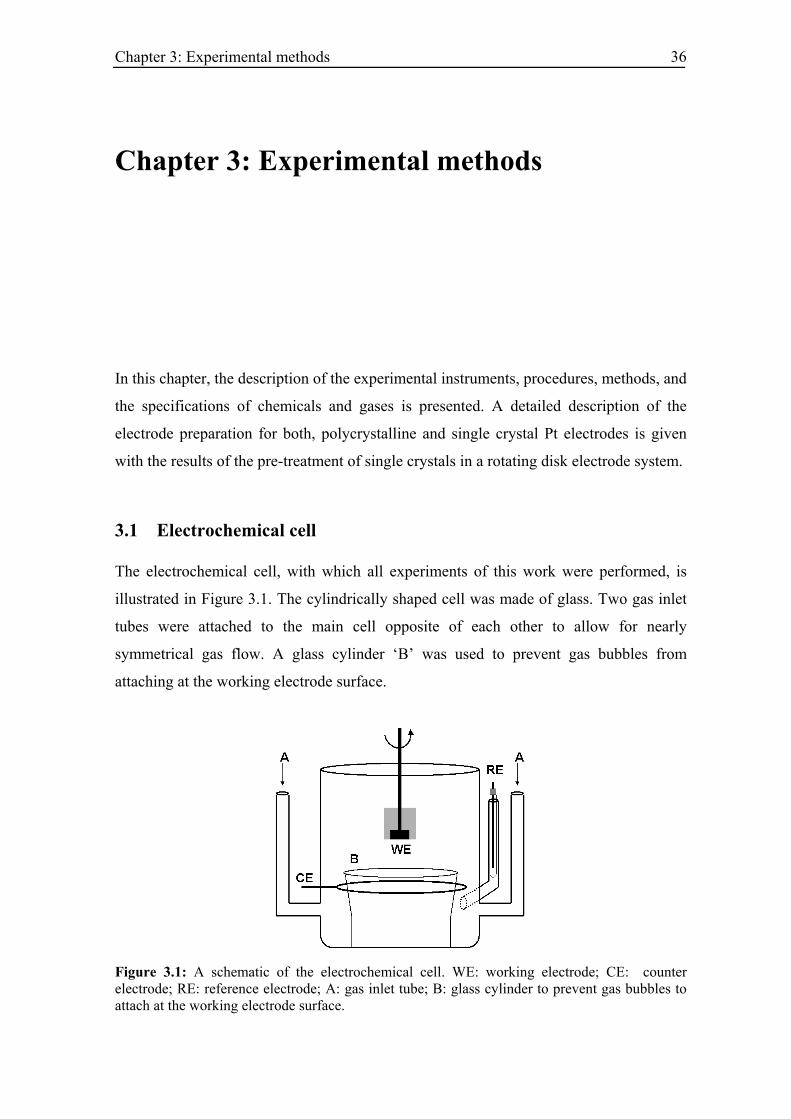
The electrochemical cell, with which all experiments of this work were performed, is
illustrated in Figure 3.1. The cylindrically shaped cell was made of glass. Two gas inlet
tubes were attached to the main cell opposite of each other to allow for nearly
symmetrical gas flow. A glass cylinder ‘B’ was used to prevent gas bubbles from
attaching at the working electrode surface.
Figure 3.1: A schematic of the electrochemical cell. WE: working electrode; CE: counter electrode; RE: reference electrode; A: gas inlet tube; B: glass cylinder to prevent gas bubbles to attach at the working electrode surface.
Chapter 3: Experimental methods 37
Experiments were carried out with a three-electrode arrangement, which allows to study
the current flow as a function of the potential of the working electrode (WE) only. This is
achieved by measuring the potential with respect to a reference electrode (RE), which
carries hardly any current but senses only the potential. Thus, the potential of the RE is
independent of the cell current and reproducible and stable under the operating
conditions. The current flows through the counter electrode (CE), whose potential is
adjusted in such a way that either the potential difference between the WE and the RE or
the current through the cell is equal to a preset value. The junction between the RE
compartment and the main cell was located below the CE to exclude a global coupling
through the external circuit [51]. In most cases, the potential drop between the WE and
the RE was minimized by working with a concentrated base electrolyte (0.5 M H2SO4 or
0.5 M HClO4). For 0.5 M H2SO4 the cell resistance was 14 Ω. Throughout this work, the
RE was a saturated Hg|Hg2SO4 electrode, which was kept in a separate compartment. All
the potentials in the experiments were measured against this electrode. However, in all
figures the potentials are given with respect to the reversible hydrogen electrode (RHE),
which was determined using the RE potential and the pH of the solution according to
2 4RHE Hg|Hg SO 0.640 0.058pHU U= + +
The CE was a 1 mm thick Pt wire bent to a ring of 65 mm in diameter. It was located
parallel and at a distance of 45 mm to the WE to ensure a symmetrical current flow
between WE and CE.
Polycrystalline platinum (99.999%) and single crystal platinum disk electrodes were
used in the experiments. The polycrystalline disk electrode was embedded in a solid
PTFE cylinder and the single crystal disk electrodes were assembled in a PTFE holder
before an experiment. The exposed geometrical surface area of the polycrystalline and
the single crystal electrodes were 0.197 cm2 and 0.102 cm2, respectively.
3.2 Instrumentation
The electronic device, which controls the current through the electrochemical cell is
called potentiostat. The potentiostat measures the potential difference between the WE
and the RE, and pumps current through the CE (either direction) such that the potential
difference between the WE and the RE remains constant at some predefined value. The
user could adjust the predefined potential difference and may control the experiment in
Chapter 3: Experimental methods 38
different ways. Many times a linear ramp voltage, which cycles periodically between two
limits (the lower and upper voltage) is used. This experiment is called cyclic
voltammetry, and the current voltage curve of a full cycle is called a cyclic-
voltammogram (CV). The experimentalist sets the lower and upper voltage with a
predefined slope (scan rate). Usually a potentiostat can also be operated as a galvanostat.
In this operation mode, the current is set to some predefined value and the electrode
potential is adjusted in such a way that the current can be maintained. The Electronic
Laboratory of the Fritz-Haber-Institute der MPG, Berlin, built the potentiostat that was
employed in all experimental studies reported here. A Sun Solaris based Real Time
system was used for the data acquisition. The rotating electrode system consisted of a
variable speed rotator with a controller from Pine Research Instrumentation.
3.3 Chemicals and electrolyte solution
The purity of the used chemicals is an important issue in electrochemical experiments.
Contaminations present in the electrolyte may adsorb on the electrode surface and
influence the surface processes either by taking part in the reactions or by blocking active
sites. Therefore, all the chemicals used in this work were of high purity grade unless
otherwise specified (concentrated HClO4 (Suprapure Merck), H2SO4 (Suprapure Merck),
and HBF4 (Aldrich `Purum’). For the same reason, ultra pure water was used in the
experiments (Millipore MilliQ). The water had 18.2 MΩ cm specific resistance and less
than 4 ppb TOC (total organic carbon). The purity levels of the gases used were 99.999%
(Ar, Linde) and 99.997% (CO, Air liquid), respectively. Various mixtures of Ar and CO
were generated using computer operated mass flow controllers. Special care has been
taken during the assembling of the gas pipe and the valve to prevent contaminations.
3.4 Cleaning procedure and electrode preparation
All glasswares used in the experiments were intensively cleaned. The standard procedure
consisted of boiling all glassware in concentrated pro analysis grade nitric acid for one to
four days, depending on the level of contamination. In case of a high contamination level
the glassware was further treated with an H2O2 + H2SO4 mixture (1:2) for three to seven
days, and after this treatment the glassware was first rinsed with water and then
Chapter 3: Experimental methods 39
immersed in water for one to two days before starting an experiment. Normally, this
intensive cleaning procedure was applied once a month or, when the base CV indicated
the presence of contaminations in the system. Otherwise, the glassware was rinsed with
water for five times before and after the experiment. Between experiments, it was kept in
or filled up with water. All PTFE parts of the system were cleaned in an ultrasonic bath,
alternately with concentrated sulphuric acid and concentrated sodium hydroxide solution
for five minutes each. This procedure was repeated three times. Finally the PTFE parts
were cleaned three times in water for five minutes each.
3.4.1 Polycrystalline Pt electrode
The pre-treatment of the polycrystalline electrode was a two-step procedure. First, the
electrode was polished with diamond pastes from 10 to 1 micron particle size. When
switching to another polishing paste and at the end of the polishing procedure the
electrode was cleaned consecutively with acetone, ethanol, and methanol in an ultrasonic
bath each time for five minutes. Immediately before every experiment, the electrode was
kept in an ultrasonic bath of a mixture of concentrated sulphuric acid and hydrogen
peroxide mixture (1:1) for one to five minutes, and thereafter in water for five minutes,
three times in a row with new water each time.
3.4.2 Single crystalline Pt electrode
Experiments with platinum single crystals in a rotating electrode system are rare owing
to the sensitive nature of the single crystal surfaces. The problem arises from the pre-
treatment of the crystal. During the pretreatment of the crystal, temperature can rise up to
1200 K impeding a permanent fixation of the electrode in the rotating electrode holder.
On the other hand, a separately pretreated crystal is exposed to air during the assembling
process, and a long exposure to air modifies the pretreated surface. In this work, a special
electrode holder was designed that allowed for a fast assembly of the electrode in the
holder. In this work, Pt(110), Pt(111), and Pt(100) single crystal (MaTek) disk electrodes
were used. A platinum wire was spot-welded on the backside of the disks in the form of
a little handle in such a way that it could be manipulated with a Pt hook that was attached
to a glass rod. The single crystal was flame-annealed to light red glow using a butane
burner. The propane flame was applied to the backside of the single crystal, so that the
surface of interest did not come into a direct contact with the flame. During the heating,
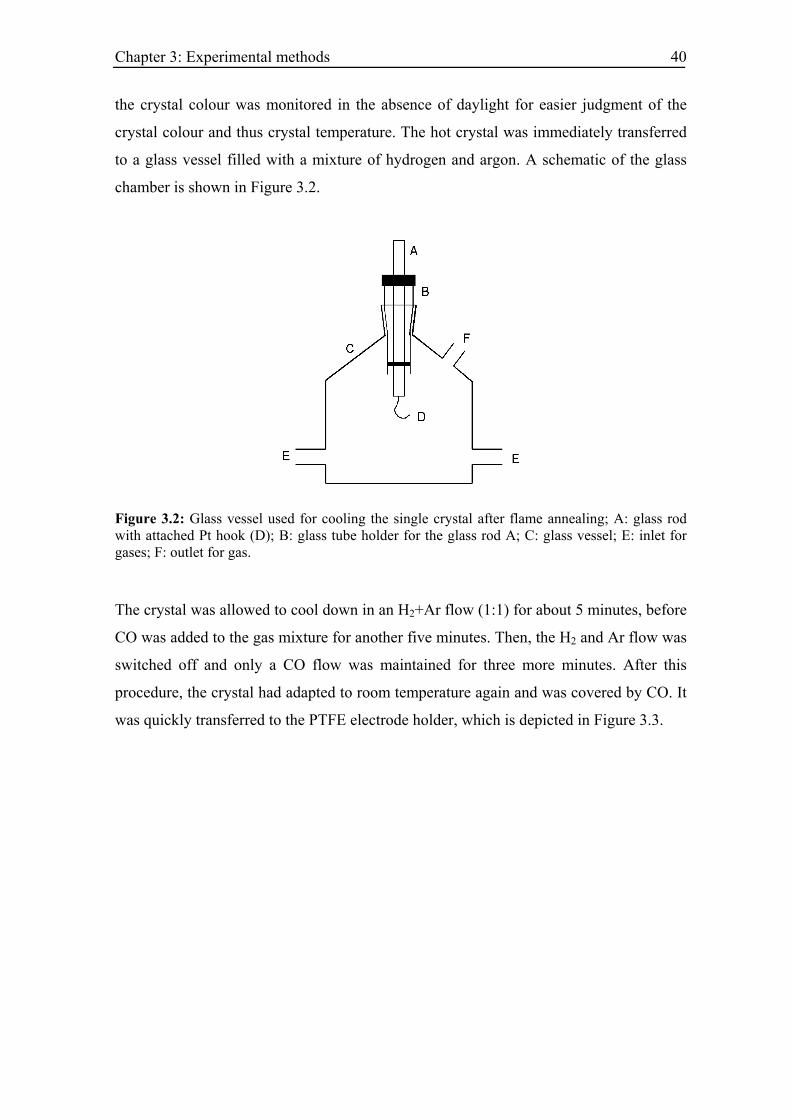
Chapter 3: Experimental methods 40
the crystal colour was monitored in the absence of daylight for easier judgment of the
crystal colour and thus crystal temperature. The hot crystal was immediately transferred
to a glass vessel filled with a mixture of hydrogen and argon. A schematic of the glass
chamber is shown in Figure 3.2.
Figure 3.2: Glass vessel used for cooling the single crystal after flame annealing; A: glass rod with attached Pt hook (D); B: glass tube holder for the glass rod A; C: glass vessel; E: inlet for gases; F: outlet for gas.
The crystal was allowed to cool down in an H2+Ar flow (1:1) for about 5 minutes, before
CO was added to the gas mixture for another five minutes. Then, the H2 and Ar flow was
switched off and only a CO flow was maintained for three more minutes. After this
procedure, the crystal had adapted to room temperature again and was covered by CO. It
was quickly transferred to the PTFE electrode holder, which is depicted in Figure 3.3.
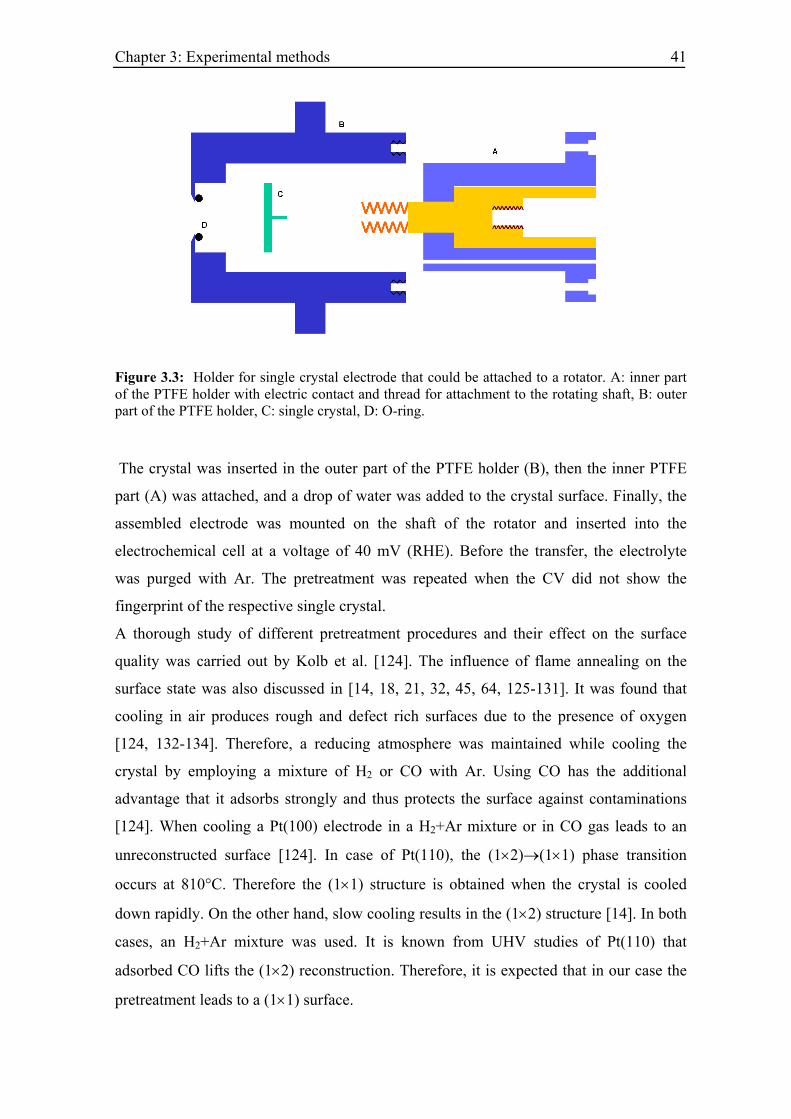
Chapter 3: Experimental methods 41
Figure 3.3: Holder for single crystal electrode that could be attached to a rotator. A: inner part of the PTFE holder with electric contact and thread for attachment to the rotating shaft, B: outer part of the PTFE holder, C: single crystal, D: O-ring.
The crystal was inserted in the outer part of the PTFE holder (B), then the inner PTFE
part (A) was attached, and a drop of water was added to the crystal surface. Finally, the
assembled electrode was mounted on the shaft of the rotator and inserted into the
electrochemical cell at a voltage of 40 mV (RHE). Before the transfer, the electrolyte
was purged with Ar. The pretreatment was repeated when the CV did not show the
fingerprint of the respective single crystal.
A thorough study of different pretreatment procedures and their effect on the surface
quality was carried out by Kolb et al. [124]. The influence of flame annealing on the
surface state was also discussed in [14, 18, 21, 32, 45, 64, 125-131]. It was found that
cooling in air produces rough and defect rich surfaces due to the presence of oxygen
[124, 132-134]. Therefore, a reducing atmosphere was maintained while cooling the
crystal by employing a mixture of H2 or CO with Ar. Using CO has the additional
advantage that it adsorbs strongly and thus protects the surface against contaminations
[124]. When cooling a Pt(100) electrode in a H2+Ar mixture or in CO gas leads to an
unreconstructed surface [124]. In case of Pt(110), the (1×2)→(1×1) phase transition
occurs at 810°C. Therefore the (1×1) structure is obtained when the crystal is cooled
down rapidly. On the other hand, slow cooling results in the (1×2) structure [14]. In both
cases, an H2+Ar mixture was used. It is known from UHV studies of Pt(110) that
adsorbed CO lifts the (1×2) reconstruction. Therefore, it is expected that in our case the
pretreatment leads to a (1×1) surface.
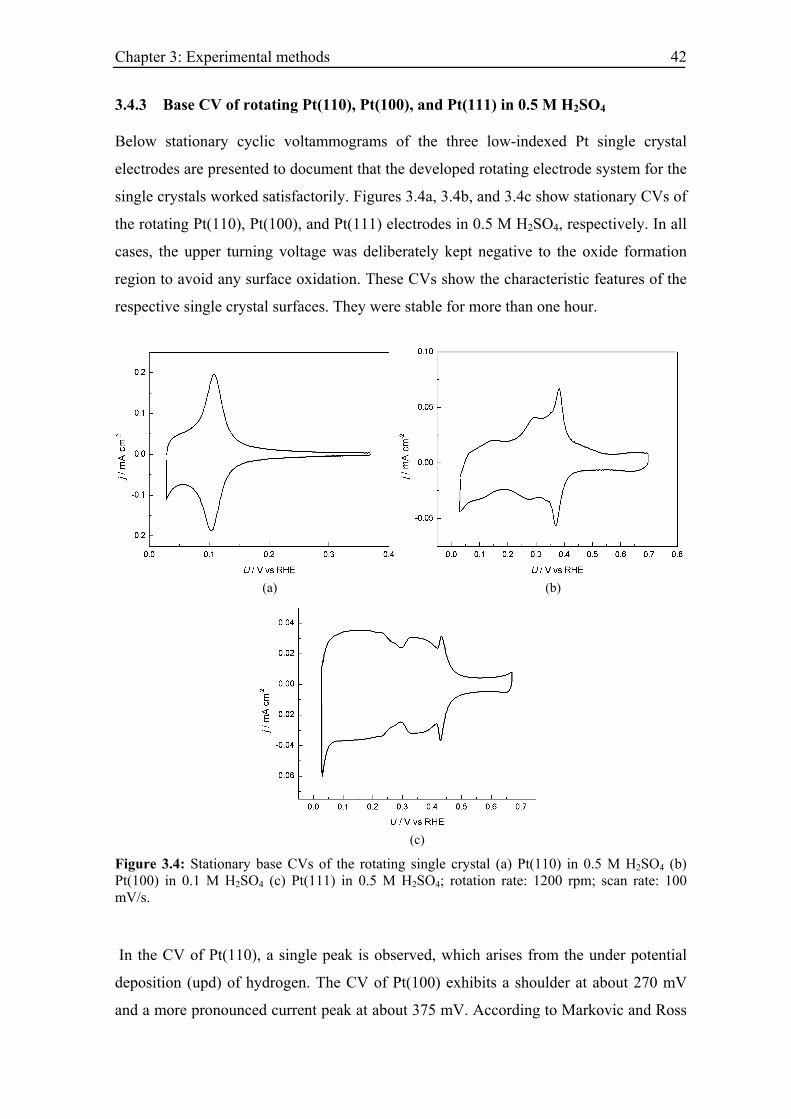
Chapter 3: Experimental methods 42
3.4.3 Base CV of rotating Pt(110), Pt(100), and Pt(111) in 0.5 M H2SO4
Below stationary cyclic voltammograms of the three low-indexed Pt single crystal
electrodes are presented to document that the developed rotating electrode system for the
single crystals worked satisfactorily. Figures 3.4a, 3.4b, and 3.4c show stationary CVs of
the rotating Pt(110), Pt(100), and Pt(111) electrodes in 0.5 M H2SO4, respectively. In all
cases, the upper turning voltage was deliberately kept negative to the oxide formation
region to avoid any surface oxidation. These CVs show the characteristic features of the
respective single crystal surfaces. They were stable for more than one hour.
(a) (b)
(c)
Figure 3.4: Stationary base CVs of the rotating single crystal (a) Pt(110) in 0.5 M H2SO4 (b) Pt(100) in 0.1 M H2SO4 (c) Pt(111) in 0.5 M H2SO4; rotation rate: 1200 rpm; scan rate: 100 mV/s.
In the CV of Pt(110), a single peak is observed, which arises from the under potential
deposition (upd) of hydrogen. The CV of Pt(100) exhibits a shoulder at about 270 mV
and a more pronounced current peak at about 375 mV. According to Markovic and Ross
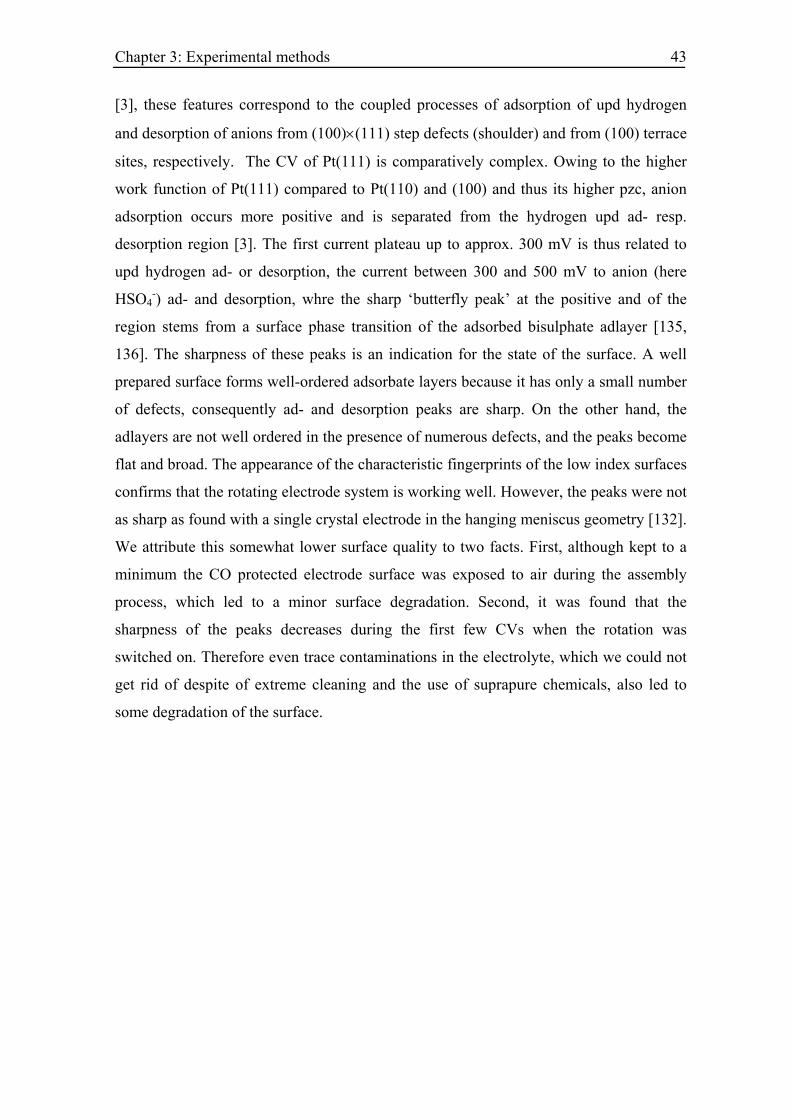
Chapter 3: Experimental methods 43
[3], these features correspond to the coupled processes of adsorption of upd hydrogen
and desorption of anions from (100)×(111) step defects (shoulder) and from (100) terrace
sites, respectively. The CV of Pt(111) is comparatively complex. Owing to the higher
work function of Pt(111) compared to Pt(110) and (100) and thus its higher pzc, anion
adsorption occurs more positive and is separated from the hydrogen upd ad- resp.
desorption region [3]. The first current plateau up to approx. 300 mV is thus related to
upd hydrogen ad- or desorption, the current between 300 and 500 mV to anion (here
HSO4-) ad- and desorption, whre the sharp ‘butterfly peak’ at the positive and of the
region stems from a surface phase transition of the adsorbed bisulphate adlayer [135,
136]. The sharpness of these peaks is an indication for the state of the surface. A well
prepared surface forms well-ordered adsorbate layers because it has only a small number
of defects, consequently ad- and desorption peaks are sharp. On the other hand, the
adlayers are not well ordered in the presence of numerous defects, and the peaks become
flat and broad. The appearance of the characteristic fingerprints of the low index surfaces
confirms that the rotating electrode system is working well. However, the peaks were not
as sharp as found with a single crystal electrode in the hanging meniscus geometry [132].
We attribute this somewhat lower surface quality to two facts. First, although kept to a
minimum the CO protected electrode surface was exposed to air during the assembly
process, which led to a minor surface degradation. Second, it was found that the
sharpness of the peaks decreases during the first few CVs when the rotation was
switched on. Therefore even trace contaminations in the electrolyte, which we could not
get rid of despite of extreme cleaning and the use of suprapure chemicals, also led to
some degradation of the surface.
Chapter 4: Application of Derivative Control during Bulk CO Electrooxidation 44
Chapter 4: Application of Derivative Control
during Bulk CO Electrooxidation
4.1 Introduction
The dynamic behaviour of a system can be controlled by applying a small perturbation to
a control parameter. In a pioneering work, Ott, Grebogi, and Yorke [137] presented a
theoretical guideline for controlling chaos by stabilizing an unstable periodic orbit.
Shortly after this prediction chaos control was successfully realized in experiments by
Peng et al. [138], Rollins et al. [139], Ditto et al. [140], Hunt [141], and others [142-144].
Subsequently, Pyragas [145] proposed an alternative method for controlling unstable
periodic orbits using time-delayed feedback [146], which is easier to implement under
most experimental conditions. Ross et al. [147, 148] proposed a control strategy to
stabilize the saddle fixed point of a bistable system. The proportional integral derivative
control and other nonlinear control strategies are frequently used to manipulate the
stability of a stationary state [147, 149-155]. Application of the control strategy in
electrochemical systems is a subject of extensive research today. Among various works,
Parmananda et al. [154] proposed a derivative controller to stabilize an unstable fixed
point in an electrochemical system. In this work, we use a derivative control method to
change the time scale of some variable in an electrochemical system, thereby
destabilizing the stationary state and inducing oscillations.
In electrochemical systems, the double-layer capacitance Cd sets the inherent time scale
for the variation of the potential drop across the double-layer. The double layer
capacitance is an intrinsic property of the electrode|electrolyte interface and this cannot
be varied by varying external parameters. As already discussed in chapter 2, the
interfacial kinetics of many electrochemical systems lead to a current voltage curve that
possesses a region with a negative differential resistance (NDR), which is either N-type
Chapter 4: Application of Derivative Control during Bulk CO Electrooxidation 45
or S-type. In N-NDR systems, the double layer potential takes the role of the activator,
whereas in S-NDR systems the double layer potential acts as an inhibitory variable.
Typically, the ratio of the time scales of the double layer dynamics and of the dynamics
of chemical species are much larger than one, and as a consequence, N-NDR systems
oscillate while S-NDR systems do not exhibit limit cycle behaviour. Kiss et al. [156]
point out that it is possible to vary the effective double layer capacitance by employing a
recursive derivative feedback control. Consequently, the double layer capacitance
becomes a controllable parameter. This opens the possibility to destroy oscillations in N-
NDR systems and to induce oscillations in S-NDR systems by increasing the effective
double layer capacitance.
Bulk CO electrooxidation on Pt was claimed to belong to the class of S-NDR systems
[45]. This hypothesis can be tested and further insight into the dynamics of CO
electrooxidation obtained with recursive derivative control. In the following an analogue
device, which was designed in the framework of this thesis, is described that implements
the recursive feedback control and thus allows the time scale of the double layer
dynamics to be varied. Subsequently, experimental results obtained with the CO/Pt
system are presented and compared to theoretical predictions.
4.2 Theoretical background
Derivative control denotes a control strategy in which the temporal changes of variables
and possibly also of parameters are fed back to the system. Since at a stationary state
neither any variables nor any external control parameters change with time, derivative
control does not alter steady states of a system. The stability of a stationary state of a
dynamical system is determined by the eigenvalues of the Jacobian matrix evaluated at
the fixed point, and in contrast to the stationary state the eigenvalues change when
derivative control is employed. Therefore, derivative control may alter the stability of a
fixed point. Consider a system with n variables and m parameters described by a set of
ordinary differential equations:
( , )dX F X Pdt
= where nX ∈ and mP ∈ (4.1)
Chapter 4: Application of Derivative Control during Bulk CO Electrooxidation 46
Let us define the derivative control signals, which are applied to the system state
variables X and parameters P as ~X and .
~P
~X and be such that the new system can be
written as
~P
~ ~( ,dX F X X P P
dt)= + + (4.2)
where ~X and are
~P
~ ~ ~ ~
1 2, ,... nX x x x = (4.3)
~ ~ ~ ~
1 2, ,... mP p p p= (4.4)
and
11~
1 21 1
jik
r r k r kk k
dx dpxdt dt
α α= =
= +∑ ∑ k (4.5)
22~
3 41 1
jik
r r k r kk k
dx dppdt dt
α α= =
= +∑ ∑ k
,
(4.6)
Here i1, i2, j1, and j2 are determined by the number of state variables and parameters
used for the control. The gain factors 1 2 3, ,rk rk rkα α α and 4rkα determine the control
strategy. Note that in a practical system the state variables and parameters may not be
always accessible. In case of derivative control, at the steady state the contributions of ~X and are zero, therefore equations (4.2) and (4.1) have identical fixed points.
~P
When applying the control strategy, the characteristic time scale of a variable can be
increased or decreased by modifying the gain factors in the feedback loop. Let us start
with the sth component of equation (4.2).
~ ~( ,s
sdx )f X X P Pdt
= + + (4.7)
where the function fs be such that it can be expressed as
~ ~( , ) ( , ) s
s sdxf X X P P f X Pdt
η+ + = + (4.8)
Substituting equation (4.8) in (4.7) we can write
Chapter 4: Application of Derivative Control during Bulk CO Electrooxidation 47
(1 ) ( , )ss
dx f X Pdt
η− = (4.9)
Therefore, by controlling ‘η’ the characteristic time of xs can be adjusted. If η is
negative, the characteristic time increases, and if η is positive, it decreases. The
magnitude and the sign of η are determined by the gain factors in the feedback loop.
The mathematical trick, as shown in the above discussion, is now applied to the
electrode|electrolyte interface. In electrochemical systems, the double-layer capacitance
sets the time scale for the temporal variation of the potential drop across the double layer
φDL, which follows from the charge balance equation (4.10) of the equivalent circuit of
an electrochemical cell:
( )DLF DL
dCA idt R
DLUφ φφΩ
−= − + (4.10)
where iF is the Faradaic current, U is the applied voltage, A is the surface area of the
electrode, C is the specific double-layer capacitance, and RΩ is the cell resistance. In a
typical potentiostatic experiment, U is controlled externally and the current i is
measured:
DLUiR
φ
Ω
−= (4.11)
We choose the control signal to be
dU didt dt
α αβ− (4.12)
and add it to the applied base voltage U0
0dU diU Udt dt
α αβ= + − (4.13)
The derivative of i with respect to time can be written as
1 ( )DLdi dU ddt R dt dt
φ
Ω
= − (4.14)
substituting equation (4.14) and (4.13) in equation (4.10), one obtains
02 2( ) ( )DLDL DL
F DLUd dUCA i
dt R dt R R R dtdφφ α αβ αβ φφ
Ω Ω Ω Ω
−= − + + − − (4.15)
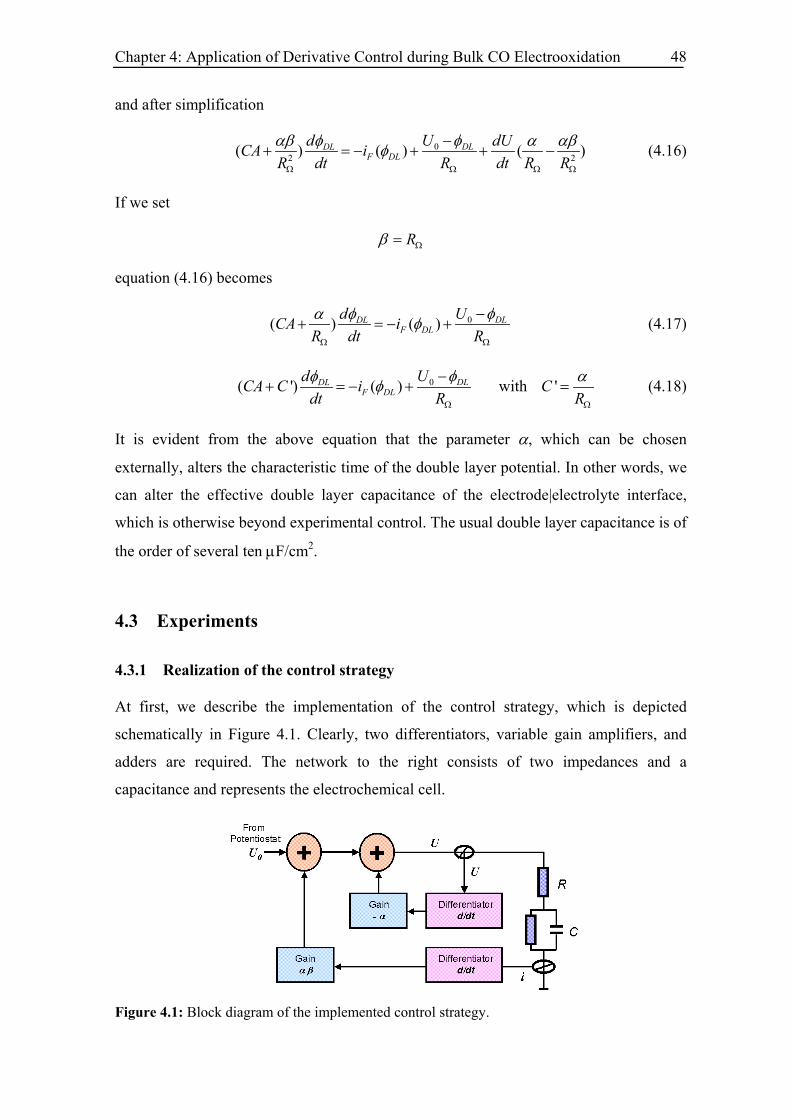
Chapter 4: Application of Derivative Control during Bulk CO Electrooxidation 48
and after simplification
02 2( ) ( ) (DLDL
F DLUd dCA i )U
R dt R dt R Rφαβ φ α αβφ
Ω Ω Ω Ω
−+ = − + + − (4.16)
If we set
Rβ Ω=
equation (4.16) becomes
0( )( ) DLDLF DL
UdCA iR dt R
φα φ φΩ Ω
−+ = − + (4.17)
0( ') ( ) DLDLF DL
UdCA C idt R
φφ φΩ
−+ = − + with 'C
Rα
Ω
= (4.18)
It is evident from the above equation that the parameter α, which can be chosen
externally, alters the characteristic time of the double layer potential. In other words, we
can alter the effective double layer capacitance of the electrode|electrolyte interface,
which is otherwise beyond experimental control. The usual double layer capacitance is of
the order of several ten µF/cm2.
4.3 Experiments
4.3.1 Realization of the control strategy
At first, we describe the implementation of the control strategy, which is depicted
schematically in Figure 4.1. Clearly, two differentiators, variable gain amplifiers, and
adders are required. The network to the right consists of two impedances and a
capacitance and represents the electrochemical cell.
Figure 4.1: Block diagram of the implemented control strategy.
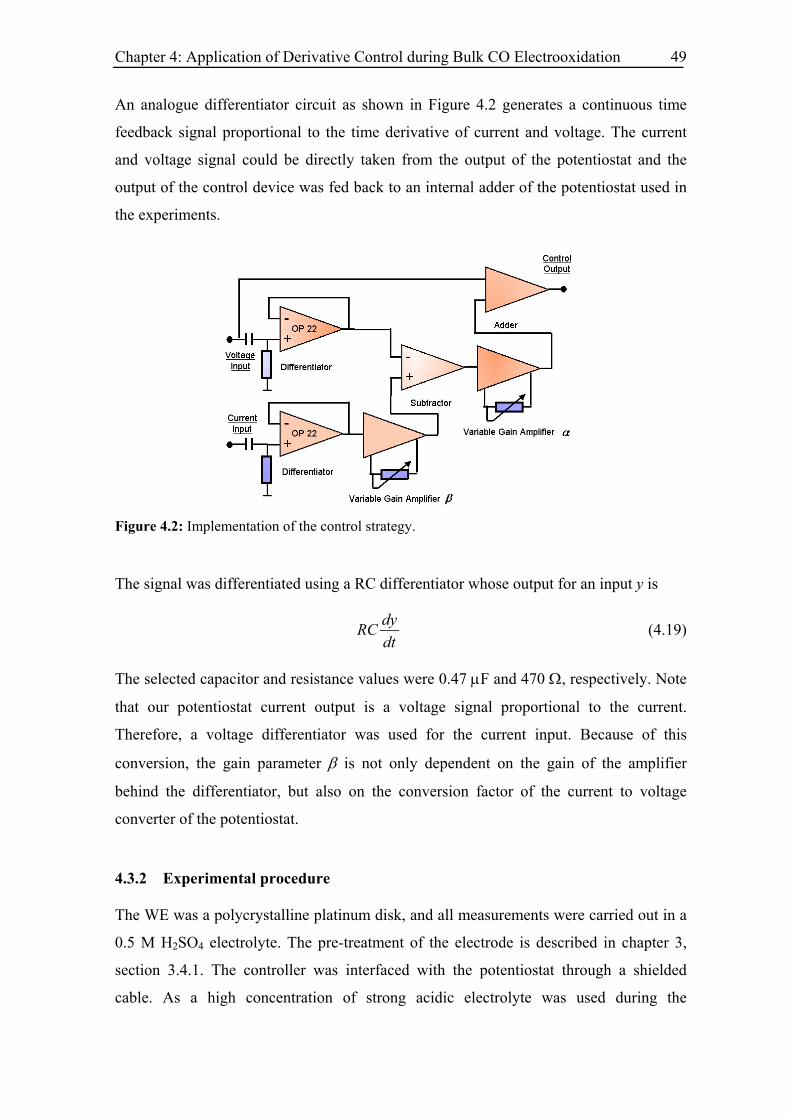
Chapter 4: Application of Derivative Control during Bulk CO Electrooxidation 49
An analogue differentiator circuit as shown in Figure 4.2 generates a continuous time
feedback signal proportional to the time derivative of current and voltage. The current
and voltage signal could be directly taken from the output of the potentiostat and the
output of the control device was fed back to an internal adder of the potentiostat used in
the experiments.
Figure 4.2: Implementation of the control strategy.
The signal was differentiated using a RC differentiator whose output for an input y is
dyRCdt
(4.19)
The selected capacitor and resistance values were 0.47 µF and 470 Ω, respectively. Note
that our potentiostat current output is a voltage signal proportional to the current.
Therefore, a voltage differentiator was used for the current input. Because of this
conversion, the gain parameter β is not only dependent on the gain of the amplifier
behind the differentiator, but also on the conversion factor of the current to voltage
converter of the potentiostat.
4.3.2 Experimental procedure
The WE was a polycrystalline platinum disk, and all measurements were carried out in a
0.5 M H2SO4 electrolyte. The pre-treatment of the electrode is described in chapter 3,
section 3.4.1. The controller was interfaced with the potentiostat through a shielded
cable. As a high concentration of strong acidic electrolyte was used during the
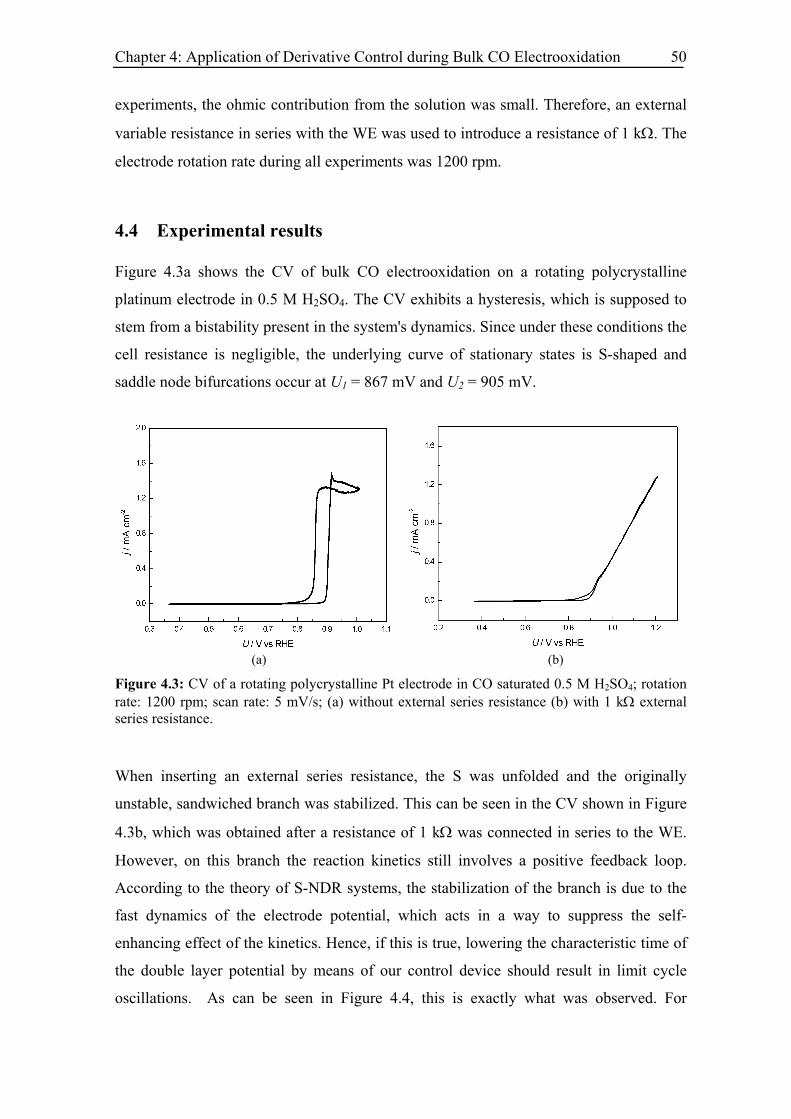
Chapter 4: Application of Derivative Control during Bulk CO Electrooxidation 50
experiments, the ohmic contribution from the solution was small. Therefore, an external
variable resistance in series with the WE was used to introduce a resistance of 1 kΩ. The
electrode rotation rate during all experiments was 1200 rpm.
4.4 Experimental results
Figure 4.3a shows the CV of bulk CO electrooxidation on a rotating polycrystalline
platinum electrode in 0.5 M H2SO4. The CV exhibits a hysteresis, which is supposed to
stem from a bistability present in the system's dynamics. Since under these conditions the
cell resistance is negligible, the underlying curve of stationary states is S-shaped and
saddle node bifurcations occur at U1 = 867 mV and U2 = 905 mV.
(a) (b)
Figure 4.3: CV of a rotating polycrystalline Pt electrode in CO saturated 0.5 M H2SO4; rotation rate: 1200 rpm; scan rate: 5 mV/s; (a) without external series resistance (b) with 1 kΩ external series resistance.
When inserting an external series resistance, the S was unfolded and the originally
unstable, sandwiched branch was stabilized. This can be seen in the CV shown in Figure
4.3b, which was obtained after a resistance of 1 kΩ was connected in series to the WE.
However, on this branch the reaction kinetics still involves a positive feedback loop.
According to the theory of S-NDR systems, the stabilization of the branch is due to the
fast dynamics of the electrode potential, which acts in a way to suppress the self-
enhancing effect of the kinetics. Hence, if this is true, lowering the characteristic time of
the double layer potential by means of our control device should result in limit cycle
oscillations. As can be seen in Figure 4.4, this is exactly what was observed. For
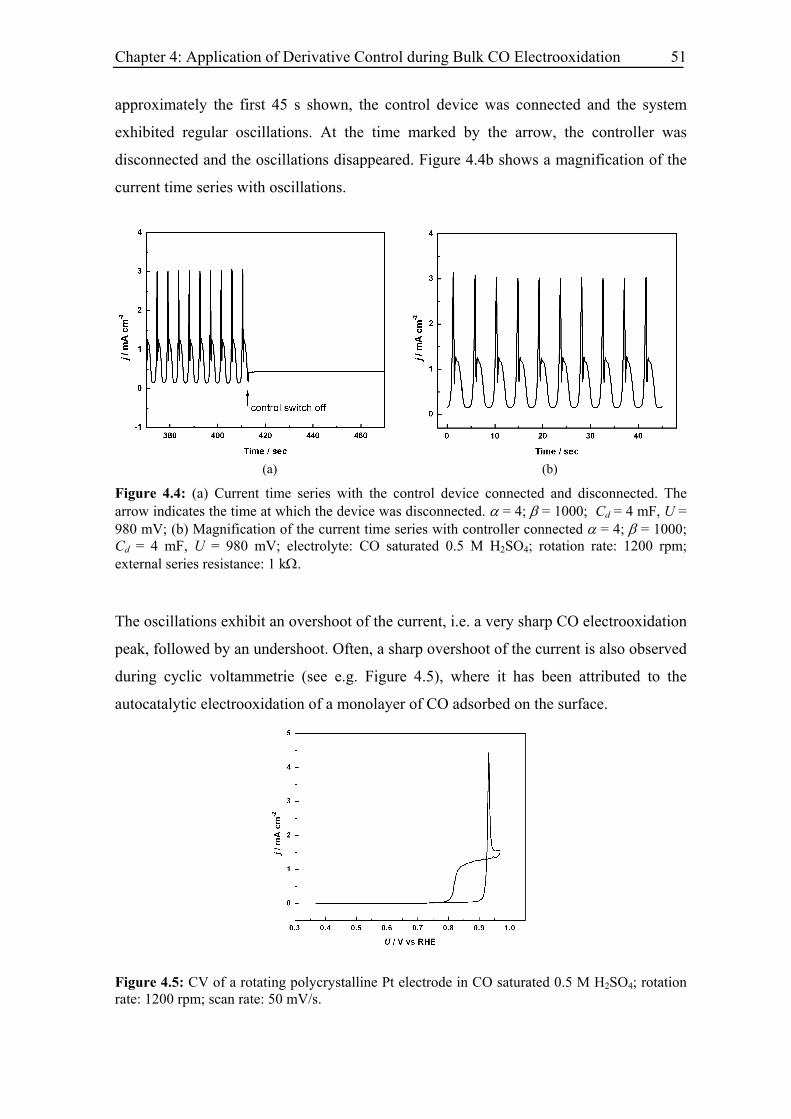
Chapter 4: Application of Derivative Control during Bulk CO Electrooxidation 51
approximately the first 45 s shown, the control device was connected and the system
exhibited regular oscillations. At the time marked by the arrow, the controller was
disconnected and the oscillations disappeared. Figure 4.4b shows a magnification of the
current time series with oscillations.
(a) (b)
Figure 4.4: (a) Current time series with the control device connected and disconnected. The arrow indicates the time at which the device was disconnected. α = 4; β = 1000; Cd = 4 mF, U = 980 mV; (b) Magnification of the current time series with controller connected α = 4; β = 1000; Cd = 4 mF, U = 980 mV; electrolyte: CO saturated 0.5 M H2SO4; rotation rate: 1200 rpm; external series resistance: 1 kΩ.
The oscillations exhibit an overshoot of the current, i.e. a very sharp CO electrooxidation
peak, followed by an undershoot. Often, a sharp overshoot of the current is also observed
during cyclic voltammetrie (see e.g. Figure 4.5), where it has been attributed to the
autocatalytic electrooxidation of a monolayer of CO adsorbed on the surface.
Figure 4.5: CV of a rotating polycrystalline Pt electrode in CO saturated 0.5 M H2SO4; rotation rate: 1200 rpm; scan rate: 50 mV/s.
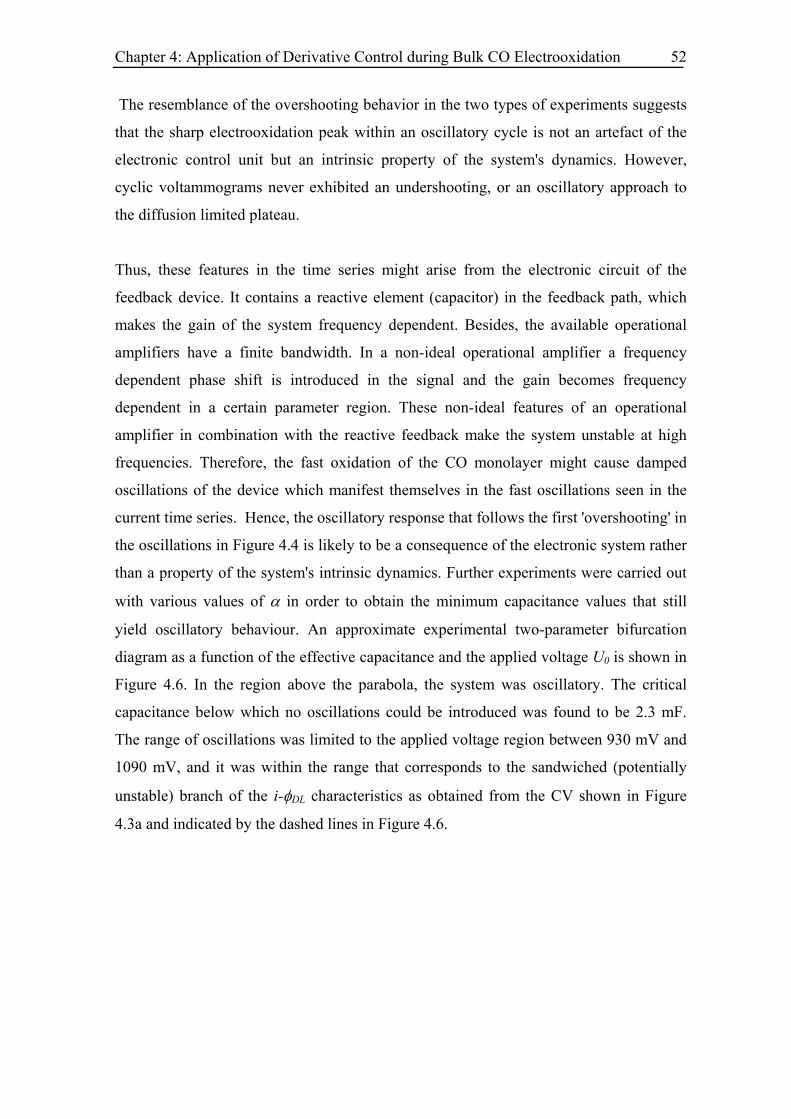
Chapter 4: Application of Derivative Control during Bulk CO Electrooxidation 52
The resemblance of the overshooting behavior in the two types of experiments suggests
that the sharp electrooxidation peak within an oscillatory cycle is not an artefact of the
electronic control unit but an intrinsic property of the system's dynamics. However,
cyclic voltammograms never exhibited an undershooting, or an oscillatory approach to
the diffusion limited plateau.
Thus, these features in the time series might arise from the electronic circuit of the
feedback device. It contains a reactive element (capacitor) in the feedback path, which
makes the gain of the system frequency dependent. Besides, the available operational
amplifiers have a finite bandwidth. In a non-ideal operational amplifier a frequency
dependent phase shift is introduced in the signal and the gain becomes frequency
dependent in a certain parameter region. These non-ideal features of an operational
amplifier in combination with the reactive feedback make the system unstable at high
frequencies. Therefore, the fast oxidation of the CO monolayer might cause damped
oscillations of the device which manifest themselves in the fast oscillations seen in the
current time series. Hence, the oscillatory response that follows the first 'overshooting' in
the oscillations in Figure 4.4 is likely to be a consequence of the electronic system rather
than a property of the system's intrinsic dynamics. Further experiments were carried out
with various values of α in order to obtain the minimum capacitance values that still
yield oscillatory behaviour. An approximate experimental two-parameter bifurcation
diagram as a function of the effective capacitance and the applied voltage U0 is shown in
Figure 4.6. In the region above the parabola, the system was oscillatory. The critical
capacitance below which no oscillations could be introduced was found to be 2.3 mF.
The range of oscillations was limited to the applied voltage region between 930 mV and
1090 mV, and it was within the range that corresponds to the sandwiched (potentially
unstable) branch of the i-φDL characteristics as obtained from the CV shown in Figure
4.3a and indicated by the dashed lines in Figure 4.6.
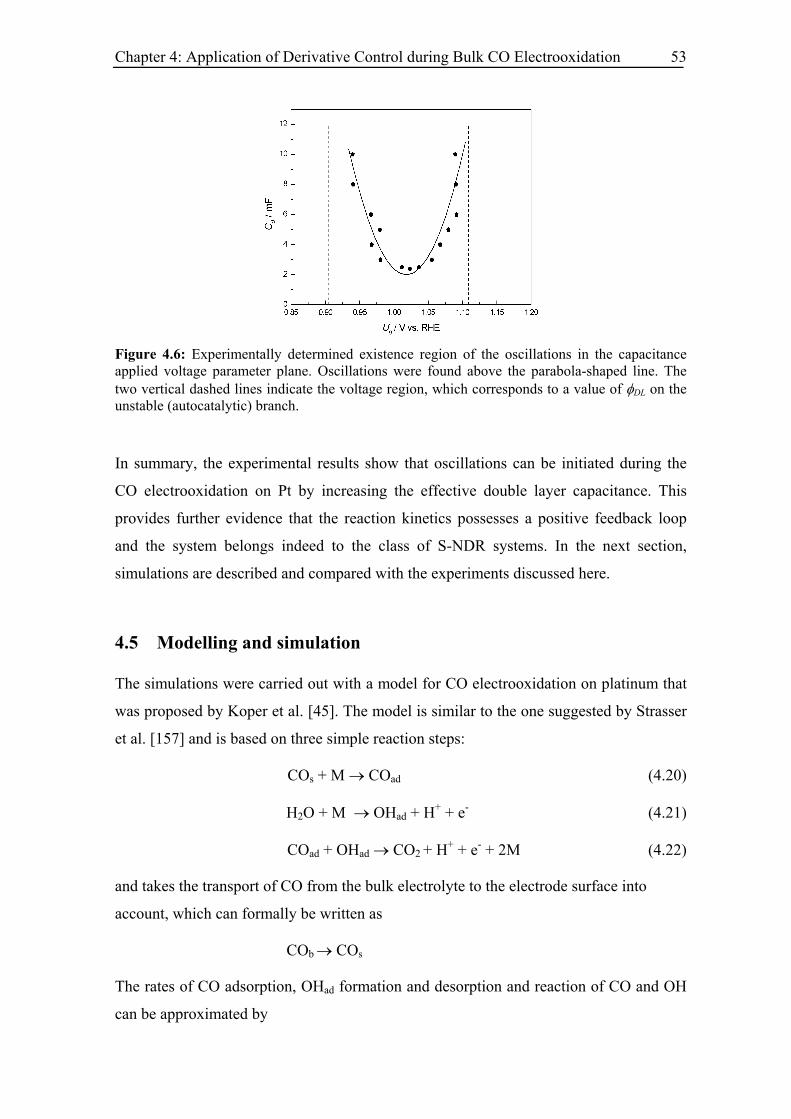
Chapter 4: Application of Derivative Control during Bulk CO Electrooxidation 53
Figure 4.6: Experimentally determined existence region of the oscillations in the capacitance applied voltage parameter plane. Oscillations were found above the parabola-shaped line. The two vertical dashed lines indicate the voltage region, which corresponds to a value of φDL on the unstable (autocatalytic) branch.
In summary, the experimental results show that oscillations can be initiated during the
CO electrooxidation on Pt by increasing the effective double layer capacitance. This
provides further evidence that the reaction kinetics possesses a positive feedback loop
and the system belongs indeed to the class of S-NDR systems. In the next section,
simulations are described and compared with the experiments discussed here.
4.5 Modelling and simulation
The simulations were carried out with a model for CO electrooxidation on platinum that
was proposed by Koper et al. [45]. The model is similar to the one suggested by Strasser
et al. [157] and is based on three simple reaction steps:
COs + M → COad (4.20)
H2O + M → OHad + H+ + e- (4.21)
COad + OHad → CO2 + H+ + e- + 2M (4.22)
and takes the transport of CO from the bulk electrolyte to the electrode surface into
account, which can formally be written as
COb → COs
The rates of CO adsorption, OHad formation and desorption and reaction of CO and OH
can be approximated by
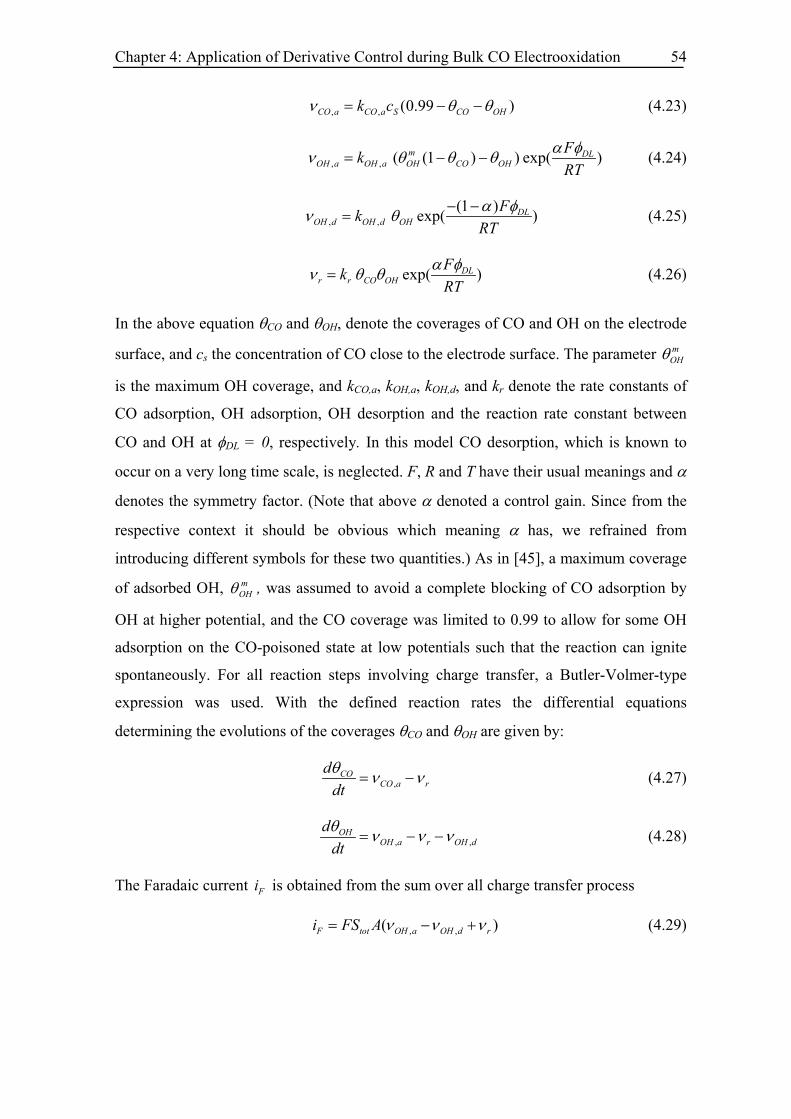
Chapter 4: Application of Derivative Control during Bulk CO Electrooxidation 54
, , (0.99 )CO a CO a S CO OHk cν θ θ= − − (4.23)
, , ( (1 ) ) exp( )m DLOH a OH a OH CO OH
FkRT
α φν θ θ θ= − − (4.24)
, ,(1 )exp( )DL
OH d OH d OHFk
RTα φν θ − −
= (4.25)
exp( )DLr r CO OH
FkRT
α φν θ θ= (4.26)
In the above equation θCO and θOH, denote the coverages of CO and OH on the electrode
surface, and cs the concentration of CO close to the electrode surface. The parameter mOHθ
is the maximum OH coverage, and kCO,a, kOH,a, kOH,d, and kr denote the rate constants of
CO adsorption, OH adsorption, OH desorption and the reaction rate constant between
CO and OH at φDL = 0, respectively. In this model CO desorption, which is known to
occur on a very long time scale, is neglected. F, R and T have their usual meanings and α
denotes the symmetry factor. (Note that above α denoted a control gain. Since from the
respective context it should be obvious which meaning α has, we refrained from
introducing different symbols for these two quantities.) As in [45], a maximum coverage
of adsorbed OH, , was assumed to avoid a complete blocking of CO adsorption by
OH at higher potential, and the CO coverage was limited to 0.99 to allow for some OH
adsorption on the CO-poisoned state at low potentials such that the reaction can ignite
spontaneously. For all reaction steps involving charge transfer, a Butler-Volmer-type
expression was used. With the defined reaction rates the differential equations
determining the evolutions of the coverages θ
mOHθ
CO and θOH are given by:
,CO
CO a rd
dtθ ν ν= − (4.27)
,OH
OH a r OH dd
dt ,θ ν ν ν= − − (4.28)
The Faradaic current i is obtained from the sum over all charge transfer process F
, ,(F tot OH a OH di FS A )rν ν ν= − + (4.29)
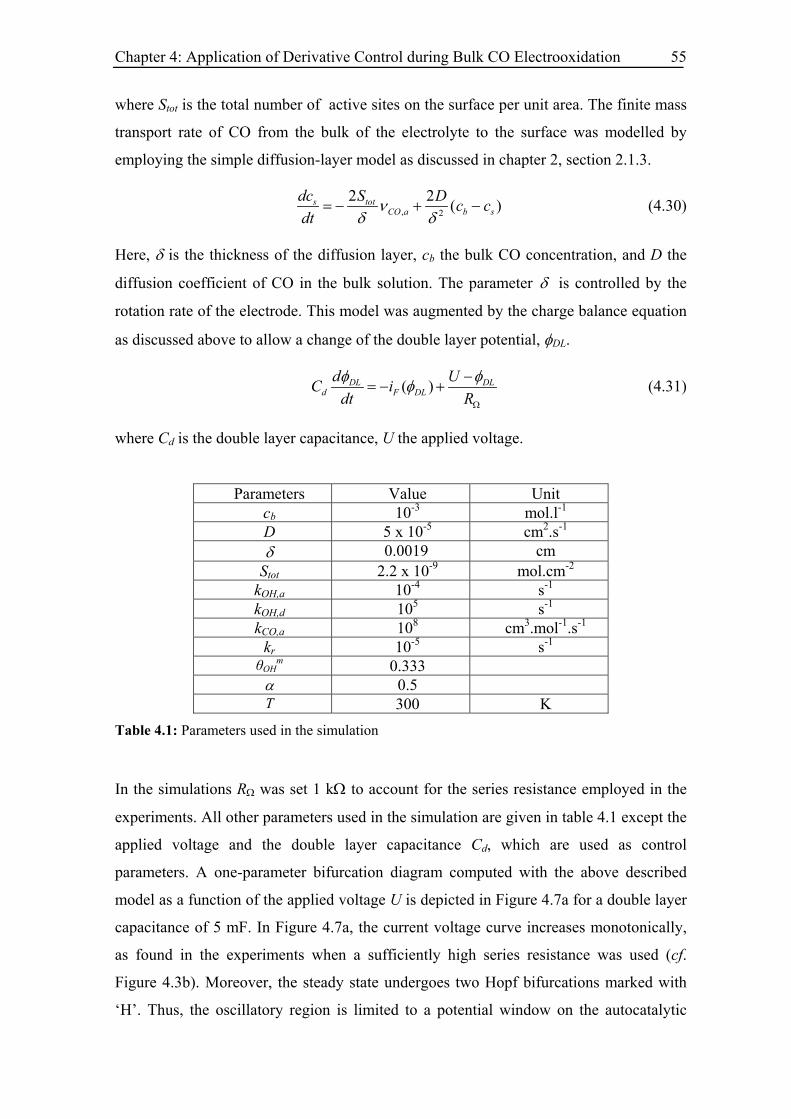
Chapter 4: Application of Derivative Control during Bulk CO Electrooxidation 55
where Stot is the total number of active sites on the surface per unit area. The finite mass
transport rate of CO from the bulk of the electrolyte to the surface was modelled by
employing the simple diffusion-layer model as discussed in chapter 2, section 2.1.3.
, 2
2 2 (s totCO a b s
dc S D c cdt
νδ δ
= − + − ) (4.30)
Here, δ is the thickness of the diffusion layer, cb the bulk CO concentration, and D the
diffusion coefficient of CO in the bulk solution. The parameter δ is controlled by the
rotation rate of the electrode. This model was augmented by the charge balance equation
as discussed above to allow a change of the double layer potential, φDL.
( )DLd F DL
dC idt R
DLUφ φφΩ
−= − + (4.31)
where Cd is the double layer capacitance, U the applied voltage.
Parameters Value Unit cb 10-3 mol.l-1
D 5 x 10⁻⁵ cm2.s-1
δ 0.0019 cm Stot 2.2 x 10⁻⁹ mol.cm-2
kOH,a 10-4 s-1
kOH,d 105 s-1
kCO,a 108 cm3.mol-1.s-1
kr 10-5 s-1
θOHm 0.333
α 0.5
T 300 K Table 4.1: Parameters used in the simulation
In the simulations RΩ was set 1 kΩ to account for the series resistance employed in the
experiments. All other parameters used in the simulation are given in table 4.1 except the
applied voltage and the double layer capacitance Cd, which are used as control
parameters. A one-parameter bifurcation diagram computed with the above described
model as a function of the applied voltage U is depicted in Figure 4.7a for a double layer
capacitance of 5 mF. In Figure 4.7a, the current voltage curve increases monotonically,
as found in the experiments when a sufficiently high series resistance was used (cf.
Figure 4.3b). Moreover, the steady state undergoes two Hopf bifurcations marked with
‘H’. Thus, the oscillatory region is limited to a potential window on the autocatalytic
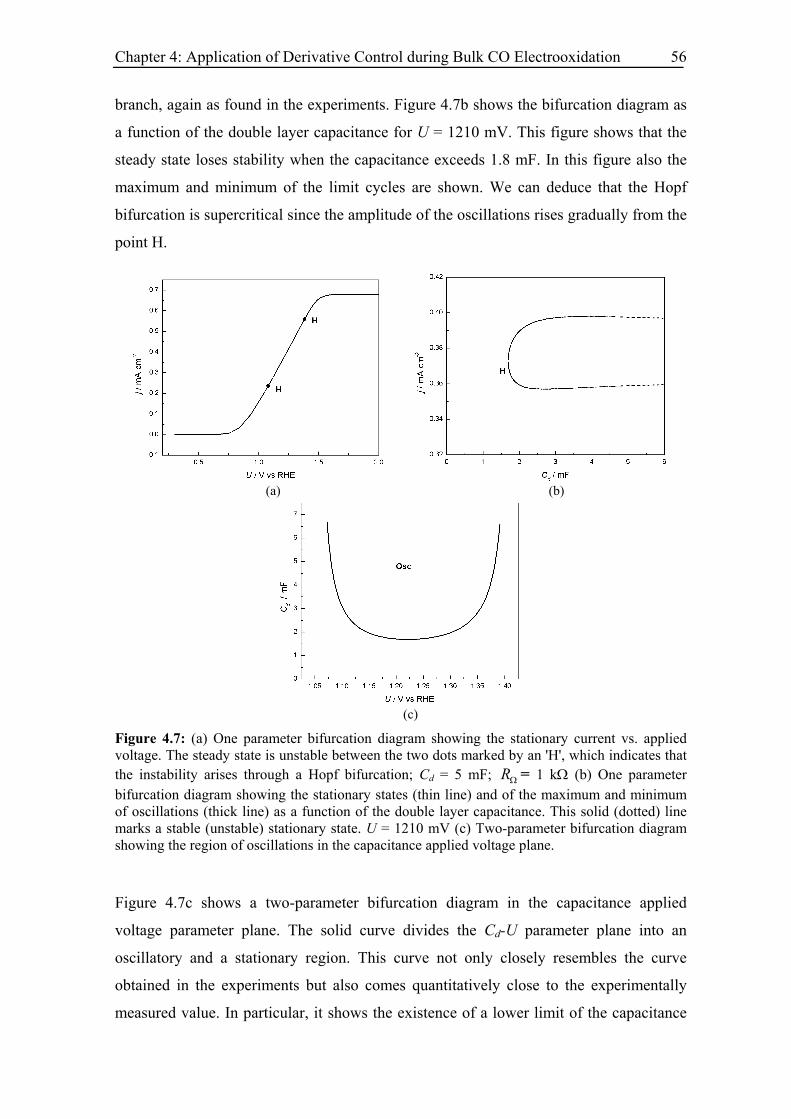
Chapter 4: Application of Derivative Control during Bulk CO Electrooxidation 56
branch, again as found in the experiments. Figure 4.7b shows the bifurcation diagram as
a function of the double layer capacitance for U = 1210 mV. This figure shows that the
steady state loses stability when the capacitance exceeds 1.8 mF. In this figure also the
maximum and minimum of the limit cycles are shown. We can deduce that the Hopf
bifurcation is supercritical since the amplitude of the oscillations rises gradually from the
point H.
(a) (b)
(c)
Figure 4.7: (a) One parameter bifurcation diagram showing the stationary current vs. applied voltage. The steady state is unstable between the two dots marked by an 'H', which indicates that the instability arises through a Hopf bifurcation; Cd = 5 mF; RΩ = 1 kΩ (b) One parameter bifurcation diagram showing the stationary states (thin line) and of the maximum and minimum of oscillations (thick line) as a function of the double layer capacitance. This solid (dotted) line marks a stable (unstable) stationary state. U = 1210 mV (c) Two-parameter bifurcation diagram showing the region of oscillations in the capacitance applied voltage plane.
Figure 4.7c shows a two-parameter bifurcation diagram in the capacitance applied
voltage parameter plane. The solid curve divides the Cd-U parameter plane into an
oscillatory and a stationary region. This curve not only closely resembles the curve
obtained in the experiments but also comes quantitatively close to the experimentally
measured value. In particular, it shows the existence of a lower limit of the capacitance
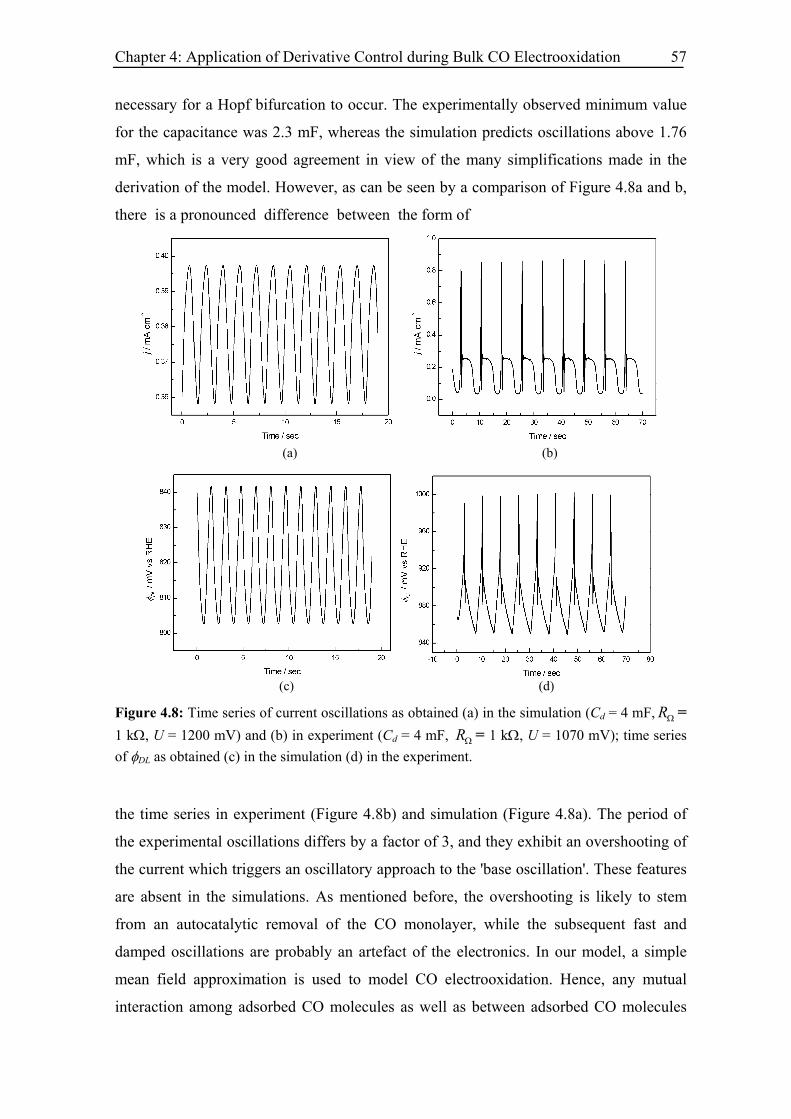
Chapter 4: Application of Derivative Control during Bulk CO Electrooxidation 57
necessary for a Hopf bifurcation to occur. The experimentally observed minimum value
for the capacitance was 2.3 mF, whereas the simulation predicts oscillations above 1.76
mF, which is a very good agreement in view of the many simplifications made in the
derivation of the model. However, as can be seen by a comparison of Figure 4.8a and b,
there is a pronounced difference between the form of
(a) (b)
(c) (d)
Figure 4.8: Time series of current oscillations as obtained (a) in the simulation (Cd = 4 mF, RΩ = 1 kΩ, U = 1200 mV) and (b) in experiment (Cd = 4 mF, RΩ = 1 kΩ, U = 1070 mV); time series of φDL as obtained (c) in the simulation (d) in the experiment.
the time series in experiment (Figure 4.8b) and simulation (Figure 4.8a). The period of
the experimental oscillations differs by a factor of 3, and they exhibit an overshooting of
the current which triggers an oscillatory approach to the 'base oscillation'. These features
are absent in the simulations. As mentioned before, the overshooting is likely to stem
from an autocatalytic removal of the CO monolayer, while the subsequent fast and
damped oscillations are probably an artefact of the electronics. In our model, a simple
mean field approximation is used to model CO electrooxidation. Hence, any mutual
interaction among adsorbed CO molecules as well as between adsorbed CO molecules
Chapter 4: Application of Derivative Control during Bulk CO Electrooxidation 58
and specifically adsorbed anions is neglected. In the experiments, it is however likely
that interactions between adsorbed species cause the overshooting of the current. This
conjecture is supported by the fact that the sharpness of the peak varies with the nature of
the anions in the solution. Therefore, we cannot expect that this feature is captured in the
simulations.
The simulated variation of the cell voltage with time is shown in Figure 4.8c. The cell
voltage changes periodically between 803 mV and 842 mV. Figure 4.8d shows the
experimental cell voltage, which has a triangular waveform with sharp spikes
superimposed. Apart from the spikes (which have the same origin as those in the
current), the voltage varied between 850 mV and 910 mV, which is similar in amplitude
as the simulated ones. Therefore, except for the first sharp increase in current density, the
simple mean field model used here reproduces the experimental findings, most
importantly the critical electrode capacitance above which the system becomes
oscillatory. This confirms the existence of a positive feedback loop in the kinetics of CO
electrooxidation, which might be also the source for other dynamic instabilities which
will be further investigated in the following chapters.
4.6 Summary
In this study, a derivative feedback control is used with an external electronic controller
to change the time scale of the activator variable of a dynamical system. More precisely,
we investigated the response of CO electrooxidation on platinum upon a change of the
effective capacitance. When the capacitance exceeds a critical value, oscillations could
be established. This confirms two basic properties of the dynamics of CO
electrooxidation discussed in the literature, namely that (a) the reaction mechanism
contains a positive (autocatalytic) feedback loop and (b) the double layer potential act as
an inhibitory variable.
Chapter 5: Effect of Low CO Concentration and Diluted Supporting Electrolyte 59
Chapter 5: Effect of Low CO Concentration
and Diluted Supporting Electrolyte
In the last chapter, the existence of a chemical autocatalytic feedback during CO
electrooxidation on Pt was proven. The chosen reaction conditions were typical
conditions for electrochemical experiments, which includes that the supporting
electrolyte has a high ionic strength. In this way, the iR-drop in the electrolyte is
minimized. However, anions from the electrolyte also interact with the electrode surface,
and thus influence the reaction kinetics and possibly also the reaction mechanism. Up to
now studies on CO electrooxidation assume that the interaction between adsorbed
species is through the competition of CO, OH, and possibly also anions for free surface
sites while interactions among adsorbed species are neglected. Since under the
considered conditions, the surface tends to be either fully CO covered (when the
electrode potential is negative to the onset of OH adsorption) or quasi-free of adsorbed
CO and OH (on the reactive branch) this conjecture is a good approximation. However,
at lower anion and/or CO concentrations the situation might be different. In particular, a
low concentration of both, CO dissolved in the electrolyte and supporting electrolyte,
might favour OH adsorption and thus enhance the rate of CO electrooxidation, which
constitutes a desirable situation. Furthermore, intermediate coverages might be
adjustable at lower CO and anion concentrations and cooperative effects between
adsorbed species that are hidden at high concentrations might become detectable. The
latter might alter the feedback loops of the system. Understanding CO electrooxidation in
wide concentration ranges of all the species involved in the reaction mechanism is thus
especially important for understanding and predicting dynamic instabilities in this
system. These considerations motivated the studies discussed in this chapter, namely
investigations of the impact of the concentrations of bulk CO and the supporting
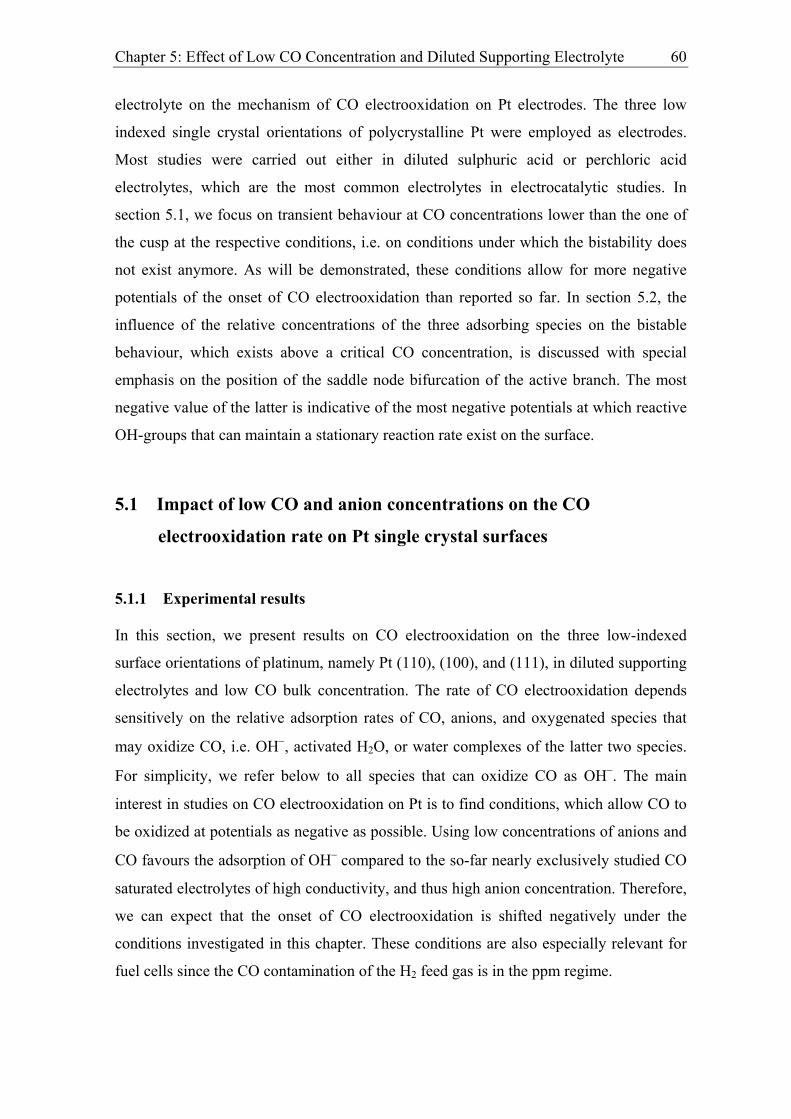
Chapter 5: Effect of Low CO Concentration and Diluted Supporting Electrolyte 60
electrolyte on the mechanism of CO electrooxidation on Pt electrodes. The three low
indexed single crystal orientations of polycrystalline Pt were employed as electrodes.
Most studies were carried out either in diluted sulphuric acid or perchloric acid
electrolytes, which are the most common electrolytes in electrocatalytic studies. In
section 5.1, we focus on transient behaviour at CO concentrations lower than the one of
the cusp at the respective conditions, i.e. on conditions under which the bistability does
not exist anymore. As will be demonstrated, these conditions allow for more negative
potentials of the onset of CO electrooxidation than reported so far. In section 5.2, the
influence of the relative concentrations of the three adsorbing species on the bistable
behaviour, which exists above a critical CO concentration, is discussed with special
emphasis on the position of the saddle node bifurcation of the active branch. The most
negative value of the latter is indicative of the most negative potentials at which reactive
OH-groups that can maintain a stationary reaction rate exist on the surface.
5.1 Impact of low CO and anion concentrations on the CO
electrooxidation rate on Pt single crystal surfaces
5.1.1 Experimental results
In this section, we present results on CO electrooxidation on the three low-indexed
surface orientations of platinum, namely Pt (110), (100), and (111), in diluted supporting
electrolytes and low CO bulk concentration. The rate of CO electrooxidation depends
sensitively on the relative adsorption rates of CO, anions, and oxygenated species that
may oxidize CO, i.e. OH−, activated H2O, or water complexes of the latter two species.
For simplicity, we refer below to all species that can oxidize CO as OH−. The main
interest in studies on CO electrooxidation on Pt is to find conditions, which allow CO to
be oxidized at potentials as negative as possible. Using low concentrations of anions and
CO favours the adsorption of OH− compared to the so-far nearly exclusively studied CO
saturated electrolytes of high conductivity, and thus high anion concentration. Therefore,
we can expect that the onset of CO electrooxidation is shifted negatively under the
conditions investigated in this chapter. These conditions are also especially relevant for
fuel cells since the CO contamination of the H2 feed gas is in the ppm regime.
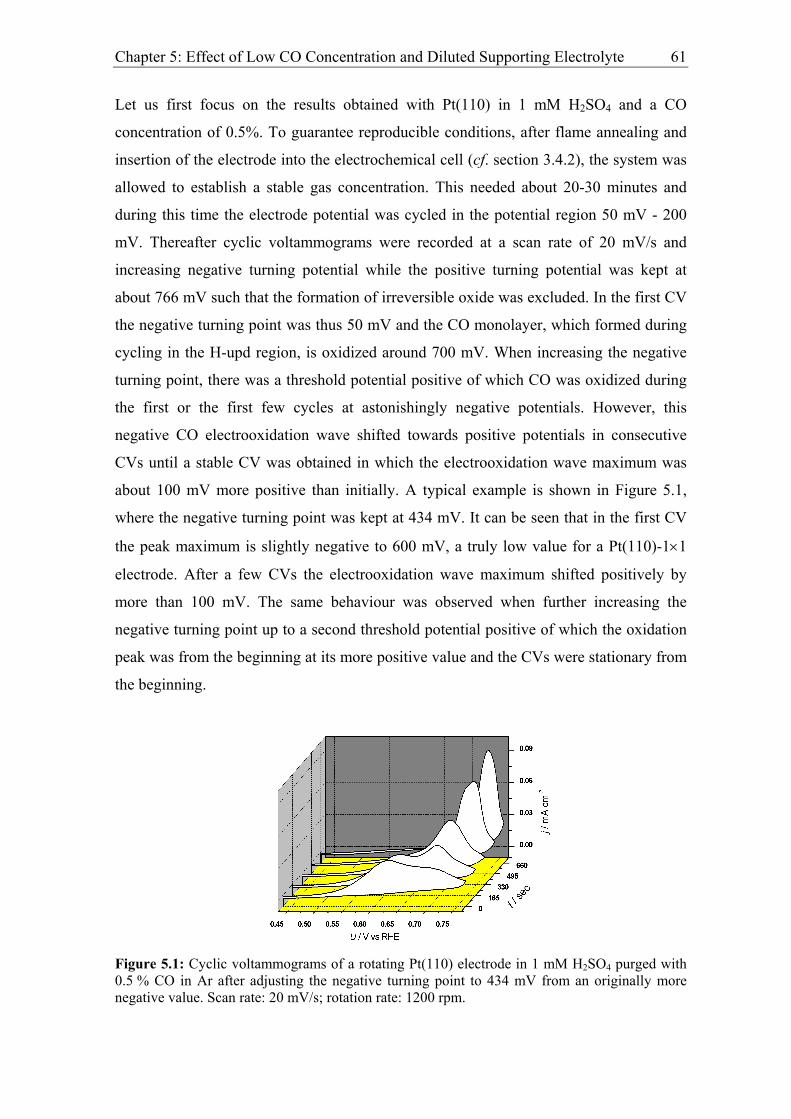
Chapter 5: Effect of Low CO Concentration and Diluted Supporting Electrolyte 61
Let us first focus on the results obtained with Pt(110) in 1 mM H2SO4 and a CO
concentration of 0.5%. To guarantee reproducible conditions, after flame annealing and
insertion of the electrode into the electrochemical cell (cf. section 3.4.2), the system was
allowed to establish a stable gas concentration. This needed about 20-30 minutes and
during this time the electrode potential was cycled in the potential region 50 mV - 200
mV. Thereafter cyclic voltammograms were recorded at a scan rate of 20 mV/s and
increasing negative turning potential while the positive turning potential was kept at
about 766 mV such that the formation of irreversible oxide was excluded. In the first CV
the negative turning point was thus 50 mV and the CO monolayer, which formed during
cycling in the H-upd region, is oxidized around 700 mV. When increasing the negative
turning point, there was a threshold potential positive of which CO was oxidized during
the first or the first few cycles at astonishingly negative potentials. However, this
negative CO electrooxidation wave shifted towards positive potentials in consecutive
CVs until a stable CV was obtained in which the electrooxidation wave maximum was
about 100 mV more positive than initially. A typical example is shown in Figure 5.1,
where the negative turning point was kept at 434 mV. It can be seen that in the first CV
the peak maximum is slightly negative to 600 mV, a truly low value for a Pt(110)-1×1
electrode. After a few CVs the electrooxidation wave maximum shifted positively by
more than 100 mV. The same behaviour was observed when further increasing the
negative turning point up to a second threshold potential positive of which the oxidation
peak was from the beginning at its more positive value and the CVs were stationary from
the beginning.
Figure 5.1: Cyclic voltammograms of a rotating Pt(110) electrode in 1 mM H2SO4 purged with 0.5 % CO in Ar after adjusting the negative turning point to 434 mV from an originally more negative value. Scan rate: 20 mV/s; rotation rate: 1200 rpm.
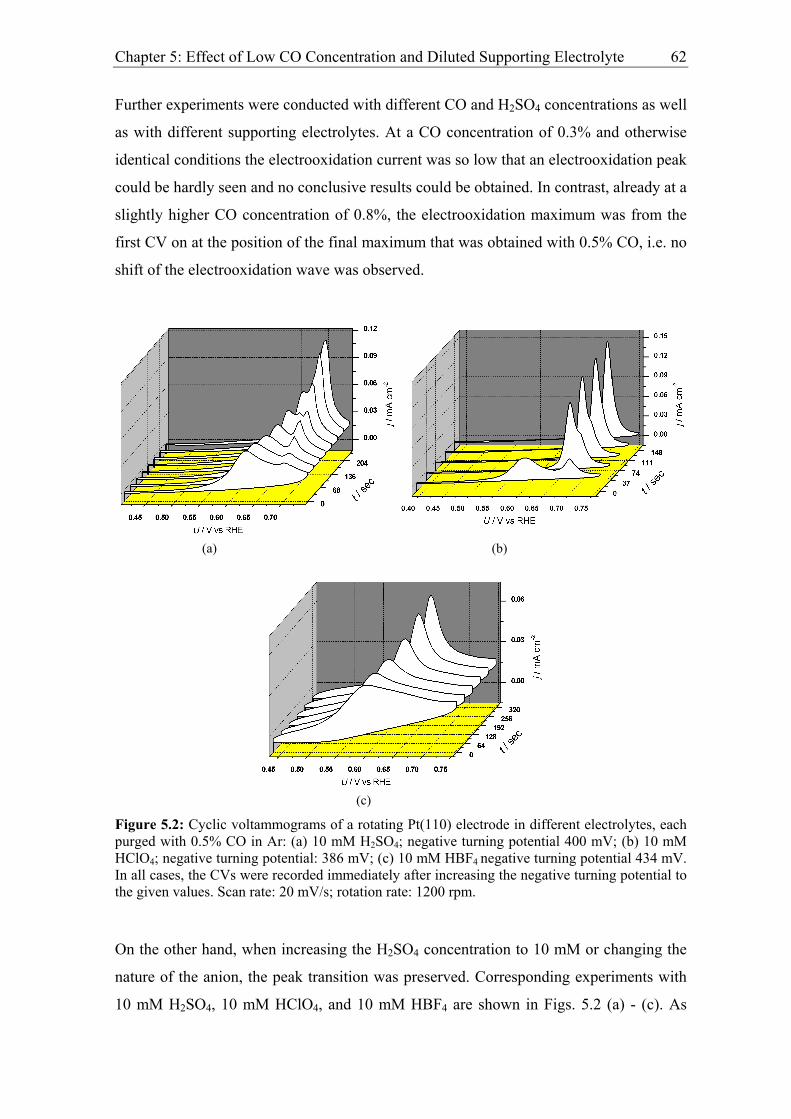
Chapter 5: Effect of Low CO Concentration and Diluted Supporting Electrolyte 62
Further experiments were conducted with different CO and H2SO4 concentrations as well
as with different supporting electrolytes. At a CO concentration of 0.3% and otherwise
identical conditions the electrooxidation current was so low that an electrooxidation peak
could be hardly seen and no conclusive results could be obtained. In contrast, already at a
slightly higher CO concentration of 0.8%, the electrooxidation maximum was from the
first CV on at the position of the final maximum that was obtained with 0.5% CO, i.e. no
shift of the electrooxidation wave was observed.
(a) (b)
(c)
Figure 5.2: Cyclic voltammograms of a rotating Pt(110) electrode in different electrolytes, each purged with 0.5% CO in Ar: (a) 10 mM H2SO4; negative turning potential 400 mV; (b) 10 mM HClO4; negative turning potential: 386 mV; (c) 10 mM HBF4 negative turning potential 434 mV. In all cases, the CVs were recorded immediately after increasing the negative turning potential to the given values. Scan rate: 20 mV/s; rotation rate: 1200 rpm.
On the other hand, when increasing the H2SO4 concentration to 10 mM or changing the
nature of the anion, the peak transition was preserved. Corresponding experiments with
10 mM H2SO4, 10 mM HClO4, and 10 mM HBF4 are shown in Figs. 5.2 (a) - (c). As
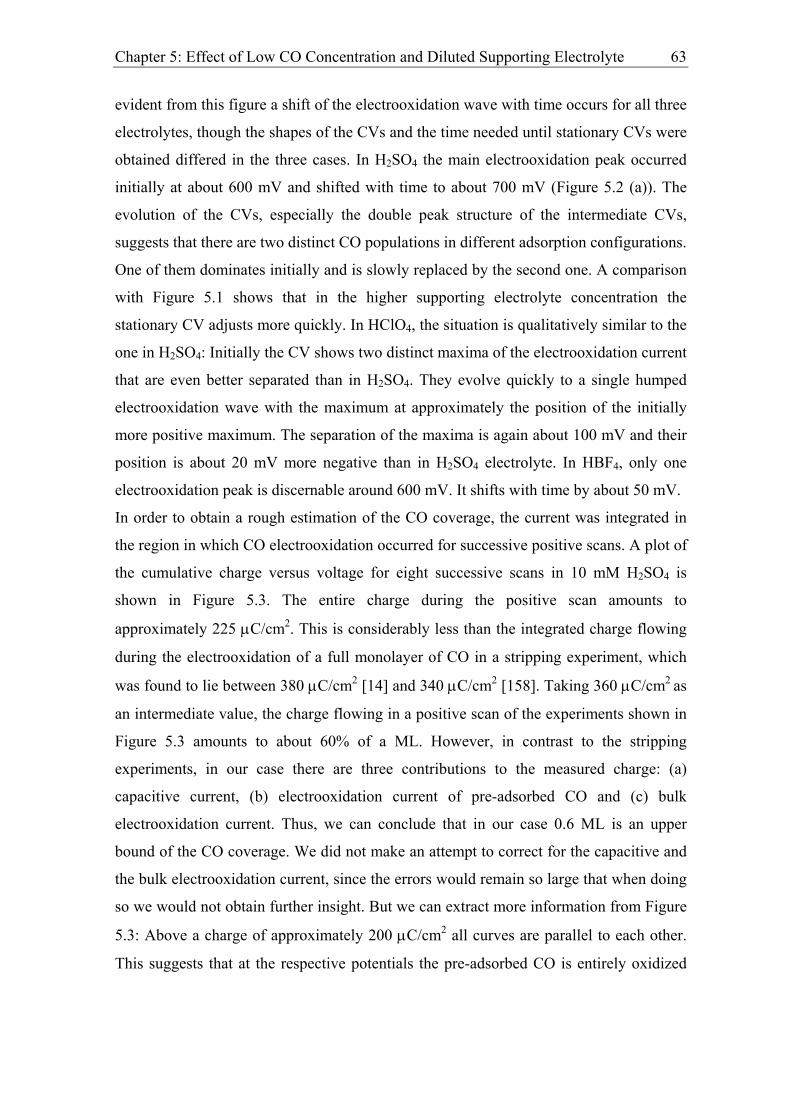
Chapter 5: Effect of Low CO Concentration and Diluted Supporting Electrolyte 63
evident from this figure a shift of the electrooxidation wave with time occurs for all three
electrolytes, though the shapes of the CVs and the time needed until stationary CVs were
obtained differed in the three cases. In H2SO4 the main electrooxidation peak occurred
initially at about 600 mV and shifted with time to about 700 mV (Figure 5.2 (a)). The
evolution of the CVs, especially the double peak structure of the intermediate CVs,
suggests that there are two distinct CO populations in different adsorption configurations.
One of them dominates initially and is slowly replaced by the second one. A comparison
with Figure 5.1 shows that in the higher supporting electrolyte concentration the
stationary CV adjusts more quickly. In HClO4, the situation is qualitatively similar to the
one in H2SO4: Initially the CV shows two distinct maxima of the electrooxidation current
that are even better separated than in H2SO4. They evolve quickly to a single humped
electrooxidation wave with the maximum at approximately the position of the initially
more positive maximum. The separation of the maxima is again about 100 mV and their
position is about 20 mV more negative than in H2SO4 electrolyte. In HBF4, only one
electrooxidation peak is discernable around 600 mV. It shifts with time by about 50 mV.
In order to obtain a rough estimation of the CO coverage, the current was integrated in
the region in which CO electrooxidation occurred for successive positive scans. A plot of
the cumulative charge versus voltage for eight successive scans in 10 mM H2SO4 is
shown in Figure 5.3. The entire charge during the positive scan amounts to
approximately 225 µC/cm2. This is considerably less than the integrated charge flowing
during the electrooxidation of a full monolayer of CO in a stripping experiment, which
was found to lie between 380 µC/cm2 [14] and 340 µC/cm2 [158]. Taking 360 µC/cm2 as
an intermediate value, the charge flowing in a positive scan of the experiments shown in
Figure 5.3 amounts to about 60% of a ML. However, in contrast to the stripping
experiments, in our case there are three contributions to the measured charge: (a)
capacitive current, (b) electrooxidation current of pre-adsorbed CO and (c) bulk
electrooxidation current. Thus, we can conclude that in our case 0.6 ML is an upper
bound of the CO coverage. We did not make an attempt to correct for the capacitive and
the bulk electrooxidation current, since the errors would remain so large that when doing
so we would not obtain further insight. But we can extract more information from Figure
5.3: Above a charge of approximately 200 µC/cm2 all curves are parallel to each other.
This suggests that at the respective potentials the pre-adsorbed CO is entirely oxidized
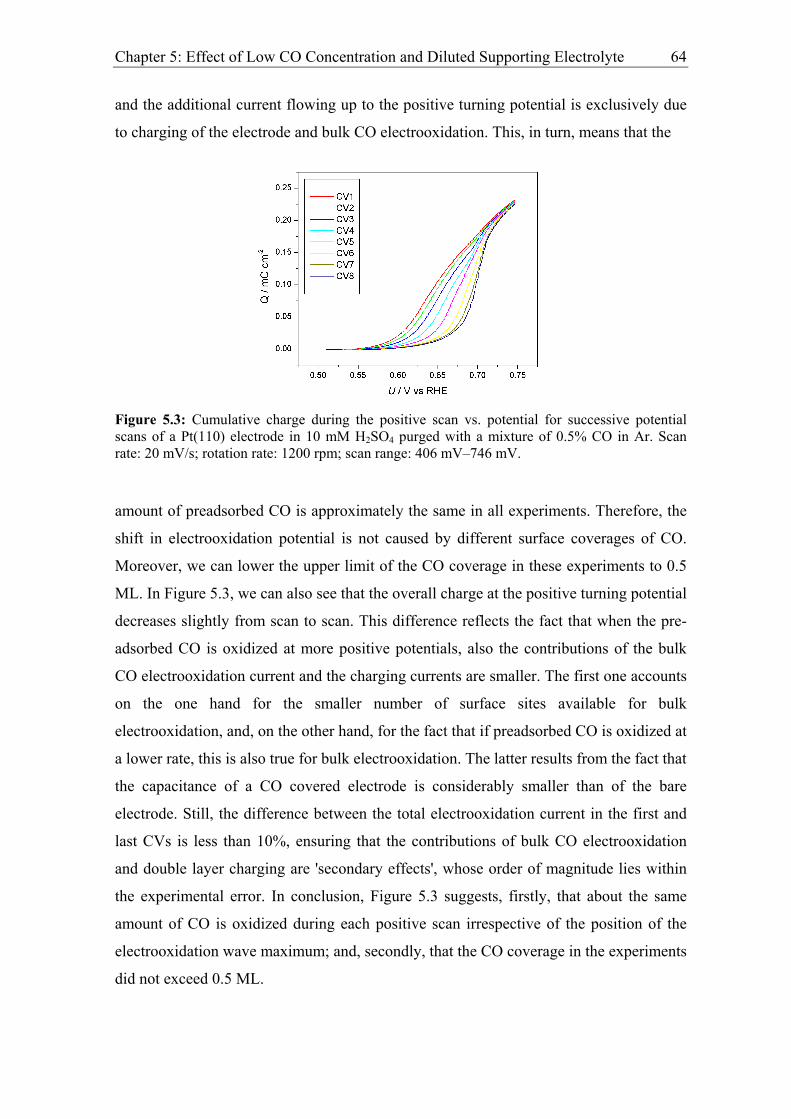
Chapter 5: Effect of Low CO Concentration and Diluted Supporting Electrolyte 64
and the additional current flowing up to the positive turning potential is exclusively due
to charging of the electrode and bulk CO electrooxidation. This, in turn, means that the
Figure 5.3: Cumulative charge during the positive scan vs. potential for successive potential scans of a Pt(110) electrode in 10 mM H2SO4 purged with a mixture of 0.5% CO in Ar. Scan rate: 20 mV/s; rotation rate: 1200 rpm; scan range: 406 mV–746 mV.
amount of preadsorbed CO is approximately the same in all experiments. Therefore, the
shift in electrooxidation potential is not caused by different surface coverages of CO.
Moreover, we can lower the upper limit of the CO coverage in these experiments to 0.5
ML. In Figure 5.3, we can also see that the overall charge at the positive turning potential
decreases slightly from scan to scan. This difference reflects the fact that when the pre-
adsorbed CO is oxidized at more positive potentials, also the contributions of the bulk
CO electrooxidation current and the charging currents are smaller. The first one accounts
on the one hand for the smaller number of surface sites available for bulk
electrooxidation, and, on the other hand, for the fact that if preadsorbed CO is oxidized at
a lower rate, this is also true for bulk electrooxidation. The latter results from the fact that
the capacitance of a CO covered electrode is considerably smaller than of the bare
electrode. Still, the difference between the total electrooxidation current in the first and
last CVs is less than 10%, ensuring that the contributions of bulk CO electrooxidation
and double layer charging are 'secondary effects', whose order of magnitude lies within
the experimental error. In conclusion, Figure 5.3 suggests, firstly, that about the same
amount of CO is oxidized during each positive scan irrespective of the position of the
electrooxidation wave maximum; and, secondly, that the CO coverage in the experiments
did not exceed 0.5 ML.
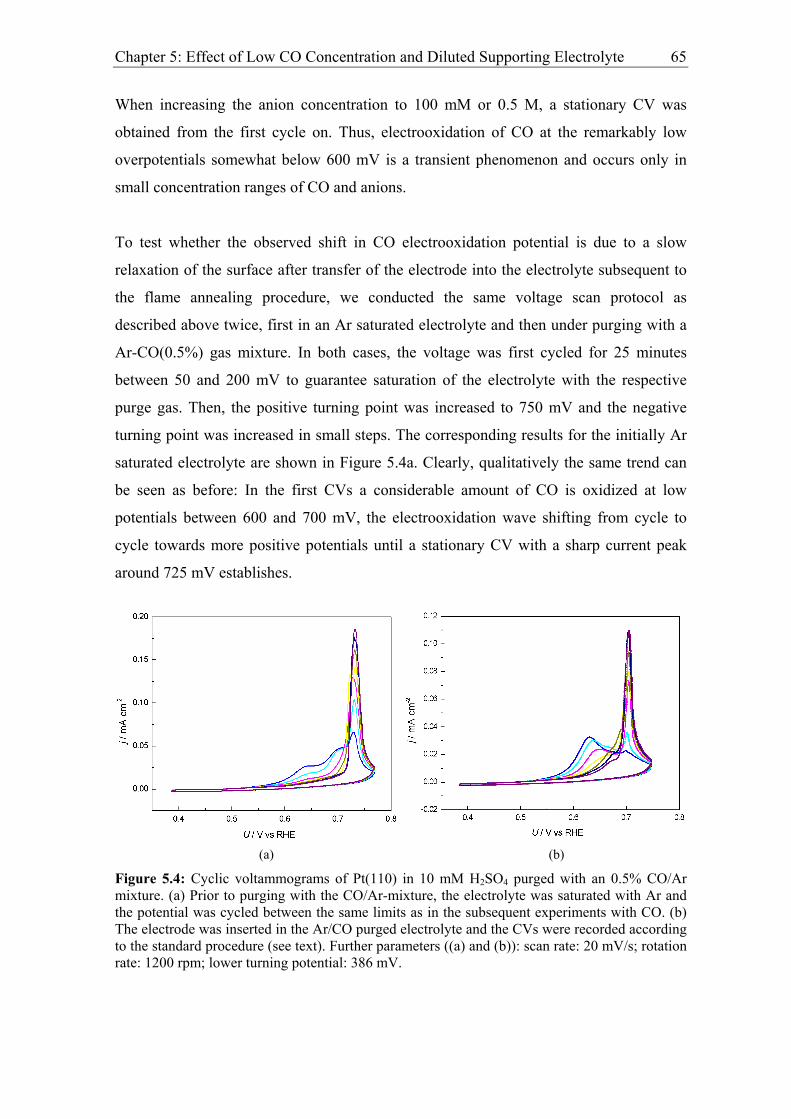
Chapter 5: Effect of Low CO Concentration and Diluted Supporting Electrolyte 65
When increasing the anion concentration to 100 mM or 0.5 M, a stationary CV was
obtained from the first cycle on. Thus, electrooxidation of CO at the remarkably low
overpotentials somewhat below 600 mV is a transient phenomenon and occurs only in
small concentration ranges of CO and anions.
To test whether the observed shift in CO electrooxidation potential is due to a slow
relaxation of the surface after transfer of the electrode into the electrolyte subsequent to
the flame annealing procedure, we conducted the same voltage scan protocol as
described above twice, first in an Ar saturated electrolyte and then under purging with a
Ar-CO(0.5%) gas mixture. In both cases, the voltage was first cycled for 25 minutes
between 50 and 200 mV to guarantee saturation of the electrolyte with the respective
purge gas. Then, the positive turning point was increased to 750 mV and the negative
turning point was increased in small steps. The corresponding results for the initially Ar
saturated electrolyte are shown in Figure 5.4a. Clearly, qualitatively the same trend can
be seen as before: In the first CVs a considerable amount of CO is oxidized at low
potentials between 600 and 700 mV, the electrooxidation wave shifting from cycle to
cycle towards more positive potentials until a stationary CV with a sharp current peak
around 725 mV establishes.
(a) (b)
Figure 5.4: Cyclic voltammograms of Pt(110) in 10 mM H2SO4 purged with an 0.5% CO/Ar mixture. (a) Prior to purging with the CO/Ar-mixture, the electrolyte was saturated with Ar and the potential was cycled between the same limits as in the subsequent experiments with CO. (b) The electrode was inserted in the Ar/CO purged electrolyte and the CVs were recorded according to the standard procedure (see text). Further parameters ((a) and (b)): scan rate: 20 mV/s; rotation rate: 1200 rpm; lower turning potential: 386 mV.
Chapter 5: Effect of Low CO Concentration and Diluted Supporting Electrolyte 66
For comparison, Figure 5.4b shows the corresponding experiment without first cycling in
Ar saturated electrolyte. It demonstrates that both experiments exhibit quantitative
differences: When first cycling the electrode in Ar-saturated electrolyte, the low-
potential electrooxidation wave is less pronounced in the first scan and shifts more
quickly towards positive potentials. This points to the fact that the surface is slightly
changing when the electrode is cycled in the inert electrolyte. However, the experiments
also show that this is a 'second order' effect rather than the primary origin of the peak
shift. When starting the potential cycles in the CO-containing electrolyte, the first CVs
are far from the stationary ones, the time from the insertion of the electrode in the
electrolyte being more than twice as long as the time it takes the system to establish a
stationary CV in a CO-containing electrolyte. Hence, a simple relaxation of the electrode
with time cannot be the main reason for the peak shift.
As already mentioned, the described 'peak transition phenomenon' occurred when
increasing the negative turning potential to values within a certain potential range. Also,
after a stationary cyclic voltammogram had adjusted, the same scenario reoccurred when
further increasing the negative turning point by a small amount up to some positive
potential limit. Figure 5.5a and 5.5b illustrate this observation. The blue and the red
curves are for lower turning potentials of 405 and 425 mV, respectively. First, the CVs
shown in blue were recorded. On the right, the first CV recorded after the negative
turning point was increased is shown and on the left the resulting stationary
voltammogram. After the latter had adjusted, the negative turning potential was
increased to 425 mV. Immediately afterwards the red curve in Figure 5.5a was measured.
With time, it converted to the red curve shown in Figure 5.5b, which again is a stationary
CV. This procedure could be repeated until a maximum value for the lower turning
potential was reached.
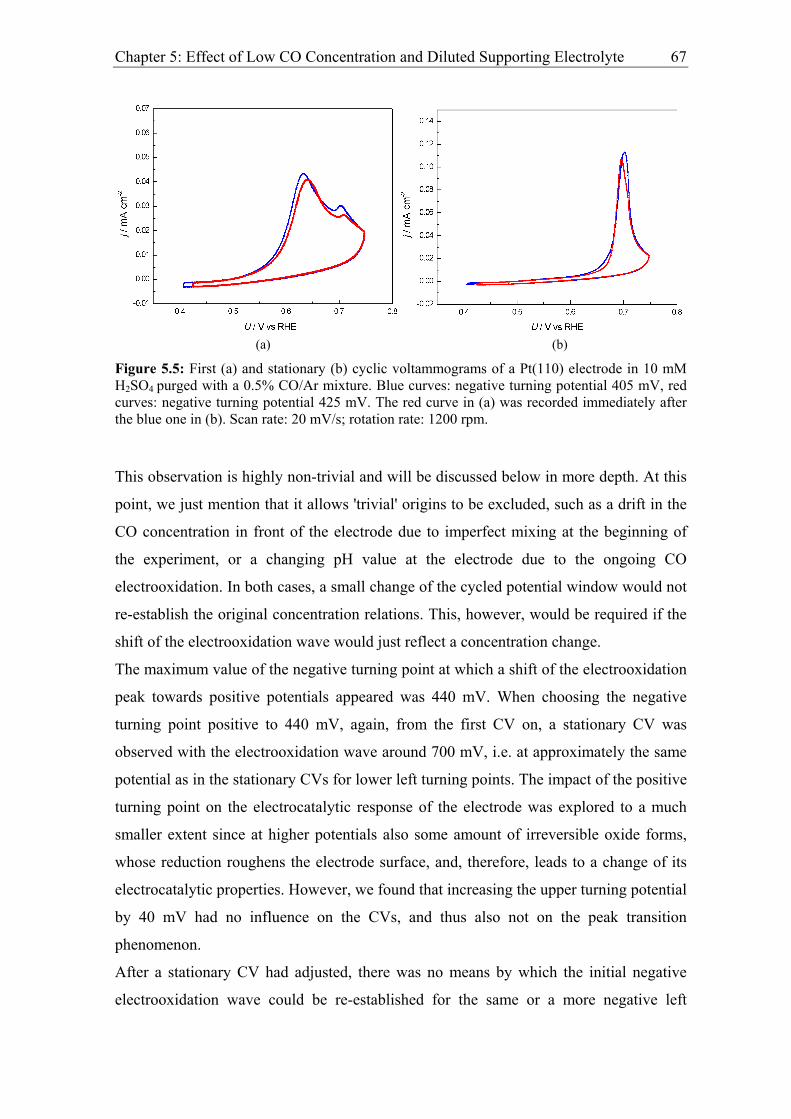
Chapter 5: Effect of Low CO Concentration and Diluted Supporting Electrolyte 67
(a) (b)
Figure 5.5: First (a) and stationary (b) cyclic voltammograms of a Pt(110) electrode in 10 mM H2SO4 purged with a 0.5% CO/Ar mixture. Blue curves: negative turning potential 405 mV, red curves: negative turning potential 425 mV. The red curve in (a) was recorded immediately after the blue one in (b). Scan rate: 20 mV/s; rotation rate: 1200 rpm.
This observation is highly non-trivial and will be discussed below in more depth. At this
point, we just mention that it allows 'trivial' origins to be excluded, such as a drift in the
CO concentration in front of the electrode due to imperfect mixing at the beginning of
the experiment, or a changing pH value at the electrode due to the ongoing CO
electrooxidation. In both cases, a small change of the cycled potential window would not
re-establish the original concentration relations. This, however, would be required if the
shift of the electrooxidation wave would just reflect a concentration change.
The maximum value of the negative turning point at which a shift of the electrooxidation
peak towards positive potentials appeared was 440 mV. When choosing the negative
turning point positive to 440 mV, again, from the first CV on, a stationary CV was
observed with the electrooxidation wave around 700 mV, i.e. at approximately the same
potential as in the stationary CVs for lower left turning points. The impact of the positive
turning point on the electrocatalytic response of the electrode was explored to a much
smaller extent since at higher potentials also some amount of irreversible oxide forms,
whose reduction roughens the electrode surface, and, therefore, leads to a change of its
electrocatalytic properties. However, we found that increasing the upper turning potential
by 40 mV had no influence on the CVs, and thus also not on the peak transition
phenomenon.
After a stationary CV had adjusted, there was no means by which the initial negative
electrooxidation wave could be re-established for the same or a more negative left
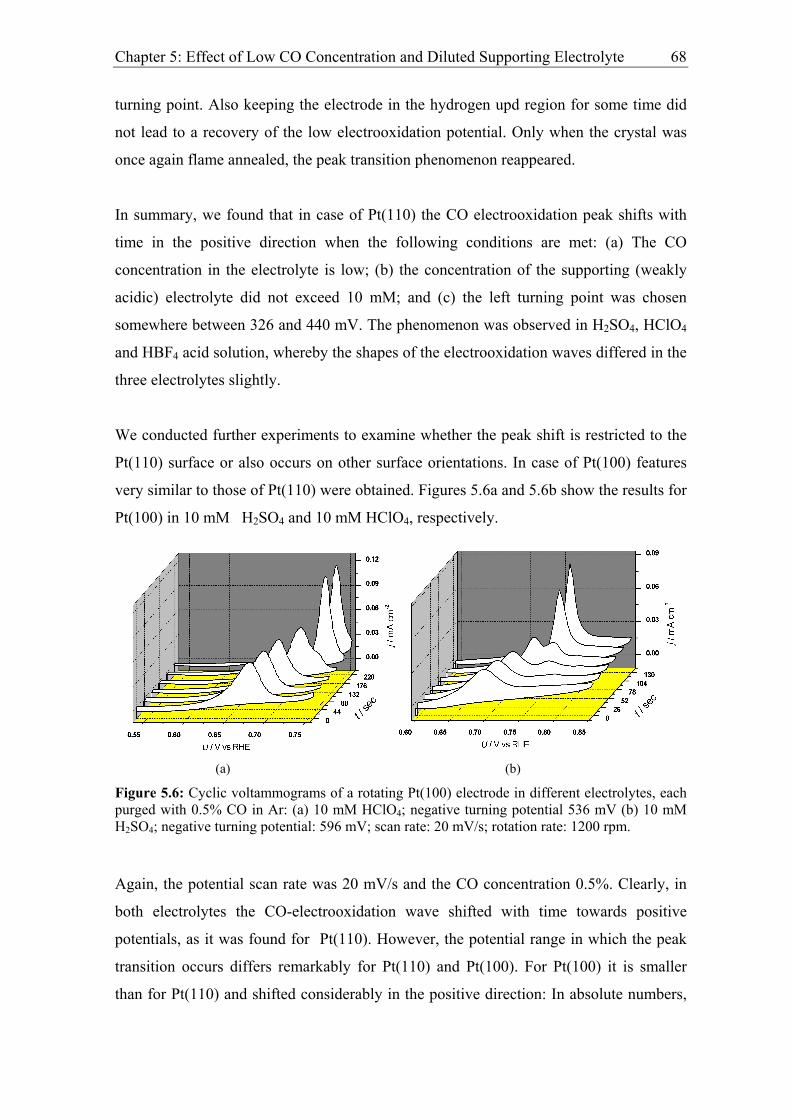
Chapter 5: Effect of Low CO Concentration and Diluted Supporting Electrolyte 68
turning point. Also keeping the electrode in the hydrogen upd region for some time did
not lead to a recovery of the low electrooxidation potential. Only when the crystal was
once again flame annealed, the peak transition phenomenon reappeared.
In summary, we found that in case of Pt(110) the CO electrooxidation peak shifts with
time in the positive direction when the following conditions are met: (a) The CO
concentration in the electrolyte is low; (b) the concentration of the supporting (weakly
acidic) electrolyte did not exceed 10 mM; and (c) the left turning point was chosen
somewhere between 326 and 440 mV. The phenomenon was observed in H2SO4, HClO4
and HBF4 acid solution, whereby the shapes of the electrooxidation waves differed in the
three electrolytes slightly.
We conducted further experiments to examine whether the peak shift is restricted to the
Pt(110) surface or also occurs on other surface orientations. In case of Pt(100) features
very similar to those of Pt(110) were obtained. Figures 5.6a and 5.6b show the results for
Pt(100) in 10 mM H2SO4 and 10 mM HClO4, respectively.
(a) (b)
Figure 5.6: Cyclic voltammograms of a rotating Pt(100) electrode in different electrolytes, each purged with 0.5% CO in Ar: (a) 10 mM HClO4; negative turning potential 536 mV (b) 10 mM H2SO4; negative turning potential: 596 mV; scan rate: 20 mV/s; rotation rate: 1200 rpm.
Again, the potential scan rate was 20 mV/s and the CO concentration 0.5%. Clearly, in
both electrolytes the CO-electrooxidation wave shifted with time towards positive
potentials, as it was found for Pt(110). However, the potential range in which the peak
transition occurs differs remarkably for Pt(110) and Pt(100). For Pt(100) it is smaller
than for Pt(110) and shifted considerably in the positive direction: In absolute numbers,
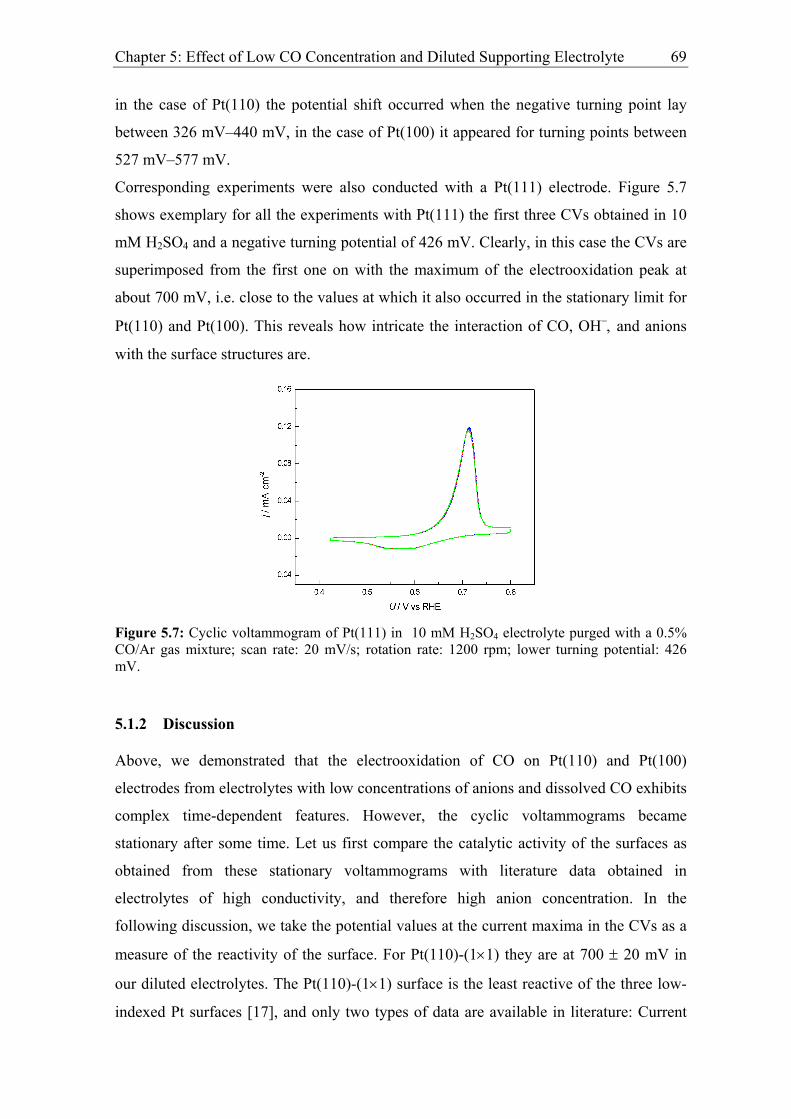
Chapter 5: Effect of Low CO Concentration and Diluted Supporting Electrolyte 69
in the case of Pt(110) the potential shift occurred when the negative turning point lay
between 326 mV–440 mV, in the case of Pt(100) it appeared for turning points between
527 mV–577 mV.
Corresponding experiments were also conducted with a Pt(111) electrode. Figure 5.7
shows exemplary for all the experiments with Pt(111) the first three CVs obtained in 10
mM H2SO4 and a negative turning potential of 426 mV. Clearly, in this case the CVs are
superimposed from the first one on with the maximum of the electrooxidation peak at
about 700 mV, i.e. close to the values at which it also occurred in the stationary limit for
Pt(110) and Pt(100). This reveals how intricate the interaction of CO, OH−, and anions
with the surface structures are.
Figure 5.7: Cyclic voltammogram of Pt(111) in 10 mM H2SO4 electrolyte purged with a 0.5% CO/Ar gas mixture; scan rate: 20 mV/s; rotation rate: 1200 rpm; lower turning potential: 426 mV.
5.1.2 Discussion
Above, we demonstrated that the electrooxidation of CO on Pt(110) and Pt(100)
electrodes from electrolytes with low concentrations of anions and dissolved CO exhibits
complex time-dependent features. However, the cyclic voltammograms became
stationary after some time. Let us first compare the catalytic activity of the surfaces as
obtained from these stationary voltammograms with literature data obtained in
electrolytes of high conductivity, and therefore high anion concentration. In the
following discussion, we take the potential values at the current maxima in the CVs as a
measure of the reactivity of the surface. For Pt(110)-(1×1) they are at 700 ± 20 mV in
our diluted electrolytes. The Pt(110)-(1×1) surface is the least reactive of the three low-
indexed Pt surfaces [17], and only two types of data are available in literature: Current
Chapter 5: Effect of Low CO Concentration and Diluted Supporting Electrolyte 70
voltage characteristics in CO-saturated, 0.5 M H2SO4, and so-called stripping
voltammograms [14]. The latter are obtained in the following way: Firstly, CO is
adsorbed for some time at a given potential from a CO-containing electrolyte (in most
cases CO-saturated solutions). Then, the electrolyte is purged with Ar to drive out all
dissolved CO. Finally, the adsorbed CO is oxidized during a voltage scan and the
corresponding electrooxidation current recorded. In case of CO-saturated H2SO4, the
surface remains completely inactive up to a potential of 880 mV, which is about 200 mV
more positive than in our case. In contrast, the stripping peak of a monolayer CO is
observed at about 720 mV, which is close to the current maximum in our stationary CVs.
Our working hypothesis is that CO electrooxidation proceeds through the Langmuir-
Hinshelwood mechanism, but CO and OH not only compete with each other for free
surface sites but also with anions. If we assume that the rate of CO adsorption is very low
for CO concentrations of 0.5% and can be neglected to a first approximation compared to
those of OH− and anions, we can deduce from the similar position of the current maxima
in the stripping experiments in 0.5 M H2SO4 and the 0.5% CO-bulk experiments in 1-10
mM H2SO4 that the concentration of the anions has only a minor influence. This can be
rationalized by two facts: Firstly, the adsorption strength of (H)SO4−(−) on Pt(110) and
(100) is much lower than on Pt(111) since the anion is bound only through 1 or 2 O
atoms as opposed to three in the case of Pt(111) [131, 159, 160]. Secondly, water
molecules are incorporated in the adsorbate layer of (H)SO4−(−), which can be oxidized.
Thus, the inhibiting effect of sulphate with respect to CO electrooxidation is much lower
than, for example, of halides. Thus, our experiments reveal (a) that at least for the
Pt(110)-(1×1) surface the stripping experiments mimic the conditions of low CO
concentration, as they might occur in a fuel cell, more closely than experiments with CO-
saturated electrolytes, and (b) that the electrooxidation occurs in the same potential
region for a full monolayer (as in the stripping experiment) and a partially covered
surface. The main difference between the corresponding voltammograms is that the
stripping peak is very sharp while for the lower CO coverage the electrooxidation peaks
extend over about 70 mV, the onset of electrooxidation being at somewhat more negative
potentials.
For Pt (100) the main stripping peak in 0.5 M H2SO4 has its maximum at 770 mV [17],
which again nearly coincides with the position of the maximum in our 10 mM H2SO4,
0.5% CO solution at 760 mV. Thus, also here the anion concentration seems to play only

Chapter 5: Effect of Low CO Concentration and Diluted Supporting Electrolyte 71
a minor role, and the low-CO concentration electrolytes behave similar to stripping
experiments. Contrarily, for CO saturated electrolytes the ignition potential at which CO
electrooxidation commences is at 950 mV, and thus nearly 200 mV more positive.
The situation seems to be different for Pt(111), though also more complicated and
somewhat controversial. Stripping experiments showed a dependence of the main
electrooxidation peak on the coverage. Feliu et al. [11] report that for full coverage the
stripping peak maximum occurs at 835 mV, while at coverages below 0.5 ML it lies 85
mV lower, i.e. at 750 mV. At intermediate coverages between 0.5 and 0.8 ML
voltammetric profiles with two maxima at 750 mV and 835 mV are found. They interpret
the results by the presence of two different types of CO island on the surface: At high
coverage wide compact CO islands form, with possibly large CO-free (111) domains in
between. At low coverages, the authors postulate a dispersion of small islands and small
CO-free domains. Markovic et al. [38] report a strong dependence of the position of the
stripping peak on the potential at which CO is preadsorbed. For a preadsorption potential
of 375 mV the main electrooxidation peak lies at 820 mV. It shifts to about 800 mV for
an adsorption potential of 150 mV, and it is lowest and splits into a bimodal stripping
peak when CO is preadsorbed at 0 V. Above we showed that under continuous potential
cycling between 400 and 800 mV in diluted sulphuric acid and 0.5% CO in the purge
gas, a stationary CV adjusts immediately with an electrooxidation peak at 700 mV. This
value is 120 mV more negative than the stripping peak for these adsorption potentials,
pointing to a strong influence of (bi)sulphate adsorption. Hence, for the surface at which
(bi)sulphate adsorbs most strongly a lower anion concentration considerably lowers the
electrooxidation potential of CO.
Next, let us discuss the shift of the electrooxidation potential with time. Above, we
showed that on Pt(110) and Pt(100) the first potential profiles after adjusting the negative
turning points of a cyclic voltammogram in a certain intermediate potential window
(coming from more negative turning points) exhibited a much better reactivity than after
some time. More precisely, the CO electrooxidation maxima were more than 100 mV
more negative. To obtain further insight into this pronounced initial reactivity increase
several parameters were varied. The most pronounced influence was found when varying
the concentrations. The negative electrooxidation currents only occurred for both, low
CO and low anion concentration. This suggests that one requirement for the low
Chapter 5: Effect of Low CO Concentration and Diluted Supporting Electrolyte 72
potentials is that the adsorption rate of OH− has to be large compared to those of CO and
anions. However, the ratio of these rates stays constant with time while the
electrooxidation peaks shifts negatively. Hence, other factors must be present as well.
We can exclude that it is a slow relaxation of the electrode surface after insertion of the
freshly flame annealed electrode into the electrolyte, since the initially negative
electrooxidation rates were also observed after treating the electrode at the same
potentials in an Ar purged electrolyte (cf. Figure 5.3). Furthermore, also a reaction
induced restructuring of the surface, or healing of reactive defects, seems to be unlikely,
since after a stationary current-potential profile adjusted when scanning within certain
potential limits, the low potential wave reappeared when increasing the negative turning
point slightly. Furthermore, for the same reason we can exclude that the shift in
electrooxidation potential is due to a slow change in the concentration of CO or the pH in
front of the electrode. Quite astonishingly, on Pt(110) also the nature of the anion did not
qualitatively alter the behaviour. (With Pt(100) and Pt(111) the experiments were only
done in sulphuric acid.) More precisely, we used perchlorate as prototypical anion that
adsorbs much more weakly than (H)SO4(−)− , and BF4
− as representative of a very
strongly adsorbing anion. Hence, the only common property of the different electrolytes
that exhibited the peak shift phenomenon seems to be the low concentration of anions,
which in turn determines the structure of the double layer. Therefore, we tentatively
propose that it is the double layer structure that lies at the bottom of the low
electrooxidation potentials. A change of the double layer structure with time then causes
the electrooxidation potential to shift positively. The slow shift might occur because of a
slow formation of water clusters, bonded via H-bonds, perhaps with anions incorporated
that are more resistant with regard to electrooxidation to adsorbed OHad than free double
layer water. This idea is in fact not completely new. That H-bonded water clusters might
present a barrier for water activation, though in a completely different environment than
here, had already been suggested in [26]. To prove this conjecture one would need to be
able to conduct in-situ vibrational spectroscopy, i.e. FTIR (Fourier Transform infrared
spectroscopy) or SFG (sum frequency generation). If our assumption were true the
bending mode of water, usually being at about 1640 cm-1 in an electrochemical
environment, would shift with time towards higher values due to strong lateral
interactions of the H2O molecules. Unfortunately, with single crystals both techniques
cannot be done under bulk electrooxidation conditions. Rather, one is restricted to a thin
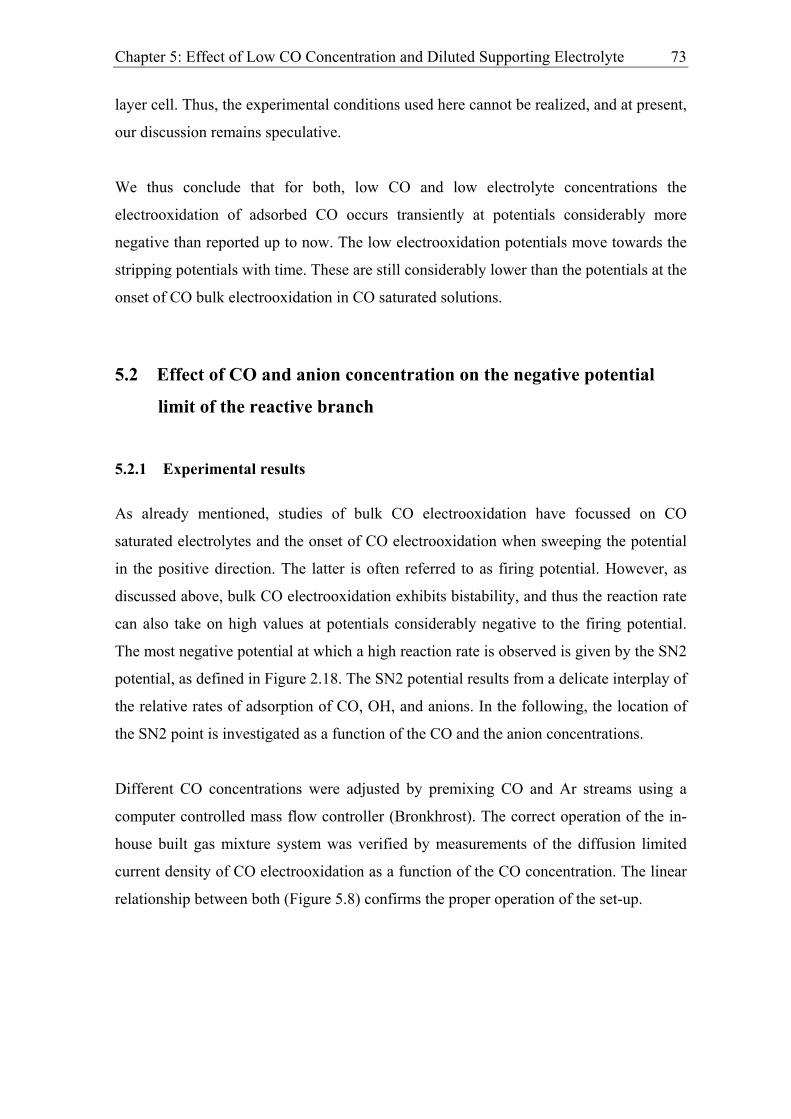
Chapter 5: Effect of Low CO Concentration and Diluted Supporting Electrolyte 73
layer cell. Thus, the experimental conditions used here cannot be realized, and at present,
our discussion remains speculative.
We thus conclude that for both, low CO and low electrolyte concentrations the
electrooxidation of adsorbed CO occurs transiently at potentials considerably more
negative than reported up to now. The low electrooxidation potentials move towards the
stripping potentials with time. These are still considerably lower than the potentials at the
onset of CO bulk electrooxidation in CO saturated solutions.
5.2 Effect of CO and anion concentration on the negative potential
limit of the reactive branch
5.2.1 Experimental results
As already mentioned, studies of bulk CO electrooxidation have focussed on CO
saturated electrolytes and the onset of CO electrooxidation when sweeping the potential
in the positive direction. The latter is often referred to as firing potential. However, as
discussed above, bulk CO electrooxidation exhibits bistability, and thus the reaction rate
can also take on high values at potentials considerably negative to the firing potential.
The most negative potential at which a high reaction rate is observed is given by the SN2
potential, as defined in Figure 2.18. The SN2 potential results from a delicate interplay of
the relative rates of adsorption of CO, OH, and anions. In the following, the location of
the SN2 point is investigated as a function of the CO and the anion concentrations.
Different CO concentrations were adjusted by premixing CO and Ar streams using a
computer controlled mass flow controller (Bronkhrost). The correct operation of the in-
house built gas mixture system was verified by measurements of the diffusion limited
current density of CO electrooxidation as a function of the CO concentration. The linear
relationship between both (Figure 5.8) confirms the proper operation of the set-up.
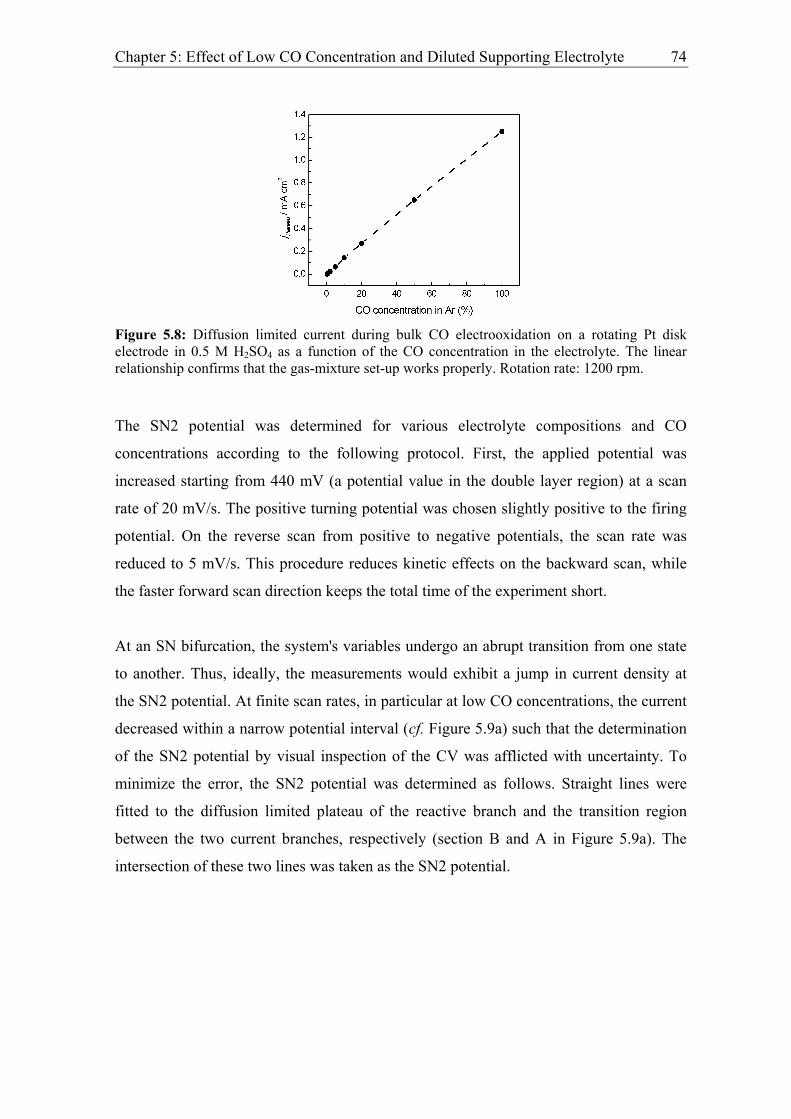
Chapter 5: Effect of Low CO Concentration and Diluted Supporting Electrolyte 74
Figure 5.8: Diffusion limited current during bulk CO electrooxidation on a rotating Pt disk electrode in 0.5 M H2SO4 as a function of the CO concentration in the electrolyte. The linear relationship confirms that the gas-mixture set-up works properly. Rotation rate: 1200 rpm.
The SN2 potential was determined for various electrolyte compositions and CO
concentrations according to the following protocol. First, the applied potential was
increased starting from 440 mV (a potential value in the double layer region) at a scan
rate of 20 mV/s. The positive turning potential was chosen slightly positive to the firing
potential. On the reverse scan from positive to negative potentials, the scan rate was
reduced to 5 mV/s. This procedure reduces kinetic effects on the backward scan, while
the faster forward scan direction keeps the total time of the experiment short.
At an SN bifurcation, the system's variables undergo an abrupt transition from one state
to another. Thus, ideally, the measurements would exhibit a jump in current density at
the SN2 potential. At finite scan rates, in particular at low CO concentrations, the current
decreased within a narrow potential interval (cf. Figure 5.9a) such that the determination
of the SN2 potential by visual inspection of the CV was afflicted with uncertainty. To
minimize the error, the SN2 potential was determined as follows. Straight lines were
fitted to the diffusion limited plateau of the reactive branch and the transition region
between the two current branches, respectively (section B and A in Figure 5.9a). The
intersection of these two lines was taken as the SN2 potential.
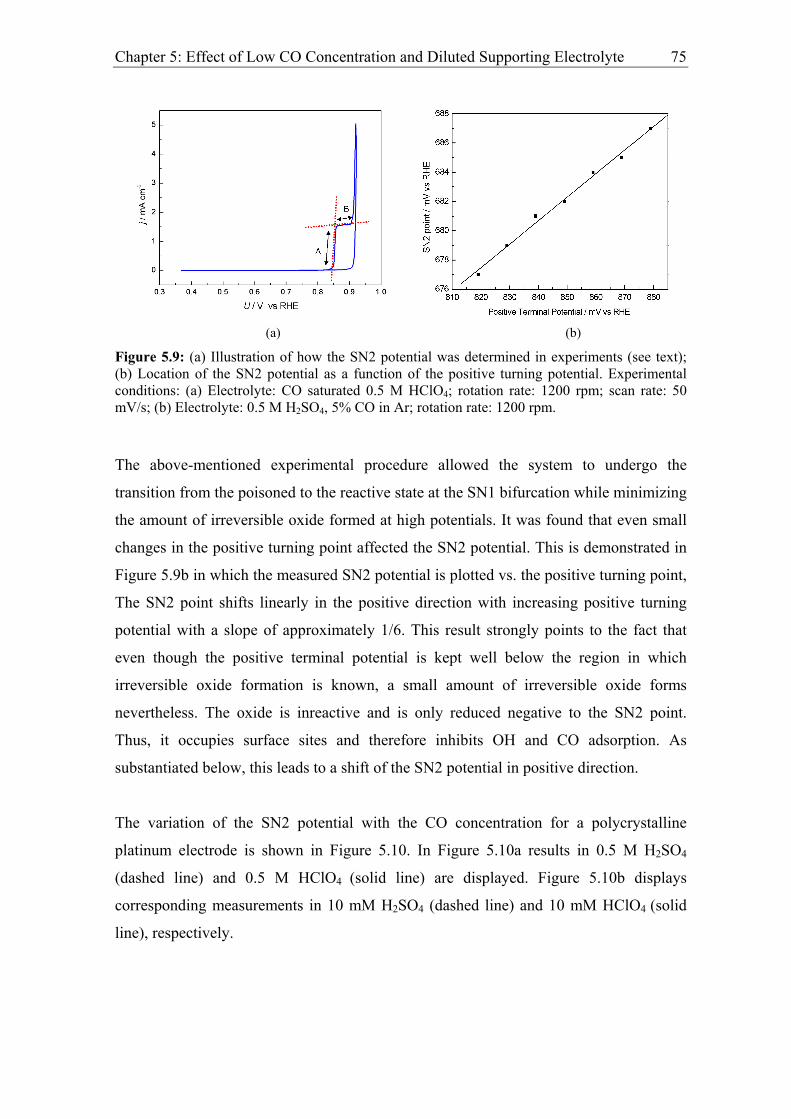
Chapter 5: Effect of Low CO Concentration and Diluted Supporting Electrolyte 75
(a) (b)
Figure 5.9: (a) Illustration of how the SN2 potential was determined in experiments (see text); (b) Location of the SN2 potential as a function of the positive turning potential. Experimental conditions: (a) Electrolyte: CO saturated 0.5 M HClO4; rotation rate: 1200 rpm; scan rate: 50 mV/s; (b) Electrolyte: 0.5 M H2SO4, 5% CO in Ar; rotation rate: 1200 rpm.
The above-mentioned experimental procedure allowed the system to undergo the
transition from the poisoned to the reactive state at the SN1 bifurcation while minimizing
the amount of irreversible oxide formed at high potentials. It was found that even small
changes in the positive turning point affected the SN2 potential. This is demonstrated in
Figure 5.9b in which the measured SN2 potential is plotted vs. the positive turning point,
The SN2 point shifts linearly in the positive direction with increasing positive turning
potential with a slope of approximately 1/6. This result strongly points to the fact that
even though the positive terminal potential is kept well below the region in which
irreversible oxide formation is known, a small amount of irreversible oxide forms
nevertheless. The oxide is inreactive and is only reduced negative to the SN2 point.
Thus, it occupies surface sites and therefore inhibits OH and CO adsorption. As
substantiated below, this leads to a shift of the SN2 potential in positive direction.
The variation of the SN2 potential with the CO concentration for a polycrystalline
platinum electrode is shown in Figure 5.10. In Figure 5.10a results in 0.5 M H2SO4
(dashed line) and 0.5 M HClO4 (solid line) are displayed. Figure 5.10b displays
corresponding measurements in 10 mM H2SO4 (dashed line) and 10 mM HClO4 (solid
line), respectively.
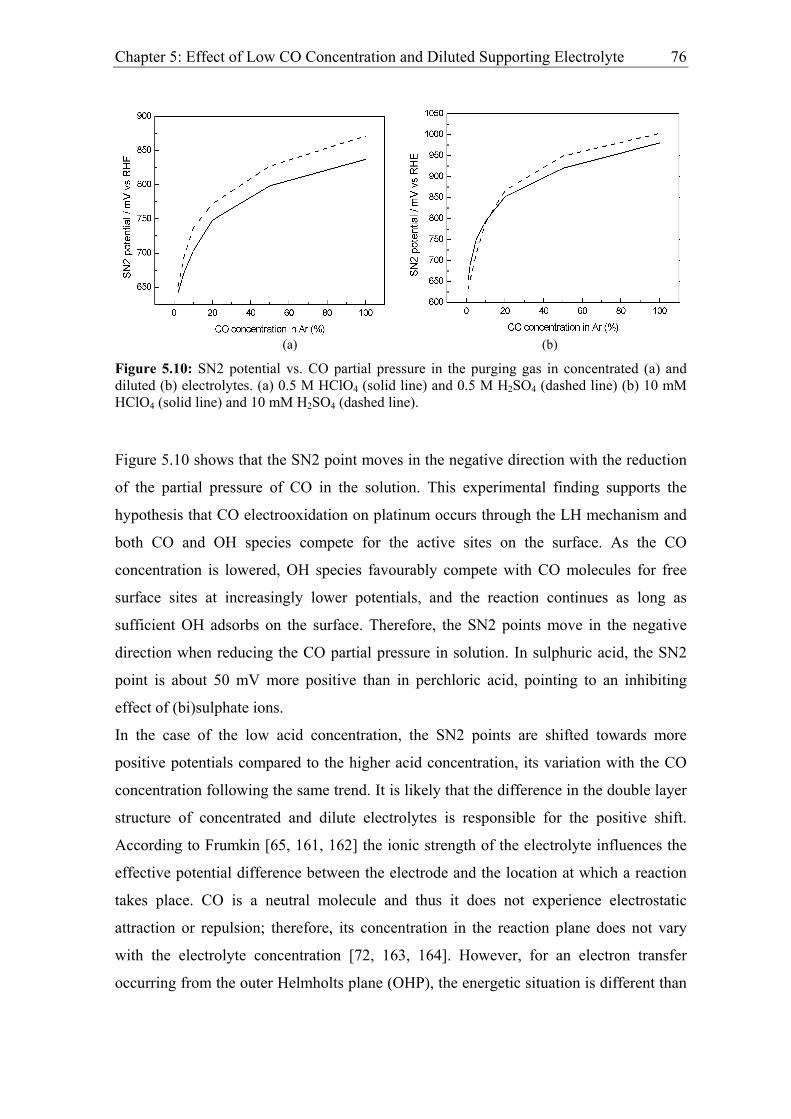
Chapter 5: Effect of Low CO Concentration and Diluted Supporting Electrolyte 76
(a) (b)
Figure 5.10: SN2 potential vs. CO partial pressure in the purging gas in concentrated (a) and diluted (b) electrolytes. (a) 0.5 M HClO4 (solid line) and 0.5 M H2SO4 (dashed line) (b) 10 mM HClO4 (solid line) and 10 mM H2SO4 (dashed line).
Figure 5.10 shows that the SN2 point moves in the negative direction with the reduction
of the partial pressure of CO in the solution. This experimental finding supports the
hypothesis that CO electrooxidation on platinum occurs through the LH mechanism and
both CO and OH species compete for the active sites on the surface. As the CO
concentration is lowered, OH species favourably compete with CO molecules for free
surface sites at increasingly lower potentials, and the reaction continues as long as
sufficient OH adsorbs on the surface. Therefore, the SN2 points move in the negative
direction when reducing the CO partial pressure in solution. In sulphuric acid, the SN2
point is about 50 mV more positive than in perchloric acid, pointing to an inhibiting
effect of (bi)sulphate ions.
In the case of the low acid concentration, the SN2 points are shifted towards more
positive potentials compared to the higher acid concentration, its variation with the CO
concentration following the same trend. It is likely that the difference in the double layer
structure of concentrated and dilute electrolytes is responsible for the positive shift.
According to Frumkin [65, 161, 162] the ionic strength of the electrolyte influences the
effective potential difference between the electrode and the location at which a reaction
takes place. CO is a neutral molecule and thus it does not experience electrostatic
attraction or repulsion; therefore, its concentration in the reaction plane does not vary
with the electrolyte concentration [72, 163, 164]. However, for an electron transfer
occurring from the outer Helmholts plane (OHP), the energetic situation is different than

Chapter 5: Effect of Low CO Concentration and Diluted Supporting Electrolyte 77
inthe bulk of the solution because of the potential drop 2φ across the diffuse layer.
Therefore, the rate of reaction is not controlled by the potential difference between the
electrode and the bulk electrolyte, U, but by the amount U- 2φ , and the rate equation
(equation (2.20) in chapter 2) for the forward reaction becomes
2 0( ) /"0 0
nF U U RTi nAFk C e α φ− − −= (5.1)
The symbols in the above equation are explained in chapter 2, section 2.1.2. The above
discussion is valid in the absence of specific adsorption. In the presence of specific
adsorption the potential 2φ is altered further, depending upon the amount of specifically
adsorbed species [65], adding further ambiguity in the value of the potential in the
reaction plane [165-167].
The influence of double layer effects can be avoided if the conductivity of the electrolyte
is kept constant. Thus, in the following experiments the influence of adsorption of
(bi)sulphate ions on bulk CO electrooxidation was investigated using supporting
electrolytes that contained different amounts of H2SO4 and HClO4 but a constant total
anion concentration of 0.5 M. Figure 5.11a shows the variation of the SN2 point as a
function of the ratio of sulphuric and perchloric acid (100% = 0.5 M H2SO4) for CO
saturated electrolytes and a polycrystalline Pt electrode. The differently coloured points
correspond to different sets of experiments. It is striking that the reproducibility of the
experiments was quite poor, identical experimental conditions yielding an uncertainty of
the SN2 potential up to 40 mV. This indicates that the SN2 point very sensitively
depends on the state of the surface. Still, all of the experiments exhibited a clear trend:
The SN2 point moved in the positive direction by about 70 mV when going from pure
HClO4 to an electrolyte containing 5% H2SO4, but remained approximately constant
when the H2SO4 concentration was further increased up to 100 %.
The experiments were repeated with Pt(111) for two reasons: First, the adsorption
strength of (bi)sulphate varies strongly on the three low-indexed Pt surfaces. It is much
stronger on Pt(111) than on the other orientations [168]. Thus, the error observed with
polycrystalline platinum might result from a different distribution of the various
crystallographic surface orientations at different days. If this is true it should be smaller
with Pt(111). Second, for Pt(111) adsorption isotherms of (bi) sulphate are available
facilitating a quantitative interpretation. Before each individual experiment, the single
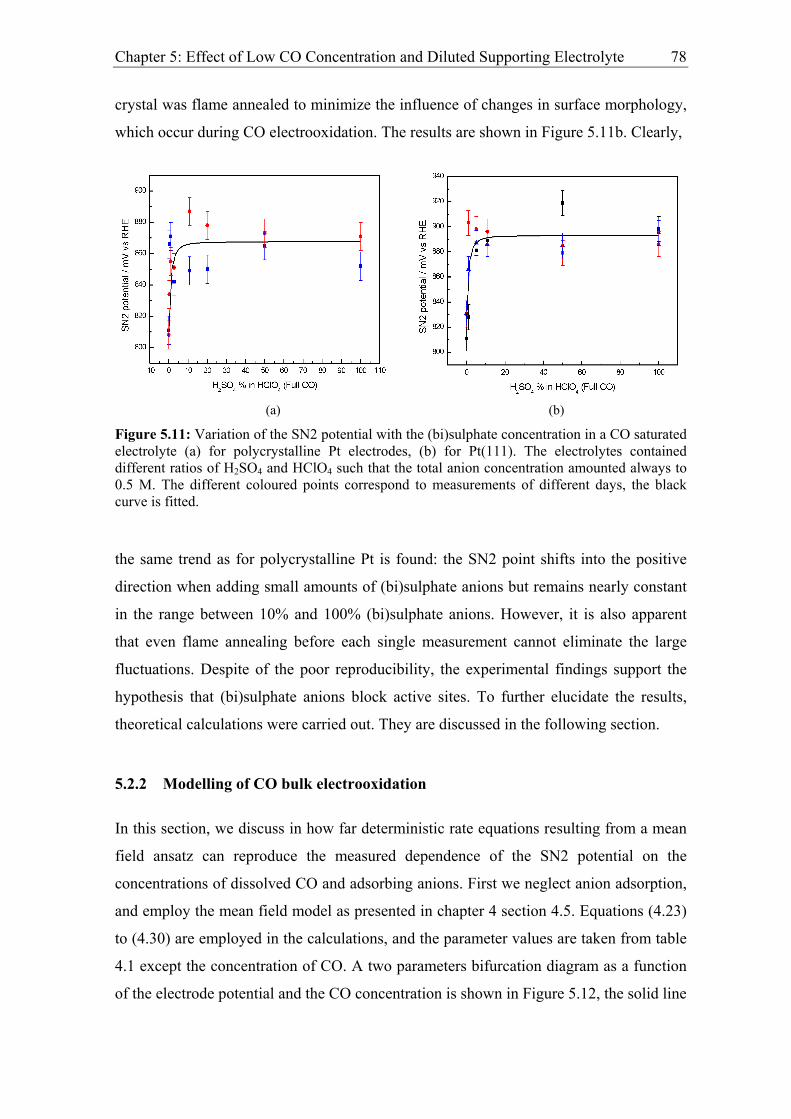
Chapter 5: Effect of Low CO Concentration and Diluted Supporting Electrolyte 78
crystal was flame annealed to minimize the influence of changes in surface morphology,
which occur during CO electrooxidation. The results are shown in Figure 5.11b. Clearly,
(a) (b)
Figure 5.11: Variation of the SN2 potential with the (bi)sulphate concentration in a CO saturated electrolyte (a) for polycrystalline Pt electrodes, (b) for Pt(111). The electrolytes contained different ratios of H2SO4 and HClO4 such that the total anion concentration amounted always to 0.5 M. The different coloured points correspond to measurements of different days, the black curve is fitted.
the same trend as for polycrystalline Pt is found: the SN2 point shifts into the positive
direction when adding small amounts of (bi)sulphate anions but remains nearly constant
in the range between 10% and 100% (bi)sulphate anions. However, it is also apparent
that even flame annealing before each single measurement cannot eliminate the large
fluctuations. Despite of the poor reproducibility, the experimental findings support the
hypothesis that (bi)sulphate anions block active sites. To further elucidate the results,
theoretical calculations were carried out. They are discussed in the following section.
5.2.2 Modelling of CO bulk electrooxidation
In this section, we discuss in how far deterministic rate equations resulting from a mean
field ansatz can reproduce the measured dependence of the SN2 potential on the
concentrations of dissolved CO and adsorbing anions. First we neglect anion adsorption,
and employ the mean field model as presented in chapter 4 section 4.5. Equations (4.23)
to (4.30) are employed in the calculations, and the parameter values are taken from table
4.1 except the concentration of CO. A two parameters bifurcation diagram as a function
of the electrode potential and the CO concentration is shown in Figure 5.12, the solid line
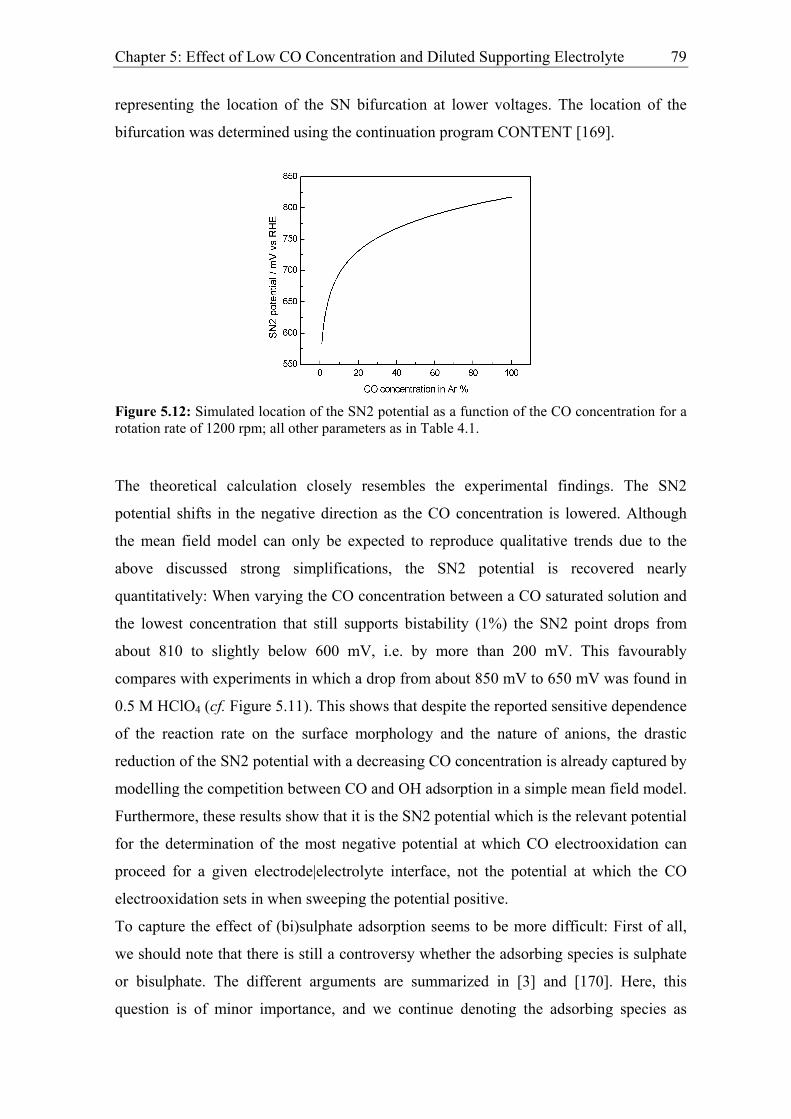
Chapter 5: Effect of Low CO Concentration and Diluted Supporting Electrolyte 79
representing the location of the SN bifurcation at lower voltages. The location of the
bifurcation was determined using the continuation program CONTENT [169].
Figure 5.12: Simulated location of the SN2 potential as a function of the CO concentration for a rotation rate of 1200 rpm; all other parameters as in Table 4.1.
The theoretical calculation closely resembles the experimental findings. The SN2
potential shifts in the negative direction as the CO concentration is lowered. Although
the mean field model can only be expected to reproduce qualitative trends due to the
above discussed strong simplifications, the SN2 potential is recovered nearly
quantitatively: When varying the CO concentration between a CO saturated solution and
the lowest concentration that still supports bistability (1%) the SN2 point drops from
about 810 to slightly below 600 mV, i.e. by more than 200 mV. This favourably
compares with experiments in which a drop from about 850 mV to 650 mV was found in
0.5 M HClO4 (cf. Figure 5.11). This shows that despite the reported sensitive dependence
of the reaction rate on the surface morphology and the nature of anions, the drastic
reduction of the SN2 potential with a decreasing CO concentration is already captured by
modelling the competition between CO and OH adsorption in a simple mean field model.
Furthermore, these results show that it is the SN2 potential which is the relevant potential
for the determination of the most negative potential at which CO electrooxidation can
proceed for a given electrode|electrolyte interface, not the potential at which the CO
electrooxidation sets in when sweeping the potential positive.
To capture the effect of (bi)sulphate adsorption seems to be more difficult: First of all,
we should note that there is still a controversy whether the adsorbing species is sulphate
or bisulphate. The different arguments are summarized in [3] and [170]. Here, this
question is of minor importance, and we continue denoting the adsorbing species as
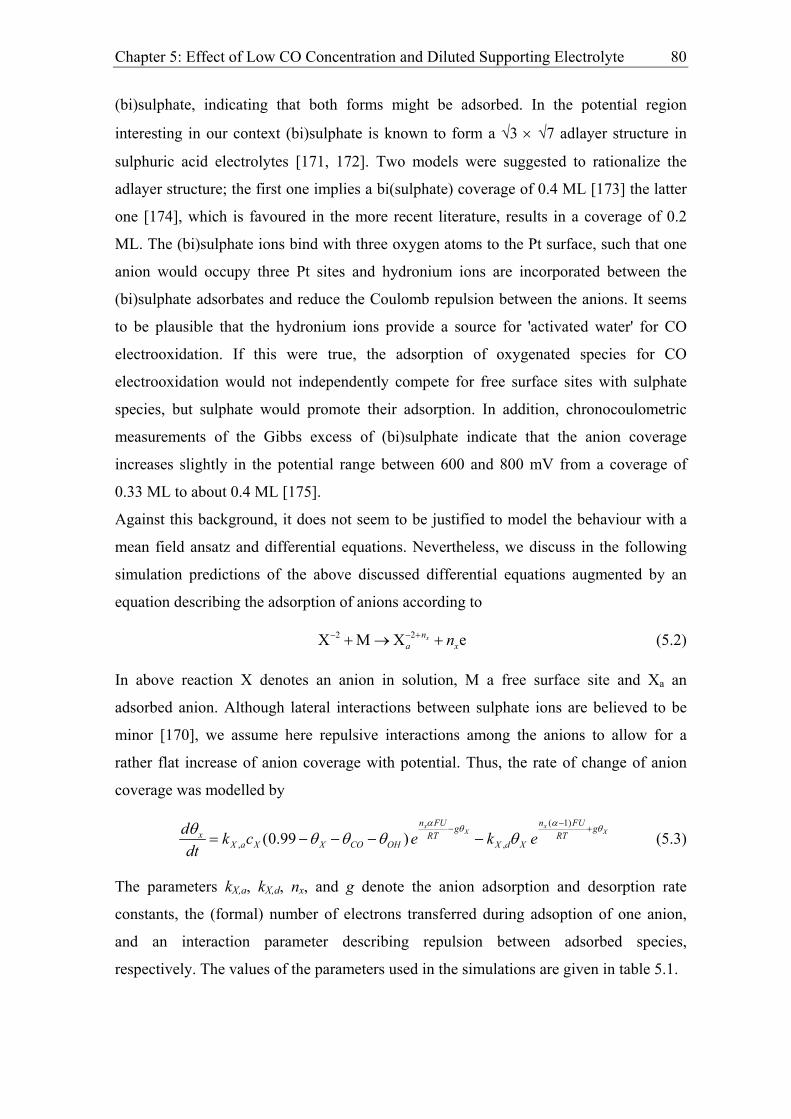
Chapter 5: Effect of Low CO Concentration and Diluted Supporting Electrolyte 80
ex
(bi)sulphate, indicating that both forms might be adsorbed. In the potential region
interesting in our context (bi)sulphate is known to form a √3 × √7 adlayer structure in
sulphuric acid electrolytes [171, 172]. Two models were suggested to rationalize the
adlayer structure; the first one implies a bi(sulphate) coverage of 0.4 ML [173] the latter
one [174], which is favoured in the more recent literature, results in a coverage of 0.2
ML. The (bi)sulphate ions bind with three oxygen atoms to the Pt surface, such that one
anion would occupy three Pt sites and hydronium ions are incorporated between the
(bi)sulphate adsorbates and reduce the Coulomb repulsion between the anions. It seems
to be plausible that the hydronium ions provide a source for 'activated water' for CO
electrooxidation. If this were true, the adsorption of oxygenated species for CO
electrooxidation would not independently compete for free surface sites with sulphate
species, but sulphate would promote their adsorption. In addition, chronocoulometric
measurements of the Gibbs excess of (bi)sulphate indicate that the anion coverage
increases slightly in the potential range between 600 and 800 mV from a coverage of
0.33 ML to about 0.4 ML [175].
Against this background, it does not seem to be justified to model the behaviour with a
mean field ansatz and differential equations. Nevertheless, we discuss in the following
simulation predictions of the above discussed differential equations augmented by an
equation describing the adsorption of anions according to
(5.2) 22X M X xna n− +− + → +
In above reaction X denotes an anion in solution, M a free surface site and Xa an
adsorbed anion. Although lateral interactions between sulphate ions are believed to be
minor [170], we assume here repulsive interactions among the anions to allow for a
rather flat increase of anion coverage with potential. Thus, the rate of change of anion
coverage was modelled by
( 1)
, ,(0.99 )x x
X Xn FU n FUg
x RT RTX a X X CO OH X d X
d k c e k edt
α α gθ θθ θ θ θ θ−
−= − − − −
+ (5.3)
The parameters kX,a, kX,d, nx, and g denote the anion adsorption and desorption rate
constants, the (formal) number of electrons transferred during adsoption of one anion,
and an interaction parameter describing repulsion between adsorbed species,
respectively. The values of the parameters used in the simulations are given in table 5.1.
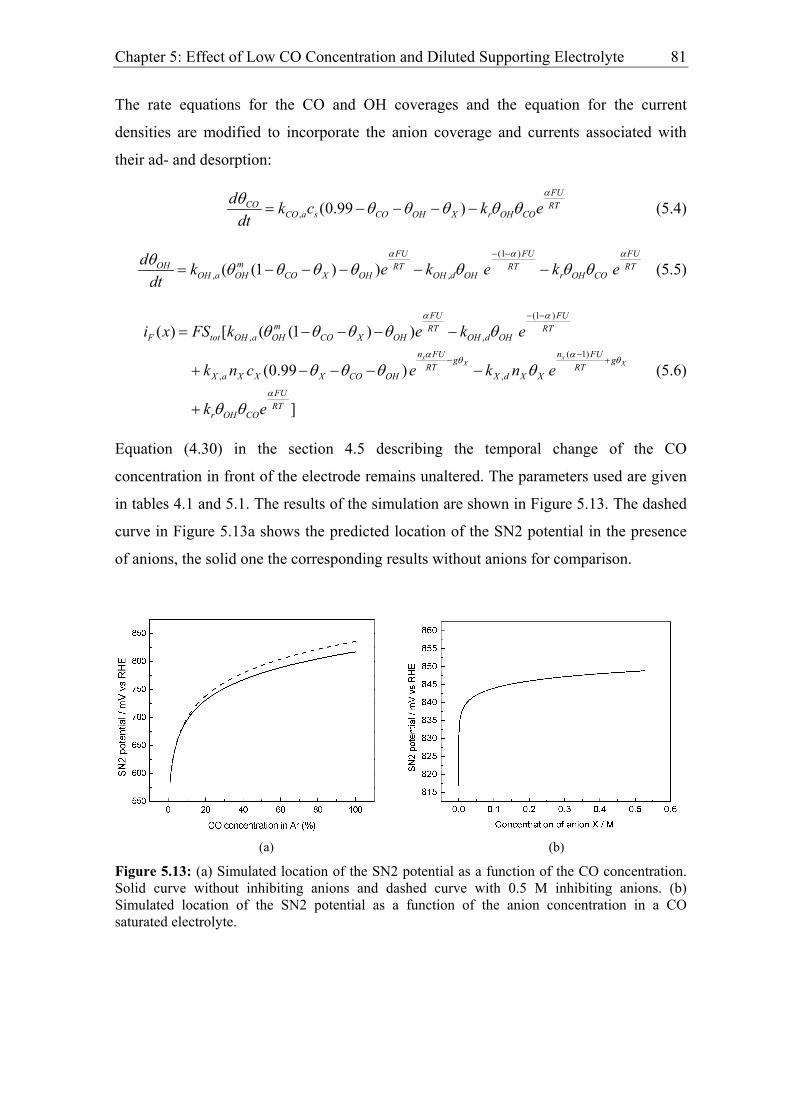
Chapter 5: Effect of Low CO Concentration and Diluted Supporting Electrolyte 81
The rate equations for the CO and OH coverages and the equation for the current
densities are modified to incorporate the anion coverage and currents associated with
their ad- and desorption:
, (0.99 )FU
CO RTCO a s CO OH X r OH CO
d k c k edt
αθ θ θ θ θ θ= − − − − (5.4)
(1 )
, ,( (1 ) )FU FU FU
mOH RT RT RTOH a OH CO X OH OH d OH r OH CO
d k e k edt
α αθ θ θ θ θ θ θ θ− −
= − − − − − k eα
(5.5)
(1 )
, ,
( 1)
, ,
( ) [ ( (1 ) )
(0.99 )
]
x xX X
FU FUm RT RT
F tot OH a OH CO X OH OH d OH
n FU n FUg gRT RT
X a X X X CO OH X d X X
FURT
r OH CO
i x FS k e k e
k n c e k n e
k e
α α
α αθ θ
α
θ θ θ θ θ
θ θ θ θ
θ θ
− −
−− +
= − − − −
+ − − − −
+
(5.6)
Equation (4.30) in the section 4.5 describing the temporal change of the CO
concentration in front of the electrode remains unaltered. The parameters used are given
in tables 4.1 and 5.1. The results of the simulation are shown in Figure 5.13. The dashed
curve in Figure 5.13a shows the predicted location of the SN2 potential in the presence
of anions, the solid one the corresponding results without anions for comparison.
(a) (b)
Figure 5.13: (a) Simulated location of the SN2 potential as a function of the CO concentration. Solid curve without inhibiting anions and dashed curve with 0.5 M inhibiting anions. (b) Simulated location of the SN2 potential as a function of the anion concentration in a CO saturated electrolyte.
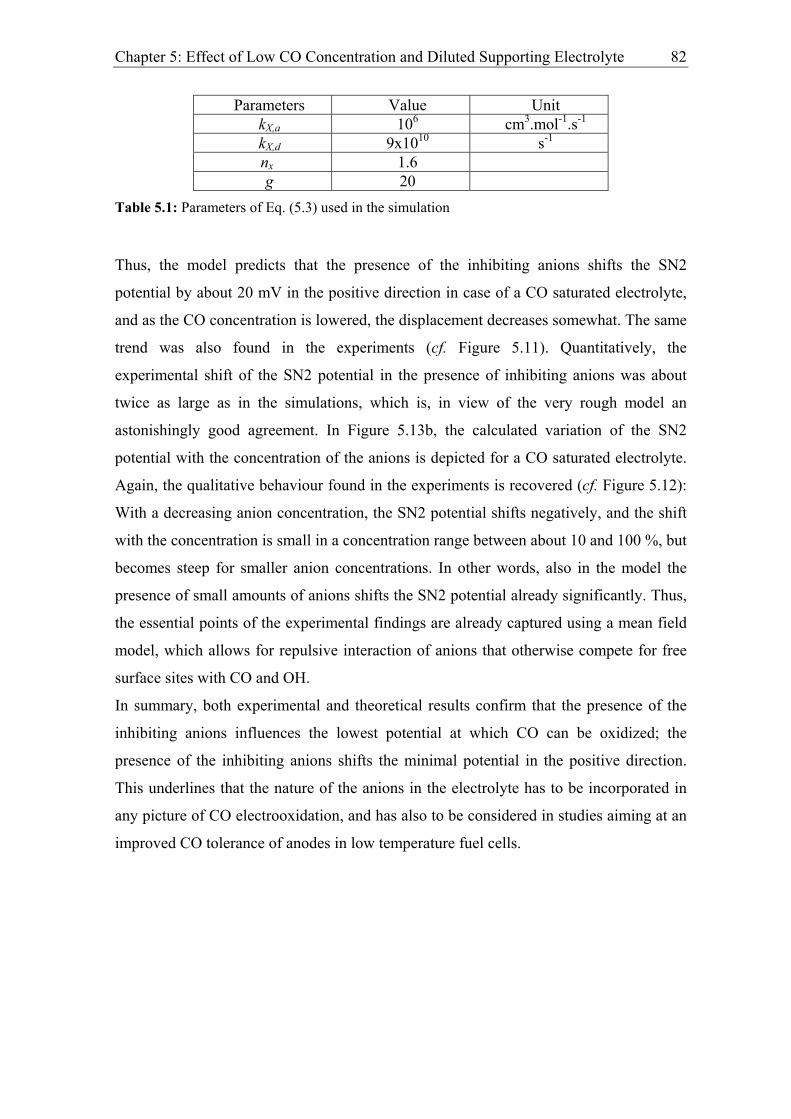
Chapter 5: Effect of Low CO Concentration and Diluted Supporting Electrolyte 82
Parameters Value Unit kX,a 106 cm3.mol-1.s-1
kX,d 9x10¹⁰ s-1
nx 1.6 g 20
Table 5.1: Parameters of Eq. (5.3) used in the simulation
Thus, the model predicts that the presence of the inhibiting anions shifts the SN2
potential by about 20 mV in the positive direction in case of a CO saturated electrolyte,
and as the CO concentration is lowered, the displacement decreases somewhat. The same
trend was also found in the experiments (cf. Figure 5.11). Quantitatively, the
experimental shift of the SN2 potential in the presence of inhibiting anions was about
twice as large as in the simulations, which is, in view of the very rough model an
astonishingly good agreement. In Figure 5.13b, the calculated variation of the SN2
potential with the concentration of the anions is depicted for a CO saturated electrolyte.
Again, the qualitative behaviour found in the experiments is recovered (cf. Figure 5.12):
With a decreasing anion concentration, the SN2 potential shifts negatively, and the shift
with the concentration is small in a concentration range between about 10 and 100 %, but
becomes steep for smaller anion concentrations. In other words, also in the model the
presence of small amounts of anions shifts the SN2 potential already significantly. Thus,
the essential points of the experimental findings are already captured using a mean field
model, which allows for repulsive interaction of anions that otherwise compete for free
surface sites with CO and OH.
In summary, both experimental and theoretical results confirm that the presence of the
inhibiting anions influences the lowest potential at which CO can be oxidized; the
presence of the inhibiting anions shifts the minimal potential in the positive direction.
This underlines that the nature of the anions in the electrolyte has to be incorporated in
any picture of CO electrooxidation, and has also to be considered in studies aiming at an
improved CO tolerance of anodes in low temperature fuel cells.
Chapter 6: Strictly Potentiostatic Oscillations during Bulk CO Electrooxidation 83
Chapter 6: Strictly Potentiostatic Oscillations
during Bulk CO Electrooxidation
6.1 Introduction
In the double layer, ionic species with a strongly bound solvation shell interact with the
electrode surface primarily because of their electric charge, i.e. through Coulomb
attraction or repulsion [170]. Consequently, the excess ion concentration at the surface at
a given electrode potential is independent of the chemical nature of the ionic species. In
contrast, weakly solvated ions can strip part of their solvation shell and form a direct
chemical bond with the metal surface resulting in an ionic surface concentration that
exceeds the one resulting from pure electrostatic interactions [176]. This phenomenon is
known as specific adsorption. Specifically adsorbed anions can influence the
electrochemical reactivity of a metal electrode in several ways:
(a) They may take part in the electrode reaction.
(b) They can block a reaction site, and consequently, reduce the reaction rate.
(c) They can alter the potential distribution in the double layer affecting the
kinetics of electrochemical reactions [161].
The impact of weakly adsorbed anions, such as sulphate, on CO bulk electrooxidation
was already discussed in the previous chapter. In this chapter, the influence of strongly
adsorbing anions is investigated.
The influence of different anions on electrooxidation rates of small organic molecules is
an active field of research. In the course of such studies, an unusual anion effect was
reported by Schell and coworkers [177-179]. These authors observed a remarkable
enhancement in the electrooxidation rate of formic acid [177, 178] and of methanol
[179] when replacing a small amount of a HClO4 base electrolyte with HBF4. They offer
Chapter 6: Strictly Potentiostatic Oscillations during Bulk CO Electrooxidation 84
an intriguing explanation for the enhancement effect, which could be described as the
anionic counterpart to the metal-promoted oxide formation at low potentials. In aqueous
solutions, BF4− is in equilibrium with BF3OH− ions, which in turn can, directly or
indirectly be adsorbed on the electrode negative to the onset of electrooxidation of
chemisorbed water. Schell et al. suggest that the OH-group of adsorbed BF3OH− reacts
with adsorbed CO, keeping thus the electrode reactive for the direct electrooxidation of
formic acid or methanol at potentials at which it is poisoned by CO in a BF4− free
electrolyte. Motivated by these experiments, we conducted investigations on CO
electrooxidation on Pt in the presence of BF4−, which are described in this chapter. As
will be shown, BF4− induces oscillations during CO electrooxidation. In the course of
these studies, evidence was obtained that the current oscillations are induced by the
adsorption of BF4− onto free surface sites, which are then not available anymore for CO
electrooxidation. If this active site blocking hypothesis is true, CO electrooxidation
should also exhibit oscillations in the presence of other inhibiting anions, such as halide
ions.
Markovic et al. [180] found a strong inhibiting effect of Cl− on the rate of methanol
electrooxidation on both Pt(111) and Pt(100). Zolfaghari et al. [181, 182] reported that
chloride and bromide ions are adsorbed competitively with hydroxide (or other
oxygenated species stemming from water oxidation) on Pt in H2SO4. The competitive
adsorption of halides and oxygenated species during oxide formation on Pt was reported
by Conway and coworkers [112, 183-185]. Perez et al. [186] report that chloride inhibits
CO electrooxidation on Pt and Hall et al. [187] found that hydrogen peroxide
electrooxidation on Pt was inhibited by chloride ions. In a study of CO electrooxidation
on Pt by Lopez Cudero et al. [188] the possibility of the formation of a mixed CO-
chloride adlayer was discarded.
We thus also studied the effect of Cl− and Br− on the dynamics of CO electrooxidation,
and, as described below, we found wide parameter ranges in which again the current was
oscillatory. The results of the experiments with tetrafluoroborate and halide anions are
described in section 6.3. In section 6.4, a model is presented that reproduces the
experimental findings and thus allows to identify those steps of the reaction dynamics
that are essential for the oscillatory instability. In section 6.5, the results are
summarized. The following section gives a brief description of the experiments.
Chapter 6: Strictly Potentiostatic Oscillations during Bulk CO Electrooxidation 85
6.2 Experiments
The WE was a polycrystalline or single crystalline platinum disk electrode. Prior to the
measurements with CO, the cleanliness of the WE was checked by recording a CV in Ar
saturated electrolyte; the electrolyte was purged with Ar for at least 30 minutes before
the CV was measured, and during this time the potential was scanned between 10 mV
and 1270 mV for the polycrystalline electrode and between 100 mV and 200 mV for
single crystal electrodes. The first reading of the CO electrooxidation current was taken
approximately 25 minutes after switching to CO bubbling to guarantee the saturation of
the electrolyte with CO. The pre-treatment for the polycrystalline and single crystalline
electrodes is described in chapter 2.
6.3 Experimental Results
Here, we describe first the results obtained with a polycrystalline Pt electrode in the
presence of BF4−, Cl−, Br−, and I− ions. For each type of anion, the dynamics obtained in
H2SO4 and HClO4 base electrolyte is compared. Subsequently, results of experiments
using three different single crystal orientations in a chloride containing H2SO4
electrolyte are presented.
6.3.1 Inhibiting effect of BF4− anions
Figure 6.1 shows cyclic voltammograms of Pt in CO-saturated 0.5 M H2SO4 containing
different amounts of BF4− ions. The cyclic voltammograms were obtained at a scan rate
of 50 mV/s. The solid curve was obtained in a pure supporting electrolyte. The dashed,
dotted and dot-dashed curves in electrolytes containing 5, 10, and 20 mM HBF4,
respectively. The CVs exhibit a hysteresis between a reactive and a poisoned state in a
certain potential interval negative to the ignition peak, which stems from the bistability
that was already discussed in the previous chapters. The quantitative potential value, at
which the transition from the reactive to the CO-covered low-current state occurs,
depends on the BF4− concentration: the higher the BF4
− concentration, the more positive
is the transition from the reactive branch to the poisoned branch on the negative scan. In
other words, the hysteresis becomes smaller and is shifted towards more positive
potentials with increasing HBF4 concentration.
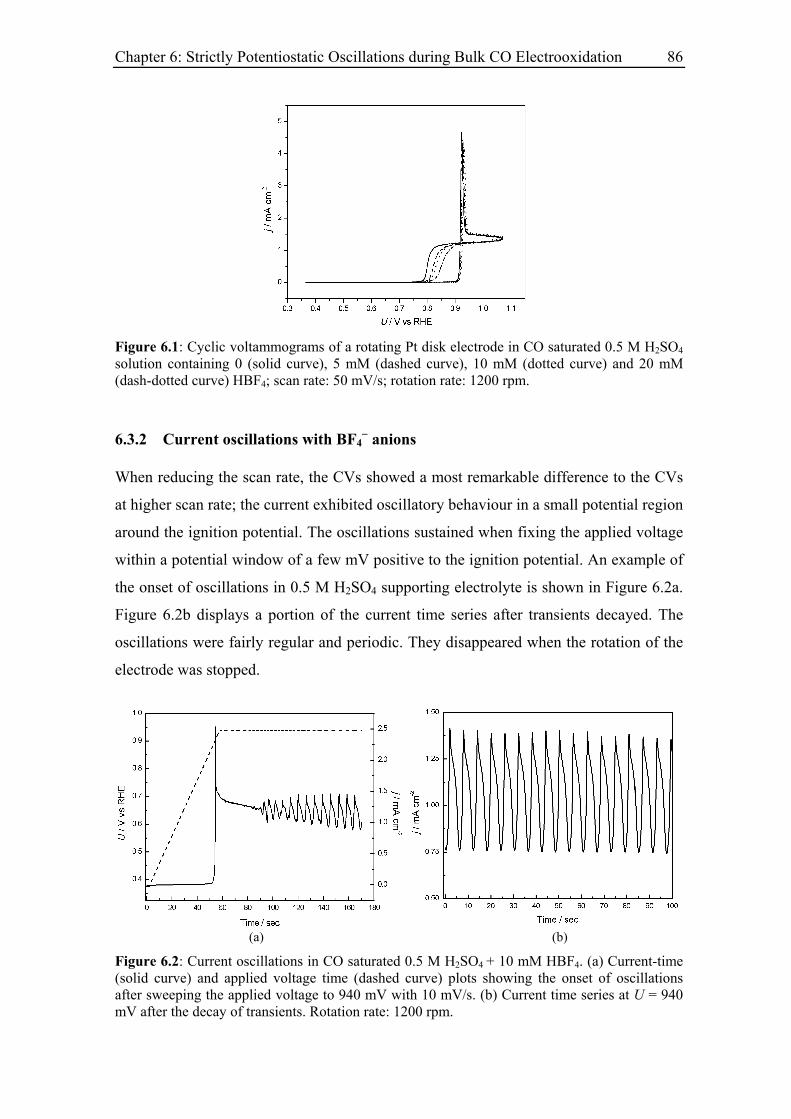
Chapter 6: Strictly Potentiostatic Oscillations during Bulk CO Electrooxidation 86
Figure 6.1: Cyclic voltammograms of a rotating Pt disk electrode in CO saturated 0.5 M H2SO4 solution containing 0 (solid curve), 5 mM (dashed curve), 10 mM (dotted curve) and 20 mM (dash-dotted curve) HBF4; scan rate: 50 mV/s; rotation rate: 1200 rpm.
6.3.2 Current oscillations with BF4− anions
When reducing the scan rate, the CVs showed a most remarkable difference to the CVs
at higher scan rate; the current exhibited oscillatory behaviour in a small potential region
around the ignition potential. The oscillations sustained when fixing the applied voltage
within a potential window of a few mV positive to the ignition potential. An example of
the onset of oscillations in 0.5 M H2SO4 supporting electrolyte is shown in Figure 6.2a.
Figure 6.2b displays a portion of the current time series after transients decayed. The
oscillations were fairly regular and periodic. They disappeared when the rotation of the
electrode was stopped.
(a) (b)
Figure 6.2: Current oscillations in CO saturated 0.5 M H2SO4 + 10 mM HBF4. (a) Current-time (solid curve) and applied voltage time (dashed curve) plots showing the onset of oscillations after sweeping the applied voltage to 940 mV with 10 mV/s. (b) Current time series at U = 940 mV after the decay of transients. Rotation rate: 1200 rpm.
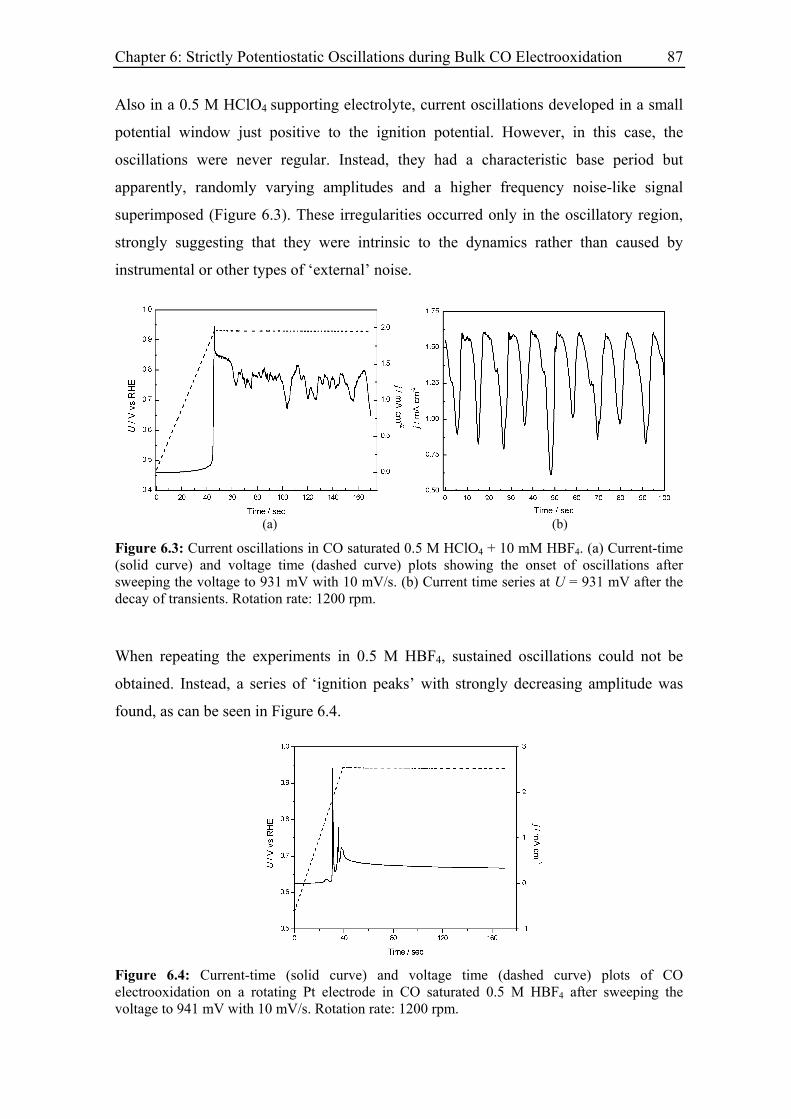
Chapter 6: Strictly Potentiostatic Oscillations during Bulk CO Electrooxidation 87
Also in a 0.5 M HClO4 supporting electrolyte, current oscillations developed in a small
potential window just positive to the ignition potential. However, in this case, the
oscillations were never regular. Instead, they had a characteristic base period but
apparently, randomly varying amplitudes and a higher frequency noise-like signal
superimposed (Figure 6.3). These irregularities occurred only in the oscillatory region,
strongly suggesting that they were intrinsic to the dynamics rather than caused by
instrumental or other types of ‘external’ noise.
(a) (b)
Figure 6.3: Current oscillations in CO saturated 0.5 M HClO4 + 10 mM HBF4. (a) Current-time (solid curve) and voltage time (dashed curve) plots showing the onset of oscillations after sweeping the voltage to 931 mV with 10 mV/s. (b) Current time series at U = 931 mV after the decay of transients. Rotation rate: 1200 rpm.
When repeating the experiments in 0.5 M HBF4, sustained oscillations could not be
obtained. Instead, a series of ‘ignition peaks’ with strongly decreasing amplitude was
found, as can be seen in Figure 6.4.
Figure 6.4: Current-time (solid curve) and voltage time (dashed curve) plots of CO electrooxidation on a rotating Pt electrode in CO saturated 0.5 M HBF4 after sweeping the voltage to 941 mV with 10 mV/s. Rotation rate: 1200 rpm.
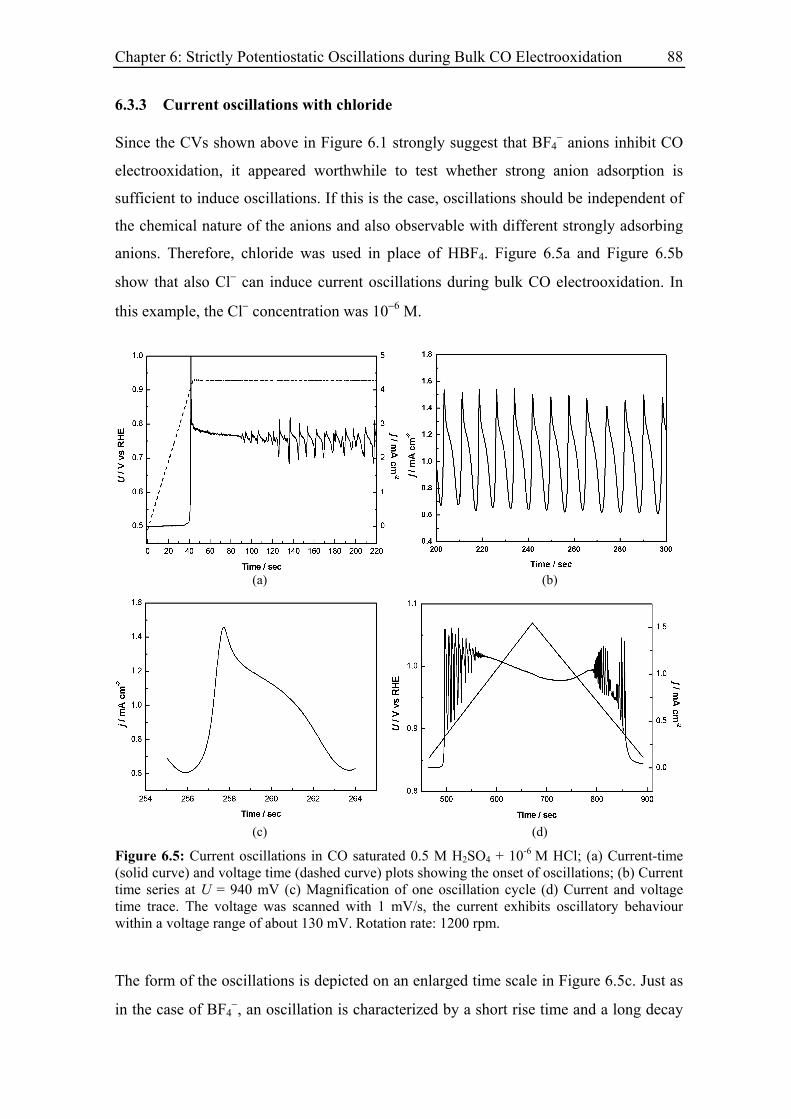
Chapter 6: Strictly Potentiostatic Oscillations during Bulk CO Electrooxidation 88
6.3.3 Current oscillations with chloride
Since the CVs shown above in Figure 6.1 strongly suggest that BF4− anions inhibit CO
electrooxidation, it appeared worthwhile to test whether strong anion adsorption is
sufficient to induce oscillations. If this is the case, oscillations should be independent of
the chemical nature of the anions and also observable with different strongly adsorbing
anions. Therefore, chloride was used in place of HBF4. Figure 6.5a and Figure 6.5b
show that also Cl− can induce current oscillations during bulk CO electrooxidation. In
this example, the Cl− concentration was 10−6 M.
(a) (b)
(c) (d)
Figure 6.5: Current oscillations in CO saturated 0.5 M H2SO4 + 10-6 M HCl; (a) Current-time (solid curve) and voltage time (dashed curve) plots showing the onset of oscillations; (b) Current time series at U = 940 mV (c) Magnification of one oscillation cycle (d) Current and voltage time trace. The voltage was scanned with 1 mV/s, the current exhibits oscillatory behaviour within a voltage range of about 130 mV. Rotation rate: 1200 rpm.
The form of the oscillations is depicted on an enlarged time scale in Figure 6.5c. Just as
in the case of BF4−, an oscillation is characterized by a short rise time and a long decay
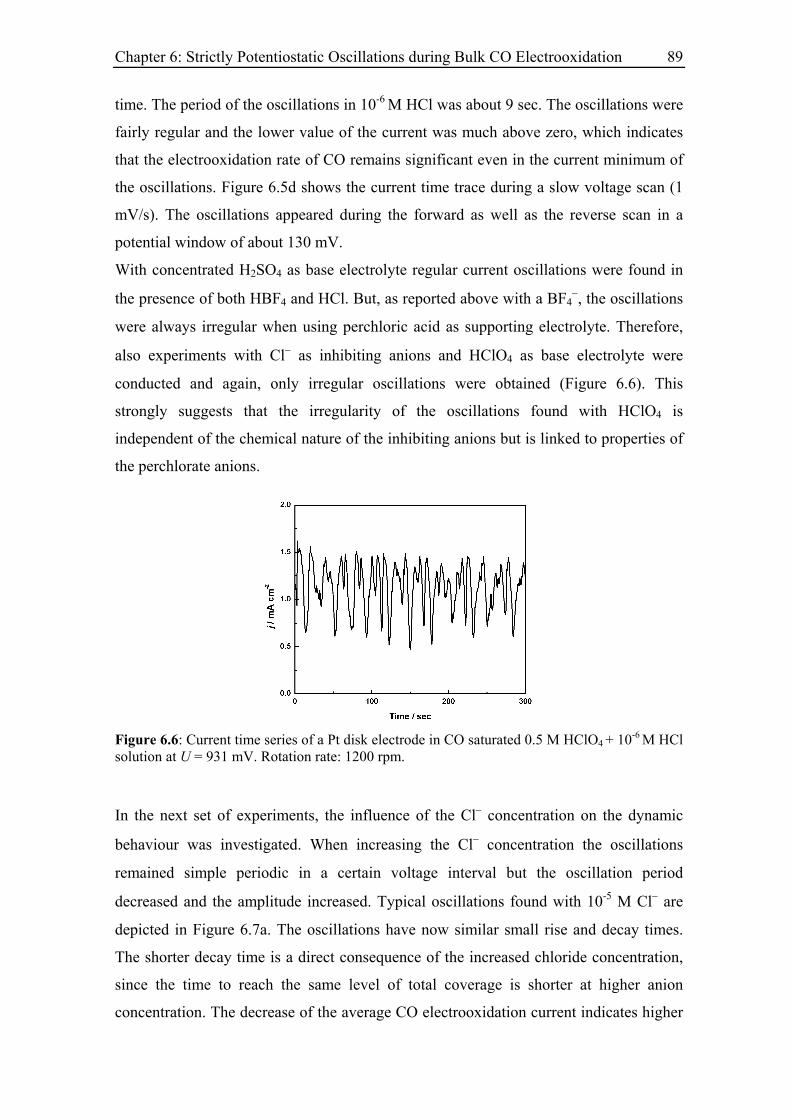
Chapter 6: Strictly Potentiostatic Oscillations during Bulk CO Electrooxidation 89
time. The period of the oscillations in 10-6 M HCl was about 9 sec. The oscillations were
fairly regular and the lower value of the current was much above zero, which indicates
that the electrooxidation rate of CO remains significant even in the current minimum of
the oscillations. Figure 6.5d shows the current time trace during a slow voltage scan (1
mV/s). The oscillations appeared during the forward as well as the reverse scan in a
potential window of about 130 mV.
With concentrated H2SO4 as base electrolyte regular current oscillations were found in
the presence of both HBF4 and HCl. But, as reported above with a BF4−, the oscillations
were always irregular when using perchloric acid as supporting electrolyte. Therefore,
also experiments with Cl− as inhibiting anions and HClO4 as base electrolyte were
conducted and again, only irregular oscillations were obtained (Figure 6.6). This
strongly suggests that the irregularity of the oscillations found with HClO4 is
independent of the chemical nature of the inhibiting anions but is linked to properties of
the perchlorate anions.
Figure 6.6: Current time series of a Pt disk electrode in CO saturated 0.5 M HClO4 + 10-6 M HCl solution at U = 931 mV. Rotation rate: 1200 rpm.
In the next set of experiments, the influence of the Cl− concentration on the dynamic
behaviour was investigated. When increasing the Cl− concentration the oscillations
remained simple periodic in a certain voltage interval but the oscillation period
decreased and the amplitude increased. Typical oscillations found with 10-5 M Cl− are
depicted in Figure 6.7a. The oscillations have now similar small rise and decay times.
The shorter decay time is a direct consequence of the increased chloride concentration,
since the time to reach the same level of total coverage is shorter at higher anion
concentration. The decrease of the average CO electrooxidation current indicates higher
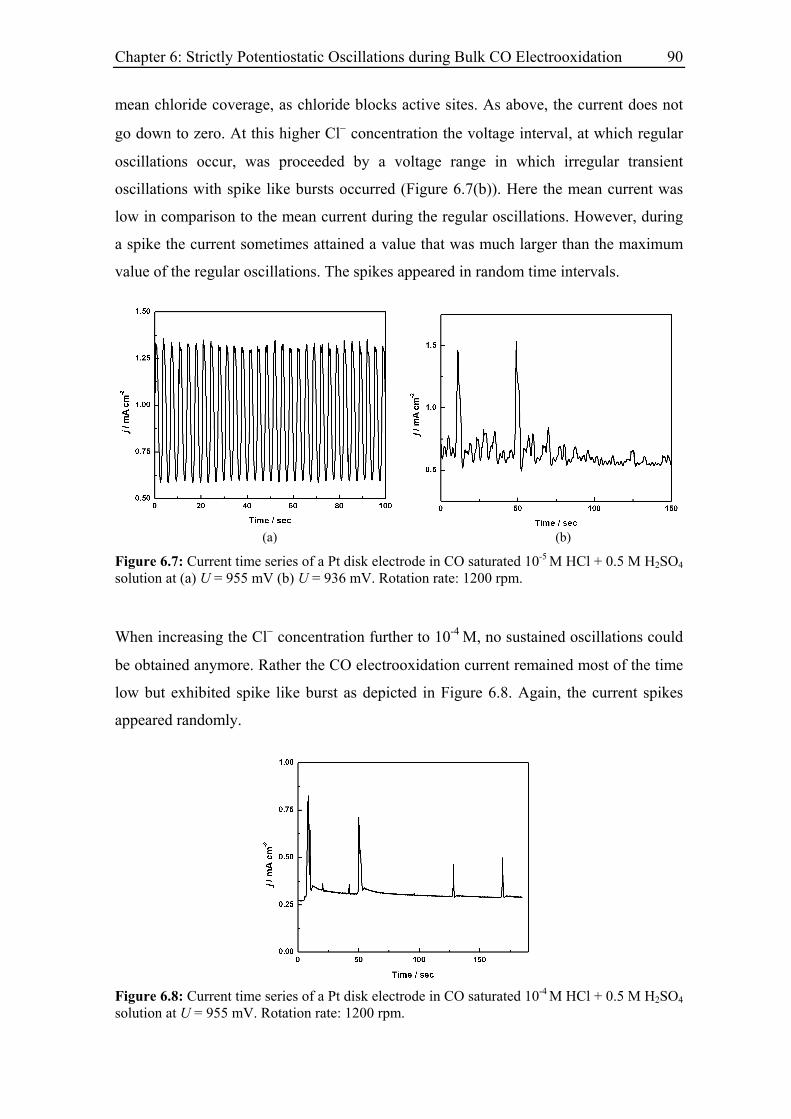
Chapter 6: Strictly Potentiostatic Oscillations during Bulk CO Electrooxidation 90
mean chloride coverage, as chloride blocks active sites. As above, the current does not
go down to zero. At this higher Cl− concentration the voltage interval, at which regular
oscillations occur, was proceeded by a voltage range in which irregular transient
oscillations with spike like bursts occurred (Figure 6.7(b)). Here the mean current was
low in comparison to the mean current during the regular oscillations. However, during
a spike the current sometimes attained a value that was much larger than the maximum
value of the regular oscillations. The spikes appeared in random time intervals.
(a) (b)
Figure 6.7: Current time series of a Pt disk electrode in CO saturated 10-5 M HCl + 0.5 M H2SO4 solution at (a) U = 955 mV (b) U = 936 mV. Rotation rate: 1200 rpm.
When increasing the Cl− concentration further to 10-4 M, no sustained oscillations could
be obtained anymore. Rather the CO electrooxidation current remained most of the time
low but exhibited spike like burst as depicted in Figure 6.8. Again, the current spikes
appeared randomly.
Figure 6.8: Current time series of a Pt disk electrode in CO saturated 10-4 M HCl + 0.5 M H2SO4 solution at U = 955 mV. Rotation rate: 1200 rpm.
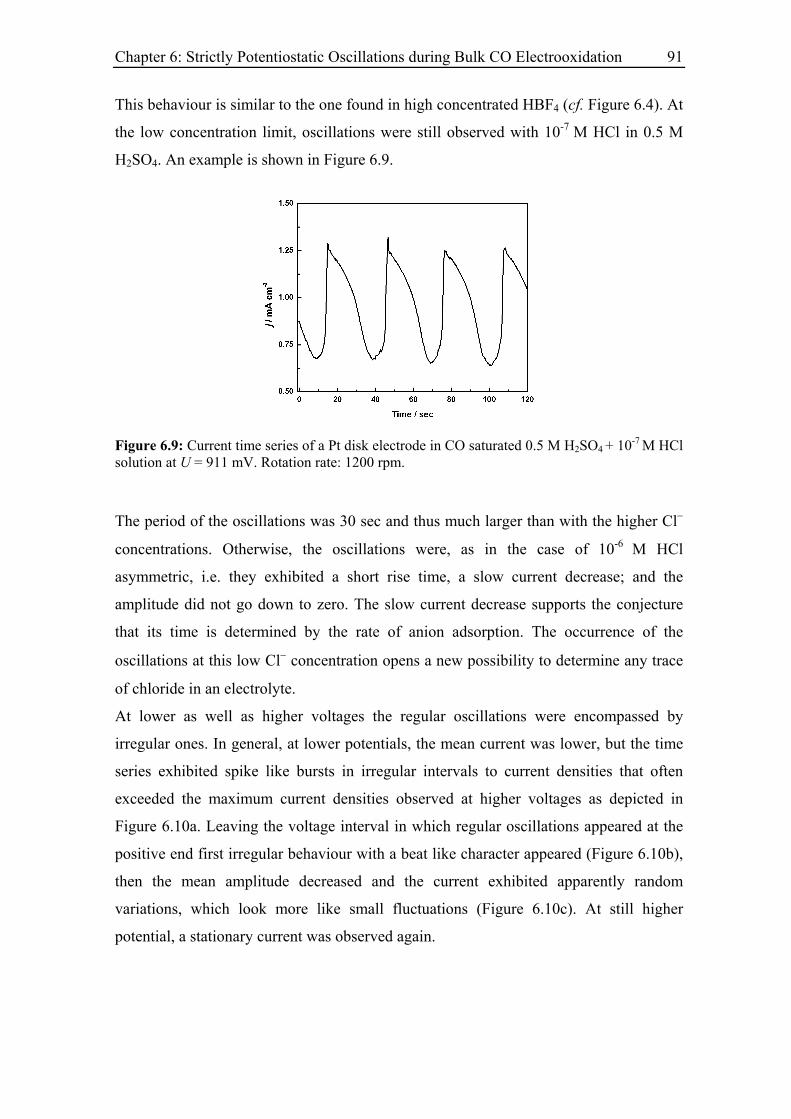
Chapter 6: Strictly Potentiostatic Oscillations during Bulk CO Electrooxidation 91
This behaviour is similar to the one found in high concentrated HBF4 (cf. Figure 6.4). At
the low concentration limit, oscillations were still observed with 10-7 M HCl in 0.5 M
H2SO4. An example is shown in Figure 6.9.
Figure 6.9: Current time series of a Pt disk electrode in CO saturated 0.5 M H2SO4 + 10-7 M HCl solution at U = 911 mV. Rotation rate: 1200 rpm.
The period of the oscillations was 30 sec and thus much larger than with the higher Cl−
concentrations. Otherwise, the oscillations were, as in the case of 10-6 M HCl
asymmetric, i.e. they exhibited a short rise time, a slow current decrease; and the
amplitude did not go down to zero. The slow current decrease supports the conjecture
that its time is determined by the rate of anion adsorption. The occurrence of the
oscillations at this low Cl− concentration opens a new possibility to determine any trace
of chloride in an electrolyte.
At lower as well as higher voltages the regular oscillations were encompassed by
irregular ones. In general, at lower potentials, the mean current was lower, but the time
series exhibited spike like bursts in irregular intervals to current densities that often
exceeded the maximum current densities observed at higher voltages as depicted in
Figure 6.10a. Leaving the voltage interval in which regular oscillations appeared at the
positive end first irregular behaviour with a beat like character appeared (Figure 6.10b),
then the mean amplitude decreased and the current exhibited apparently random
variations, which look more like small fluctuations (Figure 6.10c). At still higher
potential, a stationary current was observed again.
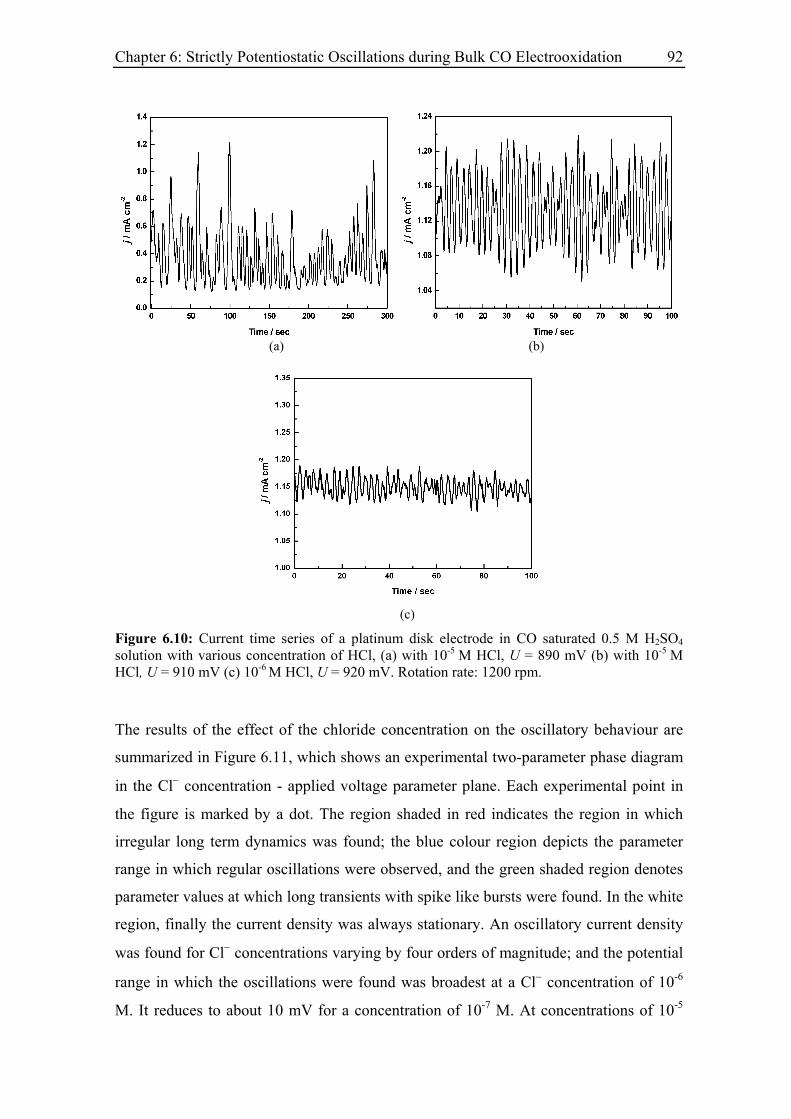
Chapter 6: Strictly Potentiostatic Oscillations during Bulk CO Electrooxidation 92
(a) (b)
(c)
Figure 6.10: Current time series of a platinum disk electrode in CO saturated 0.5 M H2SO4 solution with various concentration of HCl, (a) with 10-5 M HCl, U = 890 mV (b) with 10-5 M HCl, U = 910 mV (c) 10-6 M HCl, U = 920 mV. Rotation rate: 1200 rpm.
The results of the effect of the chloride concentration on the oscillatory behaviour are
summarized in Figure 6.11, which shows an experimental two-parameter phase diagram
in the Cl− concentration - applied voltage parameter plane. Each experimental point in
the figure is marked by a dot. The region shaded in red indicates the region in which
irregular long term dynamics was found; the blue colour region depicts the parameter
range in which regular oscillations were observed, and the green shaded region denotes
parameter values at which long transients with spike like bursts were found. In the white
region, finally the current density was always stationary. An oscillatory current density
was found for Cl− concentrations varying by four orders of magnitude; and the potential
range in which the oscillations were found was broadest at a Cl− concentration of 10-6
M. It reduces to about 10 mV for a concentration of 10-7 M. At concentrations of 10-5
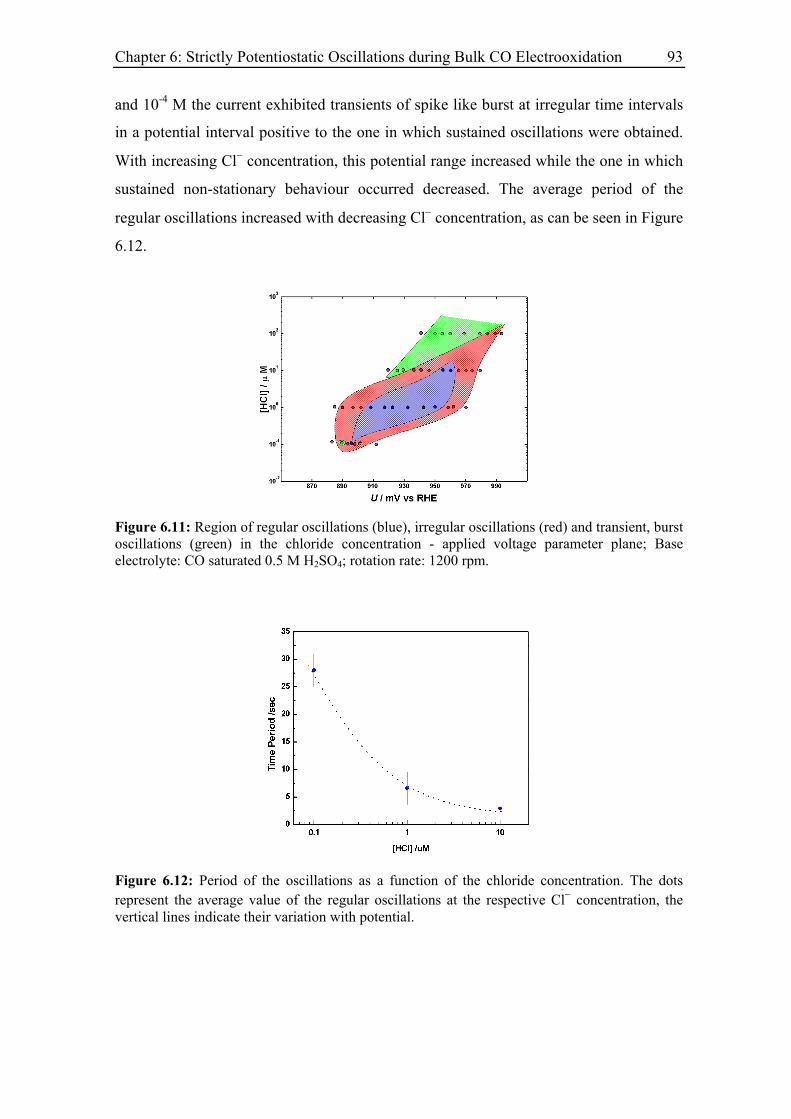
Chapter 6: Strictly Potentiostatic Oscillations during Bulk CO Electrooxidation 93
and 10-4 M the current exhibited transients of spike like burst at irregular time intervals
in a potential interval positive to the one in which sustained oscillations were obtained.
With increasing Cl− concentration, this potential range increased while the one in which
sustained non-stationary behaviour occurred decreased. The average period of the
regular oscillations increased with decreasing Cl− concentration, as can be seen in Figure
6.12.
Figure 6.11: Region of regular oscillations (blue), irregular oscillations (red) and transient, burst oscillations (green) in the chloride concentration - applied voltage parameter plane; Base electrolyte: CO saturated 0.5 M H2SO4; rotation rate: 1200 rpm.
Figure 6.12: Period of the oscillations as a function of the chloride concentration. The dots represent the average value of the regular oscillations at the respective Cl − concentration, the vertical lines indicate their variation with potential.
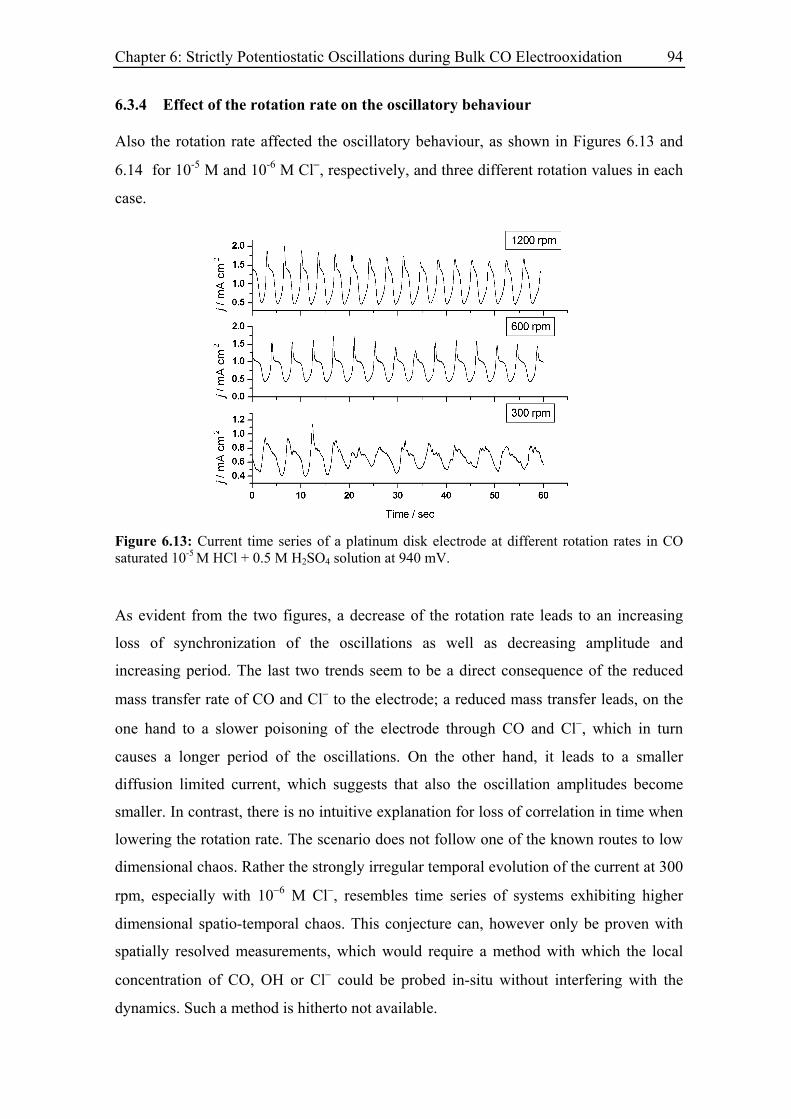
Chapter 6: Strictly Potentiostatic Oscillations during Bulk CO Electrooxidation 94
6.3.4 Effect of the rotation rate on the oscillatory behaviour
Also the rotation rate affected the oscillatory behaviour, as shown in Figures 6.13 and
6.14 for 10-5 M and 10-6 M Cl−, respectively, and three different rotation values in each
case.
Figure 6.13: Current time series of a platinum disk electrode at different rotation rates in CO saturated 10-5 M HCl + 0.5 M H2SO4 solution at 940 mV.
As evident from the two figures, a decrease of the rotation rate leads to an increasing
loss of synchronization of the oscillations as well as decreasing amplitude and
increasing period. The last two trends seem to be a direct consequence of the reduced
mass transfer rate of CO and Cl− to the electrode; a reduced mass transfer leads, on the
one hand to a slower poisoning of the electrode through CO and Cl−, which in turn
causes a longer period of the oscillations. On the other hand, it leads to a smaller
diffusion limited current, which suggests that also the oscillation amplitudes become
smaller. In contrast, there is no intuitive explanation for loss of correlation in time when
lowering the rotation rate. The scenario does not follow one of the known routes to low
dimensional chaos. Rather the strongly irregular temporal evolution of the current at 300
rpm, especially with 10−6 M Cl−, resembles time series of systems exhibiting higher
dimensional spatio-temporal chaos. This conjecture can, however only be proven with
spatially resolved measurements, which would require a method with which the local
concentration of CO, OH or Cl− could be probed in-situ without interfering with the
dynamics. Such a method is hitherto not available.
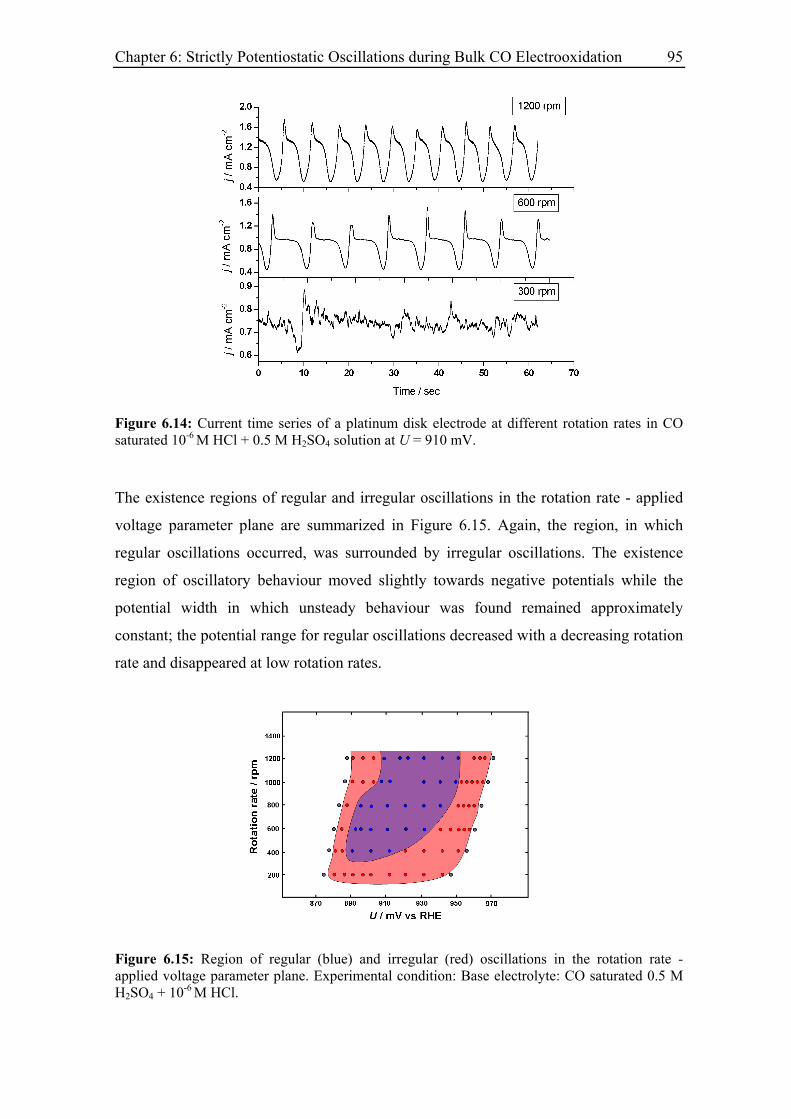
Chapter 6: Strictly Potentiostatic Oscillations during Bulk CO Electrooxidation 95
Figure 6.14: Current time series of a platinum disk electrode at different rotation rates in CO saturated 10-6 M HCl + 0.5 M H2SO4 solution at U = 910 mV.
The existence regions of regular and irregular oscillations in the rotation rate - applied
voltage parameter plane are summarized in Figure 6.15. Again, the region, in which
regular oscillations occurred, was surrounded by irregular oscillations. The existence
region of oscillatory behaviour moved slightly towards negative potentials while the
potential width in which unsteady behaviour was found remained approximately
constant; the potential range for regular oscillations decreased with a decreasing rotation
rate and disappeared at low rotation rates.
Figure 6.15: Region of regular (blue) and irregular (red) oscillations in the rotation rate - applied voltage parameter plane. Experimental condition: Base electrolyte: CO saturated 0.5 M H2SO4 + 10-6 M HCl.
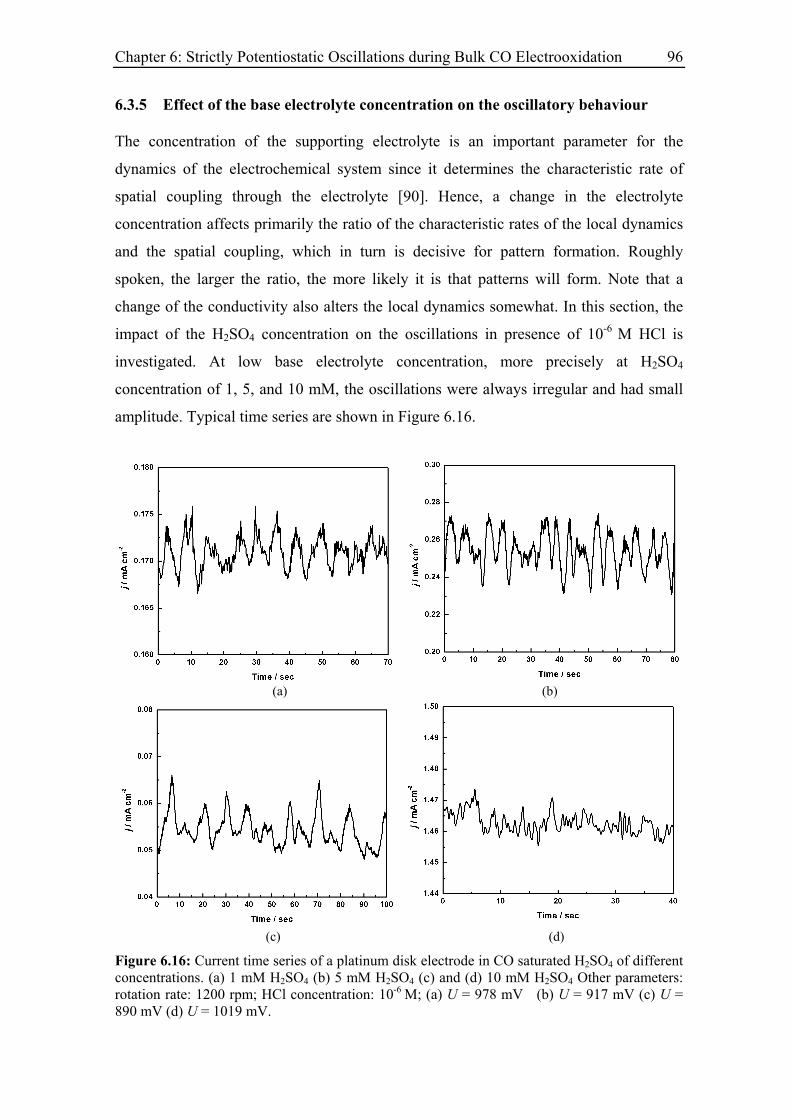
Chapter 6: Strictly Potentiostatic Oscillations during Bulk CO Electrooxidation 96
6.3.5 Effect of the base electrolyte concentration on the oscillatory behaviour
The concentration of the supporting electrolyte is an important parameter for the
dynamics of the electrochemical system since it determines the characteristic rate of
spatial coupling through the electrolyte [90]. Hence, a change in the electrolyte
concentration affects primarily the ratio of the characteristic rates of the local dynamics
and the spatial coupling, which in turn is decisive for pattern formation. Roughly
spoken, the larger the ratio, the more likely it is that patterns will form. Note that a
change of the conductivity also alters the local dynamics somewhat. In this section, the
impact of the H2SO4 concentration on the oscillations in presence of 10-6 M HCl is
investigated. At low base electrolyte concentration, more precisely at H2SO4
concentration of 1, 5, and 10 mM, the oscillations were always irregular and had small
amplitude. Typical time series are shown in Figure 6.16.
(a) (b)
(c) (d)
Figure 6.16: Current time series of a platinum disk electrode in CO saturated H2SO4 of different concentrations. (a) 1 mM H2SO4 (b) 5 mM H2SO4 (c) and (d) 10 mM H2SO4 Other parameters: rotation rate: 1200 rpm; HCl concentration: 10-6 M; (a) U = 978 mV (b) U = 917 mV (c) U = 890 mV (d) U = 1019 mV.
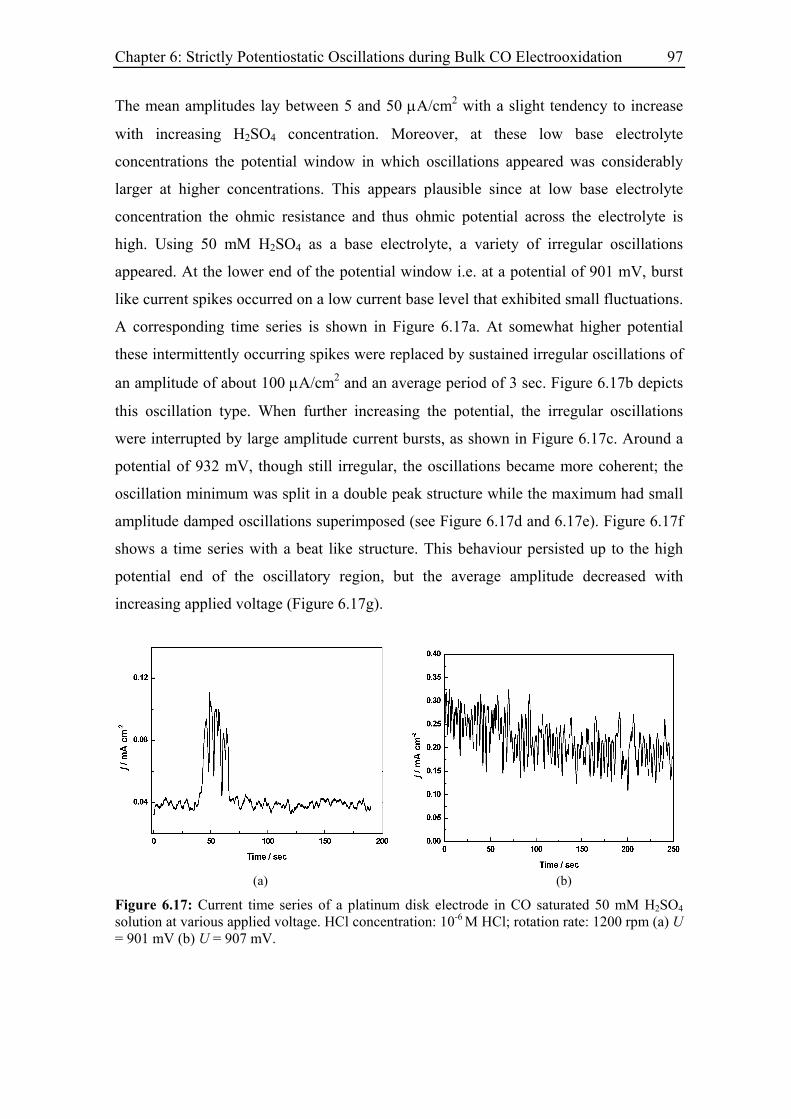
Chapter 6: Strictly Potentiostatic Oscillations during Bulk CO Electrooxidation 97
The mean amplitudes lay between 5 and 50 µA/cm2 with a slight tendency to increase
with increasing H2SO4 concentration. Moreover, at these low base electrolyte
concentrations the potential window in which oscillations appeared was considerably
larger at higher concentrations. This appears plausible since at low base electrolyte
concentration the ohmic resistance and thus ohmic potential across the electrolyte is
high. Using 50 mM H2SO4 as a base electrolyte, a variety of irregular oscillations
appeared. At the lower end of the potential window i.e. at a potential of 901 mV, burst
like current spikes occurred on a low current base level that exhibited small fluctuations.
A corresponding time series is shown in Figure 6.17a. At somewhat higher potential
these intermittently occurring spikes were replaced by sustained irregular oscillations of
an amplitude of about 100 µA/cm2 and an average period of 3 sec. Figure 6.17b depicts
this oscillation type. When further increasing the potential, the irregular oscillations
were interrupted by large amplitude current bursts, as shown in Figure 6.17c. Around a
potential of 932 mV, though still irregular, the oscillations became more coherent; the
oscillation minimum was split in a double peak structure while the maximum had small
amplitude damped oscillations superimposed (see Figure 6.17d and 6.17e). Figure 6.17f
shows a time series with a beat like structure. This behaviour persisted up to the high
potential end of the oscillatory region, but the average amplitude decreased with
increasing applied voltage (Figure 6.17g).
(a) (b)
Figure 6.17: Current time series of a platinum disk electrode in CO saturated 50 mM H2SO4 solution at various applied voltage. HCl concentration: 10-6 M HCl; rotation rate: 1200 rpm (a) U = 901 mV (b) U = 907 mV.
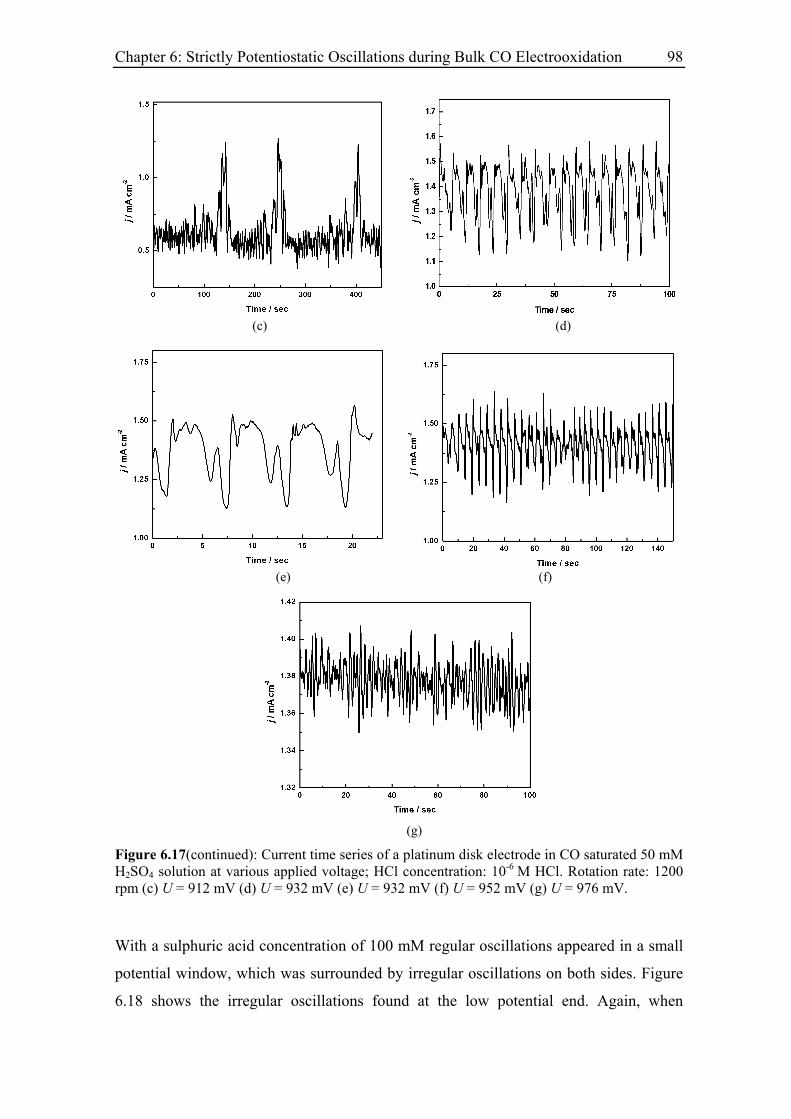
Chapter 6: Strictly Potentiostatic Oscillations during Bulk CO Electrooxidation 98
(c) (d)
(e) (f)
(g)
Figure 6.17(continued): Current time series of a platinum disk electrode in CO saturated 50 mM H2SO4 solution at various applied voltage; HCl concentration: 10-6 M HCl. Rotation rate: 1200 rpm (c) U = 912 mV (d) U = 932 mV (e) U = 932 mV (f) U = 952 mV (g) U = 976 mV.
With a sulphuric acid concentration of 100 mM regular oscillations appeared in a small
potential window, which was surrounded by irregular oscillations on both sides. Figure
6.18 shows the irregular oscillations found at the low potential end. Again, when
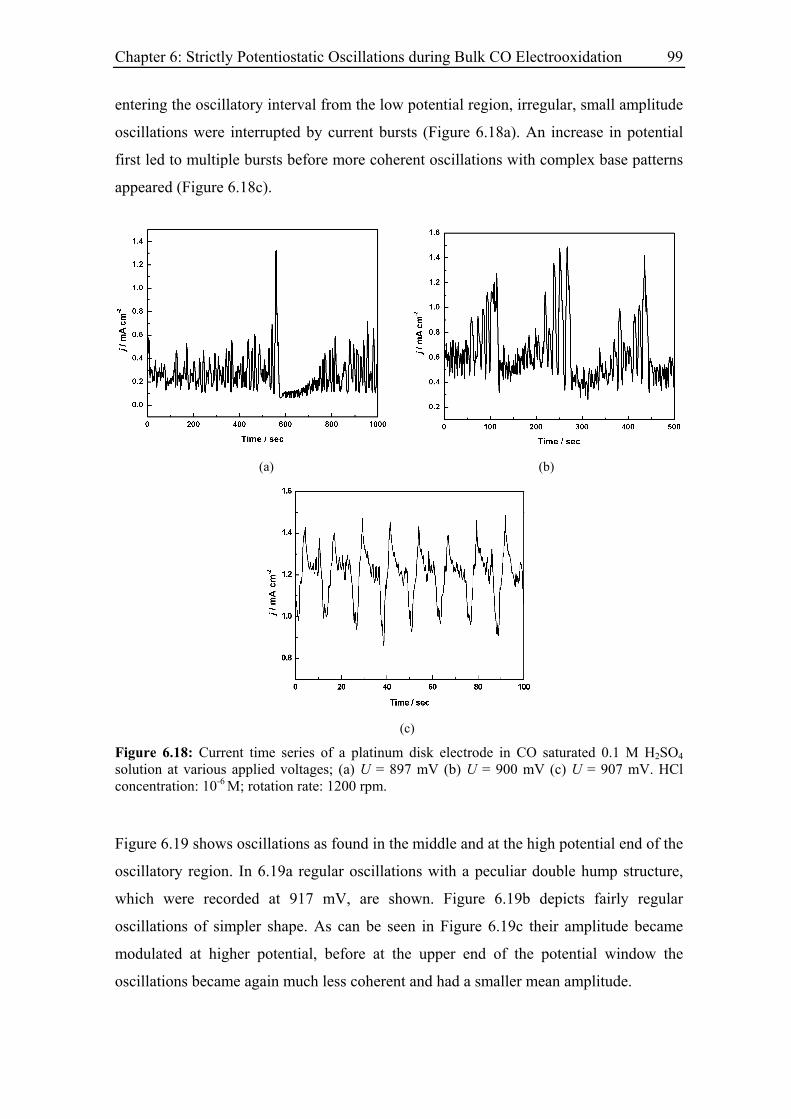
Chapter 6: Strictly Potentiostatic Oscillations during Bulk CO Electrooxidation 99
entering the oscillatory interval from the low potential region, irregular, small amplitude
oscillations were interrupted by current bursts (Figure 6.18a). An increase in potential
first led to multiple bursts before more coherent oscillations with complex base patterns
appeared (Figure 6.18c).
(a) (b)
(c)
Figure 6.18: Current time series of a platinum disk electrode in CO saturated 0.1 M H2SO4 solution at various applied voltages; (a) U = 897 mV (b) U = 900 mV (c) U = 907 mV. HCl concentration: 10-6 M; rotation rate: 1200 rpm.
Figure 6.19 shows oscillations as found in the middle and at the high potential end of the
oscillatory region. In 6.19a regular oscillations with a peculiar double hump structure,
which were recorded at 917 mV, are shown. Figure 6.19b depicts fairly regular
oscillations of simpler shape. As can be seen in Figure 6.19c their amplitude became
modulated at higher potential, before at the upper end of the potential window the
oscillations became again much less coherent and had a smaller mean amplitude.
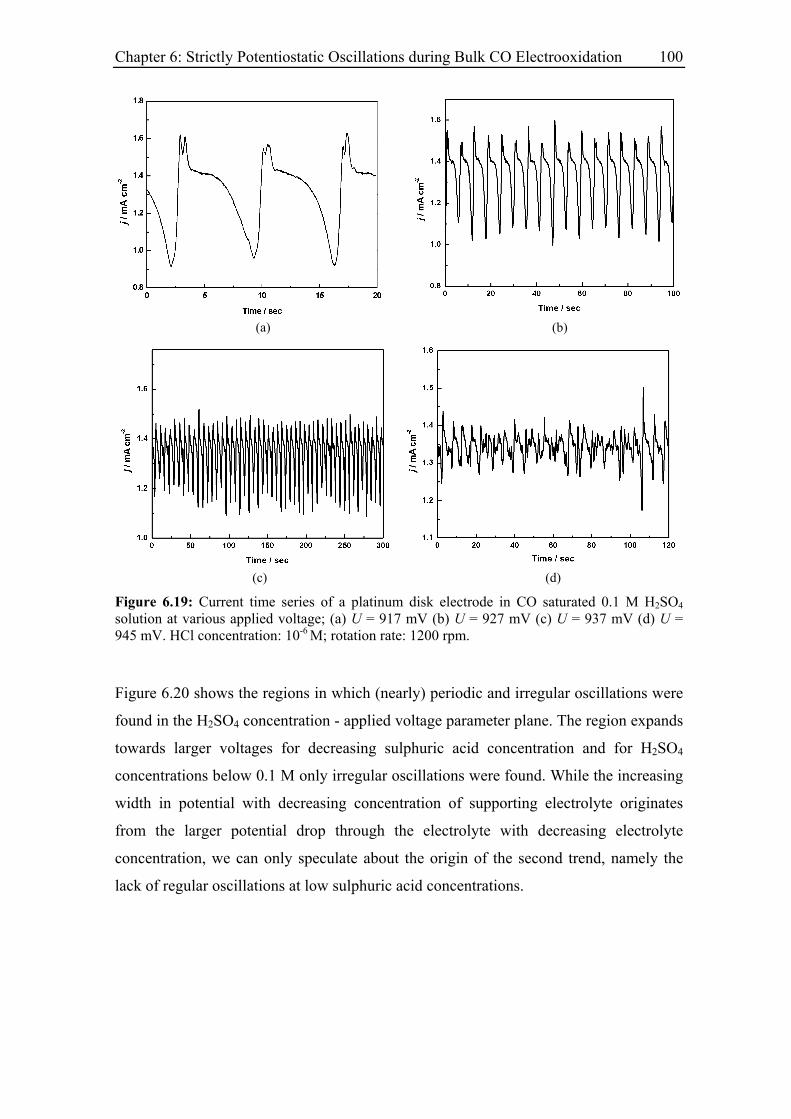
Chapter 6: Strictly Potentiostatic Oscillations during Bulk CO Electrooxidation 100
(a) (b)
(c) (d)
Figure 6.19: Current time series of a platinum disk electrode in CO saturated 0.1 M H2SO4 solution at various applied voltage; (a) U = 917 mV (b) U = 927 mV (c) U = 937 mV (d) U = 945 mV. HCl concentration: 10-6 M; rotation rate: 1200 rpm.
Figure 6.20 shows the regions in which (nearly) periodic and irregular oscillations were
found in the H2SO4 concentration - applied voltage parameter plane. The region expands
towards larger voltages for decreasing sulphuric acid concentration and for H2SO4
concentrations below 0.1 M only irregular oscillations were found. While the increasing
width in potential with decreasing concentration of supporting electrolyte originates
from the larger potential drop through the electrolyte with decreasing electrolyte
concentration, we can only speculate about the origin of the second trend, namely the
lack of regular oscillations at low sulphuric acid concentrations.
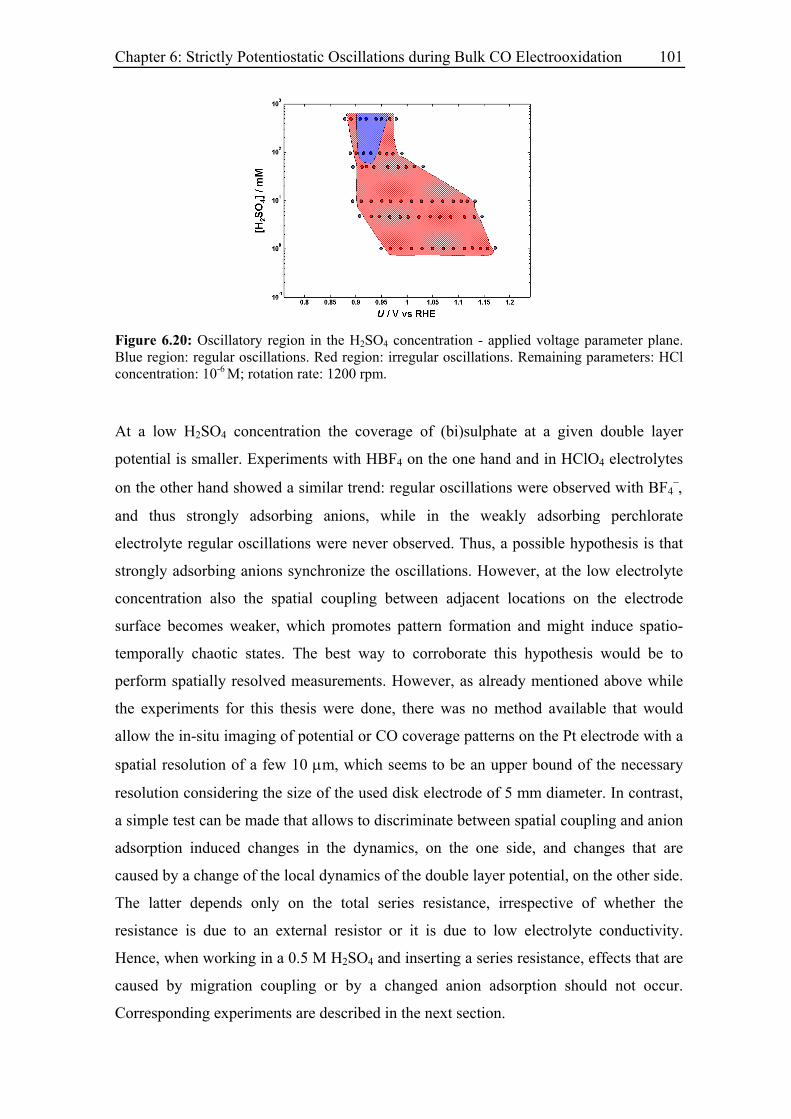
Chapter 6: Strictly Potentiostatic Oscillations during Bulk CO Electrooxidation 101
Figure 6.20: Oscillatory region in the H2SO4 concentration - applied voltage parameter plane. Blue region: regular oscillations. Red region: irregular oscillations. Remaining parameters: HCl concentration: 10-6 M; rotation rate: 1200 rpm.
At a low H2SO4 concentration the coverage of (bi)sulphate at a given double layer
potential is smaller. Experiments with HBF4 on the one hand and in HClO4 electrolytes
on the other hand showed a similar trend: regular oscillations were observed with BF4−,
and thus strongly adsorbing anions, while in the weakly adsorbing perchlorate
electrolyte regular oscillations were never observed. Thus, a possible hypothesis is that
strongly adsorbing anions synchronize the oscillations. However, at the low electrolyte
concentration also the spatial coupling between adjacent locations on the electrode
surface becomes weaker, which promotes pattern formation and might induce spatio-
temporally chaotic states. The best way to corroborate this hypothesis would be to
perform spatially resolved measurements. However, as already mentioned above while
the experiments for this thesis were done, there was no method available that would
allow the in-situ imaging of potential or CO coverage patterns on the Pt electrode with a
spatial resolution of a few 10 µm, which seems to be an upper bound of the necessary
resolution considering the size of the used disk electrode of 5 mm diameter. In contrast,
a simple test can be made that allows to discriminate between spatial coupling and anion
adsorption induced changes in the dynamics, on the one side, and changes that are
caused by a change of the local dynamics of the double layer potential, on the other side.
The latter depends only on the total series resistance, irrespective of whether the
resistance is due to an external resistor or it is due to low electrolyte conductivity.
Hence, when working in a 0.5 M H2SO4 and inserting a series resistance, effects that are
caused by migration coupling or by a changed anion adsorption should not occur.
Corresponding experiments are described in the next section.
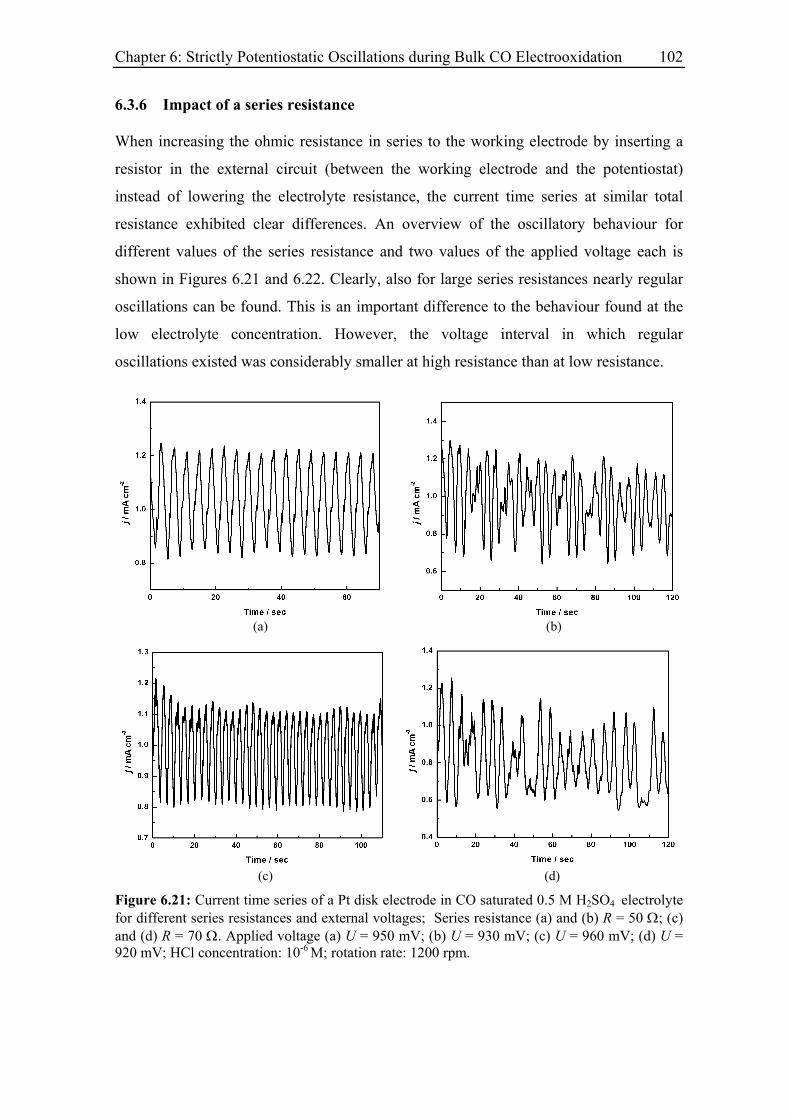
Chapter 6: Strictly Potentiostatic Oscillations during Bulk CO Electrooxidation 102
6.3.6 Impact of a series resistance
When increasing the ohmic resistance in series to the working electrode by inserting a
resistor in the external circuit (between the working electrode and the potentiostat)
instead of lowering the electrolyte resistance, the current time series at similar total
resistance exhibited clear differences. An overview of the oscillatory behaviour for
different values of the series resistance and two values of the applied voltage each is
shown in Figures 6.21 and 6.22. Clearly, also for large series resistances nearly regular
oscillations can be found. This is an important difference to the behaviour found at the
low electrolyte concentration. However, the voltage interval in which regular
oscillations existed was considerably smaller at high resistance than at low resistance.
(a) (b)
(c) (d)
Figure 6.21: Current time series of a Pt disk electrode in CO saturated 0.5 M H2SO4 electrolyte for different series resistances and external voltages; Series resistance (a) and (b) R = 50 Ω; (c) and (d) R = 70 Ω. Applied voltage (a) U = 950 mV; (b) U = 930 mV; (c) U = 960 mV; (d) U = 920 mV; HCl concentration: 10-6 M; rotation rate: 1200 rpm.
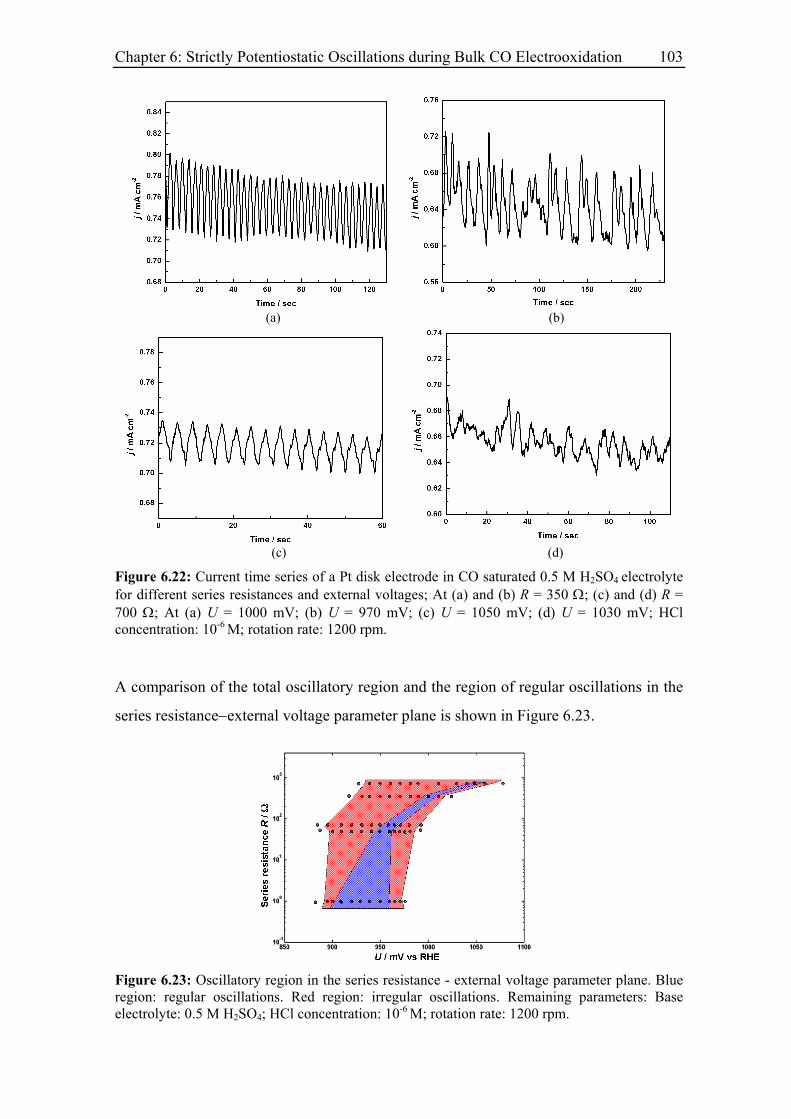
Chapter 6: Strictly Potentiostatic Oscillations during Bulk CO Electrooxidation 103
(a) (b)
(c) (d)
Figure 6.22: Current time series of a Pt disk electrode in CO saturated 0.5 M H2SO4 electrolyte for different series resistances and external voltages; At (a) and (b) R = 350 Ω; (c) and (d) R = 700 Ω; At (a) U = 1000 mV; (b) U = 970 mV; (c) U = 1050 mV; (d) U = 1030 mV; HCl concentration: 10-6 M; rotation rate: 1200 rpm.
A comparison of the total oscillatory region and the region of regular oscillations in the
series resistance−external voltage parameter plane is shown in Figure 6.23.
Figure 6.23: Oscillatory region in the series resistance - external voltage parameter plane. Blue region: regular oscillations. Red region: irregular oscillations. Remaining parameters: Base electrolyte: 0.5 M H2SO4; HCl concentration: 10-6 M; rotation rate: 1200 rpm.
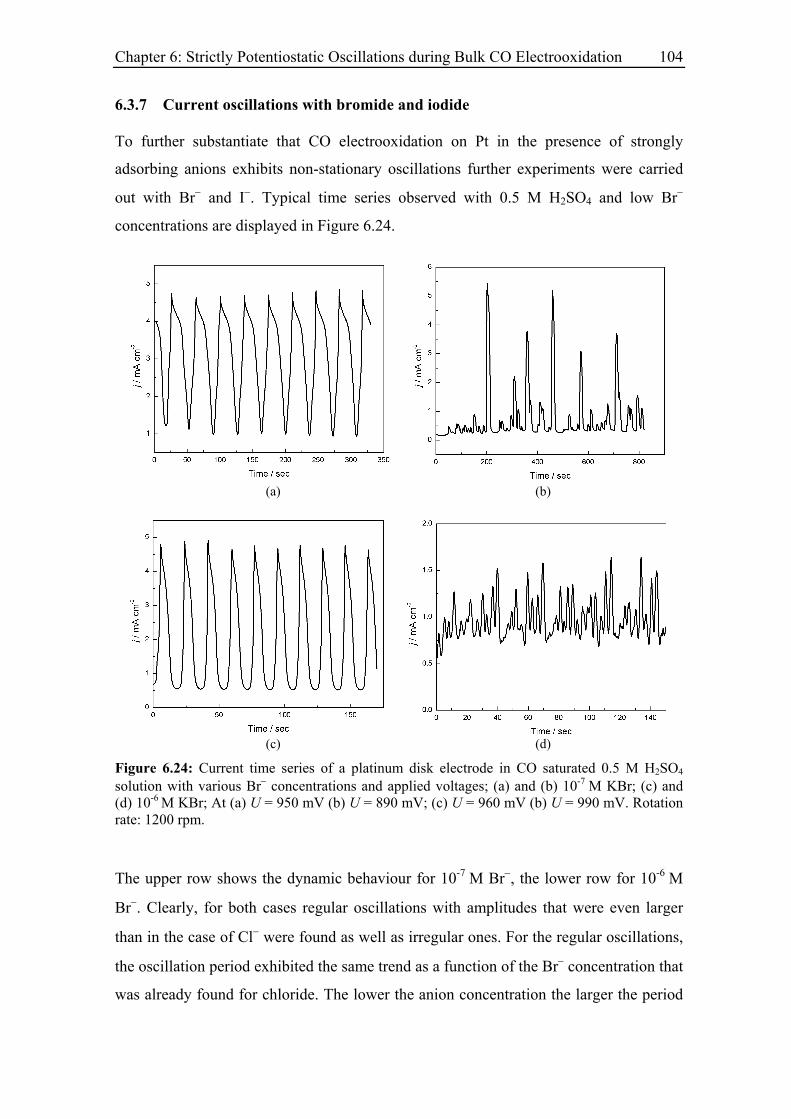
Chapter 6: Strictly Potentiostatic Oscillations during Bulk CO Electrooxidation 104
6.3.7 Current oscillations with bromide and iodide
To further substantiate that CO electrooxidation on Pt in the presence of strongly
adsorbing anions exhibits non-stationary oscillations further experiments were carried
out with Br− and I−. Typical time series observed with 0.5 M H2SO4 and low Br−
concentrations are displayed in Figure 6.24.
(a) (b)
(c) (d)
Figure 6.24: Current time series of a platinum disk electrode in CO saturated 0.5 M H2SO4 solution with various Br− concentrations and applied voltages; (a) and (b) 10-7 M KBr; (c) and (d) 10-6 M KBr; At (a) U = 950 mV (b) U = 890 mV; (c) U = 960 mV (b) U = 990 mV. Rotation rate: 1200 rpm.
The upper row shows the dynamic behaviour for 10-7 M Br−, the lower row for 10-6 M
Br−. Clearly, for both cases regular oscillations with amplitudes that were even larger
than in the case of Cl− were found as well as irregular ones. For the regular oscillations,
the oscillation period exhibited the same trend as a function of the Br− concentration that
was already found for chloride. The lower the anion concentration the larger the period
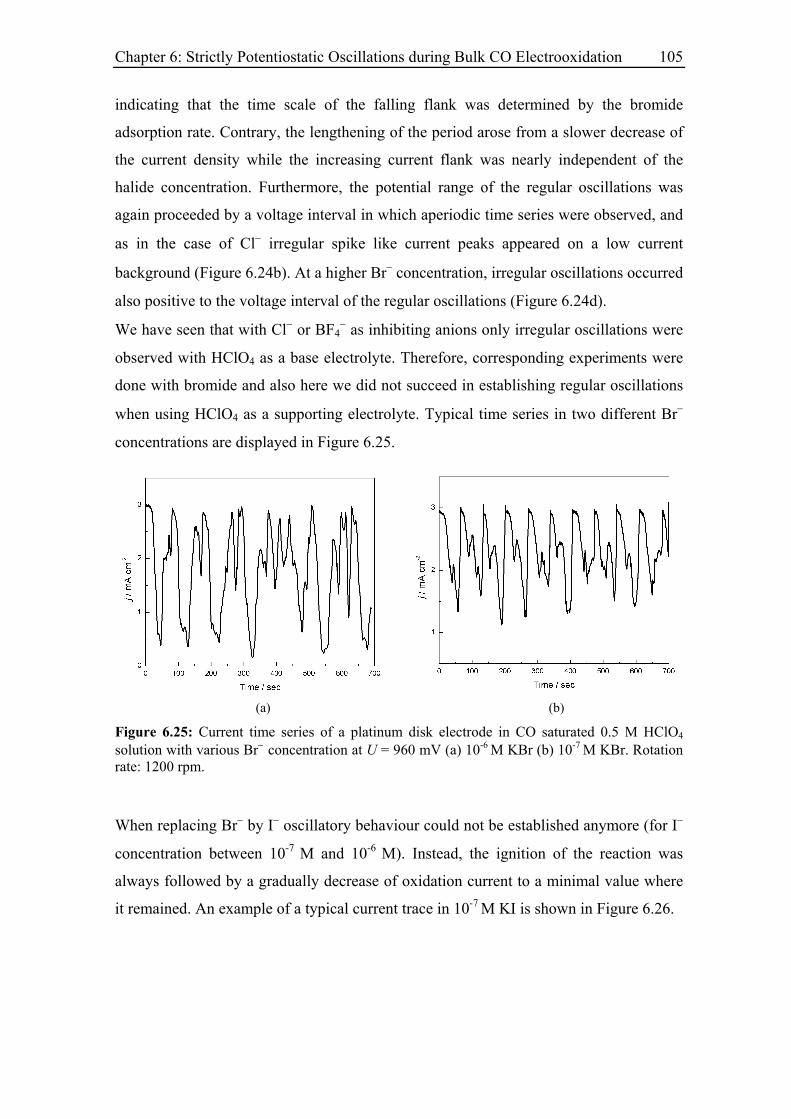
Chapter 6: Strictly Potentiostatic Oscillations during Bulk CO Electrooxidation 105
indicating that the time scale of the falling flank was determined by the bromide
adsorption rate. Contrary, the lengthening of the period arose from a slower decrease of
the current density while the increasing current flank was nearly independent of the
halide concentration. Furthermore, the potential range of the regular oscillations was
again proceeded by a voltage interval in which aperiodic time series were observed, and
as in the case of Cl− irregular spike like current peaks appeared on a low current
background (Figure 6.24b). At a higher Br− concentration, irregular oscillations occurred
also positive to the voltage interval of the regular oscillations (Figure 6.24d).
We have seen that with Cl− or BF4− as inhibiting anions only irregular oscillations were
observed with HClO4 as a base electrolyte. Therefore, corresponding experiments were
done with bromide and also here we did not succeed in establishing regular oscillations
when using HClO4 as a supporting electrolyte. Typical time series in two different Br−
concentrations are displayed in Figure 6.25.
(a) (b)
Figure 6.25: Current time series of a platinum disk electrode in CO saturated 0.5 M HClO4 solution with various Br− concentration at U = 960 mV (a) 10-6 M KBr (b) 10-7 M KBr. Rotation rate: 1200 rpm.
When replacing Br− by I− oscillatory behaviour could not be established anymore (for I−
concentration between 10-7 M and 10-6 M). Instead, the ignition of the reaction was
always followed by a gradually decrease of oxidation current to a minimal value where
it remained. An example of a typical current trace in 10-7 M KI is shown in Figure 6.26.
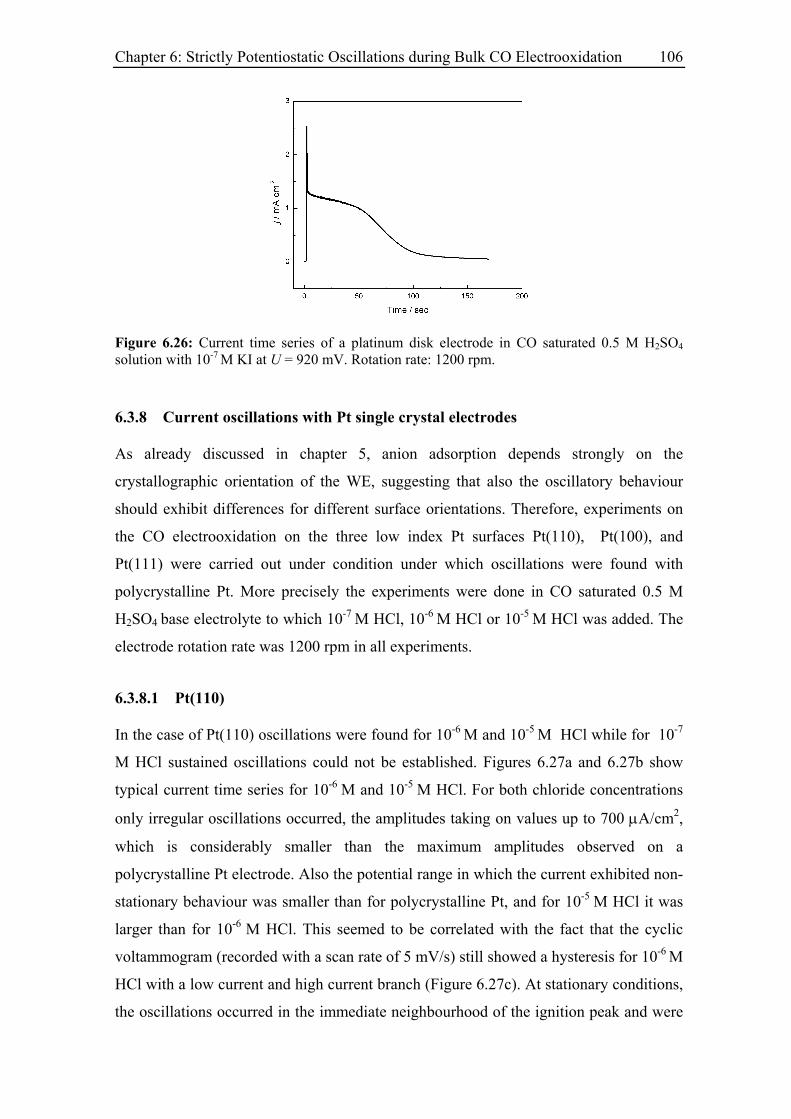
Chapter 6: Strictly Potentiostatic Oscillations during Bulk CO Electrooxidation 106
Figure 6.26: Current time series of a platinum disk electrode in CO saturated 0.5 M H2SO4 solution with 10-7 M KI at U = 920 mV. Rotation rate: 1200 rpm.
6.3.8 Current oscillations with Pt single crystal electrodes
As already discussed in chapter 5, anion adsorption depends strongly on the
crystallographic orientation of the WE, suggesting that also the oscillatory behaviour
should exhibit differences for different surface orientations. Therefore, experiments on
the CO electrooxidation on the three low index Pt surfaces Pt(110), Pt(100), and
Pt(111) were carried out under condition under which oscillations were found with
polycrystalline Pt. More precisely the experiments were done in CO saturated 0.5 M
H2SO4 base electrolyte to which 10-7 M HCl, 10-6 M HCl or 10-5 M HCl was added. The
electrode rotation rate was 1200 rpm in all experiments.
6.3.8.1 Pt(110)
In the case of Pt(110) oscillations were found for 10-6 M and 10-5 M HCl while for 10-7
M HCl sustained oscillations could not be established. Figures 6.27a and 6.27b show
typical current time series for 10-6 M and 10-5 M HCl. For both chloride concentrations
only irregular oscillations occurred, the amplitudes taking on values up to 700 µA/cm2,
which is considerably smaller than the maximum amplitudes observed on a
polycrystalline Pt electrode. Also the potential range in which the current exhibited non-
stationary behaviour was smaller than for polycrystalline Pt, and for 10-5 M HCl it was
larger than for 10-6 M HCl. This seemed to be correlated with the fact that the cyclic
voltammogram (recorded with a scan rate of 5 mV/s) still showed a hysteresis for 10-6 M
HCl with a low current and high current branch (Figure 6.27c). At stationary conditions,
the oscillations occurred in the immediate neighbourhood of the ignition peak and were
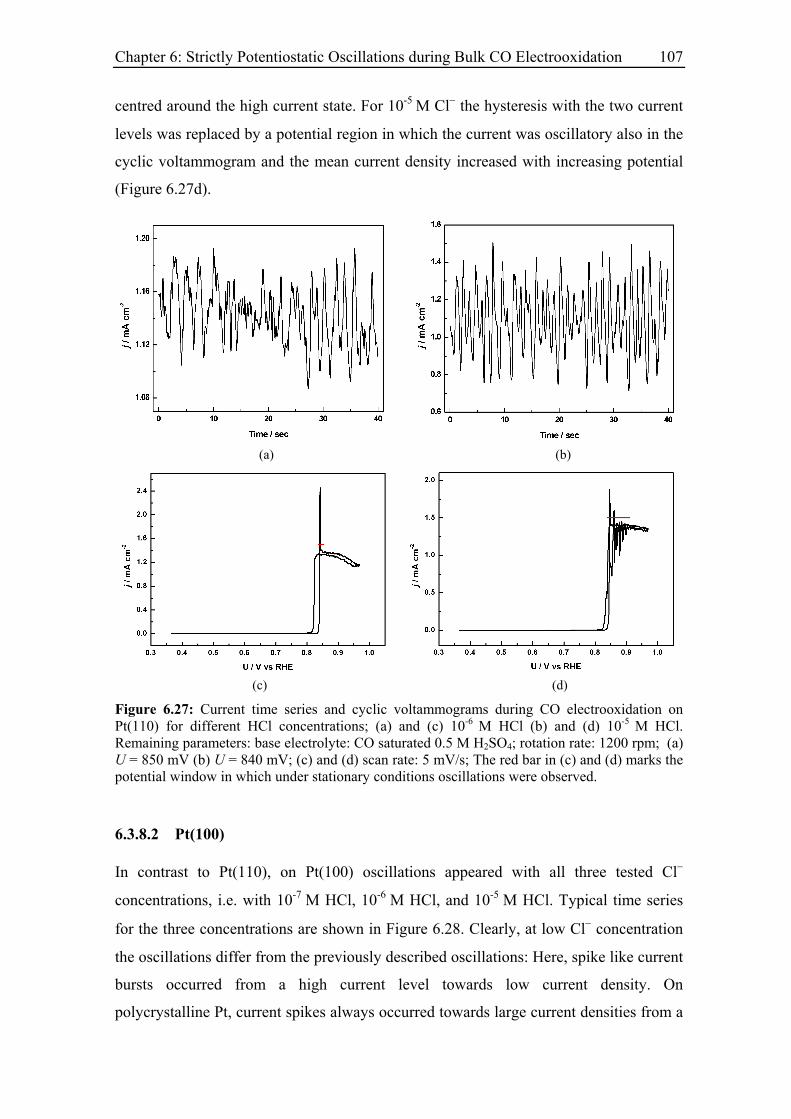
Chapter 6: Strictly Potentiostatic Oscillations during Bulk CO Electrooxidation 107
centred around the high current state. For 10-5 M Cl− the hysteresis with the two current
levels was replaced by a potential region in which the current was oscillatory also in the
cyclic voltammogram and the mean current density increased with increasing potential
(Figure 6.27d).
(a) (b)
(c) (d)
Figure 6.27: Current time series and cyclic voltammograms during CO electrooxidation on Pt(110) for different HCl concentrations; (a) and (c) 10-6 M HCl (b) and (d) 10-5 M HCl. Remaining parameters: base electrolyte: CO saturated 0.5 M H2SO4; rotation rate: 1200 rpm; (a) U = 850 mV (b) U = 840 mV; (c) and (d) scan rate: 5 mV/s; The red bar in (c) and (d) marks the potential window in which under stationary conditions oscillations were observed.
6.3.8.2 Pt(100)
In contrast to Pt(110), on Pt(100) oscillations appeared with all three tested Cl−
concentrations, i.e. with 10-7 M HCl, 10-6 M HCl, and 10-5 M HCl. Typical time series
for the three concentrations are shown in Figure 6.28. Clearly, at low Cl− concentration
the oscillations differ from the previously described oscillations: Here, spike like current
bursts occurred from a high current level towards low current density. On
polycrystalline Pt, current spikes always occurred towards large current densities from a
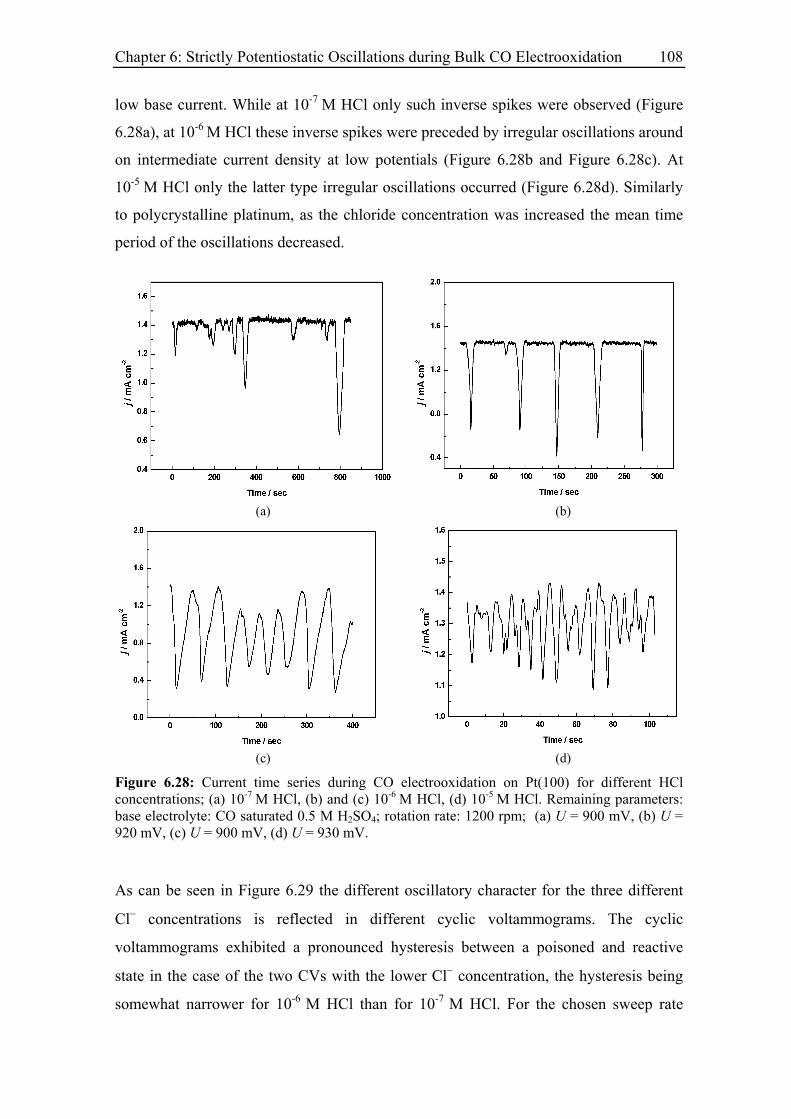
Chapter 6: Strictly Potentiostatic Oscillations during Bulk CO Electrooxidation 108
low base current. While at 10-7 M HCl only such inverse spikes were observed (Figure
6.28a), at 10-6 M HCl these inverse spikes were preceded by irregular oscillations around
on intermediate current density at low potentials (Figure 6.28b and Figure 6.28c). At
10-5 M HCl only the latter type irregular oscillations occurred (Figure 6.28d). Similarly
to polycrystalline platinum, as the chloride concentration was increased the mean time
period of the oscillations decreased.
(a) (b)
(c) (d)
Figure 6.28: Current time series during CO electrooxidation on Pt(100) for different HCl concentrations; (a) 10-7 M HCl, (b) and (c) 10-6 M HCl, (d) 10-5 M HCl. Remaining parameters: base electrolyte: CO saturated 0.5 M H2SO4; rotation rate: 1200 rpm; (a) U = 900 mV, (b) U = 920 mV, (c) U = 900 mV, (d) U = 930 mV.
As can be seen in Figure 6.29 the different oscillatory character for the three different
Cl− concentrations is reflected in different cyclic voltammograms. The cyclic
voltammograms exhibited a pronounced hysteresis between a poisoned and reactive
state in the case of the two CVs with the lower Cl− concentration, the hysteresis being
somewhat narrower for 10-6 M HCl than for 10-7 M HCl. For the chosen sweep rate

Chapter 6: Strictly Potentiostatic Oscillations during Bulk CO Electrooxidation 109
oscillations cannot be discerned in the two CVs but a comparison with the time series
obtained under the stationary condition (cf. Figure 6.28c, d) suggest that the high current
branch was oscillatory and the oscillations coexist with a stable poisoned state. At 10-5
M HCl, the hysteresis was considerably smaller and oscillations were discernible on the
high current branch, which did not exhibit a constant level but a falling average value.
(a) (b)
(c)
Figure 6.29: Cyclic voltammogram during CO electrooxidation on Pt(100) for different HCl concentration; (a) 10-7 M HCl, (b) 10-6 M HCl, (c) 10-5 M HCl. Remaining parameters: base electrolyte: CO saturated 0.5 M H2SO4; rotation rate: 1200 rpm; scan rate: 5 mV/s; The red bar in figure marks the potential window in which under stationary condition oscillations were observed.
6.3.8.3 Pt(111)
In the case of Pt(111), current time series recorded at a constant voltage exhibited
always a strong decrease of the mean current density, even at Cl− concentration as low
as 10-7 M, and the long-term behaviour exhibited a vanishing current density. Yet, in a
small potential window, this decay in the mean current was superimposed by fast, low
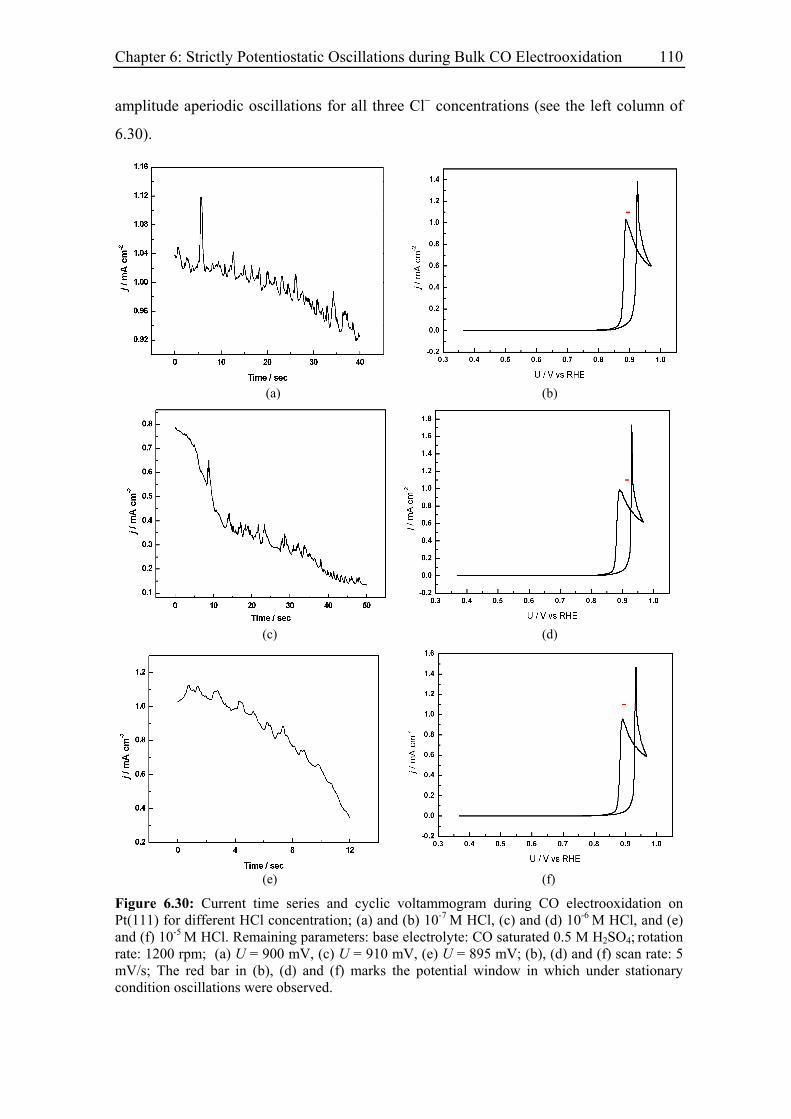
Chapter 6: Strictly Potentiostatic Oscillations during Bulk CO Electrooxidation 110
amplitude aperiodic oscillations for all three Cl− concentrations (see the left column of
6.30).
(a) (b)
(c) (d)
(e) (f)
Figure 6.30: Current time series and cyclic voltammogram during CO electrooxidation on Pt(111) for different HCl concentration; (a) and (b) 10-7 M HCl, (c) and (d) 10-6 M HCl, and (e) and (f) 10-5 M HCl. Remaining parameters: base electrolyte: CO saturated 0.5 M H2SO4; rotation rate: 1200 rpm; (a) U = 900 mV, (c) U = 910 mV, (e) U = 895 mV; (b), (d) and (f) scan rate: 5 mV/s; The red bar in (b), (d) and (f) marks the potential window in which under stationary condition oscillations were observed.
Chapter 6: Strictly Potentiostatic Oscillations during Bulk CO Electrooxidation 111
The corresponding cyclic voltammograms, again recorded at a sweep rate of 5 mV/s,
also exhibited a remarkable difference to those of the other two low indexed
orientations: In the reactive state, the current density strongly decreased with increasing
potential on the forward as well as on the backward sweep with a small hysteresis in the
two scan directions. The difference of the cyclic voltammograms obtained for different
Cl− concentrations was marginal. This indicates that the potential dependence of the
current density on the reactive branch stems from sulphate adsorption.
6.4 Model and simulation
In this section, we discuss a mean field model, which explains some of the experimental
results.
6.4.1 Strictly potentiostatic oscillator
The simplest way to adopt the model for CO electrooxidation introduced in chapter 4 to
the experimental conditions under which oscillations were found is to augment the
reaction steps by the ad- and desorption of anions [45], whereby the only interaction
among the anions and between anion and CO or OH is through the competition for free
surface sites. Thus, we consider the following reaction steps.
COb → COs (6.1)
COs + M → COad (6.2)
H2O + M ↔ OHad + H+ + e- (6.3)
COad + OHad → CO2 + H+ +e- + 2 M (6.4)
X + M ↔ Xad (6.5)
Equation (6.1) describes the transport of CO from the bulk solution to the electrode
surface, (6.2) describes the adsorption of CO on a free site of the electrode, denoted by
M, (6.3) describes the oxidative chemisorption of water on the electrode, (6.4) describes
the reaction between adsorbed CO and adsorbed OH species and (6.5) describes the ad-
and desorption of anions X on free surface sites. This reaction mechanism can be cast
into a set of four ordinary differential equations determining the temporal evolutions of
the CO concentration in front of the electrode cs, and the coverage of CO (θCO), OH
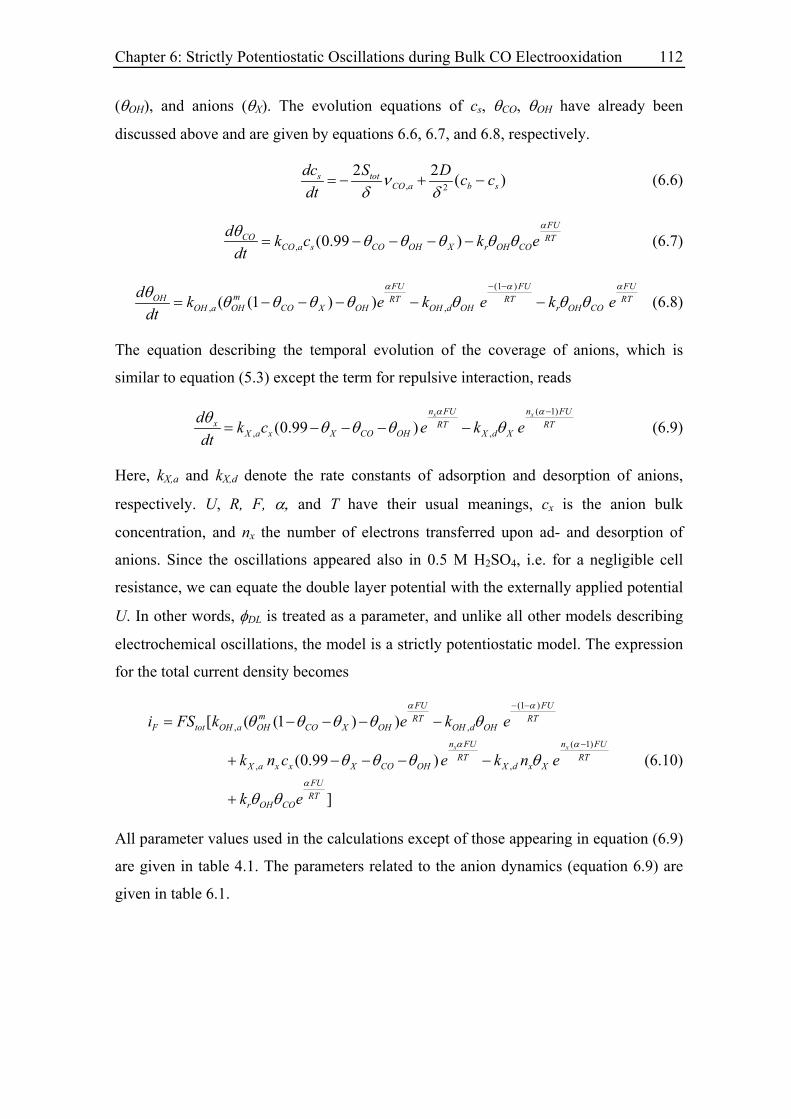
Chapter 6: Strictly Potentiostatic Oscillations during Bulk CO Electrooxidation 112
(θOH), and anions (θX). The evolution equations of cs, θCO, θOH have already been
discussed above and are given by equations 6.6, 6.7, and 6.8, respectively.
, 2
2 2 (s totCO a b s
dc S D c cdt
νδ δ
= − + − ) (6.6)
, (0.99 )FU
CO RTCO a s CO OH X r OH CO
d k c k edt
αθ θ θ θ θ θ= − − − − (6.7)
(1 )
, ,( (1 ) )FU FU FU
mOH RT RT RTOH a OH CO X OH OH d OH r OH CO
d k e k edt
α αθ θ θ θ θ θ θ θ− −
= − − − − − k eα
(6.8)
The equation describing the temporal evolution of the coverage of anions, which is
similar to equation (5.3) except the term for repulsive interaction, reads
( 1)
, ,(0.99 )x xn FU n FU
x RT RTX a x X CO OH X d X
d k c e k edt
α αθ θ θ θ θ−
= − − − − (6.9)
Here, kX,a and kX,d denote the rate constants of adsorption and desorption of anions,
respectively. U, R, F, α, and T have their usual meanings, cx is the anion bulk
concentration, and nx the number of electrons transferred upon ad- and desorption of
anions. Since the oscillations appeared also in 0.5 M H2SO4, i.e. for a negligible cell
resistance, we can equate the double layer potential with the externally applied potential
U. In other words, φDL is treated as a parameter, and unlike all other models describing
electrochemical oscillations, the model is a strictly potentiostatic model. The expression
for the total current density becomes
(1 )
, ,
( 1)
, ,
[ ( (1 ) )
(0.99 )
]
x x
FU FUm RT RT
F tot OH a OH CO X OH OH d OH
n FU n FURT RT
X a x x X CO OH X d x X
FURT
r OH CO
i FS k e k e
k n c e k n e
k e
α α
α α
α
θ θ θ θ θ
θ θ θ θ
θ θ
− −
−
= − − − −
+ − − − −
+
(6.10)
All parameter values used in the calculations except of those appearing in equation (6.9)
are given in table 4.1. The parameters related to the anion dynamics (equation 6.9) are
given in table 6.1.
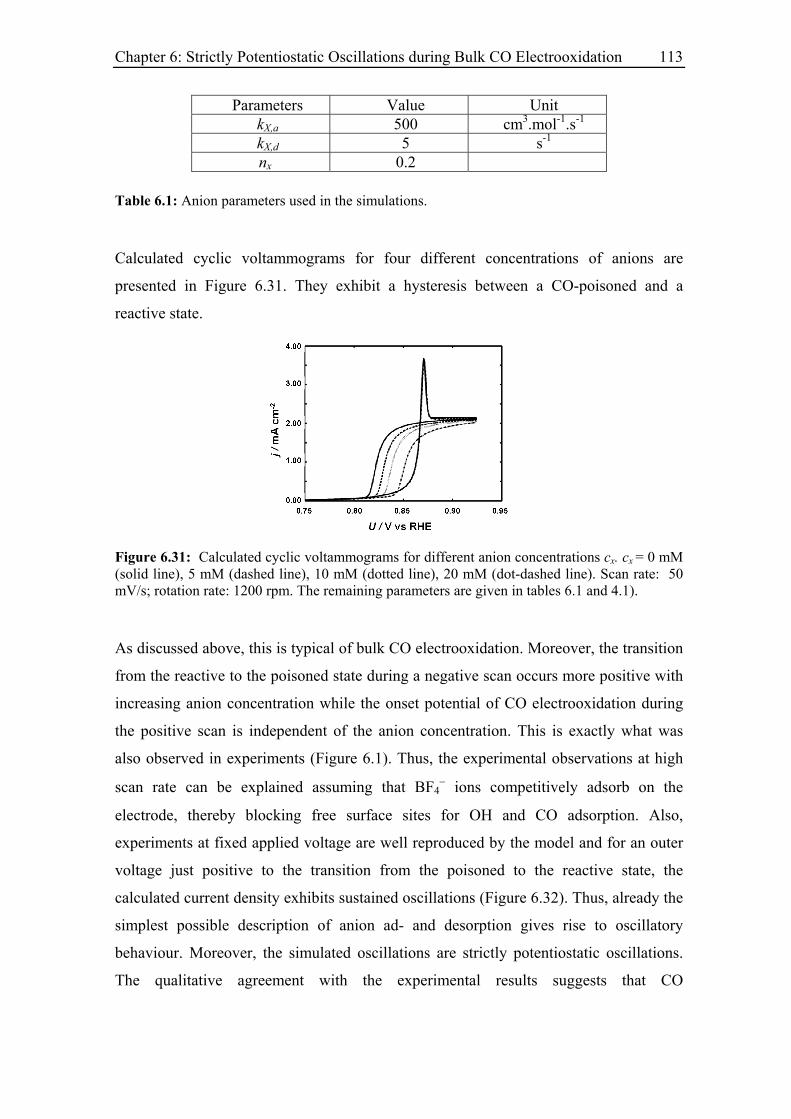
Chapter 6: Strictly Potentiostatic Oscillations during Bulk CO Electrooxidation 113
Parameters Value Unit kX,a 500 cm3.mol-1.s-1
kX,d 5 s-1
nx 0.2
Table 6.1: Anion parameters used in the simulations.
Calculated cyclic voltammograms for four different concentrations of anions are
presented in Figure 6.31. They exhibit a hysteresis between a CO-poisoned and a
reactive state.
Figure 6.31: Calculated cyclic voltammograms for different anion concentrations cx. cx = 0 mM (solid line), 5 mM (dashed line), 10 mM (dotted line), 20 mM (dot-dashed line). Scan rate: 50 mV/s; rotation rate: 1200 rpm. The remaining parameters are given in tables 6.1 and 4.1).
As discussed above, this is typical of bulk CO electrooxidation. Moreover, the transition
from the reactive to the poisoned state during a negative scan occurs more positive with
increasing anion concentration while the onset potential of CO electrooxidation during
the positive scan is independent of the anion concentration. This is exactly what was
also observed in experiments (Figure 6.1). Thus, the experimental observations at high
scan rate can be explained assuming that BF4− ions competitively adsorb on the
electrode, thereby blocking free surface sites for OH and CO adsorption. Also,
experiments at fixed applied voltage are well reproduced by the model and for an outer
voltage just positive to the transition from the poisoned to the reactive state, the
calculated current density exhibits sustained oscillations (Figure 6.32). Thus, already the
simplest possible description of anion ad- and desorption gives rise to oscillatory
behaviour. Moreover, the simulated oscillations are strictly potentiostatic oscillations.
The qualitative agreement with the experimental results suggests that CO
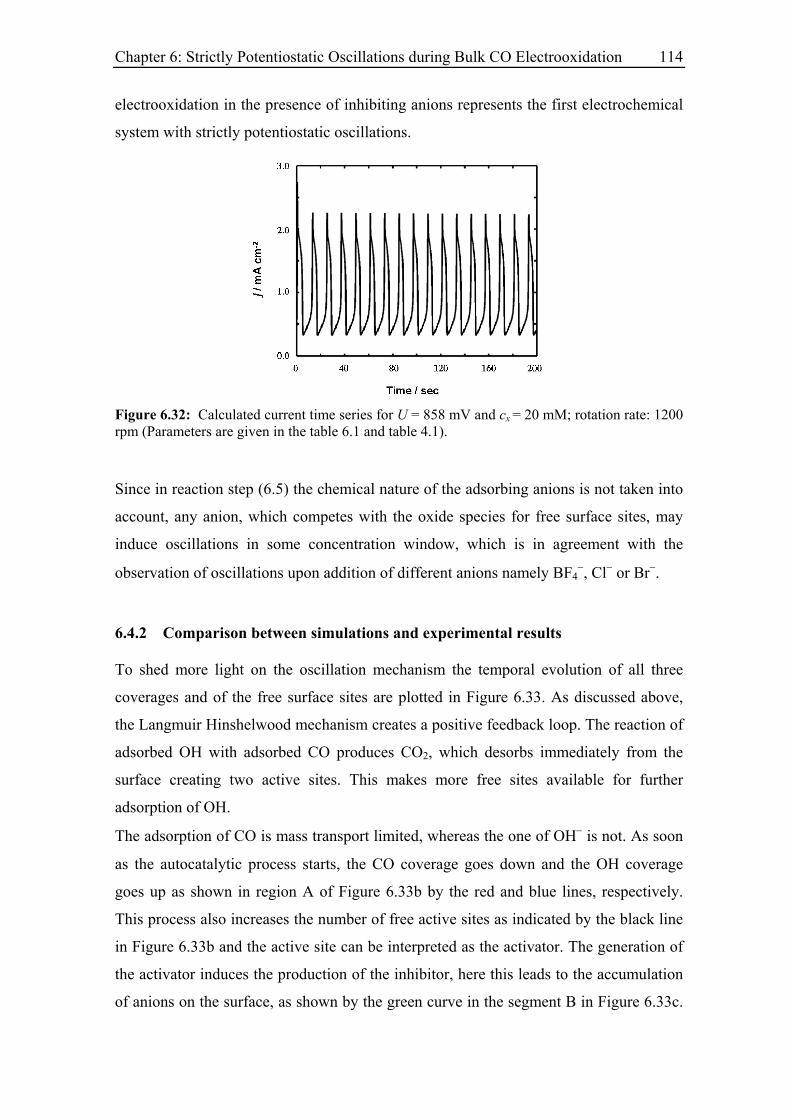
Chapter 6: Strictly Potentiostatic Oscillations during Bulk CO Electrooxidation 114
electrooxidation in the presence of inhibiting anions represents the first electrochemical
system with strictly potentiostatic oscillations.
Figure 6.32: Calculated current time series for U = 858 mV and cx = 20 mM; rotation rate: 1200 rpm (Parameters are given in the table 6.1 and table 4.1).
Since in reaction step (6.5) the chemical nature of the adsorbing anions is not taken into
account, any anion, which competes with the oxide species for free surface sites, may
induce oscillations in some concentration window, which is in agreement with the
observation of oscillations upon addition of different anions namely BF4−, Cl− or Br−.
6.4.2 Comparison between simulations and experimental results
To shed more light on the oscillation mechanism the temporal evolution of all three
coverages and of the free surface sites are plotted in Figure 6.33. As discussed above,
the Langmuir Hinshelwood mechanism creates a positive feedback loop. The reaction of
adsorbed OH with adsorbed CO produces CO2, which desorbs immediately from the
surface creating two active sites. This makes more free sites available for further
adsorption of OH.
The adsorption of CO is mass transport limited, whereas the one of OH− is not. As soon
as the autocatalytic process starts, the CO coverage goes down and the OH coverage
goes up as shown in region A of Figure 6.33b by the red and blue lines, respectively.
This process also increases the number of free active sites as indicated by the black line
in Figure 6.33b and the active site can be interpreted as the activator. The generation of
the activator induces the production of the inhibitor, here this leads to the accumulation
of anions on the surface, as shown by the green curve in the segment B in Figure 6.33c.
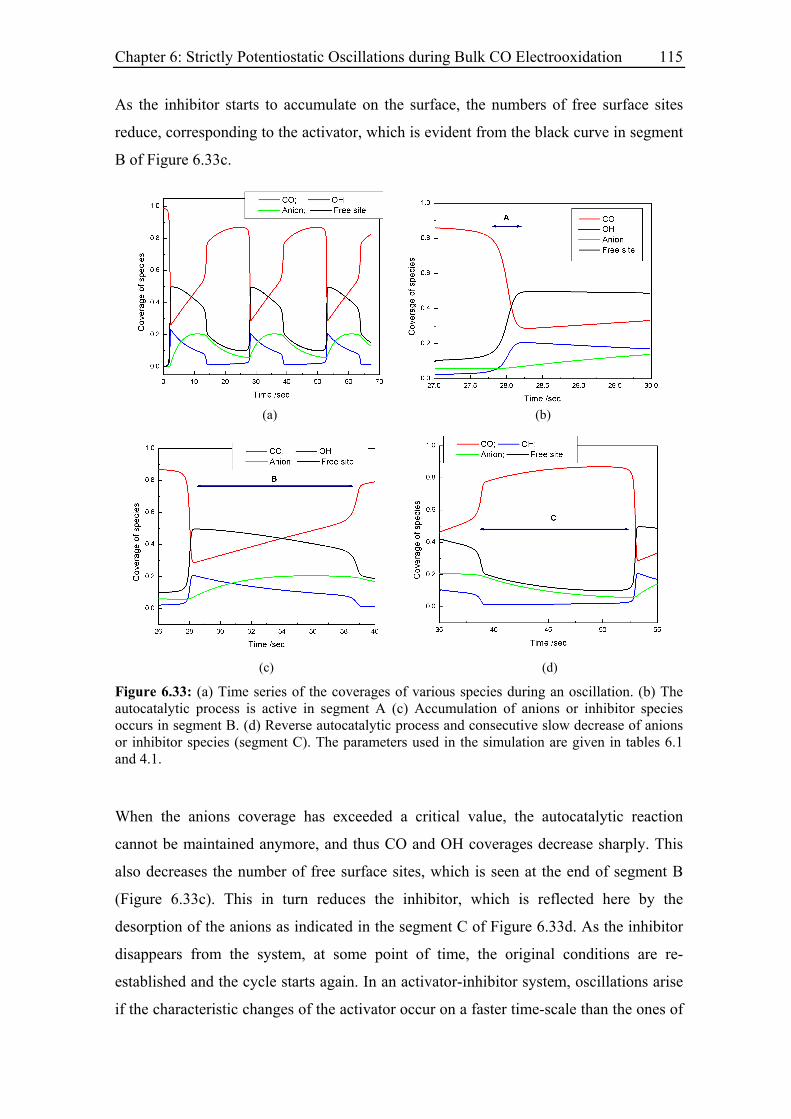
Chapter 6: Strictly Potentiostatic Oscillations during Bulk CO Electrooxidation 115
As the inhibitor starts to accumulate on the surface, the numbers of free surface sites
reduce, corresponding to the activator, which is evident from the black curve in segment
B of Figure 6.33c.
(a) (b)
(c) (d)
Figure 6.33: (a) Time series of the coverages of various species during an oscillation. (b) The autocatalytic process is active in segment A (c) Accumulation of anions or inhibitor species occurs in segment B. (d) Reverse autocatalytic process and consecutive slow decrease of anions or inhibitor species (segment C). The parameters used in the simulation are given in tables 6.1 and 4.1.
When the anions coverage has exceeded a critical value, the autocatalytic reaction
cannot be maintained anymore, and thus CO and OH coverages decrease sharply. This
also decreases the number of free surface sites, which is seen at the end of segment B
(Figure 6.33c). This in turn reduces the inhibitor, which is reflected here by the
desorption of the anions as indicated in the segment C of Figure 6.33d. As the inhibitor
disappears from the system, at some point of time, the original conditions are re-
established and the cycle starts again. In an activator-inhibitor system, oscillations arise
if the characteristic changes of the activator occur on a faster time-scale than the ones of
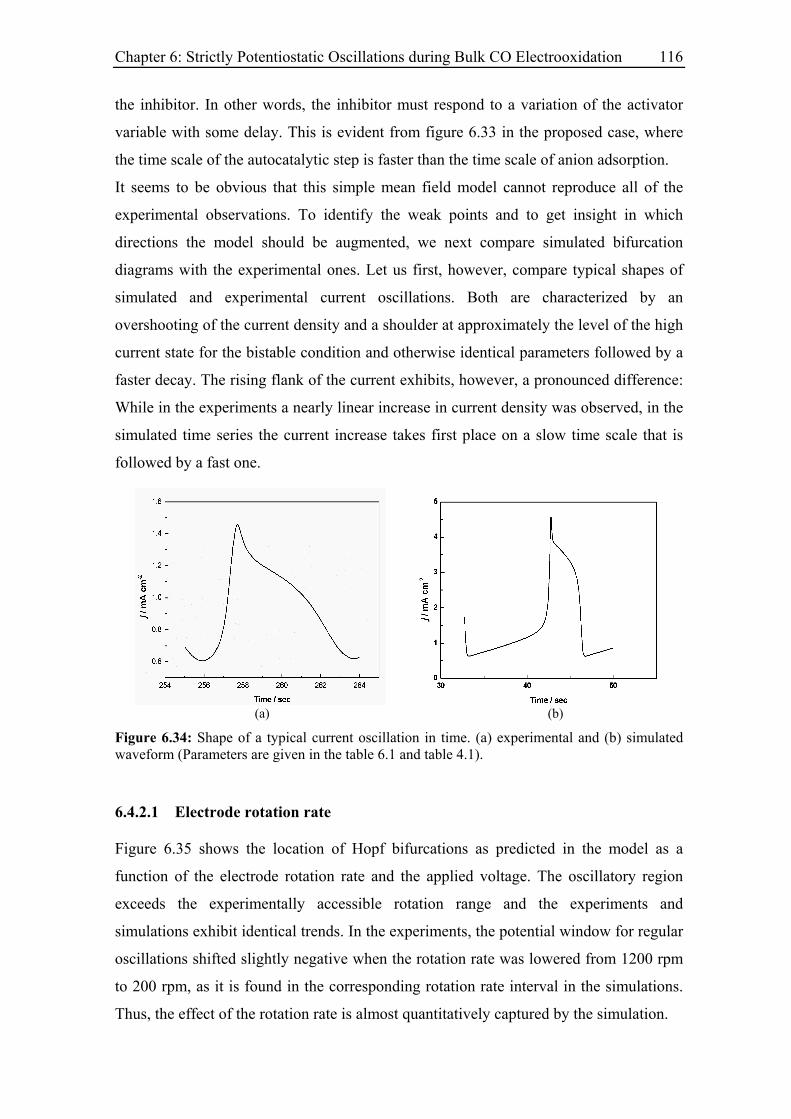
Chapter 6: Strictly Potentiostatic Oscillations during Bulk CO Electrooxidation 116
the inhibitor. In other words, the inhibitor must respond to a variation of the activator
variable with some delay. This is evident from figure 6.33 in the proposed case, where
the time scale of the autocatalytic step is faster than the time scale of anion adsorption.
It seems to be obvious that this simple mean field model cannot reproduce all of the
experimental observations. To identify the weak points and to get insight in which
directions the model should be augmented, we next compare simulated bifurcation
diagrams with the experimental ones. Let us first, however, compare typical shapes of
simulated and experimental current oscillations. Both are characterized by an
overshooting of the current density and a shoulder at approximately the level of the high
current state for the bistable condition and otherwise identical parameters followed by a
faster decay. The rising flank of the current exhibits, however, a pronounced difference:
While in the experiments a nearly linear increase in current density was observed, in the
simulated time series the current increase takes first place on a slow time scale that is
followed by a fast one.
(a) (b)
Figure 6.34: Shape of a typical current oscillation in time. (a) experimental and (b) simulated waveform (Parameters are given in the table 6.1 and table 4.1).
6.4.2.1 Electrode rotation rate
Figure 6.35 shows the location of Hopf bifurcations as predicted in the model as a
function of the electrode rotation rate and the applied voltage. The oscillatory region
exceeds the experimentally accessible rotation range and the experiments and
simulations exhibit identical trends. In the experiments, the potential window for regular
oscillations shifted slightly negative when the rotation rate was lowered from 1200 rpm
to 200 rpm, as it is found in the corresponding rotation rate interval in the simulations.
Thus, the effect of the rotation rate is almost quantitatively captured by the simulation.
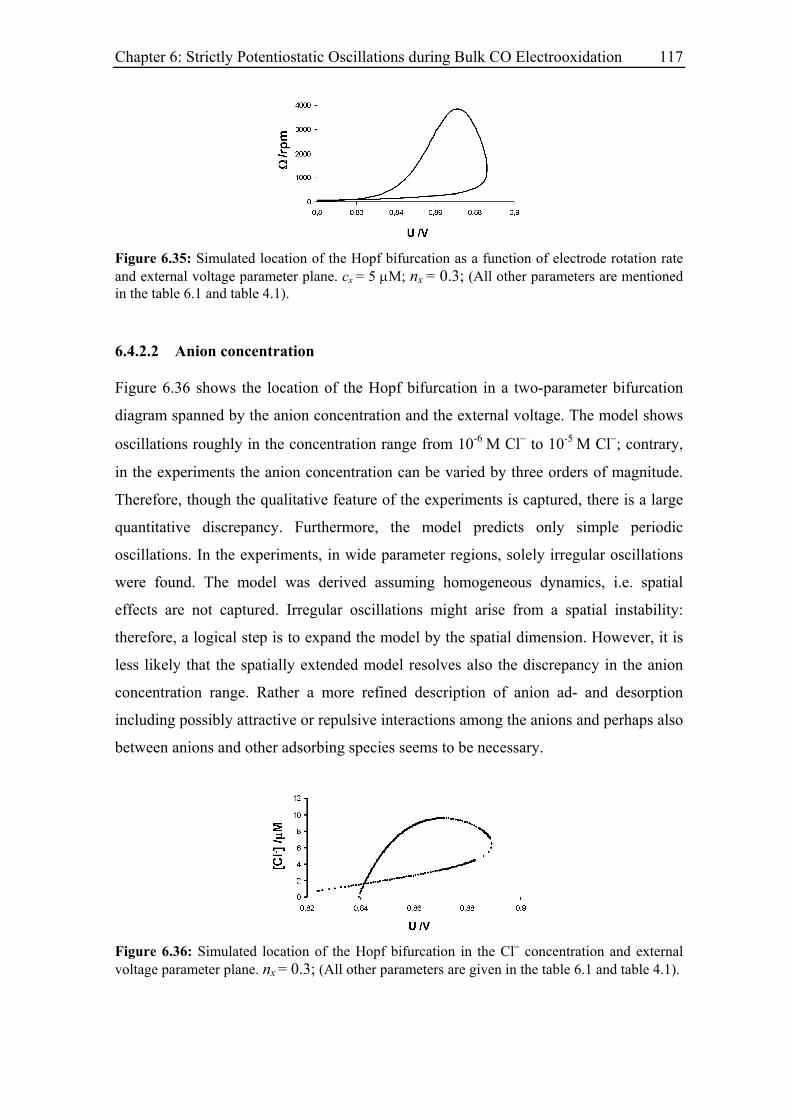
Chapter 6: Strictly Potentiostatic Oscillations during Bulk CO Electrooxidation 117
Figure 6.35: Simulated location of the Hopf bifurcation as a function of electrode rotation rate and external voltage parameter plane. cx = 5 µM; nx = 0.3; (All other parameters are mentioned in the table 6.1 and table 4.1).
6.4.2.2 Anion concentration
Figure 6.36 shows the location of the Hopf bifurcation in a two-parameter bifurcation
diagram spanned by the anion concentration and the external voltage. The model shows
oscillations roughly in the concentration range from 10-6 M Cl− to 10-5 M Cl−; contrary,
in the experiments the anion concentration can be varied by three orders of magnitude.
Therefore, though the qualitative feature of the experiments is captured, there is a large
quantitative discrepancy. Furthermore, the model predicts only simple periodic
oscillations. In the experiments, in wide parameter regions, solely irregular oscillations
were found. The model was derived assuming homogeneous dynamics, i.e. spatial
effects are not captured. Irregular oscillations might arise from a spatial instability:
therefore, a logical step is to expand the model by the spatial dimension. However, it is
less likely that the spatially extended model resolves also the discrepancy in the anion
concentration range. Rather a more refined description of anion ad- and desorption
including possibly attractive or repulsive interactions among the anions and perhaps also
between anions and other adsorbing species seems to be necessary.
Figure 6.36: Simulated location of the Hopf bifurcation in the Cl− concentration and external voltage parameter plane. nx = 0.3; (All other parameters are given in the table 6.1 and table 4.1).
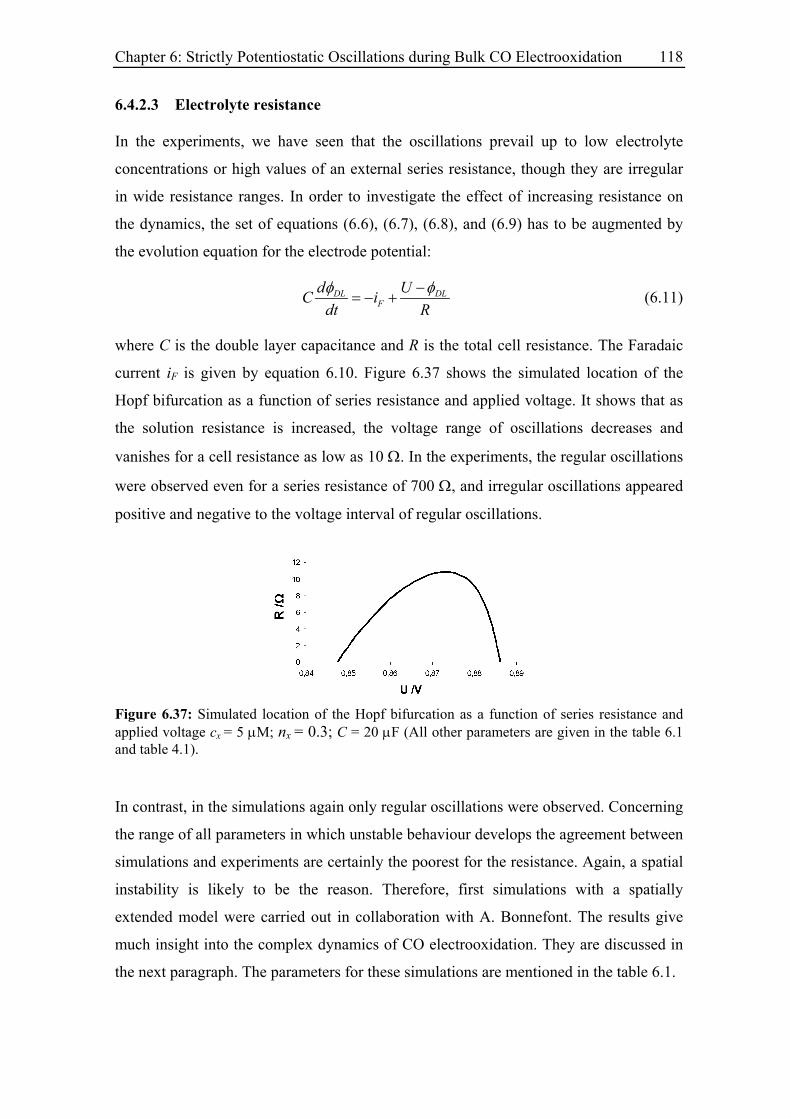
Chapter 6: Strictly Potentiostatic Oscillations during Bulk CO Electrooxidation 118
6.4.2.3 Electrolyte resistance
In the experiments, we have seen that the oscillations prevail up to low electrolyte
concentrations or high values of an external series resistance, though they are irregular
in wide resistance ranges. In order to investigate the effect of increasing resistance on
the dynamics, the set of equations (6.6), (6.7), (6.8), and (6.9) has to be augmented by
the evolution equation for the electrode potential:
DLF
d UC idt R
DLφ φ−= − + (6.11)
where C is the double layer capacitance and R is the total cell resistance. The Faradaic
current iF is given by equation 6.10. Figure 6.37 shows the simulated location of the
Hopf bifurcation as a function of series resistance and applied voltage. It shows that as
the solution resistance is increased, the voltage range of oscillations decreases and
vanishes for a cell resistance as low as 10 Ω. In the experiments, the regular oscillations
were observed even for a series resistance of 700 Ω, and irregular oscillations appeared
positive and negative to the voltage interval of regular oscillations.
Figure 6.37: Simulated location of the Hopf bifurcation as a function of series resistance and applied voltage cx = 5 µM; nx = 0.3; C = 20 µF (All other parameters are given in the table 6.1 and table 4.1).
In contrast, in the simulations again only regular oscillations were observed. Concerning
the range of all parameters in which unstable behaviour develops the agreement between
simulations and experiments are certainly the poorest for the resistance. Again, a spatial
instability is likely to be the reason. Therefore, first simulations with a spatially
extended model were carried out in collaboration with A. Bonnefont. The results give
much insight into the complex dynamics of CO electrooxidation. They are discussed in
the next paragraph. The parameters for these simulations are mentioned in the table 6.1.
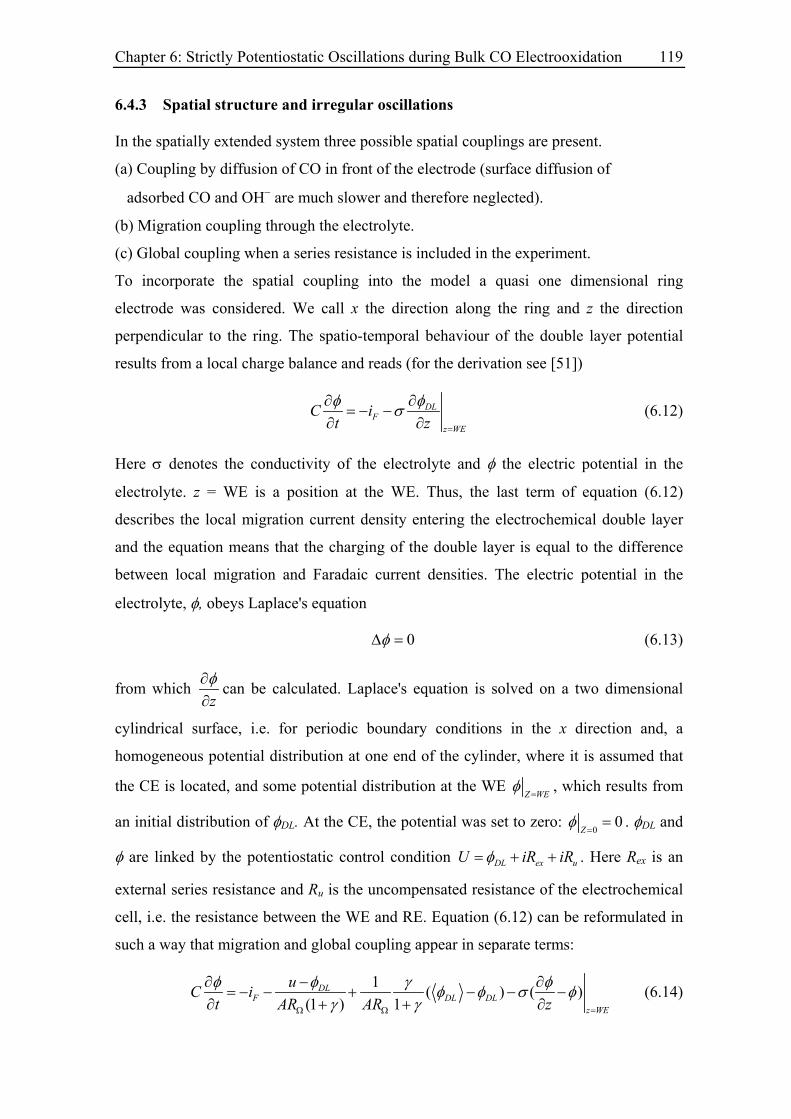
Chapter 6: Strictly Potentiostatic Oscillations during Bulk CO Electrooxidation 119
6.4.3 Spatial structure and irregular oscillations
In the spatially extended system three possible spatial couplings are present.
(a) Coupling by diffusion of CO in front of the electrode (surface diffusion of
adsorbed CO and OH− are much slower and therefore neglected).
(b) Migration coupling through the electrolyte.
(c) Global coupling when a series resistance is included in the experiment.
To incorporate the spatial coupling into the model a quasi one dimensional ring
electrode was considered. We call x the direction along the ring and z the direction
perpendicular to the ring. The spatio-temporal behaviour of the double layer potential
results from a local charge balance and reads (for the derivation see [51])
DLF
z WE
C it zφ φσ
=
∂ ∂= − −
∂ ∂ (6.12)
Here σ denotes the conductivity of the electrolyte and φ the electric potential in the
electrolyte. z = WE is a position at the WE. Thus, the last term of equation (6.12)
describes the local migration current density entering the electrochemical double layer
and the equation means that the charging of the double layer is equal to the difference
between local migration and Faradaic current densities. The electric potential in the
electrolyte, φ, obeys Laplace's equation
0φ∆ = (6.13)
from which zφ∂
∂can be calculated. Laplace's equation is solved on a two dimensional
cylindrical surface, i.e. for periodic boundary conditions in the x direction and, a
homogeneous potential distribution at one end of the cylinder, where it is assumed that
the CE is located, and some potential distribution at the WE Z WE
φ=
, which results from
an initial distribution of φDL. At the CE, the potential was set to zero: 0
0Z
φ=
= . φDL and
φ are linked by the potentiostatic control condition DL exR uiRU iφ= + + . Here Rex is an
external series resistance and Ru is the uncompensated resistance of the electrochemical
cell, i.e. the resistance between the WE and RE. Equation (6.12) can be reformulated in
such a way that migration and global coupling appear in separate terms:
1 ( ) ( )(1 ) 1
DLF DL DL
z WE
uC it AR AR zφ φ γ φφ φ σ φ
γ γ =Ω Ω
∂ − ∂= − − + − − −
∂ + + ∂ (6.14)
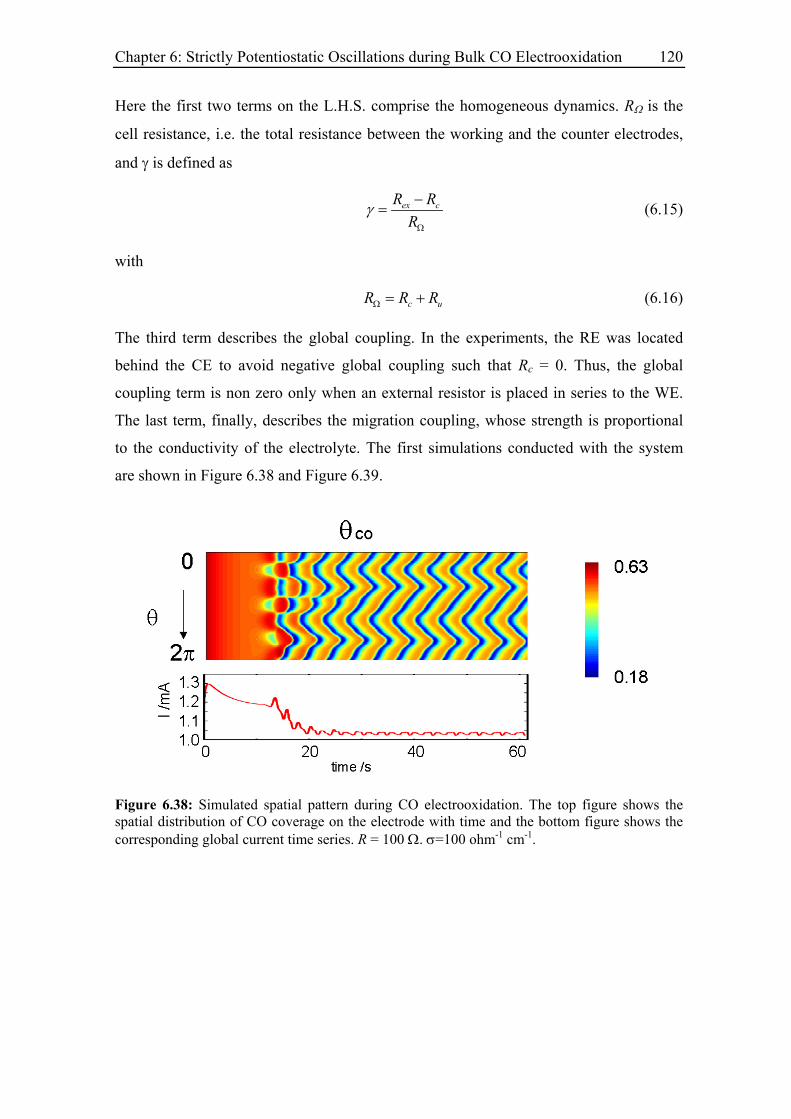
Chapter 6: Strictly Potentiostatic Oscillations during Bulk CO Electrooxidation 120
Here the first two terms on the L.H.S. comprise the homogeneous dynamics. RΩ is the
cell resistance, i.e. the total resistance between the working and the counter electrodes,
and γ is defined as
ex cR RR
γΩ
−= (6.15)
with
c uR R RΩ = + (6.16)
The third term describes the global coupling. In the experiments, the RE was located
behind the CE to avoid negative global coupling such that Rc = 0. Thus, the global
coupling term is non zero only when an external resistor is placed in series to the WE.
The last term, finally, describes the migration coupling, whose strength is proportional
to the conductivity of the electrolyte. The first simulations conducted with the system
are shown in Figure 6.38 and Figure 6.39.
Figure 6.38: Simulated spatial pattern during CO electrooxidation. The top figure shows the spatial distribution of CO coverage on the electrode with time and the bottom figure shows the corresponding global current time series. R = 100 Ω. σ=100 ohm-1 cm-1.
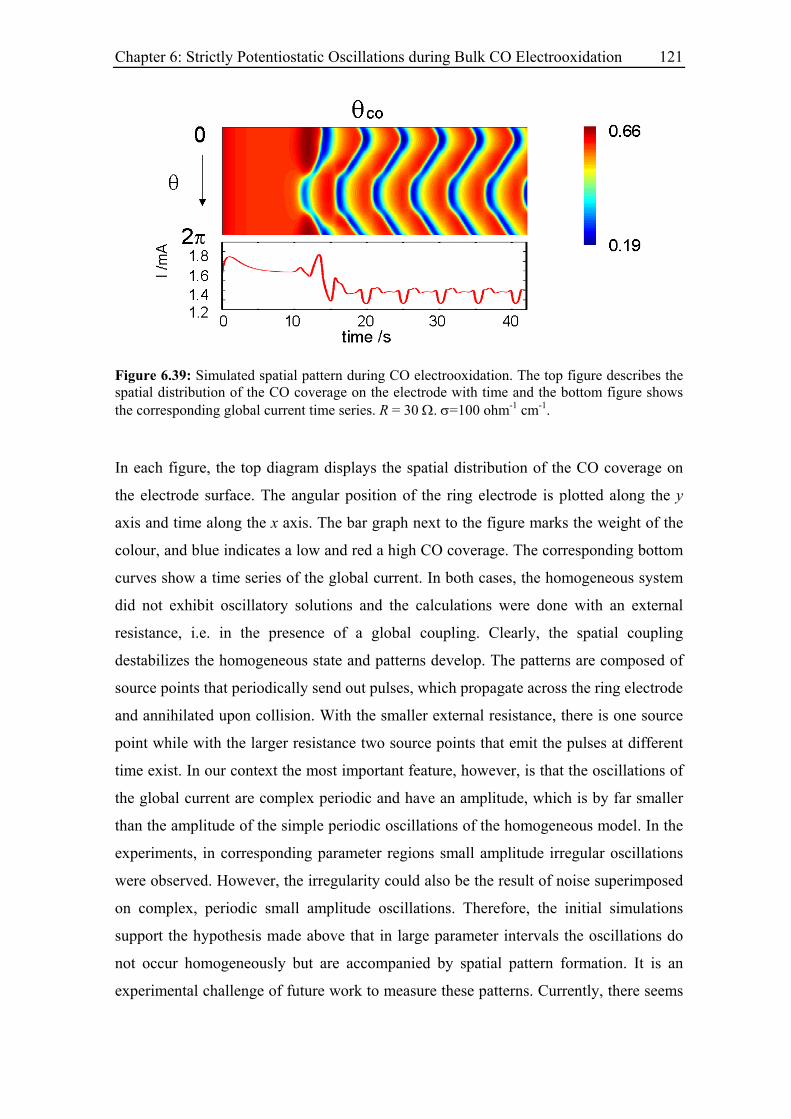
Chapter 6: Strictly Potentiostatic Oscillations during Bulk CO Electrooxidation 121
Figure 6.39: Simulated spatial pattern during CO electrooxidation. The top figure describes the spatial distribution of the CO coverage on the electrode with time and the bottom figure shows the corresponding global current time series. R = 30 Ω. σ=100 ohm-1 cm-1.
In each figure, the top diagram displays the spatial distribution of the CO coverage on
the electrode surface. The angular position of the ring electrode is plotted along the y
axis and time along the x axis. The bar graph next to the figure marks the weight of the
colour, and blue indicates a low and red a high CO coverage. The corresponding bottom
curves show a time series of the global current. In both cases, the homogeneous system
did not exhibit oscillatory solutions and the calculations were done with an external
resistance, i.e. in the presence of a global coupling. Clearly, the spatial coupling
destabilizes the homogeneous state and patterns develop. The patterns are composed of
source points that periodically send out pulses, which propagate across the ring electrode
and annihilated upon collision. With the smaller external resistance, there is one source
point while with the larger resistance two source points that emit the pulses at different
time exist. In our context the most important feature, however, is that the oscillations of
the global current are complex periodic and have an amplitude, which is by far smaller
than the amplitude of the simple periodic oscillations of the homogeneous model. In the
experiments, in corresponding parameter regions small amplitude irregular oscillations
were observed. However, the irregularity could also be the result of noise superimposed
on complex, periodic small amplitude oscillations. Therefore, the initial simulations
support the hypothesis made above that in large parameter intervals the oscillations do
not occur homogeneously but are accompanied by spatial pattern formation. It is an
experimental challenge of future work to measure these patterns. Currently, there seems
Chapter 6: Strictly Potentiostatic Oscillations during Bulk CO Electrooxidation 122
to be just one experimental method that is suitable for the in-situ observation of spatial
structures, which is spatially resolved FTIR spectroscopy, where direct information on
the spatial distribution of CO can be obtained. However, this method was only
demonstrated to work very recently [189] and corresponding experiments were thus not
yet available when this thesis was done.
6.4.4 Discussion
In the experiments, oscillations were found in concentrated supporting electrolytes, such
as 0.5 M H2SO4, under potential control, i.e. under conditions, under which the ohmic
potential drop through the electrolyte is minimal. This points to a purely chemical origin
of the Hopf instability, and in fact, in simulations the oscillations were also obtained
when treating the electrode potential as a parameter. An analysis of the reaction
mechanism (6.1)-(6.5) reveals that the anions coverage acts like an inhibitor, and the
oscillations arise owing to the interplay of the positive feedback loop stemming from the
Langmuir-Hinshelwood mechanism coupled to the mass transfer limited step and the
negative feedback loop generated by anion ad- and desorption. Thus, the system can be
characterized as an ‘S-NDR system with chemical inhibition’ or as a strictly
potentiostatic oscillator, in which the electrolyte resistance does not play an essential
role for the oscillatory instability. This class of electrochemical oscillator had been
speculated to exist; however, so far an unambiguous identification was missing. There
are two other reports of oscillations during CO electrooxidation on Pt. Azevedo et al.
[63] observed current oscillations in 0.1 M HClO4 on Pt. This occurred in a small
potential window positive to the ignition peak, which coincides with the voltage range in
which the above described oscillations occurred. Thus, the simplest interpretation of the
origin of the oscillations reported in [63] seems to be that there were traces of the
foreign anions in the HClO4 electrolyte. Koper et al. [45] observed potential oscillations
under galvanostatic conditions in HClO4 and in H2SO4 on Pt single crystal electrodes,
again without addition of inhibiting anions. The above described homogeneous model
does not possess oscillatory solutions under galvanostatic conditions, so that the origin
of these oscillations appears different from the present ones, and it remains unclear
whether there is any relation between the oscillations observed here and in [45].
However, it is striking that in our work as well as in their work the oscillations are
Chapter 6: Strictly Potentiostatic Oscillations during Bulk CO Electrooxidation 123
irregular in HClO4 while regular oscillations have been reported for Pt(111) electrodes
in H2SO4 solutions [45].
6.5 Summary
We demonstrated that CO electrooxidation on platinum in the presence of strongly
adsorbing anions exhibits oscillations in wide parameter ranges. Evidence was provided
that the autocatalytic loop stems from the LH mechanism of CO electrooxidation and the
negative or inhibiting feedback is due to the specific adsorption of anions. Thus, this
electrochemical oscillator is strictly potentiostatic in nature. This result is important not
only because it presents the first experimental example of this class of electrochemical
oscillators but it also indicates that an understanding of the CO electrooxidation is
impossible without considering the influence of anions. The oscillations were found
with tetrafluoroborate, chloride, and bromide anions. Furthermore, no oscillations could
be induced in the presence of iodide ions. This order indicates that the rate of adsorption,
which is proportional to the product of the rate constant of the anion adsorption kads, and
the concentration, is decisive for the oscillatory instability to occur, not the chemical
nature of the anion. Thus, the interaction of anions with adsorbed CO and OH is only
due to the competition for free surface sites, while repulsive or attractive interactions
between the adsorbed species apparently do not play a role for the oscillatory instability.
With chloride and bromide ions oscillations establish with the concentration as low as
10-7 M, and it can be varied by at least two orders of magnitude. The low concentrations,
which induce oscillations, suggest that the oscillations can be exploited to determine
traces of chloride or bromide in H2SO4 or HClO4 base electrolyte. Since the oscillation
frequency is a function of the anion concentration, a rough quantitative estimation of the
anion concentration is possible.
While the oscillatory instability occurs independent of the chemical nature of the anions,
a surprising difference in the dynamic responses was found for different supporting
electrolytes. Thus, in HClO4 containing base electrolyte only irregular oscillations
established, in aqueous H2SO4, in contrast, also nicely periodic oscillations could be
adjusted. This raises the fundamental question about the interaction of these anions with
platinum. As a working electrode, polycrystalline as well as low indexed Pt electrodes
were employed. Though, with all four different WEs oscillations could be detected,
parameter ranges, typical oscillation shapes etc. were different. This points to the fact
Chapter 6: Strictly Potentiostatic Oscillations during Bulk CO Electrooxidation 124
that details of the dynamics can only be understood when taking into account structural
effects. These findings expand not only the experimentally verified categories of
electrochemical oscillators but makes it also likely that spatio-temporal patterns of the
reaction-diffusion type, as opposed to reaction-migration patterns that form in
‘traditional electrochemical oscillating systems’, may establish on the electrode surfaces.
Concerning the fundamental aspects of CO catalysis, the observed dynamic instabilities
underline that it is necessary to incorporate the possibility for cooperative phenomena
when analysing the experimental data, and especially when trying to bridge the gap
between microscopic measurements and mean field behaviour.
Chapter 7: Conclusions 125
Chapter 7: Conclusions
In this work, new results on bulk CO electrooxidation on polycrystalline and single
crystal platinum are presented. The emphasis of the studies is on investigations of
cooperative effects, i.e. effects that cannot be explained by the simple superposition of
the individual elementary steps but require their nonlinear interaction. Besides, also
questions related to surface physical aspects are addressed.
A simple reaction network of CO electrooxidation, which had been discussed in the
literature before this thesis was taken up, contains a positive, i.e. self-enhancing,
feedback loop, and thus an intrinsic source of dynamic instabilities. For example, it can
lead to bistability between a high and a low current branch in a certain range of applied
voltage, the current-voltage characteristic being thus S-shaped. Hence, it had been
postulated that bulk CO electrooxidation belongs to the class of so-called S-shaped
negative differential resistance (S-NDR) systems that are especially prone to instabilities.
Therefore, we first tested in an independent way whether bulk CO electrooxidation is
indeed an S-NDR system. This was done by applying a derivative feedback control to the
system. The control was designed such that its only impact was to alter the effective
capacitance of the electrode|electrolyte interface. S-NDR systems are known to undergo
an oscillatory instability if the double layer capacitance is sufficiently large, the low
double layer capacitance of a Pt - aqueous electrolyte interface, however, impedes the
occurrence of oscillations. When employing the control strategy, oscillations in the
reaction rate could indeed be adjusted. We thus obtained independent evidence that the
reaction mechanism of CO electrooxidation contains a positive feedback loop, and that
the system can be classified as an S-NDR system. Furthermore, we could semi-
Chapter 7: Conclusions 126
quantitatively reproduce the experimental results, most importantly the oscillatory
instability, in simulations.
Subsequently, we designed experiments that should shed light on the impact of co-
adsorption of anions on the dynamics of CO electrooxidation.
First, diluted sulfuric or perchloric acid electrolytes and low bulk CO concentrations
were used and Pt (111), Pt (100) and Pt (110) single crystal electrodes were employed.
On Pt(100) and (110), these conditions facilitated the oxidation of adsorbed CO at
unusually negative potentials, a result that is especially important in the context of
minimizing the CO poisoning of Pt electrodes, e.g., in low-temperature fuel cells. The
results were complicated by a slow shift of the electrooxidation peak with time towards
higher potentials. By systematically varying the negative turning point in cyclic
voltammetry, the bulk CO concentration and the concentration of the supporting
electrolyte, the conditions under which the low oxidation potentials appeared were
identified, and various possible origins for the positive shift of the reaction peak could be
excluded. As most probable reason for this ‘peak transition’ the slow formation of a
water adlayer-structure was conjectured; however, without further experiments this
interpretation remains speculative.
Second, the investigations of interactions between anions from the most important
supporting electrolytes, namely sulfate and perchlorate, and CO electrooxidation were
investigated in the bistable region of this reaction. Previous studies always focused on
the onset of oxidation from a CO covered electrode surface. This potential is, however,
considerably more positive than the potential at which the system returns from the
reactive state to the poisoned state. Thus the question for the lowest potential at which
CO oxidation might still commence and how this potential is determined by the
interaction of reaction steps, especially adsorption rates of anions, CO and OH, and mass
transport cannot be answered by studying the onset potential of the reaction. Rather,
studies of the transition from the reactive to the poisoned state are necessary. Since from
a bifurcation theoretical point of view the transition between the two states is
accompanied with a saddle node bifurcation, we denote this transition as SN2 point. We
found that the SN2 point shifts considerably negative with decreasing CO bulk
concentration. Furthermore, it sensitively depends on the nature of the anion. The SN2
Chapter 7: Conclusions 127
point is about 60 mV more negative in perchloric acid than in sulfuric acid. Varying the
ratio between sulfuric and perchloric acid at constant total anion concentration revealed
that already a small amount of sulfate anions lead to a positive shift of the SN2 point by
about 60 mV. This was found for both, polycrystalline Pt and Pt(111) electrodes.
Comparison of the experimental results with mean field simulations showed that the
observed trends of the SN2 point are a consequence of the Langmuir Hinshelwood
mechanism and the competitive adsorption of anions with CO and OH. The results could
be best fitted assuming a repulsive interaction between the anions.
Finally, anions that are known to strongly adsorb on Pt electrodes were added to
perchloric acid or sulfuric acid base electrolyte. These strongly adsorbing anions induced
an oscillatory instability. Evidence was given that the oscillations emerge due to the
interaction between the above mentioned positive feedback loop arising from the
Langmuir-Hinshelwood mechanism and a negative feedback loop caused by anion
adsorption. Therefore, the oscillations depend only on chemical variables, while the
electrode potential, which is an essential variable in all electrochemical oscillators that
had been known before, stays constant during the oscillations and thus acts as a
parameter. For the latter reason, the oscillations are called strictly potentiostatic
oscillations.
The effect of various experimental parameters on this new type of oscillations was
investigated, namely the concentration and the nature of the inhibiting anion, the
concentration and the nature of the base electrolyte, the rotation rate of the electrode, the
magnitude of an external series resistance and the surface of the Pt electrode. With
polycrystalline Pt electrodes tetrafluoroborate, chloride, bromide and iodide were
employed as strongly adsorbing anions. With the first three types of anions oscillations
could be established, while no oscillations were found using iodide ions. Furthermore,
the highest anion concentration that still induced oscillatory behavior depended on the
adsorption strength of the anion, and was higher for chloride than for bromide. Yet, for
both, chloride and bromide, oscillations were still detected with anion concentrations as
low as 10-7 M. This might open a new path for detection of trace amounts of chloride and
bromide, at least sulfuric or perchloric acid solution. The (mean) oscillation period
depended on the anion concentration, pointing to a possible quantitative assessment of
the anion concentration.
Chapter 7: Conclusions 128
Distinct differences of the oscillatory behavior were also found when using different base
electrolytes: While with sulfuric acid as base electrolyte regular oscillations were found
in wide parameter ranges irrespective of the nature of the inhibiting anion, only irregular
oscillations could be detected in perchloric acid electrolytes. This demonstrates that at
least partially the anions of the base electrolyte play an active role during the oscillations,
even though they are not essential for inducing the oscillations. Furthermore, the results
strongly suggest that the irregular oscillations and complex wave forms are accompanied
by spatial pattern formation.
Using single crystal electrodes we could demonstrate that the oscillatory dynamics
sensitively depends on the crystal facet, all three low indexed surfaces exhibiting
qualitatively different fingerprints of the oscillatory instability.
Nevertheless, simulations showed that despite the intricate parameter dependences
discussed above, an oscillatory instability is already obtained when augmenting the mean
field model capturing the Langmuir-Hinshelwood mechanism of CO oxidation by a
single equation describing ad- and desorption of anions, the interaction of the anions with
CO or OH being restricted to the competition of the three adsorbing species for free
surface sites. A semi-quantitative comparison of the oscillatory region reveals, however,
that in experiments the oscillations exist in far larger parameter regions (for some
parameters several orders of magnitude) than predicted by the simple mean field model.
First simulations with a spatially extended model point again to the formation of patterns,
which were found in parameter regions in which the lumped model predicted a stable
stationary state.
The discovery of oscillations during CO electrooxidation on Pt opens a wide and new
field. The investigations carried out in the framework of this thesis helped to better
understand several aspects of CO electrooxidation, yet they have uncover even more
open questions, ensuring thus that CO electrooxidation on Pt remains an interesting and
important system to study for many more years to come.
References 129
References
[1] N. M. Markovic. in Handbook of Fuel cells edited by W. Vielstich, A. Lamm and
H. A. Gasteiger. Chichester, Wiley (2003)
[2] T. Iwasita. in Handbook of Fuel cells edited by W. Vielstich, A. Lamm and H. A.
Gasteiger. Chichester, Wiley (2003)
[3] N. M. Markovic and P. N. Ross. Surface science studies of model fuel cell
electrocatalysts. Surface Science Reports 45, 4-6 (2002) 117-229.
[4] B. N. Grgur, N. M. Markovic, C. A. Lucas and P. N. Ross. Electrochemical
oxidation of carbon monoxide: from platinum single crystals to low temperature
fuel cells catalysts. Part I: Carbon monoxide oxidation onto low index platinum
single crystals. Journal of the Serbian Chemical Society 66, 11-12 (2001) 785-
797.
[5] B. Beden, N. Collas, C. Lamy, J. M. Leger and V. Solis. Electrosorption of
carbon-monoxide at the platinum electrolyte interface. Surface Science 162, 1-3
(1985) 789-795.
[6] B. Beden, C. Lamy, N. R. Detacconi and A. J. Arvia. The electrooxidation of CO
- a test reaction in electrocatalysis. Electrochimica Acta 35, 4 (1990) 691-704.
[7] B. Beden, S. Bilmes, C. Lamy and J. M. Leger. Electrosorption of carbon-
monoxide on platinum single-crystals in perchloric-acid medium. Journal of
Electroanalytical Chemistry 149, 1-2 (1983) 295-302.
References 130
[8] J. M. Leger, B. Beden, C. Lamy and S. Bilmes. Carbon-monoxide electrosorption
on low index platinum single-crystal electrodes. Journal of Electroanalytical
Chemistry 170, 1-2 (1984) 305-317.
[9] S. A. Bilmes, N. R. Detacconi and A. J. Arvia. The electrooxidation of
chemisorbed CO on polycrystalline platinum - a mechanistic interpretation of the
anodic current peak multiplicity. Journal of Electroanalytical Chemistry 164, 1
(1984) 129-143.
[10] J. M. Leger, B. Beden and C. Lamy. The adsorption of carbon-monoxide on
platinum single-crystals in alkaline-medium. Berichte Der Bunsen-Gesellschaft
91, 4 (1987) 336-341.
[11] J. M. Feliu, J. M. Orts, A. Fernandezvega, A. Aldaz and J. Clavilier.
Electrochemical studies in sulfuric-acid-solutions of absorbed CO on Pt (111)
electrodes. Journal of Electroanalytical Chemistry 296, 1 (1990) 191-201.
[12] J. A. Caram and C. Gutierrez. Voltammetric study of the electroadsorption and
electrooxidation of CO on Pt in 0.5 M HClO4 - influence of several experimental-
variables. Journal of Electroanalytical Chemistry 346, 1-2 (1993) 451-469.
[13] H. A. Gasteiger, N. M. Markovic and P. N. Ross. H2 and CO electrooxidation on
well-characterized Pt, Ru, and Pt-Ru. 2. Rotating disk electrode studies of CO/H2
mixtures at 62°C. Journal of Physical Chemistry 99, 45 (1995) 16757-16767.
[14] N. M. Markovic, B. N. Grgur, C. A. Lucas and P. N. Ross. Surface
electrochemistry of CO on Pt(110)-(1x2) and Pt(110)-(1x1) surfaces. Surface
Science 384, 1-3 (1997) L805-L814.
[15] M. Bergelin, J. M. Feliu and M. Wasberg. Study of carbon monoxide adsorption
and oxidation on Pt(111) by using an electrochemical impinging jet cell.
Electrochimica Acta 44, 6-7 (1998) 1069-1075.
[16] A. V. Petukhov, W. Akemann, K. A. Friedrich and U. Stimming. Kinetics of
electrooxidation of a CO monolayer at the platinum/electrolyte interface. Surface
Science 404, 1-3 (1998) 182-186.
References 131
[17] N. M. Markovic, C. A. Lucas, B. N. Grgur and P. N. Ross. Surface
electrochemistry of CO and H2/CO mixtures at Pt(100) interface: Electrode
kinetics and interfacial structures. Journal of Physical Chemistry B 103, 44
(1999) 9616-9623.
[18] C. A. Lucas, N. M. Markovic and P. N. Ross. The adsorption and oxidation of
carbon monoxide at the Pt(111)/electrolyte interface: atomic structure and surface
relaxation. Surface Science 425, 1 (1999) L381-L386.
[19] N. P. Lebedeva, M. T. M. Koper, E. Herrero, J. M. Feliu and R. A. van Santen.
CO oxidation on stepped Pt n(111) x (111) electrodes. Journal of
Electroanalytical Chemistry 487, 1 (2000) 37-44.
[20] E. Herrero, B. Alvarez, J. M. Feliu, S. Blais, Z. Radovic-Hrapovic and G.
Jerkiewicz. Temperature dependence of the COads oxidation process on Pt(111)
Pt(100), and Pt(110) electrodes. Journal of Electroanalytical Chemistry 567, 1
(2004) 139-149.
[21] N. M. Markovic, T. J. Schmidt, B. N. Grgur, H. A. Gasteiger, R. J. Behm and P.
N. Ross. Effect of temperature on surface processes at the Pt(111)-liquid
interface: Hydrogen adsorption, oxide formation, and CO oxidation. Journal of
Physical Chemistry B 103, 40 (1999) 8568-8577.
[22] I. Villegas and M. J. Weaver. Carbon-monoxide adlayer structures on
platinum(111) electrodes - a synergy between in-situ Scanning-Tunneling-
Microscopy and Infrared-Spectroscopy. Journal of Chemical Physics 101, 2
(1994) 1648-1660.
[23] I. Villegas, X. P. Gao and M. J. Weaver. Local-structure and phase-transitions
within ordered electrochemical, adlayers - Some new insights from in-situ
Scanning-Tunneling-Microscopy. Electrochimica Acta 40, 10 (1995) 1267-1275.
[24] M. Wakisaka, T. Ohkanda, T. Yoneyama, H. Uchida and M. Watanabe.
Structures of a CO adlayer on a Pt(100) electrode in HClO4 solution studied by in
situ STM. Chemical Communications 21 (2005) 2710-2712.
References 132
[25] L. W. H. Leung, A. Wieckowski and M. J. Weaver. Insitu Infrared-Spectroscopy
of well-defined single-crystal electrodes - Adsorption and electrooxidation of CO
on Pt(111). Journal of Physical Chemistry 92, 24 (1988) 6985-6990.
[26] E. A. Batista, T. Iwasita and W. Vielstich. Mechanism of stationary bulk CO
oxidation on Pt(111) electrodes. Journal of Physical Chemistry B 108, 38 (2004)
14216-14222.
[27] N. P. Lebedeva, A. Rodes, J. M. Feliu, M. T. M. Koper and R. A. van Santen.
Role of crystalline defects in electrocatalysis: CO adsorption and oxidation on
stepped platinum electrodes as studied by in situ infrared spectroscopy. Journal
of Physical Chemistry B 106, 38 (2002) 9863-9872.
[28] E. Zippel, R. Kellner, M. Krebs and M. W. Breiter. ATR-IR studies of CO
adsorption from solutions. Journal of Electroanalytical Chemistry 330, 1-2
(1992) 521-527.
[29] S. G. Sun and A. C. Chen. Insitu FTIRS features during oxygen-adsorption and
carbon-monoxide oxidation at a platinum-electrode in dilute alkaline-solutions.
Journal of Electroanalytical Chemistry 323, 1-2 (1992) 319-328.
[30] F. Kitamura, M. Takeda, M. Takahashi and M. Ito. CO adsorption on Pt(111) and
Pt(100) single-crystal surfaces in aqueous-solutions studied by Infrared
Reflection Absorption-Spectroscopy. Chemical Physics Letters 142, 5 (1987)
318-322.
[31] F. Kitamura, M. Takahashi and M. Ito. Carbon-Monoxide adsorption on
platinum(111) single-crystal electrode surface studied by Infrared Reflection
Absorption-Spectroscopy. Surface Science 223, 3 (1989) 493-508.
[32] E. Pastor, J. L. Rodriguez and T. Iwasita. A spectroscopic proof of a surface
equilibrium between on top and bridge bonded CO at Pt(110) in acid solution.
Electrochemistry Communications 4, 12 (2002) 959-962.
[33] C. S. Kim, W. J. Tornquist and C. Korzeniewski. Infrared-Spectroscopy as a
probe of CO adsorption at Pt(335) under aqueous electrochemical conditions.
Journal of Physical Chemistry 97, 24 (1993) 6484-6491.
References 133
[34] D. Kardash, J. M. Huang and C. Korzeniewski. Surface electrochemistry of CO
and methanol at 25-75° C probed in situ by Infrared Spectroscopy. Langmuir 16,
4 (2000) 2019-2023.
[35] S. A. Wasileski, M. J. Weaver and M. T. M. Koper. Potential-dependent
chemisorption of carbon monoxide on platinum electrodes: new insight from
quantum-chemical calculations combined with vibrational spectroscopy. Journal
of Electroanalytical Chemistry 500, 1-2 (2001) 344-355.
[36] V. Stamenkovic, K. C. Chou, G. A. Somorjai, P. N. Ross and N. M. Markovic.
Vibrational properties of CO at the Pt(111)-solution interface: the anomalous
stark-tuning slope. Journal of Physical Chemistry B 109, 2 (2005) 678-680.
[37] C. S. Kim, W. J. Tornquist and C. Korzeniewski. Site-dependent vibrational
coupling of CO adsorbates on well-defined step and terrace sites of
monocrystalline platinum - Mixed-isotope studies at Pt(335) and Pt(111) in the
aqueous electrochemical environment. Journal of Chemical Physics 101, 10
(1994) 9113-9121.
[38] N. M. Markovic, B. N. Grgur, C. A. Lucas and P. N. Ross. Electrooxidation of
CO and H2/CO mixtures on Pt(111) in acid solutions. Journal of Physical
Chemistry B 103, 3 (1999) 487-495.
[39] E. Herrero, J. Li and H. D. Abruna. Electrochemical, in-situ surface EXAFS and
CTR studies of CO monolayers irreversibly adsorbed onto Pt(111).
Electrochimica Acta 44, 14 (1999) 2385-2396.
[40] K. C. Chou, N. M. Markovic, J. Kim, P. N. Ross and G. A. Somorjai. An in situ
time-dependent study of CO oxidation on Pt(111) in aqueous solution by
voltammetry and sum frequency generation. Journal of Physical Chemistry B
107, 8 (2003) 1840-1844.
[41] G. Q. Lu, A. Lagutchev, D. D. Dlott and A. Wieckowski. Quantitative vibrational
sum-frequency generation spectroscopy of thin layer electrochemistry: CO on a
Pt electrode. Surface Science 585, 1-2 (2005) 3-16.
References 134
[42] C. K. Rhee, J. M. Feliu, E. Herrero, P. Mrozek and A. Wieckowski. Auger-
Electron Spectroscopy, Low-Energy-Electron Diffraction, and Electrochemistry
of Carbon-Monoxide on a Pt(100) Electrode. Journal of Physical Chemistry 97,
38 (1993) 9730-9735.
[43] G. Jerkiewicz, G. Vatankhah, J. Lessard, M. P. Soriaga and Y. S. Park. Surface-
oxide growth at platinum electrodes in aqueous H2SO4 Reexamination of its
mechanism through combined cyclic-voltammetry, electrochemical quartz-crystal
nanobalance, and Auger electron spectroscopy measurements. Electrochimica
Acta 49, 9-10 (2004) 1451-1459.
[44] N. P. Lebedeva, M. T. M. Koper, J. M. Feliu and R. A. van Santen. Mechanism
and kinetics of the electrochemical CO adlayer oxidation on Pt(111). Journal of
Electroanalytical Chemistry 524, (2002) 242-251.
[45] M. T. M. Koper, T. J. Schmidt, N. M. Markovic and P. N. Ross. Potential
oscillations and S-shaped polarization curve in the continuous electro-oxidation
of CO on platinum single-crystal electrodes. Journal of Physical Chemistry B
105, 35 (2001) 8381-8386.
[46] K. J. J. Mayrhofer, M. Arenz, B. B. Blizanac, V. Stamenkovic, P. N. Ross and N.
M. Markovic. CO surface electrochemistry on Pt-nanoparticles: A selective
review. Electrochimica Acta 50, 25-26 (2005) 5144-5154.
[47] A. Wieckowski, M. Rubel and C. Gutierrez. Reactive sites in bulk carbon-
monoxide electrooxidation on oxide-free platinum(111). Journal of
Electroanalytical Chemistry 382, 1-2 (1995) 97-101.
[48] M. T. M. Koper, N. P. Lebedeva and C. G. M. Hermse. Dynamics of CO at the
solid/liquid interface studied by modeling and simulation of CO electro-oxidation
on Pt and PtRu electrodes. Faraday Discussions 121, (2002) 301-311.
[49] I. R. Epstein and J. A. Pojman. An introduction to nonlinear chemical dynamics.
New York, Oxford University Press (1998).
[50] K. Krischer. in Modern Aspect of Electrchemistry, Number 32 edited by B. E.
Conway. New York, Kluwer Academic/Plenum (1999)
References 135
[51] K. Krischer. in Advances in Electrochemical Science in Engineering, Volume 8,
edited by R. C. Alkire. Weinheim, Wiley VCH (2002)
[52] A. S. Mikhailov. Foundations of synergetics. Berlin, Springer (1996).
[53] R. Kapral and K. Showalter. Chemical waves and patterns. Dordrecht, Kulwar
Academic Publishers (1995).
[54] M. T. M. Koper. in Advances in Chemical Physics edited by I. Prigogine and S.
A. Rice. New York, Wiley (1996)
[55] G. Nicolis. Introduction to nonlinear science. Cambridge, Cambridge Univ. Press
(1995).
[56] G. Nicolis and I. Prigogine. Self-organization in nonequilibrium systems. New
York, Wiley (1977).
[57] J. D. Murray. Mathematical Biology. Berlin, (1990).
[58] E. Scholl. Nonlinear spatio-temporal dynamics and chaos in semiconductors,.
Cambridge, Cambridge Unvisersity Press (2001).
[59] M. C. Cross and P. C. Hohenberg. Pattern formation outside of equilibrium.
Reviews of Modern Physics 65, 3 (1993) 851 - 1112.
[60] H. Haken. Cooperative phenomena in systems far from thermal equilibrium and
in nonphysical systems. Reviews of Modern Physics 47, 1 (1975) 67 - 121.
[61] A. Bonnefont, H. Varela and K. Krischer. Stationary small and large amplitude
patterns during bulk CO electrooxidation on platinum. Chemphyschem 4, 11
(2003) 1260-1263.
[62] A. Bonnefont, H. Varela and K. Krischer. Stationary spatial patterns during bulk
CO electrooxidation on platinum. Journal of Physical Chemistry B 109, 8 (2005)
3408-3415.
[63] D. C. Azevedo, A. L. N. Pinheiro and E. R. Gonzales. Electrochem. and Solid-
State Lett. 5, (2002) A51.
References 136
[64] N. M. Markovic, C. A. Lucas, A. Rodes, V. Stamenkovi and P. N. Ross. Surface
electrochemistry of CO on Pt(111): anion effects. Surface Science 499, 2-3
(2002) L149-L158.
[65] A. J. Bard and L. R. Faulkner. Electrochemical methods fundamentals and
applications. New York, Wiley (2001).
[66] W. Vielstich, C. H. Hamann and A. Hamnett. Electrochemistry. Weinheim,
Wiley VCH (1998).
[67] J. Bockris, O.M. and A. N. Reddy. Modern electrochemistry. New York, Plenum
(1970).
[68] R. Parsons. Electrical double layer: Recent experiments and theoretical
developement. Chemical Review 90, (1990) 813-826.
[69] J. O. M. Bockris, M. Devanathan and K. Müller. On structure of charged
interfaces. Proc. R. Soc. Lon. Ser. A 274, (1963) 55.
[70] R. Guidelli and W. Schmickler. Recent developments in models for the inter-face
between a metal and an aqueous solution. Electrochimica Acta 45, 15-16 (2000)
2317-2338.
[71] D. C. Grahame. The electrical double layer and the theory of electrocapillarity.
Chemical Reviews 41, 3 (1947) 441-501.
[72] M. A. V. Devanath and B. V. K. Tilak. Structure of electrical double layer at
metal-solution interface. Chemical Reviews 65, 6 (1965) 635-684.
[73] F. P. Buff and F. H. Stilling. Statistical mechanical theory of double-layer
structure and properties. Journal of Chemical Physics 39, 8 (1963) 1911-1923.
[74] H. L. F. v. Helmholtz. Ann. Physik 7, (1853) 337.
[75] H. L. F. v. Helmholtz. Ann. Physik 89, 211 (1879)
[76] G. Gouy. J. Phys. Radium 9, (1910) 457.
[77] D. L. Chapman. Phil. Mag. 25, (1913) 475.
References 137
[78] O. Stern. The theory of the electrolytic double shift. Zeitschrift Fur
Elektrochemie Und Angewandte Physikalische Chemie 30, (1924) 508-516.
[79] P. Hänggi, P. Talkner and M. Borkovec. Reaction-rate theory: fifty years after
Kramers. Reviews of Modern Physics 62, 2 (1990) 251- 341.
[80] B. E. Conway and B. V. Tilak. Behavior and characterization of kineticaly
involved chemisorbed intermediates in electrocatalysis of gas evolution reaction.
Advances in Catalysis 38, (1993) 1-146.
[81] M. T. M. Koper and J. H. Sluyters. Electrochemical oscillators - Their description
through a mathematical-model. Journal of Electroanalytical Chemistry 303, 1-2
(1991) 73-94.
[82] M. T. M. Koper and J. H. Sluyters. A mathematical-model for current oscillations
at the active passive transition in metal electrodissolution. Journal of
Electroanalytical Chemistry 347, 1-2 (1993) 31-48.
[83] V. I. Arnold. Bifurcation theory and catastrophe theory. Berlin, Springer (1999).
[84] Y. A. Kuznetsov. Elements of applied bifurcation theory. New York, Springer
(2004).
[85] R. Seydel. Practical bifurcation and stability analysis. New York, Springer
(1994).
[86] J. H. Hubbard and B. H. West. Differential equations: A dynamical system
approach higher dimensional systems. New York, Springer (1995).
[87] S. H. Strogatz. Nonlinear dynamics and chaos with applications to physics,
biology, chemistry, and engineering. Reading, Addison Wesley (1994).
[88] J. M. Thompson and H. B. Stewart. Nonlinear dynamics and chaos. New York,
Wiley (2002).
[89] H. Varela. Phd Thesis, Spatiotemporal pattern formation during electrochemical
oxidation of hydrogen on platinum. (2003) Free University Berlin, Berlin.
References 138
[90] K. Krischer, N. Mazouz and G. Flatgen. Pattern formation in globally coupled
electrochemical systems with an S-Shaped current-potential curve. Journal of
Physical Chemistry B 104, 31 (2000) 7545-7553.
[91] Y. J. Li, J. Oslonovitch, N. Mazouz, F. Plenge, K. Krischer and G. Ertl. Turing-
type patterns on electrode surfaces. Science 291, 5512 (2001) 2395-2398.
[92] P. Strasser, M. Eiswirth and M. T. M. Koper. Mechanistic classification of
electrochemical oscillators - operational experimental strategy. Journal of
Electroanalytical Chemistry 478, 1-2 (1999) 50-66.
[93] K. Krischer. New directions and challenges in electrochemistry - Spontaneous
formation of spatiotemporal patterns at the electrode vertical bar electrolyte
interface. Journal of Electroanalytical Chemistry 501, 1-2 (2001) 1-21.
[94] K. Krischer, N. Mazouz and P. Grauel. Fronts, waves, and stationary patterns in
electrochemical systems. Angewandte Chemie International Edition 40, 5 (2001)
850-869.
[95] A. Groß. Theoretical surface science. Berlin, Springer (2003).
[96] P. J. Feibelman and D. R. Hamann. Electronic structure of a "poisoned"
transition-metal surface. Physical Review Letters 52, 1 (1984) 61- 64.
[97] J. Harris and S. Andersson. H2 dissociation at metal surfaces. Physical Review
Letters 55, 15 (1985) 1583 - 1586.
[98] G. Blyholder. Molecular orbital view of chemisorbed carbon monoxide. Journal
of Physical Chemistry 68, 10 (1964) 2772-2778.
[99] T. Engel and G. Ertl. Elementary steps in the catalytic oxidation of carbon
monoxide on platinum metals. Advances in Catalysis 28, (1983) 1-78.
[100] P. J. Feibelman, B. Hammer, J. K. Norskov, F. Wagner, M. Scheffler, R. Stumpf,
R. Watwe and J. Dumesic. The CO/Pt(111) puzzle. Journal of Physical
Chemistry B 105, 18 (2001) 4018-4025.
References 139
[101] B. E. Conway. Electrochemical oxide film formation at noble-metals as a surface-
chemical process. Progress in Surface Science 49, 4 (1995) 331-452.
[102] B. V. Tilak, B. E. Conway and H. Angersteinkozlowska. Real condition of
oxidized Pt electrodes 3. Kinetic-theory of formation and reduction of surface
oxides. Journal of Electroanalytical Chemistry 48, 1 (1973) 1-23.
[103] B. E. Conway, B. Barnett, H. Angersteinkozlowska and B. V. Tilak. A surface-
electrochemical basis for the direct logarithmic growth law for initial-stages of
extension of anodic oxide-films formed at noble-metals. Journal of Chemical
Physics 93, 11 (1990) 8361-8373.
[104] H. Angersteinkozlowska, B. E. Conway and W. B. A. Sharp. Real condition of
electrochemically oxidized platinum surfaces 1. Resolution of component
processes. Journal of Electroanalytical Chemistry 43, 1 (1973) 9-36.
[105] V. I. Birss, M. Chang and J. Segal. Platinum oxide film formation reduction - an
in-situ mass measurement study. Journal of Electroanalytical Chemistry 355, 1-2
(1993) 181-191.
[106] D. A. Harrington. Simulation of anodic Pt oxide growth. Journal
Electroanalytical Chemistry 420, (1997) 101 - 109.
[107] G. Vatankhah, J. Lessard, G. Jerkiewicz, A. Zolfaghari and B. E. Conway.
Dependence of the reliability of electrochemical quartz-crystal nanobalance mass
responses on the calibration constant, C-f: analysis of three procedures for its
determination. Electrochimica Acta 48, 11 (2003) 1613-1622.
[108] M. Alsabet, M. Grden and G. Jerkiewicz. Comprehensive study of the growth of
thin oxide layers on Pt electrodes under well-defined temperature, potential and
time conditions. Journal of Electroanalytical Chemistry 589, (2006) 120-127.
[109] I. Siegmeir. Diploma Thesis (2005) Technical University Munich, Munich.
[110] M. W. Breiter. Double layer capacity and methanol coverage on platinum in
perchloric acid solution. Electrochimica Acta 7, 5 (1962) 533-542.
References 140
[111] V. S. Bagotzky, Y. B. Vassiyev, J. Weber and J. Pirtskha. Adsorption of anions
on smooth platinum electrodes. Journal of Electroanalytical Chemistry 27, 1
(1970) 31.
[112] D. M. Novak and B. E. Conway. Competitive adsorption and state of charge of
halide-ions in monolayer oxide film growth-processes at Pt anodes. Journal of the
Chemical Society-Faraday Transactions I 77, (1981) 2341-2359.
[113] H. Angersteinkozlowska, B. E. Conway, B. Barnett and J. Mozota. Role of ion
adsorption in surface oxide formation and reduction at noble-metals - General
features of the surface process. Journal of Electroanalytical Chemistry 100, 1-2
(1979) 417-446.
[114] R. I. Masel. Principles of adsorption and reaction on solid surfaces. New York,
Wiley (1996).
[115] K. W. Kolasinski. Surface science foundations of catalysis and nanoscience.
Chichester, Wiley (2002).
[116] V. P. Zhdanov and B. Kasemo. Simulation of CO electrooxidation on nm-sized
supported Pt particles: stripping voltammetry. Chemical Physics Letters 376, 1-2
(2003) 220-225.
[117] F. C. Tomkins. Chemisorption of gases on metals. London, Academic Press
(1978).
[118] S. D. Kevin, D. C. Skelton and D. H. Wei. Molecular interaction and simple
surface processes. Crit. Rev. Surf. Chem. 4, (1994) 77-140.
[119] E. E. Mola, D. A. King, I. M. IIrurzun, M. Rafti and J. L. Vicente. Embedded
mean field approach to analyzing pattern formation in surface chemical reaction.
Surface Review and Letters 11, 1 (2004) 57-70.
[120] F. Zaera. Kinetics of chemical reactions on solid surfaces: Deviations from
conventional theory. Accounts of Chemical Research 35, 2 (2002) 129-136.
References 141
[121] M. D. Xu, J. Y. Liu and F. Zaera. Kinetic evidence for the dependence of surface
reaction rates on the distribution of reactants on the surface. Journal of Chemical
Physics 104, 21 (1996) 8825-8828.
[122] M. Silverberg and A. Ben-Shaul. Adsorbate islanding in surface reactions: A
combined Monte Carlo-lattice gas approach. The Journal of Chemical Physics 87,
5 (1987) 3178-3194.
[123] M. Eiswirth, A. Freund and J. Ross. in Advances in Chemical Physics Vol-80
edited by I. Prigogine and S. A. Rice. New York, Wiley (1991)
[124] L. A. Kibler, A. Cuesta, M. Kleinert and D. M. Kolb. In-situ STM
characterisation of the surface morphology of platinum single crystal electrodes
as a function of their preparation. Journal of Electroanalytical Chemistry 484, 1
(2000) 73-82.
[125] I. M. Tidswell, N. M. Markovic and P. N. Ross. Potential-dependent surface
relaxation of the Pt(001) electrolyte interface. Physical Review Letters 71, 10
(1993) 1601-1604.
[126] C. A. Lucas, N. M. Markovic and P. N. Ross. Surface structure and relaxation at
the Pt(110)/electrolyte interface. Physical Review Letters 77, 24 (1996) 4922-
4925.
[127] N. M. Markovic, H. A. Gasteiger and P. N. Ross. Oxygen reduction on platinum
low-Index single-crystal surfaces in sulfuric acid solution - Rotating ring - Pt(hkl)
- disk Studies. Journal of Physical Chemistry 99, 11 (1995) 3411-3415.
[128] T. J. Schmidt, P. N. Ross and N. M. Markovic. Temperature-dependent surface
electrochemistry on Pt single crystals in alkaline electrolyte: Part 1: CO
oxidation. Journal of Physical Chemistry B 105, 48 (2001) 12082-12086.
[129] A. C. Gutierrez, A. L. N. Pinheiro, E. Leiva, E. R. Gonzalez and T. Iwasita.
Abnormally fast mobility of CO at electrochemical interfaces. Electrochemistry
Communications 5, 7 (2003) 539-543.

References 142
[130] A. V. Tripkovic, K. D. Popovic and J. D. Lovic. The influence of the oxygen-
containing species on the electrooxidation of the C1–C4 alcohols at some
platinum single crystal surfaces in alkaline solution. Electrochimica Acta 46, 20
(2001) 3163-3173.
[131] N. Hoshi, A. Sakurada, S. Nakamura, S. Teruya, O. Koga and Y. Hori. Infrared
Reflection Absorption Spectroscopy of sulfuric acid anion adsorbed on stepped
surfaces of platinum single-crystal electrodes. Journal of Physical Chemistry B
106, 8 (2002) 1985 - 1990.
[132] J. Clavilier. in Interfacial Electrochemistry: Theory: Experiment, and
Applications edited by A. Wieckowski. New York, Marcel Dekker Inc. (1999)
[133] N. P. Lebedeva, M. T. M. Koper, J. M. Feliu and R. A. van Santen. The effect of
the cooling atmosphere in the preparation of flame-annealed Pt(111) electrodes
on CO adlayer oxidation. Electrochemistry Communications 2, 7 (2000) 487-490.
[134] J. Clavilier, R. Faure, G. Guinet and R. Durand. Preparation of mono-crystalline
Pt microelectrodes and electrochemical study of the plane surfaces cut in the
direction of the (111) and (110) planes. Journal of Electroanalytical Chemistry
107, 1 (1980) 205-209.
[135] C. G. M. Hermse, A. P. van Bavel, M. T. M. Koper, J. J. Lukkien, R. A. van
Santen and A. P. J. Jansen. Modelling the butterfly: (root 3 x root 7) ordering on
fcc(111) surfaces. Surface Science 572, 2-3 (2004) 247-260.
[136] K. Aljaafgolze, D. M. Kolb and D. Scherson. On the voltammetry curves of
Pt(111) in aqueous-solutions. Journal of Electroanalytical Chemistry 200, 1-2
(1986) 353-362.
[137] E. Ott, C. Grebogi and J. A. Yorke. Controlling chaos. Physical Review Letters
64, 11 (1990) 1196 - 1199.
[138] B. Peng, V. Petrov and K. Showalter. Controlling chemical chaos. Journal of
Physical Chemistry 95, 13 (1991) 4957-4959.
References 143
[139] R. W. Rollins, P. Parmananda and P. Sherard. Controlling chaos in highly
dissipative systems: A simple recursive algorithm. Physical Review E 47, 2
(1993) R780-R783.
[140] W. L. Ditto, S. N. Rauseo and M. L. Spano. Experimental control of chaos.
Physical Review Letters 65, 26 (1990) 3211- 3214.
[141] E. R. Hunt. Stabilizing high-period orbits in a chaotic system: The diode
resonator. Physical Review Letters 67, 15 (1991) 1953 - 1955.
[142] C. Reyl, L. Flepp, R. Badii and E. Brun. Control of NMR-laser chaos in high-
dimensional embedding space. Physical Review E 47, 1 (1993) 267-272.
[143] R. Roy, T. W. Murphy, T. D. Maier, Z. Gills and E. R. Hunt. Dynamical control
of a chaotic laser: Experimental stabilization of a globally coupled system.
Physical Review Letters 68, 9 (1992) 1259-1262.
[144] P. Parmananda, P. Sherard, R. W. Rollins and H. D. Dewald. Control of chaos in
an electrochemical cell. Physical Review E 47, 5 (1993) R3003 - R3006.
[145] K. Pyragas. Continuous control of chaos by self-controlling feedback. Physics
Letters A 170, 6 (1992) 421-428.
[146] W. Just, T. Bernard, M. Ostheimer, E. Reibold and H. Benner. Mechanism of
time-delayed feedback control. Physical Review Letters 78, 2 (1997) 203 - 206.
[147] E. C. Zimmermann and J. Ross. Light induced bistability in S2O6F2 - 2 SO3F:
Theory and experiment. The Journal of Chemical Physics 80, 2 (1984) 720-729.
[148] A. Hjelmfelt and J. Ross. Experimental stabilization of unstable steady states in
oscillatory and excitable reaction systems. Journal of Physical Chemistry 98, 4
(1994) 1176-1179.
[149] Z. Gills, C. Iwata, R. Roy, I. B. Schwartz and I. Triandaf. Tracking unstable
steady states: Extending the stability regime of a multimode laser system.
Physical Review Letters 69, 22 (1992) 3169 - 3172.
References 144
[150] A. Rutherford and N. R. Amundson. An analysis of chemical reactor stability and
control-I : The possibility of local control, with perfect or imperfect control
mechanisms. Chemical Engineering Science 7, 3 (1958) 121-196.
[151] E. C. Zimmermann, M. Schell and J. Ross. Stabilization of unstable states and
oscillatory phenomena in an illuminated thermochemical system: Theory and
experiment. The Journal of Chemical Physics 81, 3 (1984) 1327-1336.
[152] B. Macke, J. Zemmouri and N. E. Fettouhi. Stabilization of unstable stationary
states in optical bistability. Physical Review A 47, 3 (1993) R1609 - R1611.
[153] H.-C. Chang and L.-H. Chen. Bifurcation characteristics of nonlinear systems
under conventional pid control. Chemical Engineering Science 39, 7-8 (1984)
1127-1142.
[154] P. Parmananda, M. A. Rhode, G. A. Johnson, R. W. Rollins, H. D. Dewald and
A. J. Markworth. Stabilization of unstable steady states in an electrochemical
system using derivative control. Physical Review E 49, 6 (1994) 5007 - 5011.
[155] J. P. Laplante. Stabilization of unstable states in the bistable iodate-arsenous acid
reaction in a continuous flow stirred tank reactor. Journal of Physical Chemistry
93, 10 (1989) 3882 - 3885.
[156] I. Z. Kiss, Z. Kazsu and V. Gaspar. Experimental strategy for characterization of
essential dynamical variables in oscillatory systems: Effect of double-layer
capacitance on the stability of electrochemical oscillators. Journal of Physical
Chemistry A 109, 42 (2005) 9521-9527.
[157] P. Strasser, M. Eiswirth and G. Ertl. Oscillatory instabilities during formic acid
oxidation on Pt(100), Pt(110) and Pt(111) under potentiostatic control. 2. Model
calculations. Journal of Chemical Physics 107, 3 (1997) 991-1003.
[158] S. C. Chang and M. J. Weaver. Coverage-dependent and potential-dependent
binding geometries of carbon-monoxide at ordered low-Index platinum aqueous
and rhodium aqueous interfaces - Comparisons with adsorption in corresponding
metal vacuum environments. Surface Science 238, 1-3 (1990) 142-162.
References 145
[159] F. C. Nart, T. Iwasita and M. Weber. Sulfate adsorption on well-defined Pt(100)
electrodes. Electrochimica Acta 39, 13 (1994) 2093-2096.
[160] T. Iwasita, F. C. Nart, A. Rodes, E. Pastor and M. Weber. Vibrational
spectroscopy at the electrochemical interface. Electrochimica Acta 40, 1 (1995)
53-59.
[161] A. Frumkin. Hydrogen overvoltage and the structure of the double layer.
Zeitschrift Fur Physikalische Chemie-Abteilung a-Chemische Thermodynamik
Kinetik Elektrochemie Eigenschaftslehre 164A, (1933) 121-133.
[162] A. Frumkin. Adsorptionserscheinungen Und Elektrochemische Kinetik.
Zeitschrift Fur Elektrochemie 59, 7-8 (1955) 807-822.
[163] R. Parsons. Effect of specific adsorption on rate of an electrode process. Journal
of Electroanalytical Chemistry 21, 1 (1969) 35-43.
[164] M. Breiter, M. Kleinerman and P. Delahay. Structure of the double layer and
electrode processes. Journal of the American Chemical Society 80, 19 (1958)
5111-5117.
[165] B. Timmer, Sluyters.M and J. H. Sluyters. Electrode kinetics and double layer
structure. Surface Science 18, 1 (1969) 44-59.
[166] K. Asada, P. Delahay and A. K. Sundaram. Local field effect and failure of
double layer correction in electrode kinetics. Journal of the American Chemical
Society 83, 16 (1961) 3396-3400.
[167] J. M. Parry and R. Parsons. Adsorption of aromatic sulphonates at a mercury
electrode .1. Sodium benzene M-disulphonate. Transactions of the Faraday
Society 59, 481 (1963) 241-256.
[168] M. E. Gamboaaldeco, E. Herrero, P. S. Zelenay and A. Wieckowski. Adsorption
of bisulfate anion on a Pt(100) electrode - a comparison with Pt(111) and
Pt(Poly). Journal of Electroanalytical Chemistry 348, 1-2 (1993) 451-457.
[169] Y. A. Kuznetsov. CONTENT - Integrated environment for analysis of dynamical
systems. (1998)
References 146
[170] O. M. Magnussen. Ordered anion adlayers on metal electrode surfaces. Chemical
Review 102, (2002) 679-725.
[171] A. M. Funtikov, U. Linke, U. Stimming and R. Vogel. An in-situ STM study of
anion adsorption on Pt(111) from sulfuric-acid-solutions. Surface Science 324, 1
(1995) L343-L348.
[172] A. M. Funtikov, U. Stimming and R. Vogel. Anion adsorption from sulfuric acid
solutions on Pt(111) single crystal electrodes. Journal of Electroanalytical
Chemistry 428, 1-2 (1997) 147-153.
[173] O. M. Magnussen, J. Hageböck, J. Hotlos and R. J. Behm. In situ scanning
tunnelling microscopy observations of a disorder - order phase transition in
hydrogensulfate adlayers on Au(111). Faraday Discussions 94, (1992) 329.
[174] G. J. Edens, X. Gao and M. J. Weaver. The adsorption of sulfate on Au(111) in
acidic aqueous-media - Adlayer structural inferences from Infrared-Spectroscopy
and Scanning-Tunneling-Microscopy. Journal Electroanalytical Chemistry 375,
(1994) 357.
[175] W. Savich, S. G. Sun, J. Lipkowski and A. Wieckowski. Determination of the
Sum of Gibbs Excesses of Sulfate and Bisulfate Adsorbed at the Pt(111)
Electrode Surface Using Chronocoulometry and Thermodynamics of the
Perfectly Polarized Electrode. Journal of Electroanalytical Chemistry 388, 1-2
(1995) 233-237.
[176] D. M. Kolb. An atomistic view of electrochemistry. Surface Science 500, 1-3
(2002) 722-740.
[177] S. L. Chen, D. Lee and M. Schell. Enhancement of the electrochemical oxidation
of formic acid. Effects of anion adsorption and variation of rotation rate.
Electrochimica Acta 46, 23 (2001) 3481-3492.
[178] S. L. Chen, D. Lee and M. Schell. Increases in reaction rates and improvement of
current-potential characteristics in the electrochemical oxidation of formic acid.
Electrochemistry Communications 3, 2 (2001) 81-85.
References 147
[179] B. E. K. Swamy, C. Vannoy, J. Maye and M. Schell. Increases in reaction rates
achieved by replacing anions in the electrolyte with more inhibiting ones.
Electrochemistry Communications 6, 10 (2004) 1032-1036.
[180] N. Markovic and P. N. Ross. The effect of specific adsorption of ions and
underpotential deposition of copper on the electrooxidation of methanol on
platinum single-crystal surfaces. Journal of Electroanalytical Chemistry 330, 1-2
(1992) 499-520.
[181] A. Zolfaghari, B. E. Conway and G. Jerkiewicz. Elucidation of the effects of
competitive adsorption of Cl- and Br- ions on the initial stages of Pt surface
oxidation by means of electrochemical nanogravimetry. Electrochimica Acta 47,
8 (2002) 1173-1187.
[182] B. E. Conway, A. Zolfaghari, W. G. Pell and G. Jerkiewicz. Voltammetry,
nanogravimetry and double-layer capacitance studies on chemisorption of Cl- and
Br-, competitive with potential-dependent electrosorption of O species at Pt
electrodes. Electrochimica Acta 48, 25-26 (2003) 3775-3778.
[183] B. E. Conway and D. M. Novak. Chloride-ion adsorption effects in the
recombination-controlled kinetics of anodic chlorine evolution at Pt electrodes.
Journal of the Chemical Society-Faraday Transactions I 75, (1979) 2454-2472.
[184] B. E. Conway and D. M. Novak. Electrocatalytic effect of the oxide film at Pt
anodes on Cl recombination kinetics in chlorine evolution. Journal of
Electroanalytical Chemistry 99, 2 (1979) 133-156.
[185] B. E. Conway and J. Mozota. Chloride-ion effects on the reversible and
irreversible surface oxidation processes at Pt electrodes, and on the growth of
monolayer oxide-films at Pt. Journal of the Chemical Society-Faraday
Transactions I 78, (1982) 1717-1732.
[186] M. C. Perez, A. Rincon and C. Gutierrez. Effect of chloride ions on the
electrooxidation at low potentials of dissolved carbon monoxide on platinum.
Journal of Electroanalytical Chemistry 511, 1-2 (2001) 39-45.

References 148
[187] S. B. Hall, E. A. Khudaish and A. L. Hart. Electrochemical oxidation of hydrogen
peroxide at platinum electrodes. Part V: inhibition by chloride. Electrochimica
Acta 45, 21 (2000) 3573-3579.
[188] A. Lopez-Cudero, A. Cuesta and C. Gutierrez. The effect of chloride on the
electrooxidation of adsorbed CO on polycrystalline platinum electrodes. Journal
of Electroanalytical Chemistry 548, (2003) 109-119.
[189] J. Bolton. Diploma Thesis (2006) Technical University Munich, Munich.
Acknowledgement 149
Acknowledgement
First of all, I would like to thank Prof. Katharina Krischer for giving me an opportunity
to work on a very interesting field of natural science in one of the world best scientific
institution. I am grateful to her for suggesting the research direction, non-stop support,
active discussion, encouragement and help. Likewise I would like to thank Prof. G. Ertl,
Dr. B. Pettinger (FHI Berlin), Prof. J. Wintterlin (LMU Munich) and Dr. P. Faulner
(TUM Physics) for their help regarding the experimental methods. And I gratefully
acknowledge the help of Prof. A. Bonnefont, Prof. A. Birzu, Dr. H. Varela and Prof. E.
Savinova throughout my work.
I would like to thank Ms. I. Miethe, Mr. J. Siegmeier, Mr. P. Bauer, Mr. R. Hoelzel, Ms.
T. Pourrostami, Dr. N. Baba, Mr. J. Bolten, Dr. V. G. Morales and all members of Prof.
Stimming group for their valuable help and encouragement during my stay in Munich.
Specially, I would like to thank Mr. S. Scheirer, Mr. G. Mueller and to all employees
from the mechanical workshop in physics dep. TUM for the preparation of the
experimental setup.
I would also like to mention the persons who inspired and motivate me for the study of
physics, my first physics teacher Tapan Kumar Bhattacharjee (Nimta High School), Dr.
Kalobaron Maity (Presidency College), Dr. P. Mukherjee, Dr. K. Mitra, Dr. B.K.
Majumdar, Dr. A. Som, Dr. G.B. Mukherjee, Dr. K.B. Choudhury and Dr. S.
Mukhopadhyay (BKC College Kolkata), Dr. P.N. Banerjee (Surendranath College), Prof.
D. Ghosh, Prof. K.K. Chottopadhyay, Prof. N. Banerjee, Prof. A. Manna, Prof. A. M.
Basu, Prof. D.P. Bhattacharya, Prof. D. Lohar, and Dr. N.B. Manik, Prof. Manoranjan
Khan, Prof. Dipankar Ray (Jadavpur University), Prof. K. Gopakumar, Prof. S.K. Sinha
(Indian Institute of Science), Dr. V.T. Somasekhar (RE College Warangal) and Prof.
B.N. Biswas (Burdwan University). I would like to thank my wife Mrs. Paramita Das for

Acknowledgement 150
her support during my stay in Munich. Further I would like to thank Vineet, Arnab,
Suresh, Aparna, Shaw, Nithu, Nina, Mani, Sudha, Subhasis, Kiron, Somnath, Amjad,
Ruhi, Vinod, Shital, Arvind, Mainakda, Piudi, Supratik Das and Shaktivhel for their
support and help. I would like to thank Mrs. Chakrabarti from German Consulate,
Kolkata for her help during the thesis submission. Finally, I would like to thank Mrs. K.
Wilson and all employees of the office of the Dep. of Physics, TUM for their valuable
assist throughout my stay in Munich.
List of Publications 151
List of Publications
1. S. Malkhandi, A. Bonnefont, K. Krischer. Strictly potentiostatic current
oscillations during bulk CO electro-oxidation on platinum in the presence of
inhibiting anions. Electrochemistry Communications, 7, (2005), 710–716.
2. S. Malkhandi, A. Bonnefont, K. Krischer. Dynamic instabilities during the
continuous electro-oxidation of CO on poly- and single crystalline Pt electrodes.
Communicated.
Recommended