Prospects and Possibilities for Connecting Ductile Fracture Toughness and the Statistics of Fracture
Surface Roughness
Alan NeedlemanDepartment of Materials Science & Engineering
University of North Texas
Work with:
Ankit Srivastava, Shmulik Osovski, Laurent Ponson, Viggo Tvergaard, Elisabeth Bouchaud,
James C. Williams
2
Materials Fracture Mechanics Fundamental issues:
What is the relation between crack growth resistance, microstructure and applied loading?
What is the relation between fracture surface roughness, microstructure and applied loading?
Corollary: What is the relation, if any, between a material system’s crack growth resistance and the statistics of fracture surface roughness?
Aim: simulate ductile fracture for model microstructures and predict the crack growth resistance and the fracture surface roughness.
Can the analyses be used to develop a design methodology for materials with improved failure resistance?
3
Toughness/Roughness Relation
Possible uses:
Provide a quantitative measure of toughness (crack initiation and growth resistance) in circumstances where a valid fracture test cannot be carried out.
Identify and provide insight into the physical mechanism of crack initiation/growth.
Provide a basis for assessing the predictive capability of theories of crack initiation and growth.
4
Ductile Fracture in Structural Metals
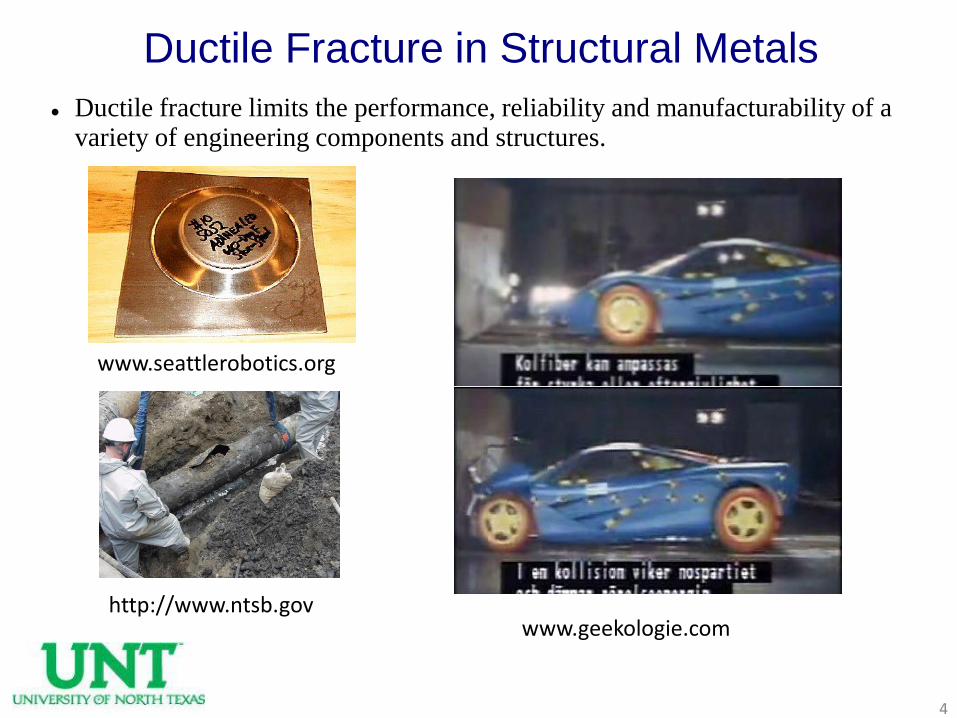
Ductile fracture limits the performance, reliability and manufacturability of a variety of engineering components and structures.
http://www.ntsb.gov
www.seattlerobotics.org
www.geekologie.com
5
Ductile Fracture in Structural Metals
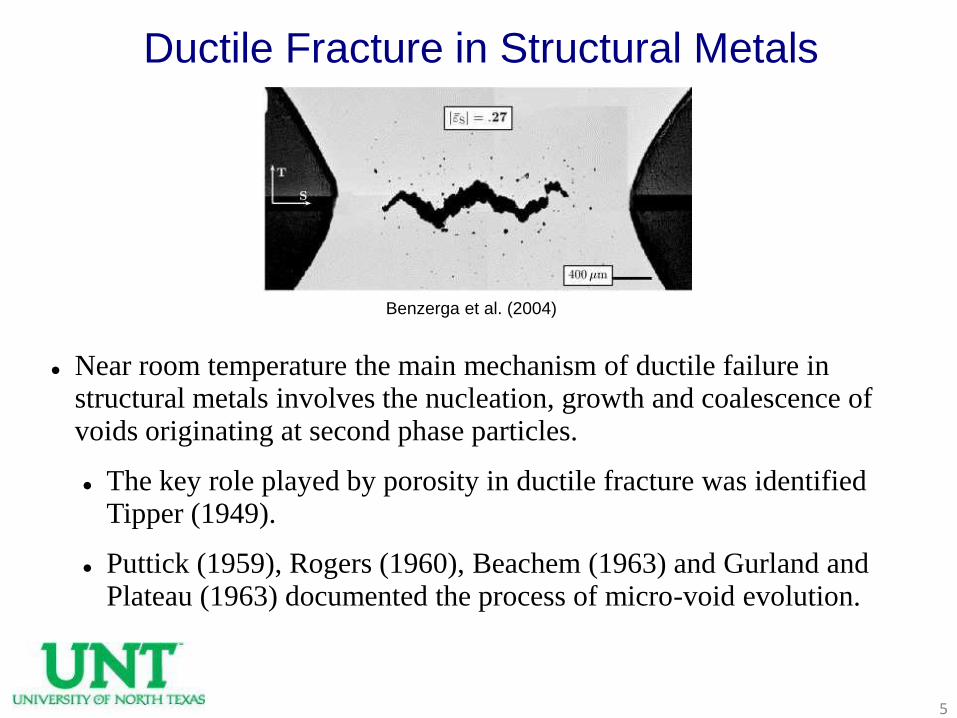
Near room temperature the main mechanism of ductile failure in structural metals involves the nucleation, growth and coalescence of voids originating at second phase particles.
The key role played by porosity in ductile fracture was identified Tipper (1949).
Puttick (1959), Rogers (1960), Beachem (1963) and Gurland and Plateau (1963) documented the process of micro-void evolution.
Benzerga et al. (2004)
6
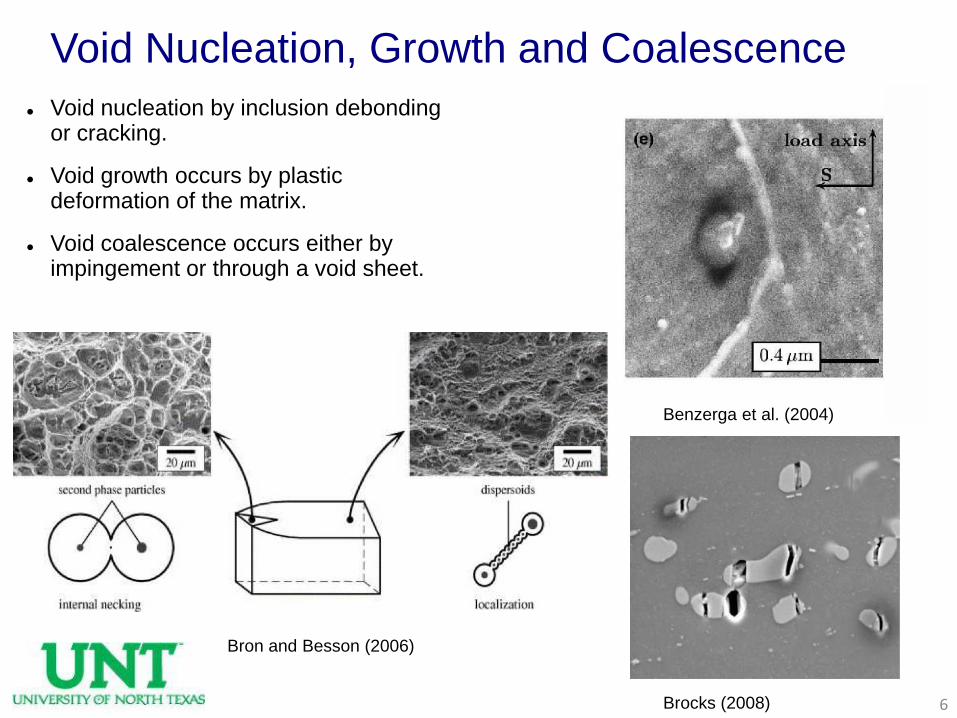
Void Nucleation, Growth and Coalescence
Void nucleation by inclusion debondingor cracking.
Void growth occurs by plastic deformation of the matrix.
Void coalescence occurs either by impingement or through a void sheet.
Benzerga et al. (2004)
Brocks (2008)
Bron and Besson (2006)
7
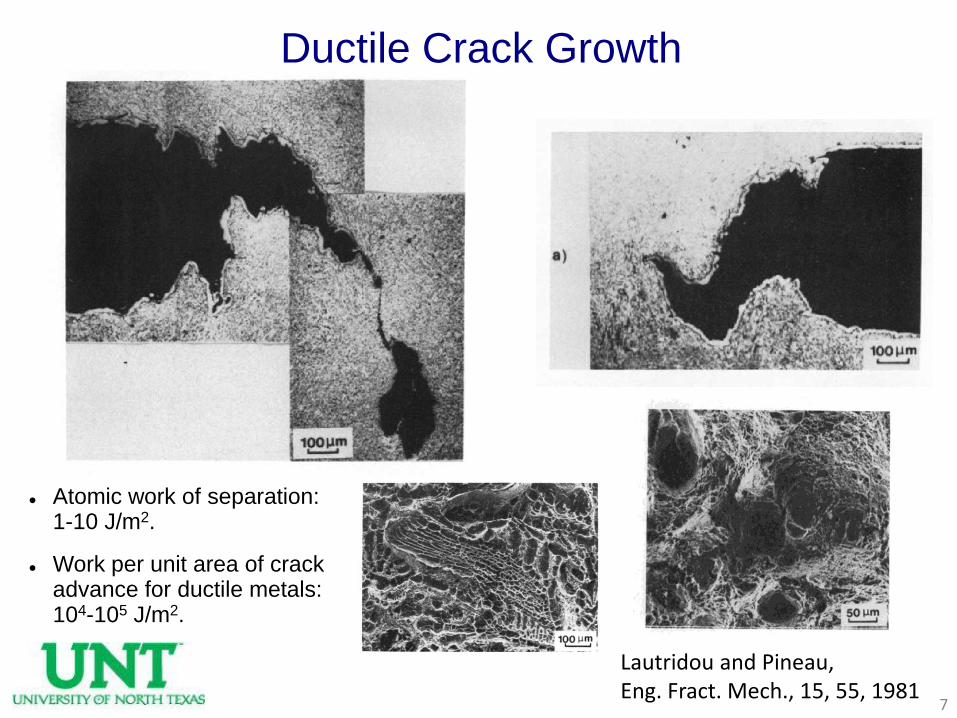
Ductile Crack Growth
Lautridou and Pineau,Eng. Fract. Mech., 15, 55, 1981
Atomic work of separation: 1-10 J/m2.
Work per unit area of crack advance for ductile metals: 104-105 J/m2.
8
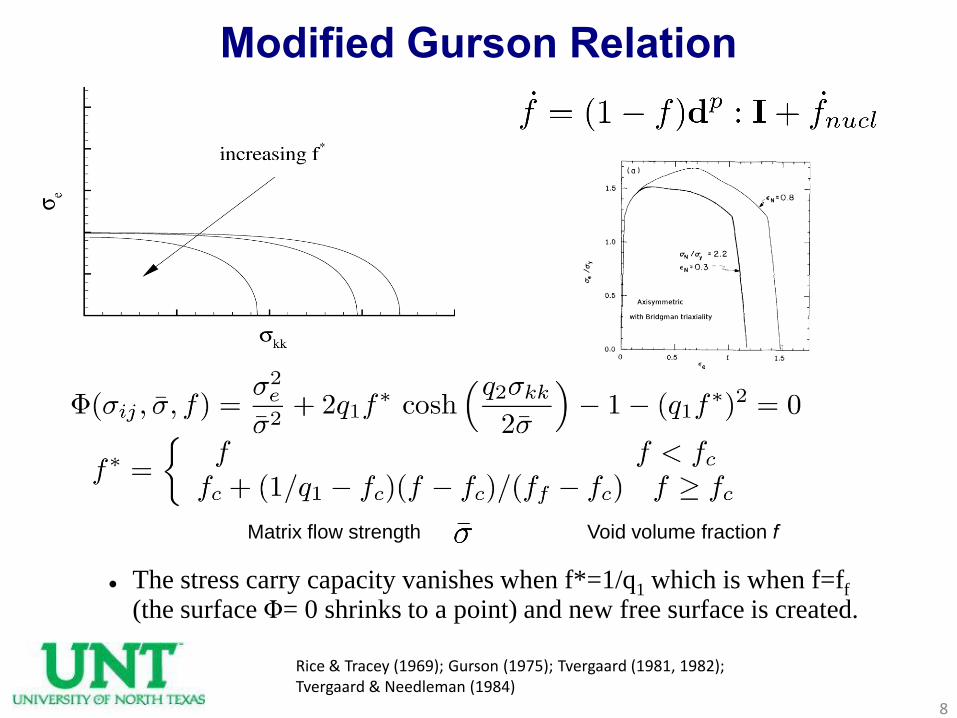
Modified Gurson Relation
Matrix flow strength Void volume fraction f
The stress carry capacity vanishes when f*=1/q1 which is when f=ff
(the surface Φ= 0 shrinks to a point) and new free surface is created.
Rice & Tracey (1969); Gurson (1975); Tvergaard (1981, 1982); Tvergaard & Needleman (1984)
9
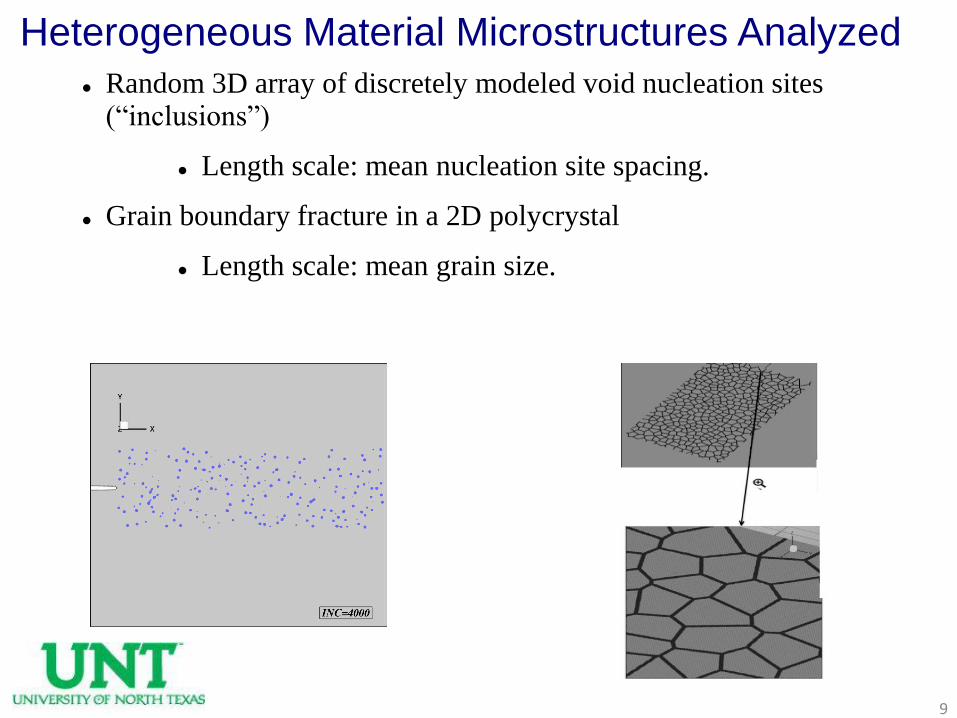
Heterogeneous Material Microstructures Analyzed
Random 3D array of discretely modeled void nucleation sites (“inclusions”)
Length scale: mean nucleation site spacing.
Grain boundary fracture in a 2D polycrystal
Length scale: mean grain size.
10
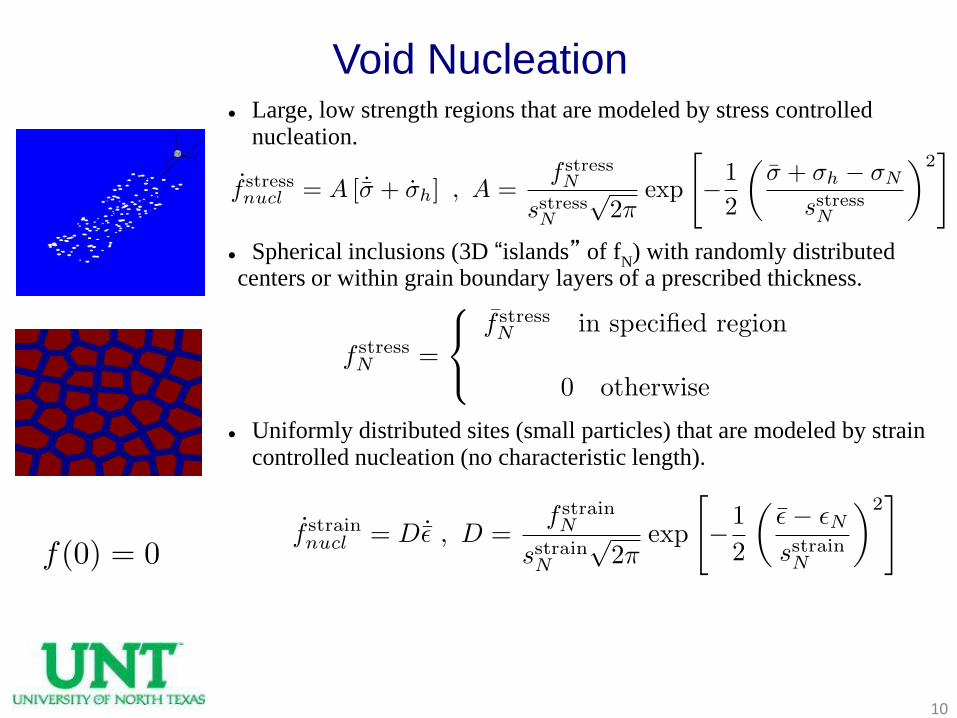
Void Nucleation Large, low strength regions that are modeled by stress controlled
nucleation.
Spherical inclusions (3D “islands” of fN) with randomly distributed
centers or within grain boundary layers of a prescribed thickness.
Uniformly distributed sites (small particles) that are modeled by strain controlled nucleation (no characteristic length).
11
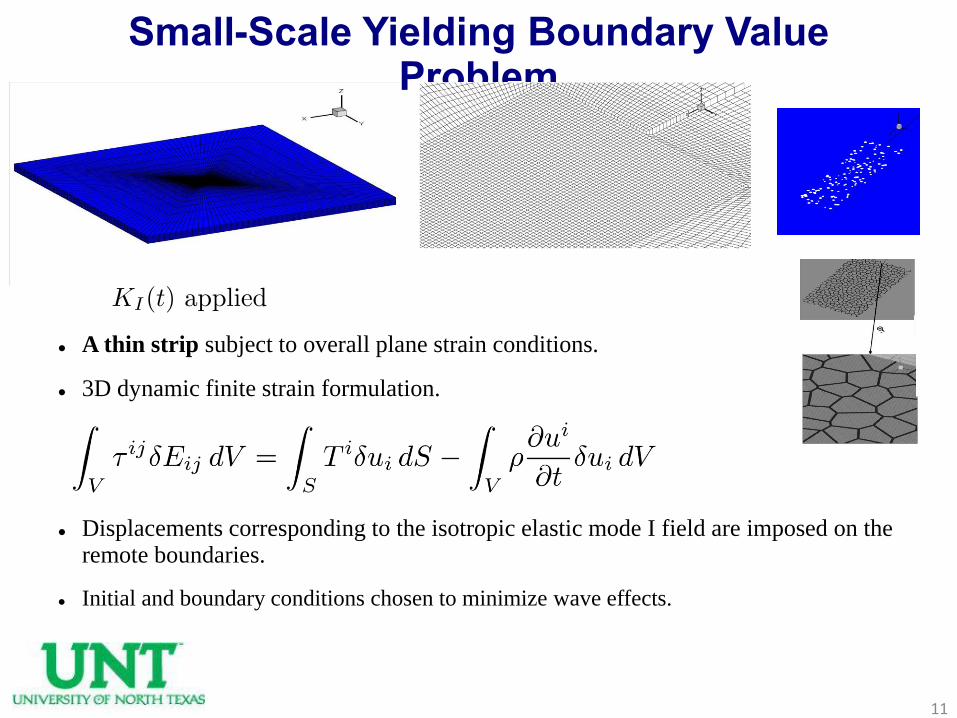
Small-Scale Yielding Boundary Value Problem
A thin strip subject to overall plane strain conditions.
3D dynamic finite strain formulation.
Displacements corresponding to the isotropic elastic mode I field are imposed on the remote boundaries.
Initial and boundary conditions chosen to minimize wave effects.
12
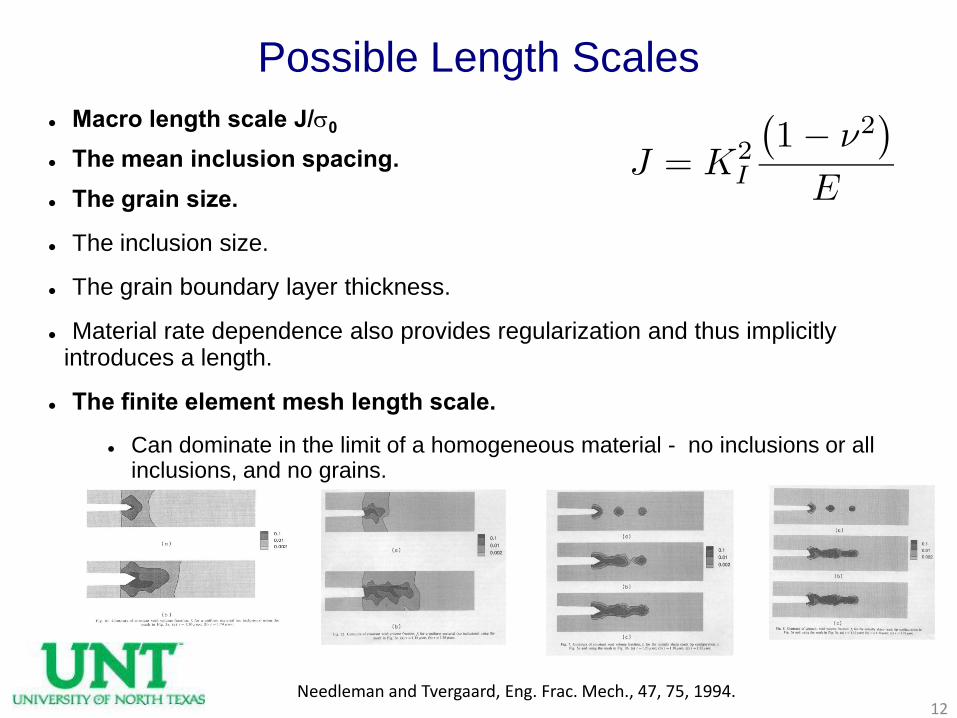
Possible Length Scales
Macro length scale J/s0
The mean inclusion spacing.
The grain size.
The inclusion size.
The grain boundary layer thickness.
Material rate dependence also provides regularization and thus implicitly introduces a length.
The finite element mesh length scale.
Can dominate in the limit of a homogeneous material - no inclusions or all inclusions, and no grains.
Needleman and Tvergaard, Eng. Frac. Mech., 47, 75, 1994.
13
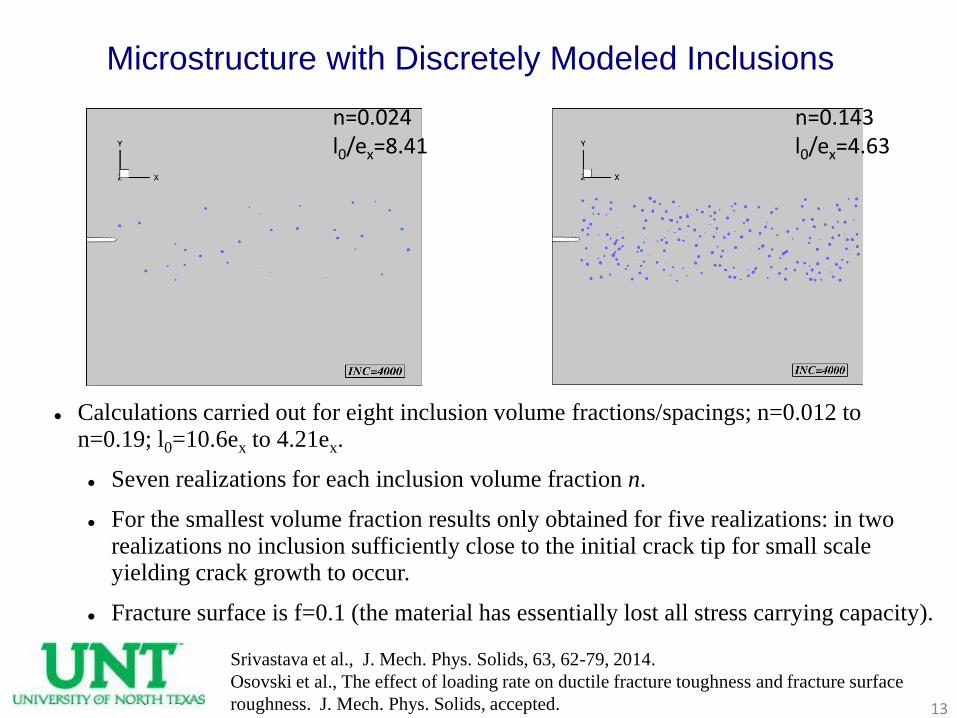
Calculations carried out for eight inclusion volume fractions/spacings; n=0.012 to n=0.19; l0=10.6ex to 4.21ex.
Seven realizations for each inclusion volume fraction n.
For the smallest volume fraction results only obtained for five realizations: in two realizations no inclusion sufficiently close to the initial crack tip for small scale yielding crack growth to occur.
Fracture surface is f=0.1 (the material has essentially lost all stress carrying capacity).
Microstructure with Discretely Modeled Inclusions
n=0.143l0/ex=4.63
n=0.024l0/ex=8.41
Srivastava et al., J. Mech. Phys. Solids, 63, 62-79, 2014.
Osovski et al., The effect of loading rate on ductile fracture toughness and fracture surface
roughness. J. Mech. Phys. Solids, accepted.
14
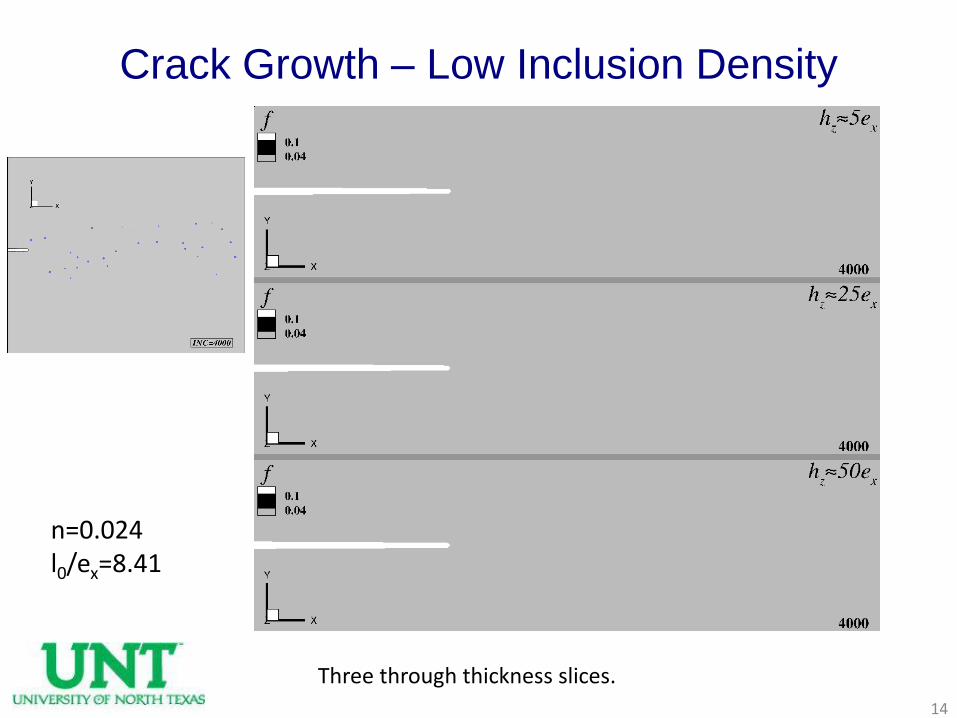
Crack Growth – Low Inclusion Density
n=0.024l0/ex=8.41
Three through thickness slices.
15
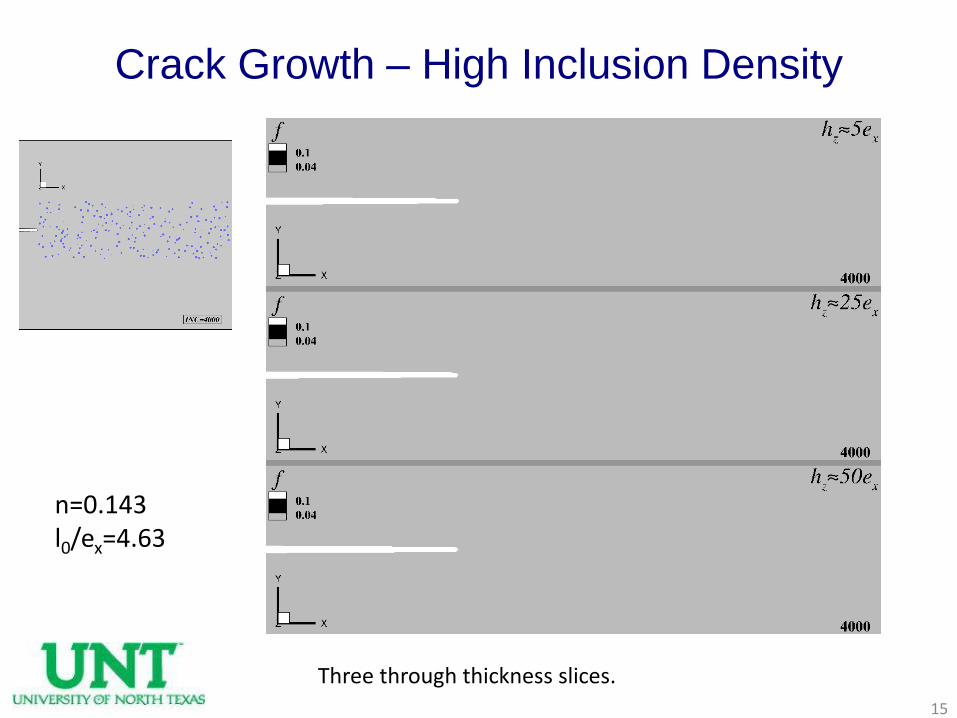
Crack Growth – High Inclusion Density
n=0.143l0/ex=4.63
Three through thickness slices.
16
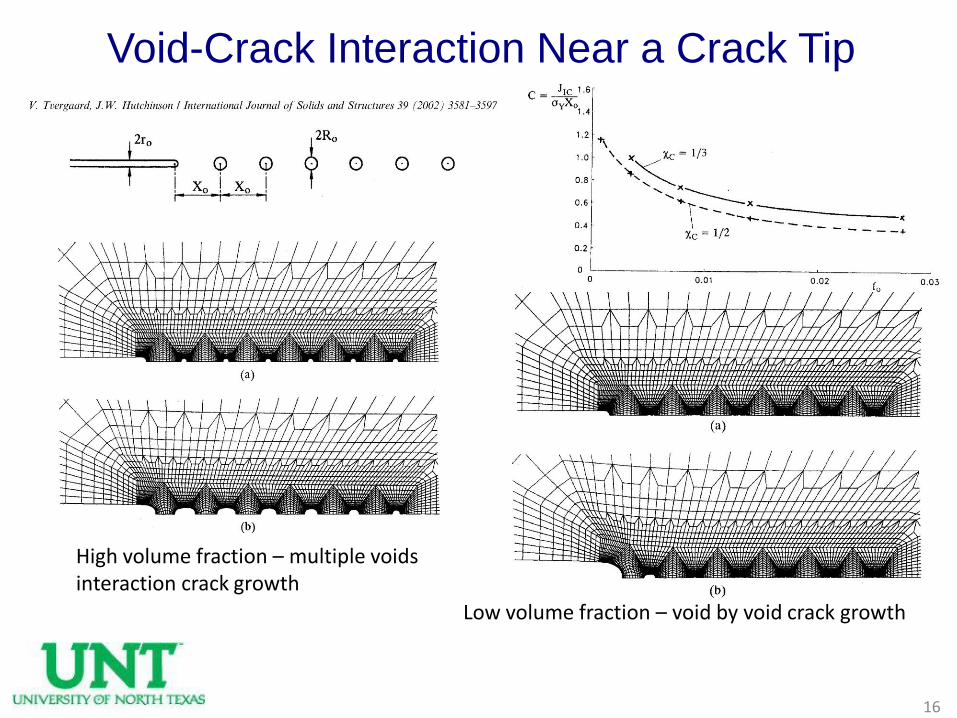
Void-Crack Interaction Near a Crack Tip
Low volume fraction – void by void crack growth
High volume fraction – multiple voids interaction crack growth
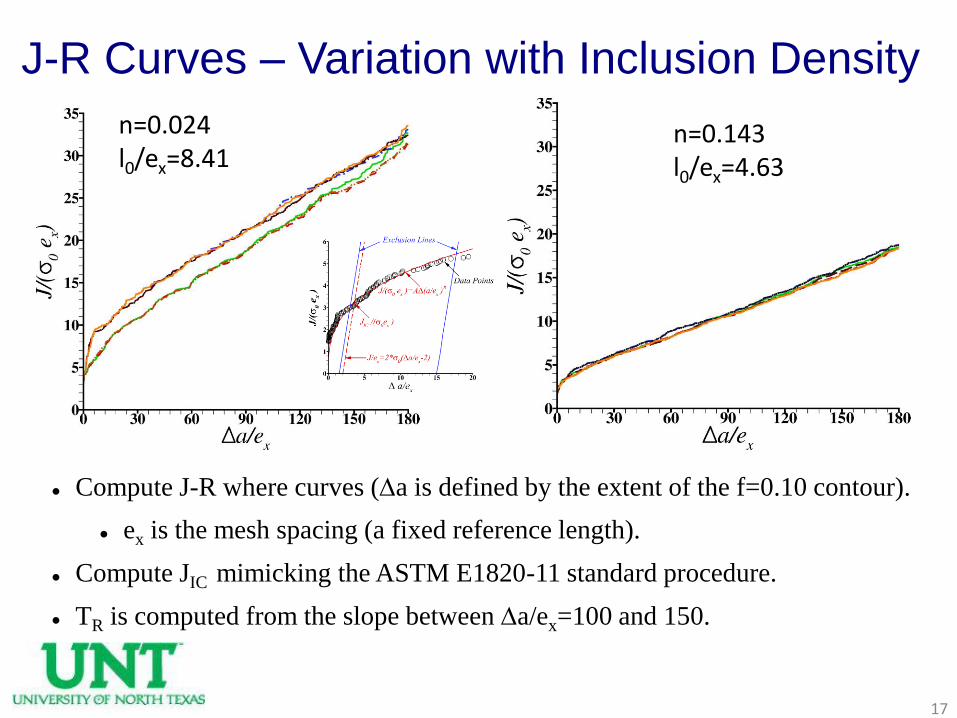
J-R Curves – Variation with Inclusion Density
17
Compute J-R where curves (Da is defined by the extent of the f=0.10 contour).
ex is the mesh spacing (a fixed reference length).
Compute JIC mimicking the ASTM E1820-11 standard procedure.
TR is computed from the slope between Da/ex=100 and 150.
n=0.024l0/ex=8.41
n=0.143l0/ex=4.63
18
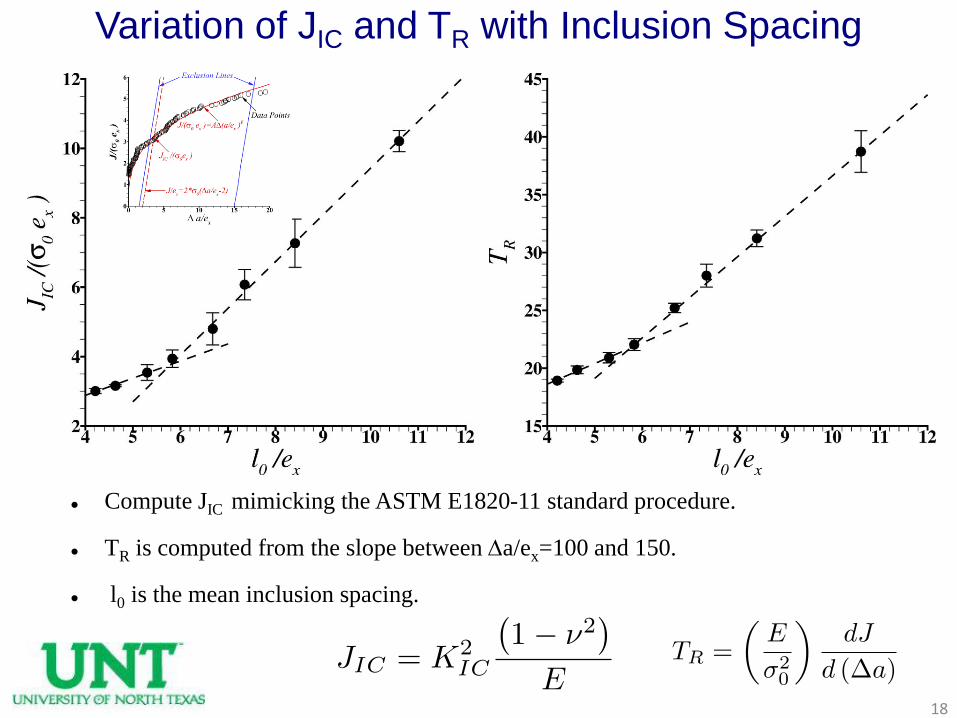
Variation of JIC and TR with Inclusion Spacing
Compute JIC mimicking the ASTM E1820-11 standard procedure.
TR is computed from the slope between Da/ex=100 and 150.
l0 is the mean inclusion spacing.
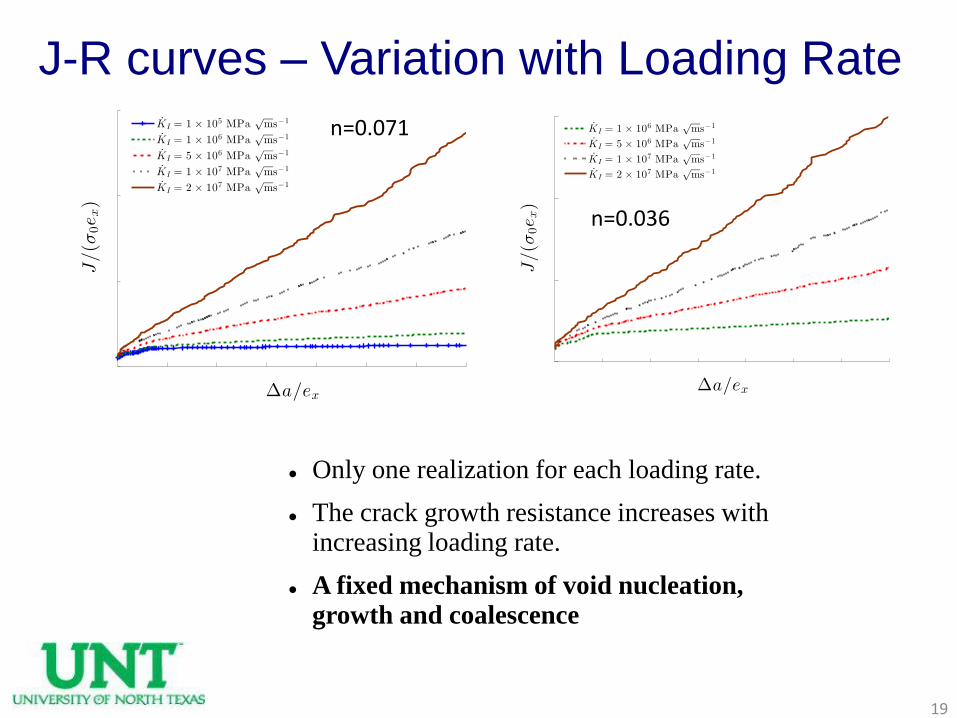
J-R curves – Variation with Loading Rate
19
Only one realization for each loading rate.
The crack growth resistance increases with increasing loading rate.
A fixed mechanism of void nucleation, growth and coalescence
n=0.071
n=0.036
20
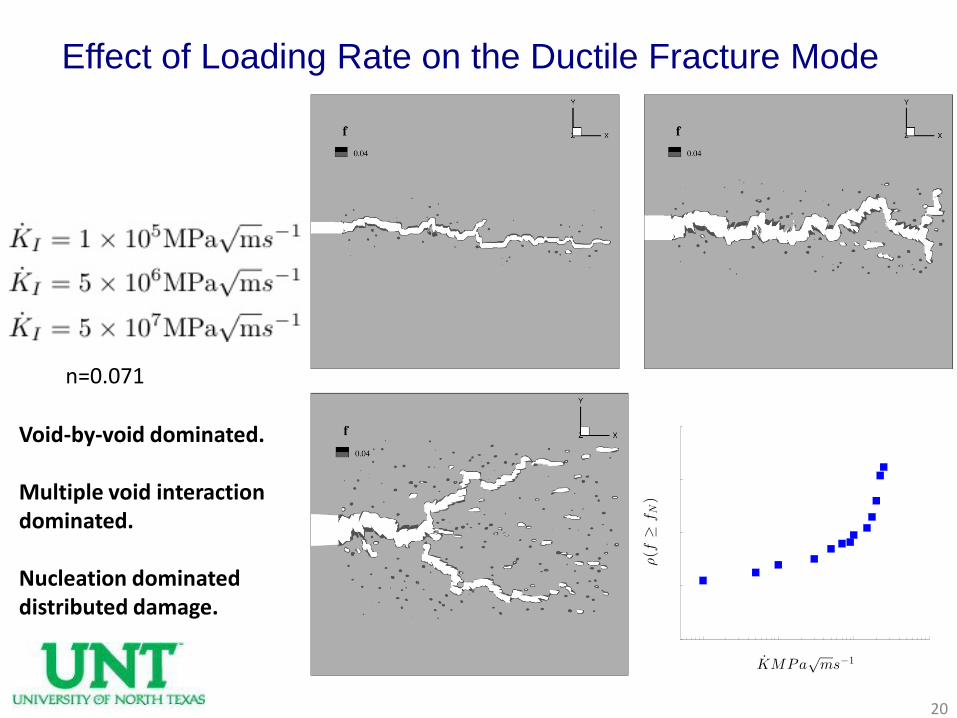
Effect of Loading Rate on the Ductile Fracture Mode
Void-by-void dominated.
Multiple void interaction dominated.
Nucleation dominated distributed damage.
n=0.071
21
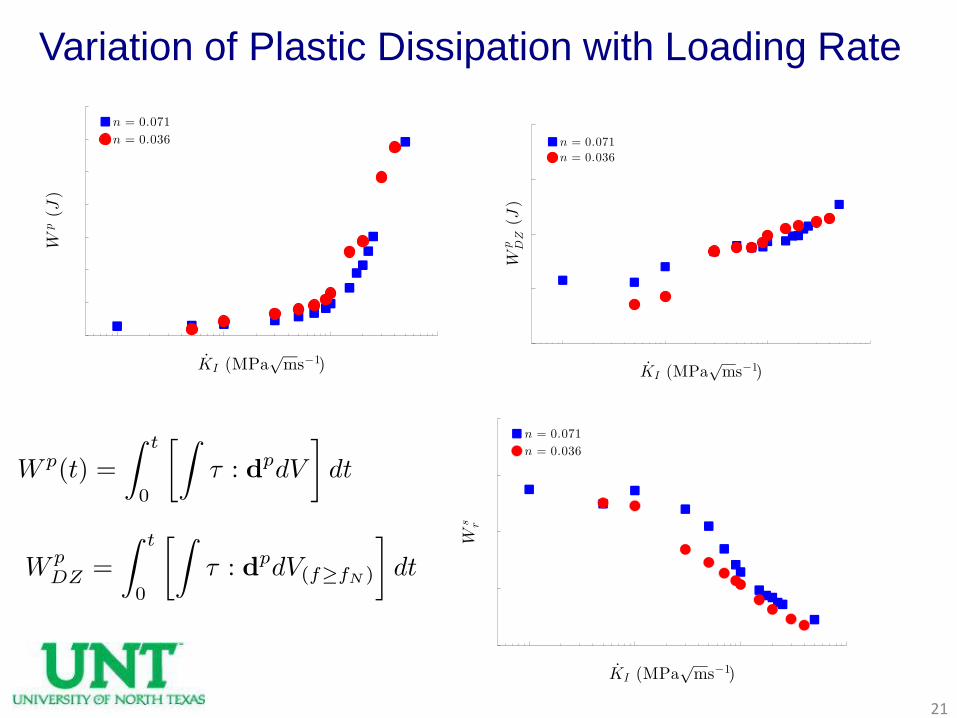
Variation of Plastic Dissipation with Loading Rate
22
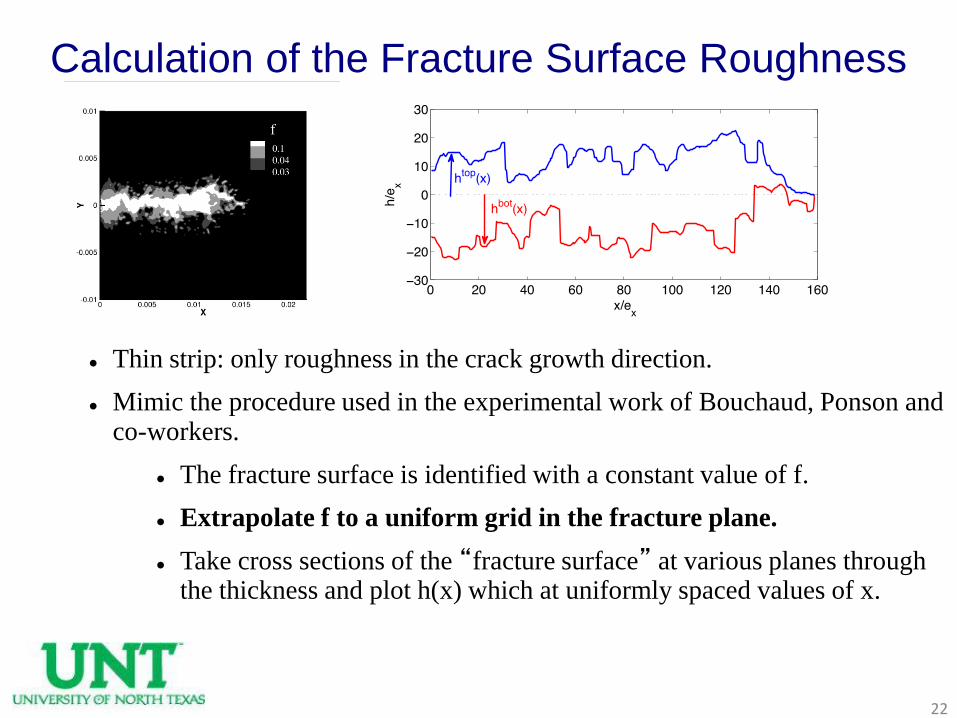
Calculation of the Fracture Surface Roughness
Thin strip: only roughness in the crack growth direction.
Mimic the procedure used in the experimental work of Bouchaud, Ponson and co-workers.
The fracture surface is identified with a constant value of f.
Extrapolate f to a uniform grid in the fracture plane.
Take cross sections of the “fracture surface” at various planes through the thickness and plot h(x) which at uniformly spaced values of x.
23
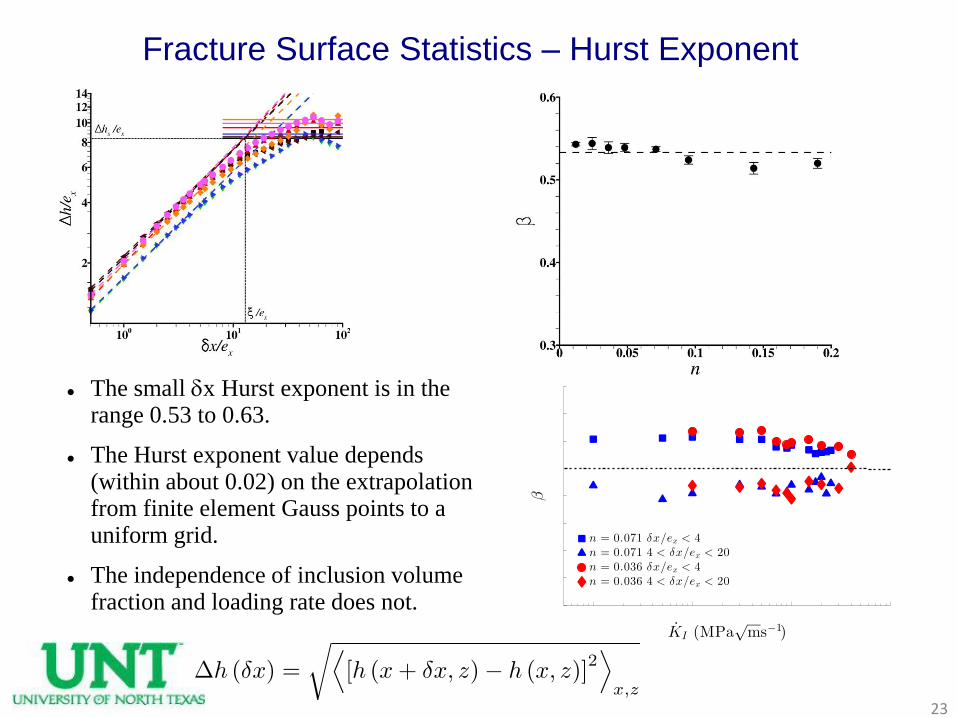
The small dx Hurst exponent is in the range 0.53 to 0.63.
The Hurst exponent value depends (within about 0.02) on the extrapolation from finite element Gauss points to a uniform grid.
The independence of inclusion volume fraction and loading rate does not.
Fracture Surface Statistics – Hurst Exponent
24
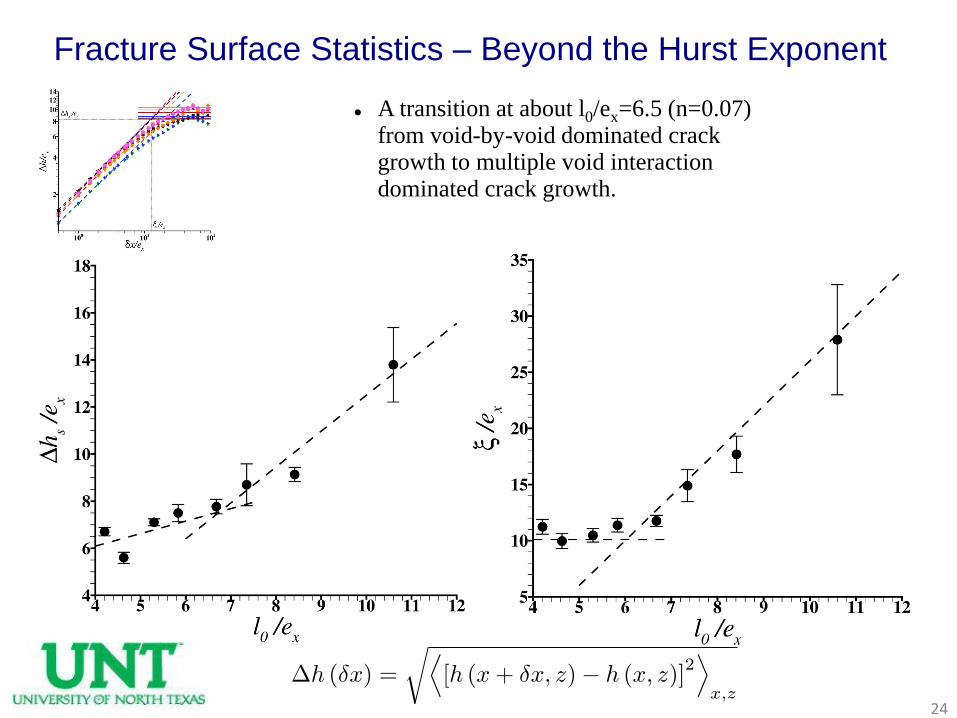
Fracture Surface Statistics – Beyond the Hurst Exponent
A transition at about l0/ex=6.5 (n=0.07) from void-by-void dominated crack growth to multiple void interaction dominated crack growth.
25
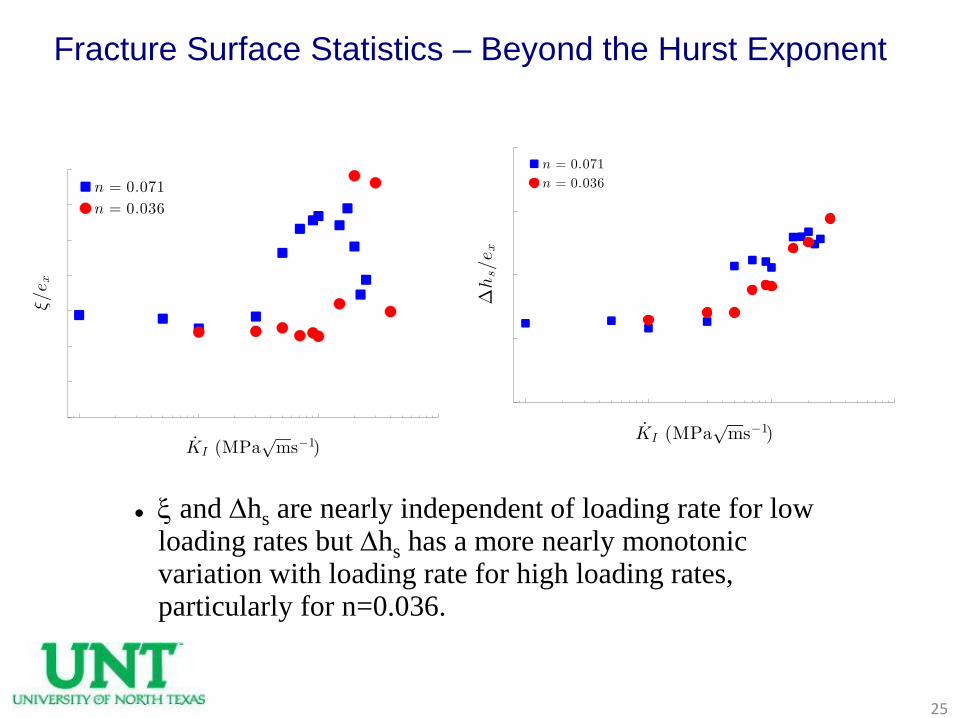
Fracture Surface Statistics – Beyond the Hurst Exponent
x and Dhs are nearly independent of loading rate for low loading rates but Dhs has a more nearly monotonic variation with loading rate for high loading rates, particularly for n=0.036.
26
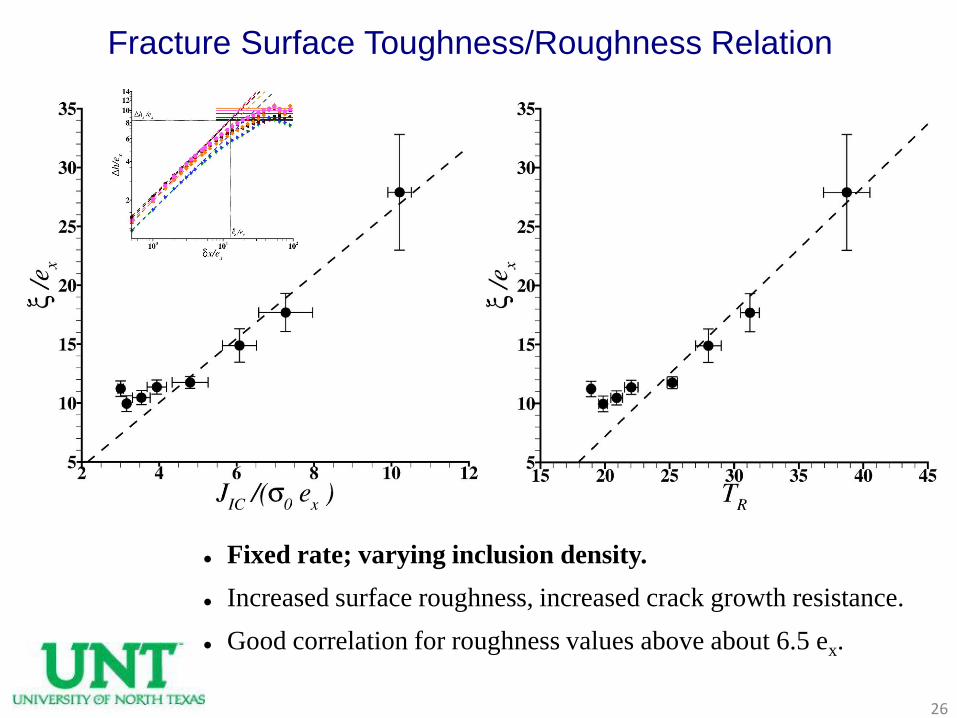
Fracture Surface Toughness/Roughness Relation
Fixed rate; varying inclusion density.
Increased surface roughness, increased crack growth resistance.
Good correlation for roughness values above about 6.5 ex.
27
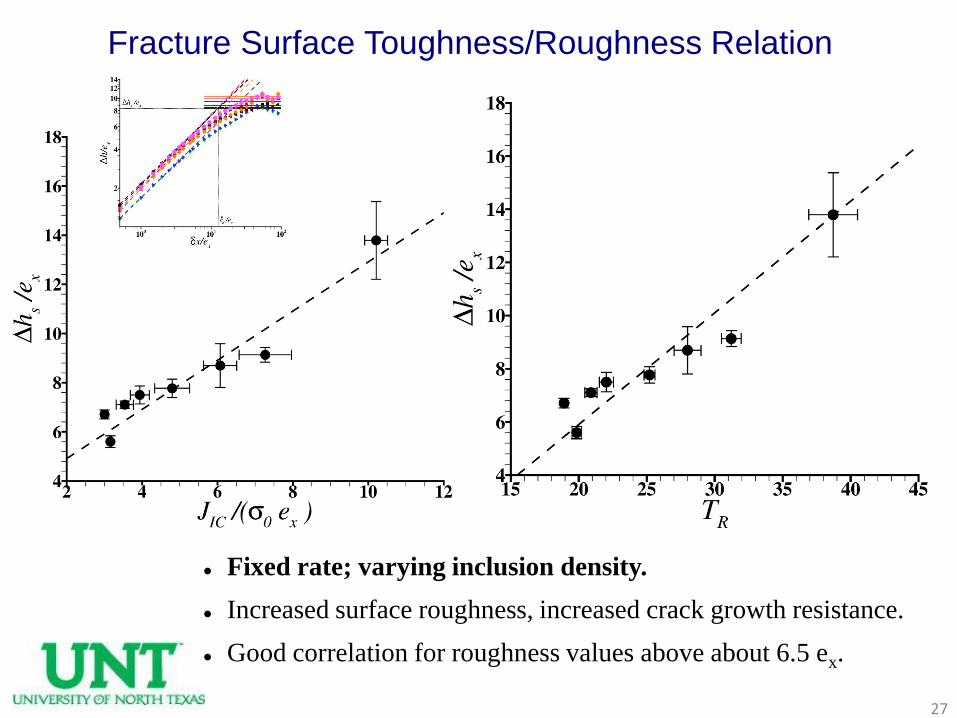
Fixed rate; varying inclusion density.
Increased surface roughness, increased crack growth resistance.
Good correlation for roughness values above about 6.5 ex.
Fracture Surface Toughness/Roughness Relation
28
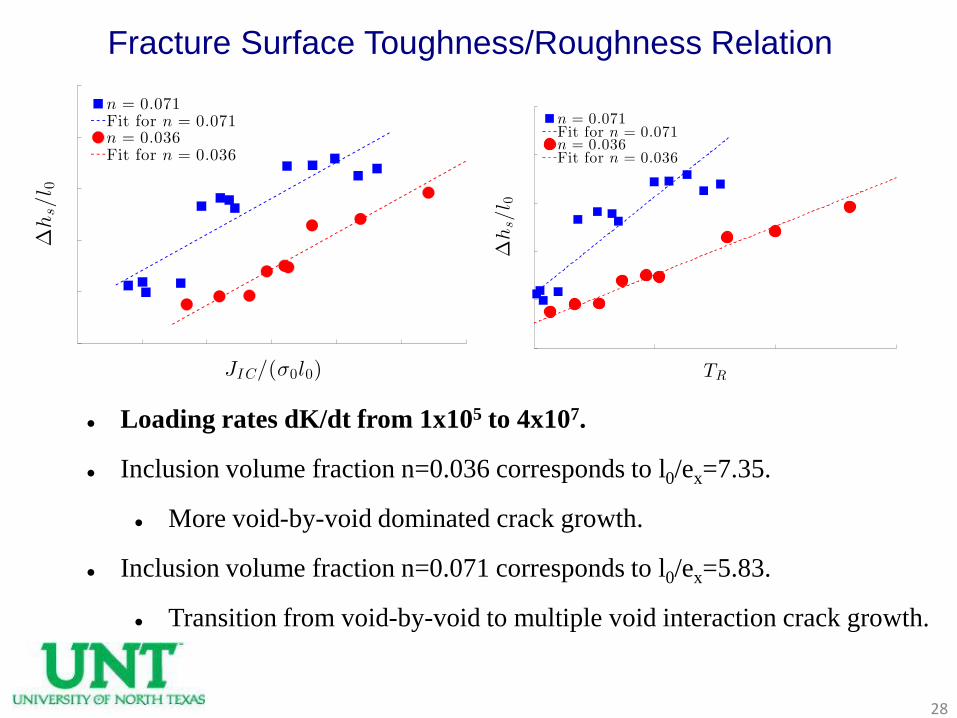
Loading rates dK/dt from 1x10⁵ to 4x10⁷.
Inclusion volume fraction n=0.036 corresponds to l0/ex=7.35.
More void-by-void dominated crack growth.
Inclusion volume fraction n=0.071 corresponds to l0/ex=5.83.
Transition from void-by-void to multiple void interaction crack growth.
Fracture Surface Toughness/Roughness Relation
29
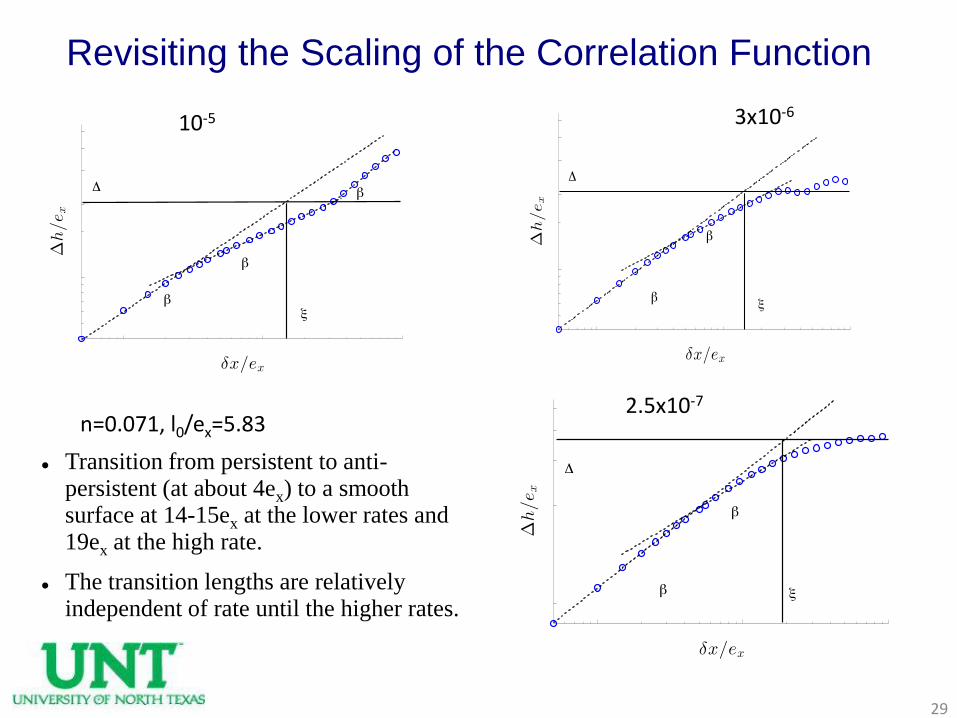
Revisiting the Scaling of the Correlation Function
10-5 3x10⁻⁶
2.5x10⁻⁷
Transition from persistent to anti-persistent (at about 4ex) to a smooth surface at 14-15ex at the lower rates and 19ex at the high rate.
The transition lengths are relatively independent of rate until the higher rates.
n=0.071, l0/ex=5.83
30
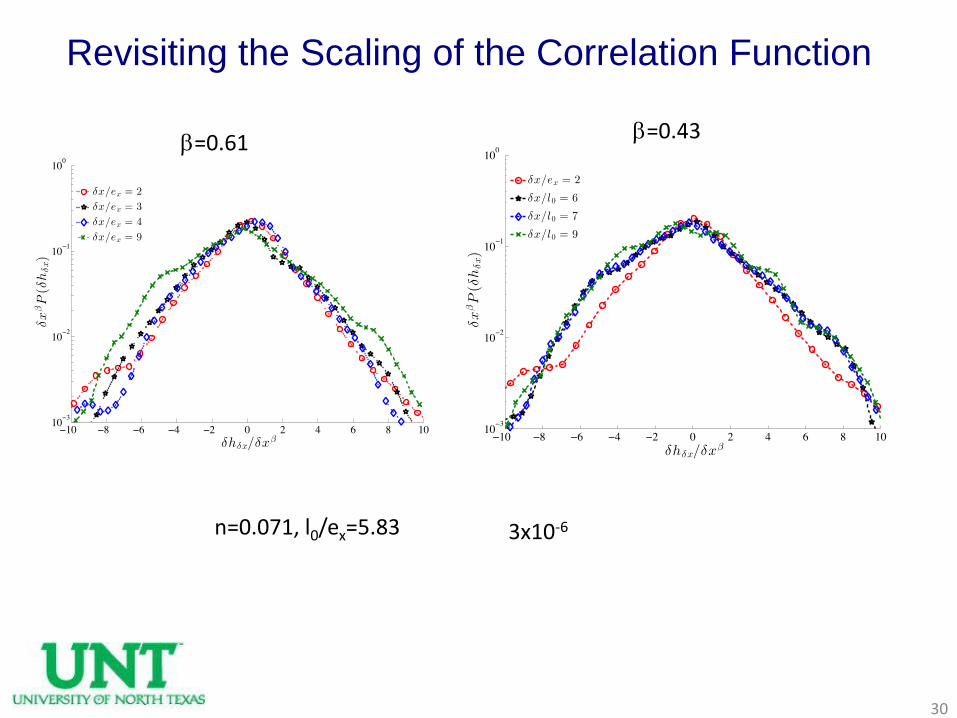
Revisiting the Scaling of the Correlation Function
3x10⁻⁶n=0.071, l0/ex=5.83
b=0.61 b=0.43
31
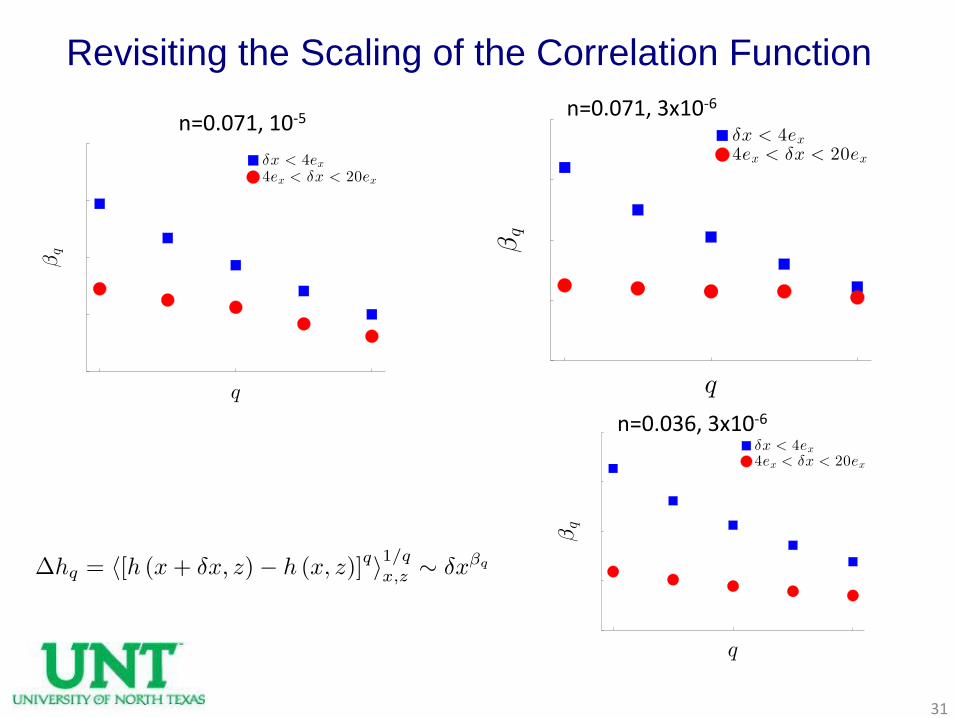
Revisiting the Scaling of the Correlation Function
n=0.071, 10-5 n=0.071, 3x10⁻⁶
n=0.036, 3x10⁻⁶
32
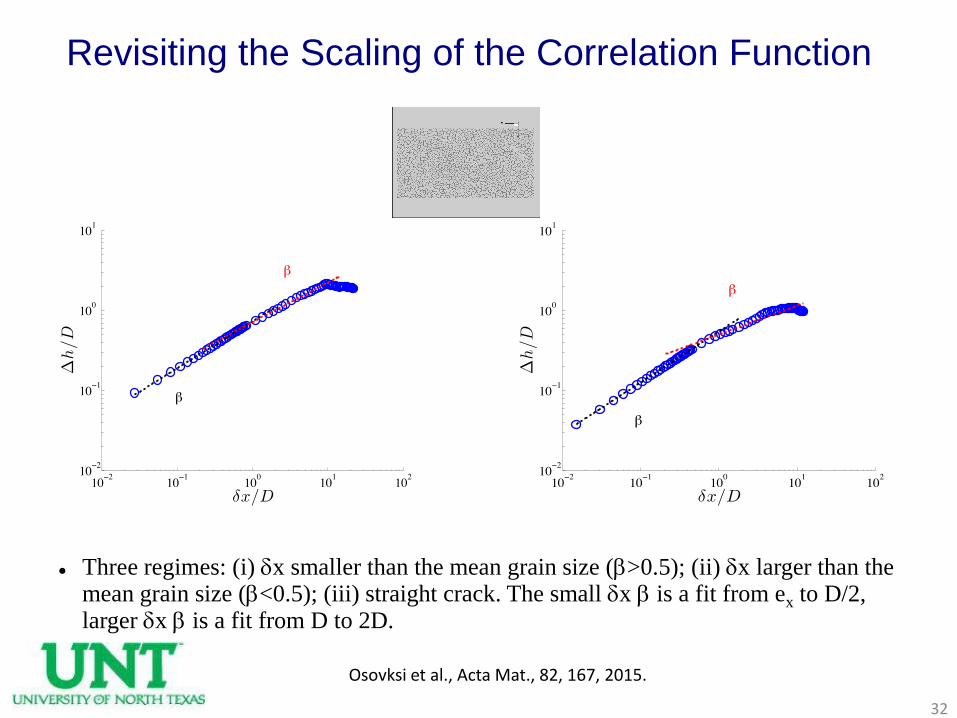
Three regimes: (i) dx smaller than the mean grain size (b>0.5); (ii) dx larger than the mean grain size (b<0.5); (iii) straight crack. The small dx b is a fit from ex to D/2, larger dx b is a fit from D to 2D.
Revisiting the Scaling of the Correlation Function
Osovksi et al., Acta Mat., 82, 167, 2015.
33
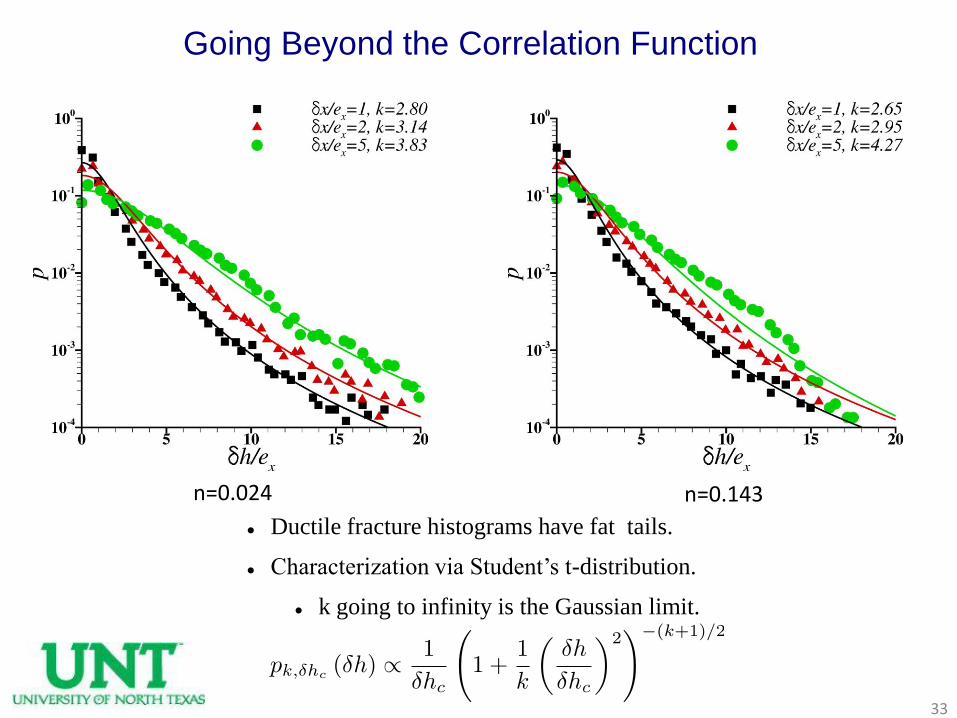
Ductile fracture histograms have fat tails.
Characterization via Student’s t-distribution.
k going to infinity is the Gaussian limit.
Going Beyond the Correlation Function
n=0.024 n=0.143
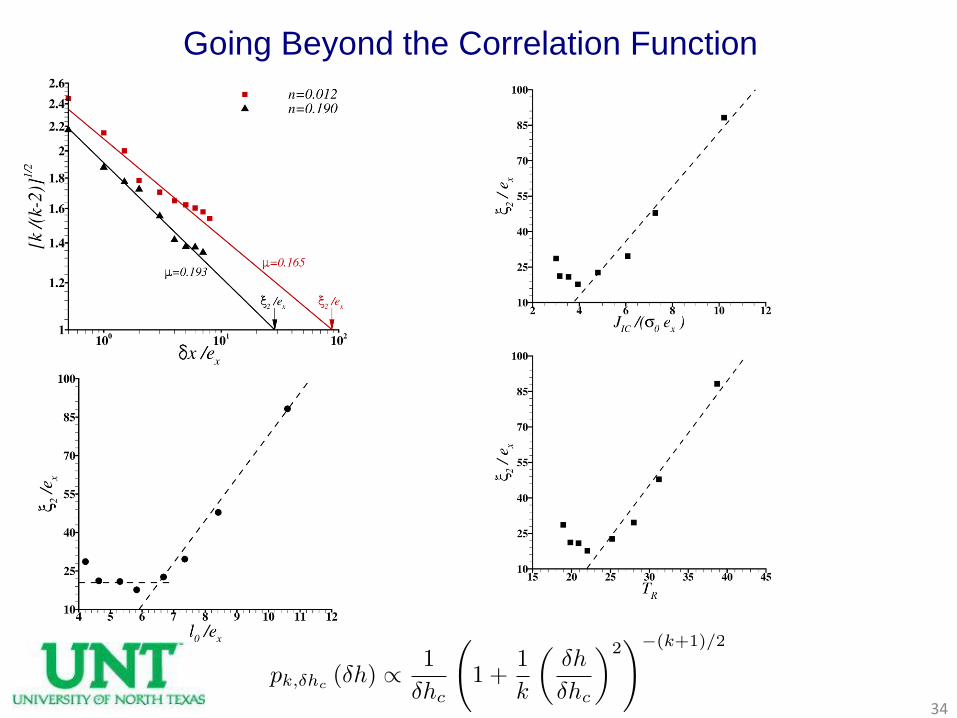
34
Going Beyond the Correlation Function
35
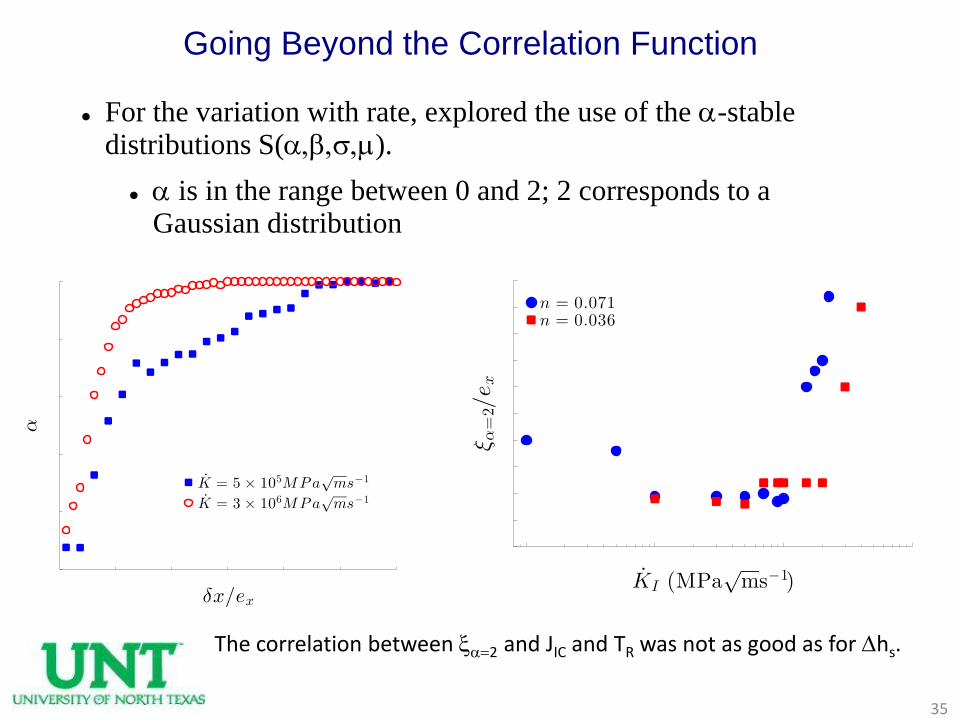
Going Beyond the Correlation Function
For the variation with rate, explored the use of the a-stable distributions S(a,b,s,m).
a is in the range between 0 and 2; 2 corresponds to a Gaussian distribution
The correlation between xa=2 and JIC and TR was not as good as for Dhs.
36
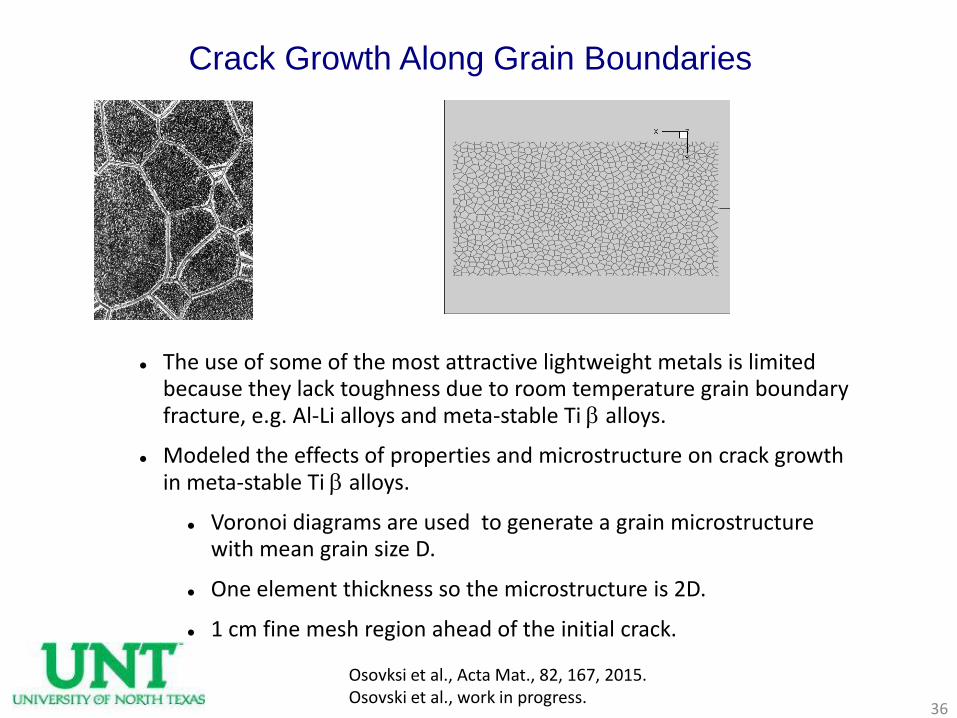
Crack Growth Along Grain Boundaries
The use of some of the most attractive lightweight metals is limited because they lack toughness due to room temperature grain boundary fracture, e.g. Al-Li alloys and meta-stable Ti b alloys.
Modeled the effects of properties and microstructure on crack growth in meta-stable Ti b alloys.
Voronoi diagrams are used to generate a grain microstructure with mean grain size D.
One element thickness so the microstructure is 2D.
1 cm fine mesh region ahead of the initial crack.
Osovksi et al., Acta Mat., 82, 167, 2015.Osovski et al., work in progress.
37
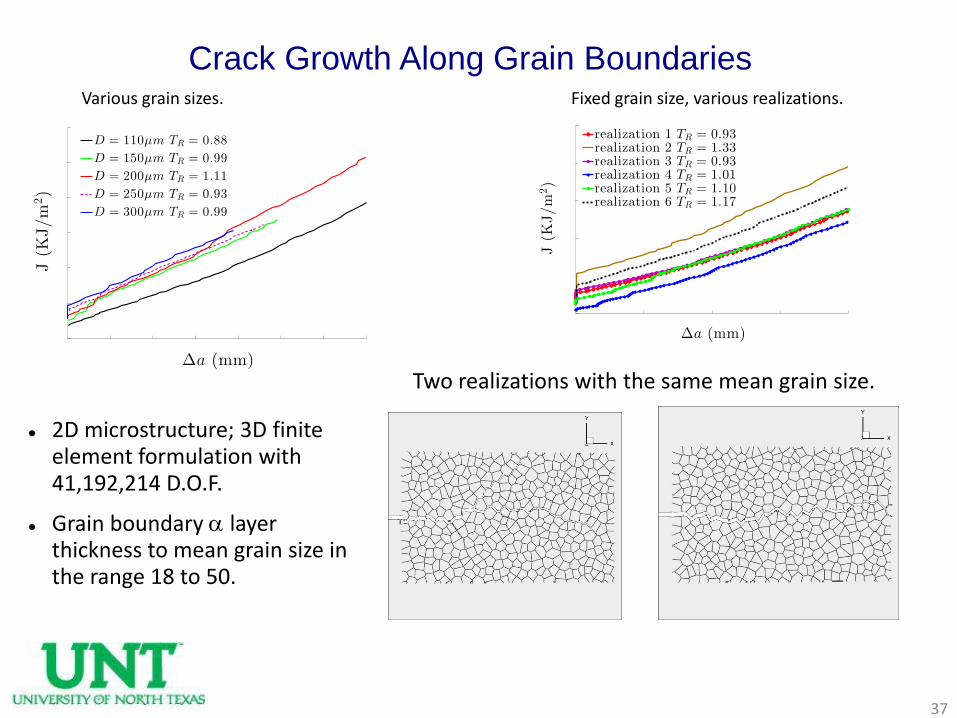
Crack Growth Along Grain Boundaries
2D microstructure; 3D finite element formulation with 41,192,214 D.O.F.
Grain boundary a layer thickness to mean grain size in the range 18 to 50.
Fixed grain size, various realizations.Various grain sizes.
Two realizations with the same mean grain size.
38
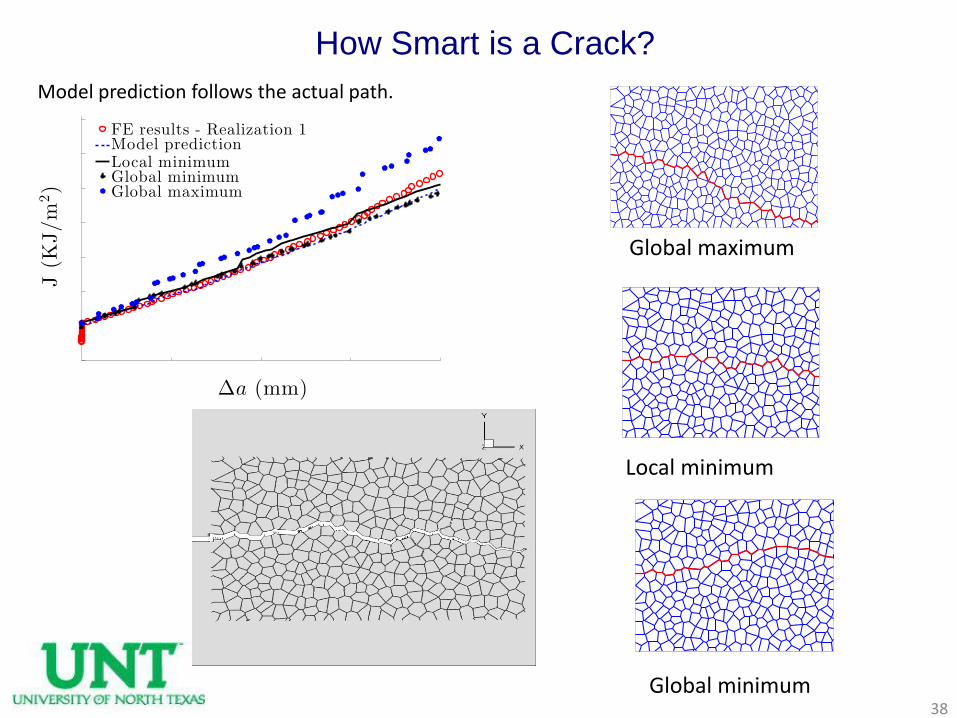
How Smart is a Crack?
Global maximum
Local minimum
Global minimum
Model prediction follows the actual path.
39
Concluding Remarks
Can simulations such as these be used to design more fracture resistant material microstructures?
Can parameters characterizing the fracture surface roughness be quantitatively related to parameters characterizing the material’s crack growth resistance?
Results so far suggest that this can be done for void-by-void dominated ductile crack growth.
Is there a parameter (or a set of parameters) that can provide a quantitative toughness/roughness relation spanning the range from void-by-void dominated crack growth through multiple void interactions to distributed damage?
Can parameters measuring the fracture surface provide a signature for identifying the mechanism of crack growth; for example identify a ductile-brittle transition?
Needs: improved and more microscale fracture theories and improved computational capability.
Recommended