주제• Anaconda• IPython• NumPy• PIL(Python Image Library) & Pillow• pandas: Python 을 위한 데이터 분석 도구• matplotlib: 차트
Anaconda데이터 분석 , 과학 컴퓨팅 등을 위한 Python 배포본https://store.continuum.io/cshop/anaconda/
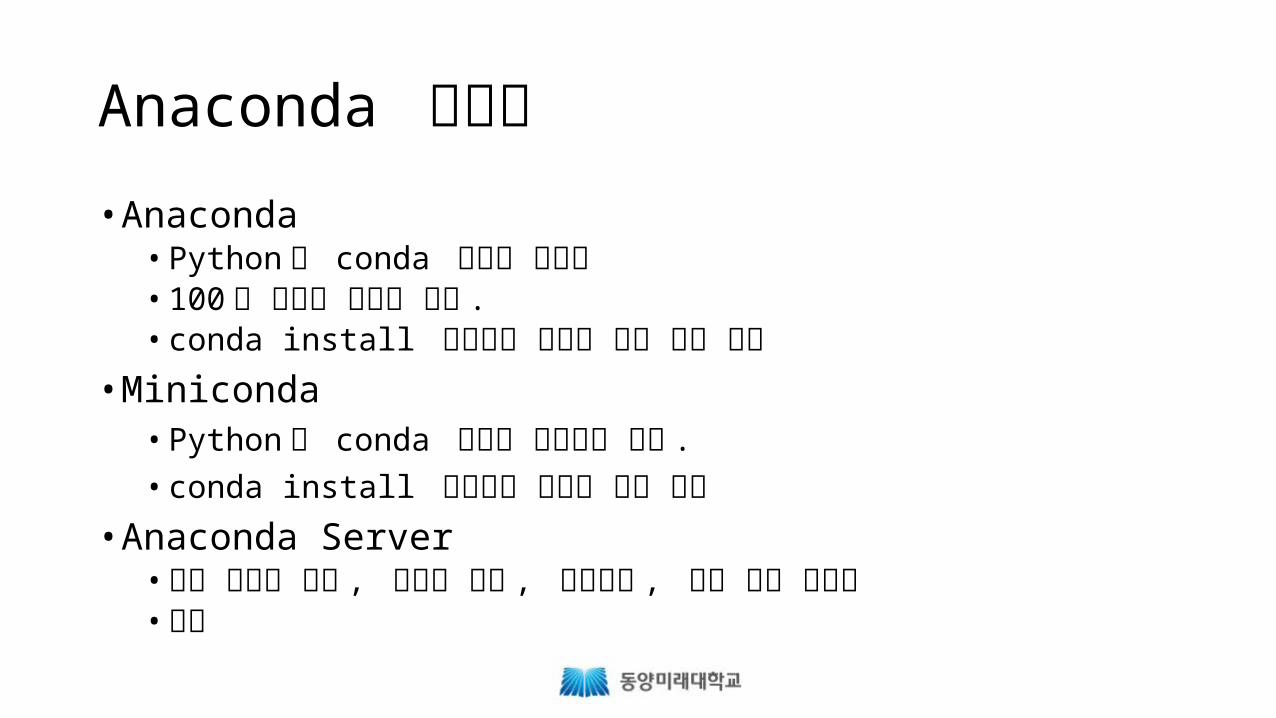
Anaconda 제품군• Anaconda• Python 과 conda 패키지 관리자• 100 개 이상의 패키지 포함 .• conda install 명령으로 패키지 추가 설치 가능
• Miniconda• Python 과 conda 패키지 관리자로 구성 .
• conda install 명령으로 패키지 설치 가능• Anaconda Server• 기업 환경의 배포 , 패키지 관리 , 라이선스 , 기술 지원 솔루션• 유료

Anaconda 에 포함된 주요 Python 패키지• beautiful-soup: HTML 과 XML 파일로부터 데이터 추출• Cython: CPython 확장 모듈을 손쉽게 생성하도록 고안된 컴파일 언어• IPython: 대화식 컴퓨팅 환경• matplotlib: 2D 플로팅 라이브러리• NLTK: 자연어 처리 플랫폼• NumPy: 과학 컴퓨팅을 위한 패키지• pandas: 데이터 분석 도구• Pillow: Python Image Library 의 fork• …
• http://docs.continuum.io/anaconda/pkg-docs.html
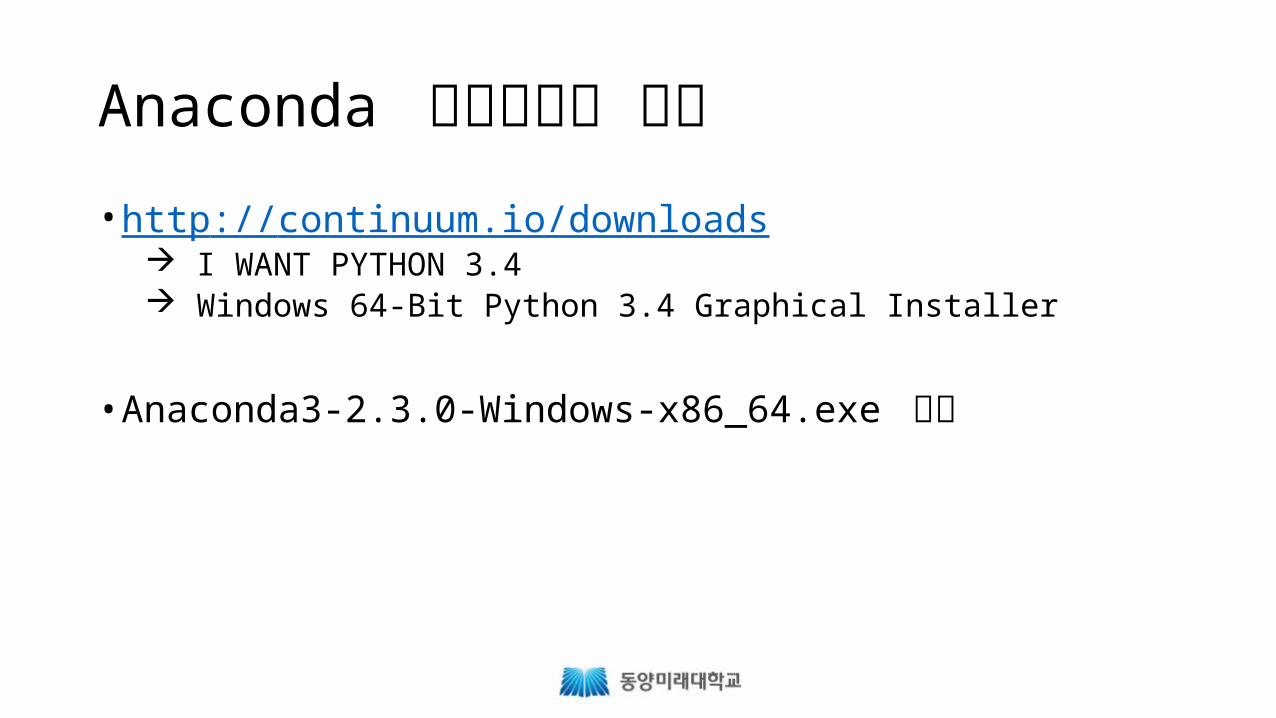
Anaconda 다운로드와 설치• http://continuum.io/downloads
I WANT PYTHON 3.4 Windows 64-Bit Python 3.4 Graphical Installer
• Anaconda3-2.3.0-Windows-x86_64.exe 실행

conda – conda 관리
• conda 버전 확인> conda --version
• conda 업데이트> conda update conda
http://conda.pydata.org/docs/test-drive.html
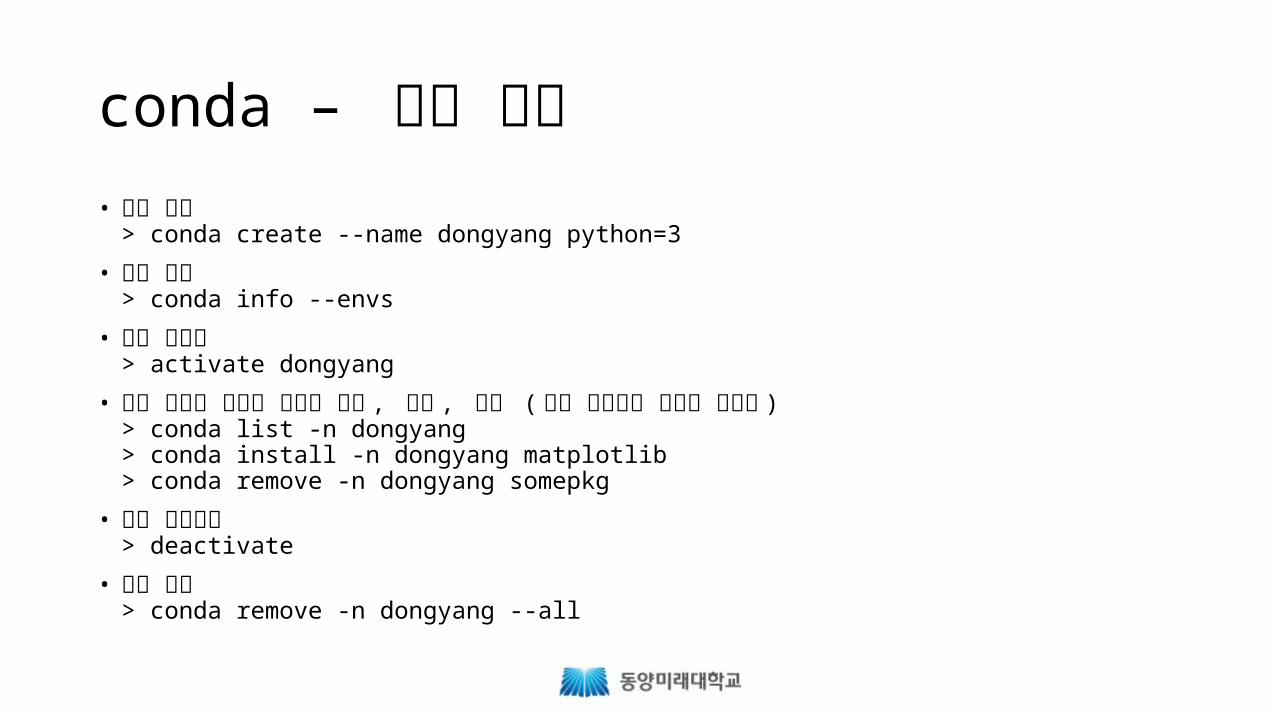
conda – 환경 관리• 환경 생성
> conda create --name dongyang python=3
• 환경 확인> conda info --envs
• 환경 활성화> activate dongyang
• 특정 환경에 대하여 패키지 확인 , 설치 , 삭제 ( 현재 활성화된 환경이 디폴트 )> conda list -n dongyang > conda install -n dongyang matplotlib> conda remove -n dongyang somepkg
• 환경 비활성화> deactivate
• 환경 삭제> conda remove -n dongyang --all

conda – Python 실행
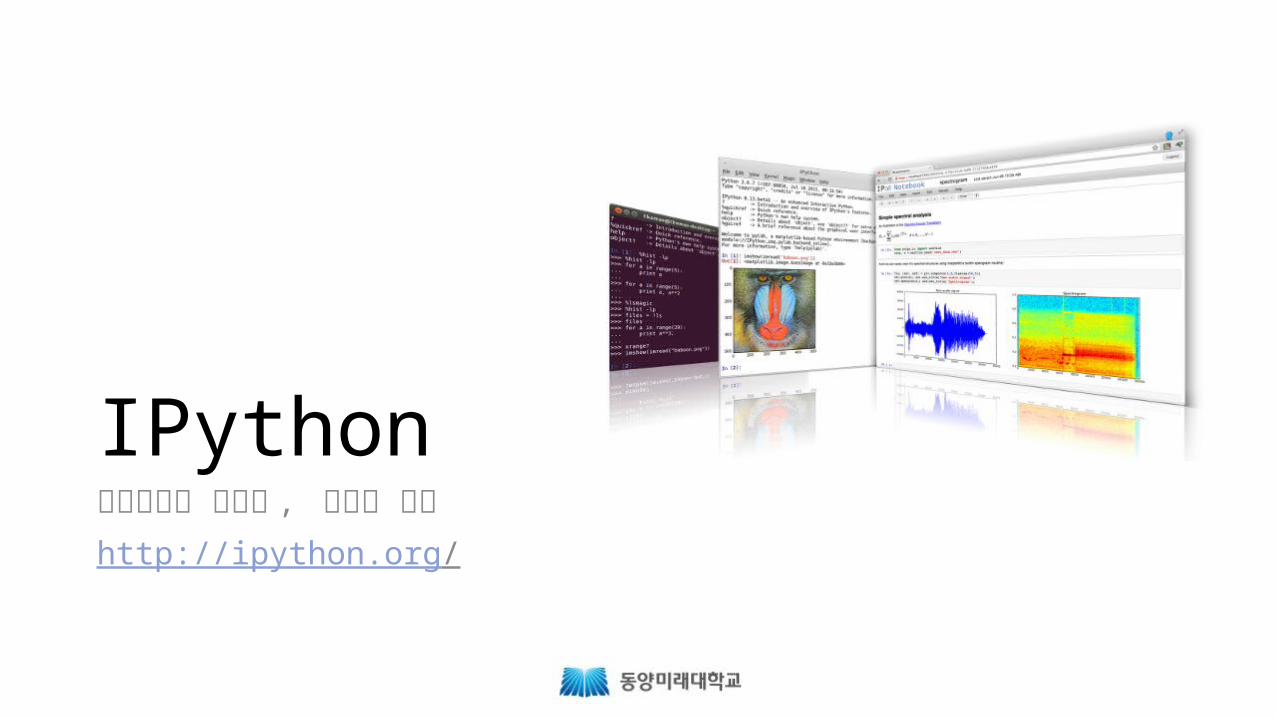
IPython
Python 을 대화식으로 사용함에 있어 편리한 기능을 제공• 강력한 Python Shell• 웹 기반의 대화식 notebook• 데이터 시각화 지원• 인터프리터를 프로젝트에 임베드할 수 있음• 고성능의 라이브러리
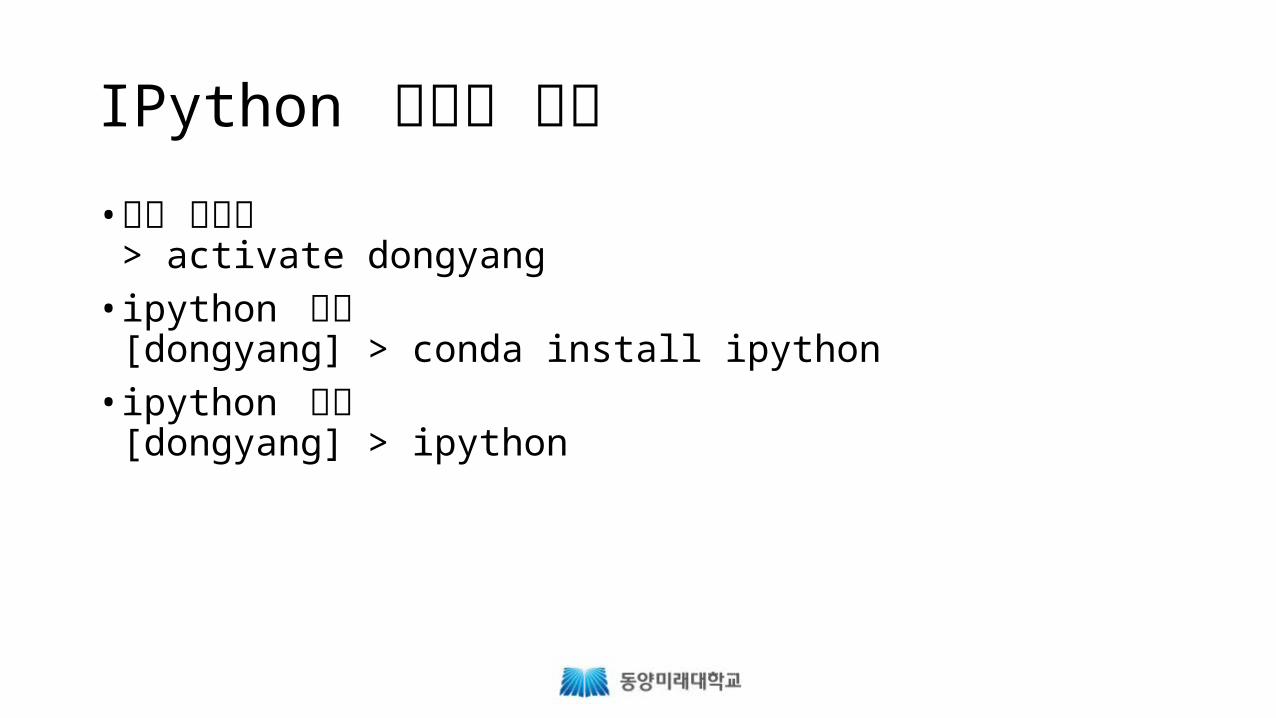
IPython 설치와 실행• 환경 활성화
> activate dongyang• ipython 설치
[dongyang] > conda install ipython• ipython 실행
[dongyang] > ipython
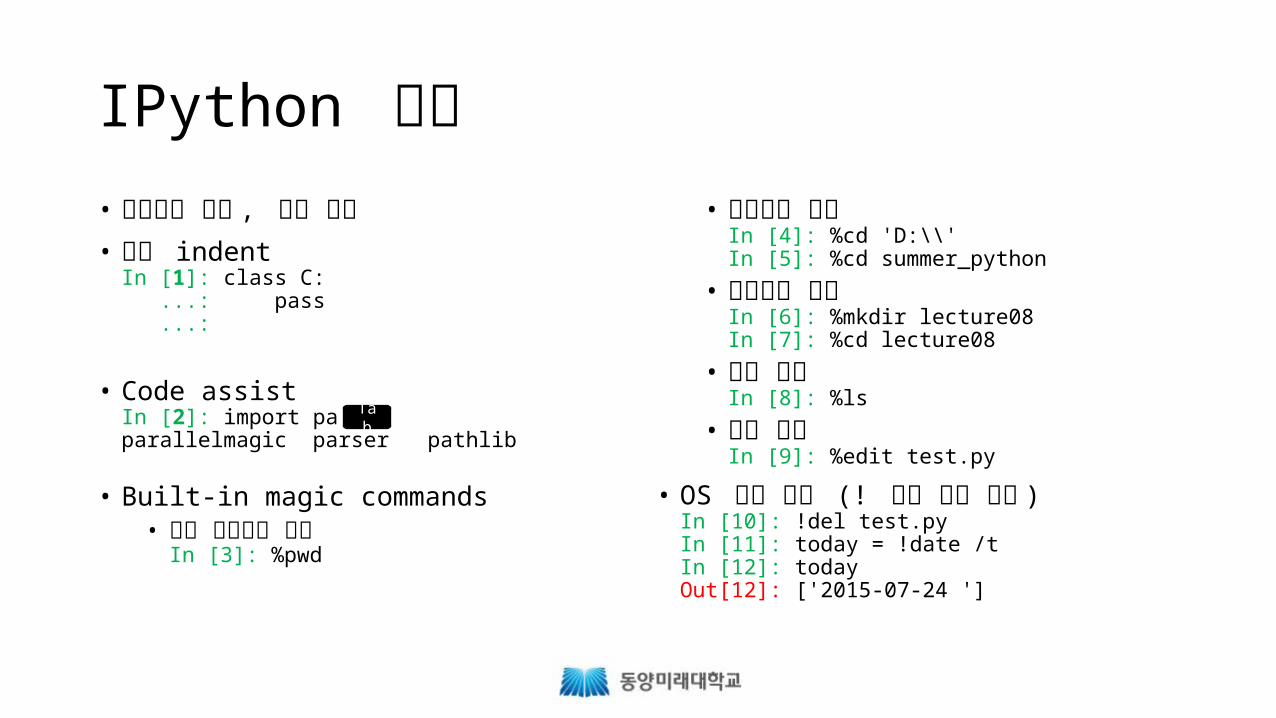
IPython 기능• 프롬프트 번호 , 색상 표시• 자동 indent
In [1]: class C: ...: pass ...:
• Code assistIn [2]: import paparallelmagic parser pathlib
• Built-in magic commands• 현재 디렉터리 확인
In [3]: %pwd
• 디렉터리 이동In [4]: %cd 'D:\\'In [5]: %cd summer_python
• 디렉터리 생성In [6]: %mkdir lecture08In [7]: %cd lecture08
• 파일 목록In [8]: %ls
• 파일 편집In [9]: %edit test.py
• OS 명령 실행 (! 뒤에 명령 입력 )In [10]: !del test.pyIn [11]: today = !date /tIn [12]: todayOut[12]: ['2015-07-24 ']
Tab
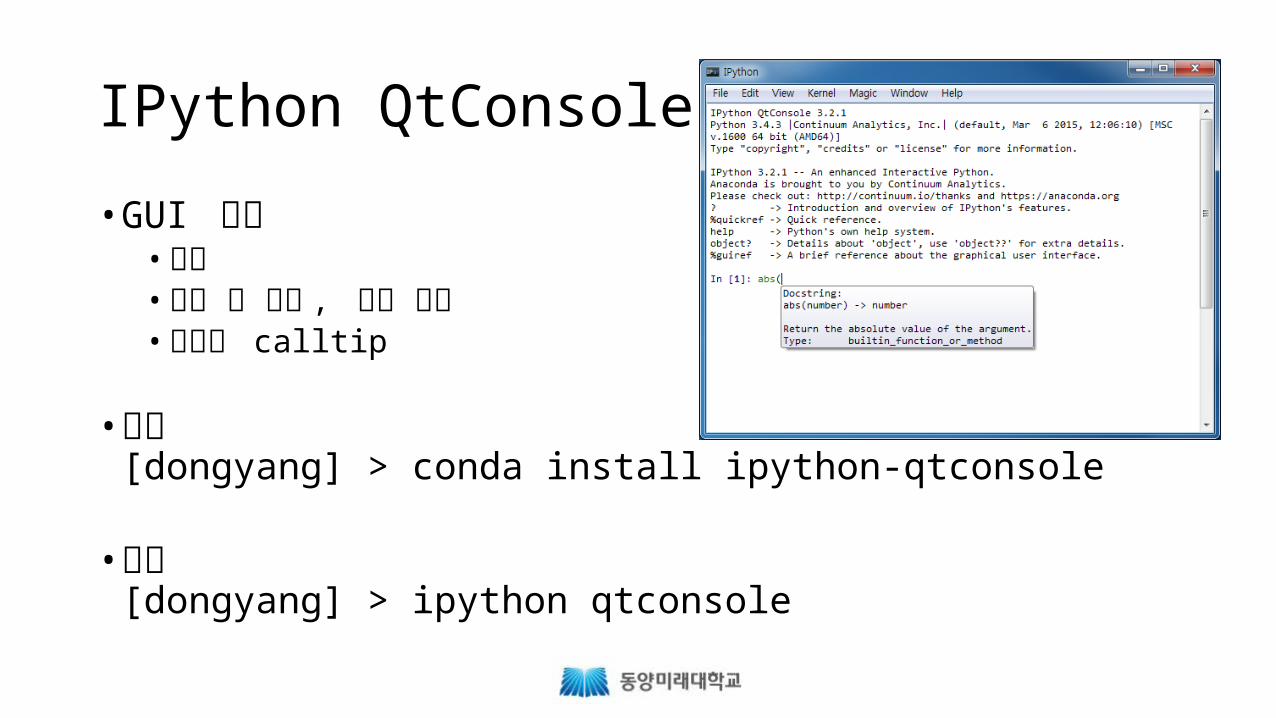
IPython QtConsole
• GUI 콘솔• 그림• 여러 줄 편집 , 구문 강조• 그래픽 calltip
• 설치[dongyang] > conda install ipython-qtconsole
• 실행[dongyang] > ipython qtconsole
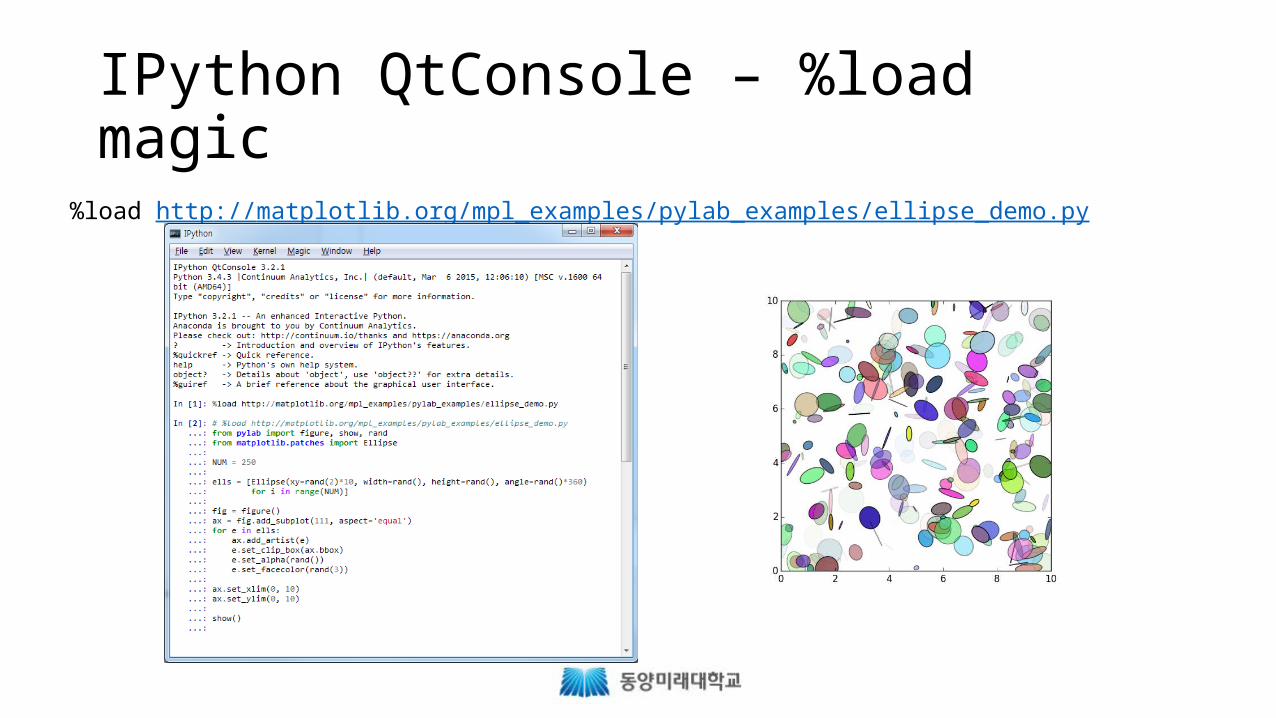
IPython QtConsole – %load magic
%load http://matplotlib.org/mpl_examples/pylab_examples/ellipse_demo.py

IPython Notebook
• 웹 브라우저에서 사용하는대화식 컴퓨팅 환경• Python 코드 실행 , HTML 문서 , 수식 , 도표를
한 화면에서 사용• 입력과 출력을 저장할 수 있어 , 인터프리터의
사용 내역을 쉽게 재연할 수 있음• 설치[dongyang] > conda install ipython-notebook
• 실행[dongyang] > ipython notebook

NumPyNumerical Python
NumPy
• 다차원의 숫자 배열을 Python 에서 효율적으로 처리하기 위한 모듈• ndarray (n-dimensional array) 자료구조를 사용• 참고 자료
• http://www.numpy.org/• http://kestrel.nmt.edu/~raymond/software/python_notes/paper003.html• 엘리 브레설트 저 , 이성주 역 ,
< 데이터 / 수치 분석을 위한 파이썬 라이브러리 SciPy 와 NumPy>
NumPy – array
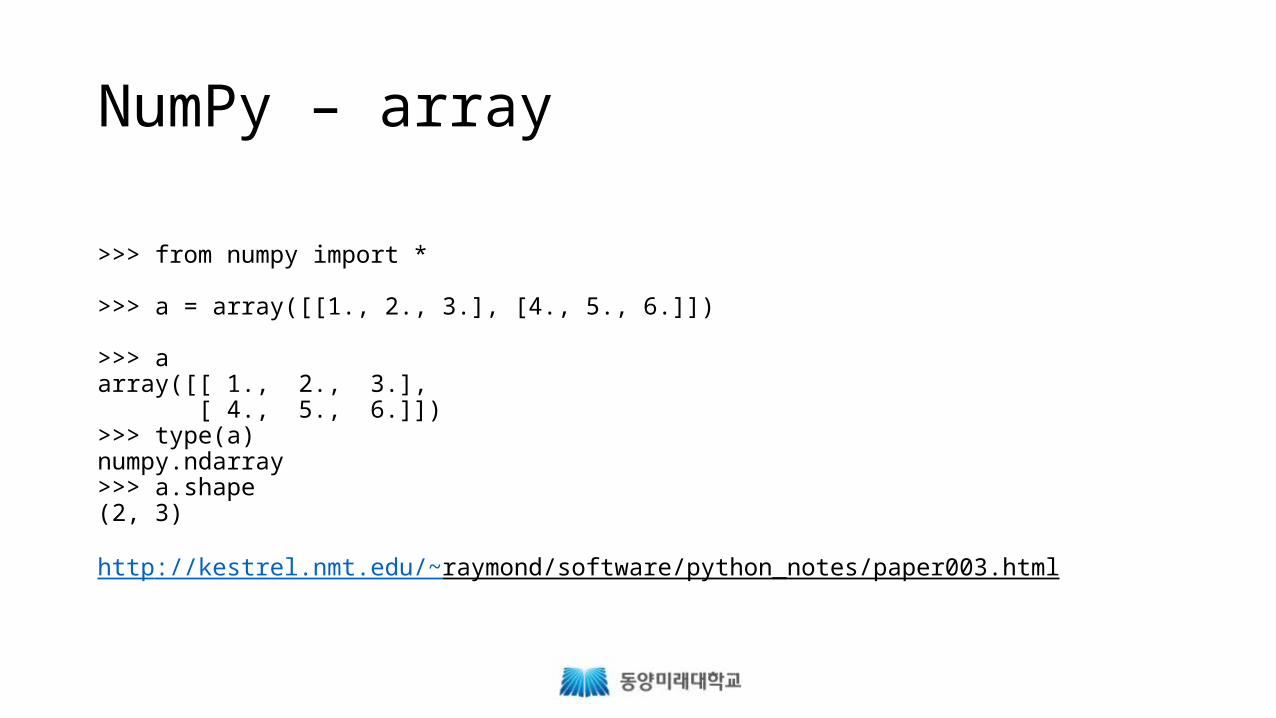
>>> from numpy import *
>>> a = array([[1., 2., 3.], [4., 5., 6.]])
>>> aarray([[ 1., 2., 3.], [ 4., 5., 6.]])>>> type(a)numpy.ndarray>>> a.shape(2, 3)
http://kestrel.nmt.edu/~raymond/software/python_notes/paper003.html

NumPy – arange, linspace
arange>>> b = arange(0, 11)
>>> b
array([ 0, 1, 2, 3, 4, 5, 6, 7, 8, 9, 10])
>>> c = arange(0., 2., 0.4)
>>> c
array([ 0. , 0.4, 0.8, 1.2, 1.6])
linspace>>> d = linspace(0., 3.5, 8)
>>> d
array([ 0. , 0.5, 1. , 1.5, 2. , 2.5, 3. , 3.5])
NumPy – zeros, ones
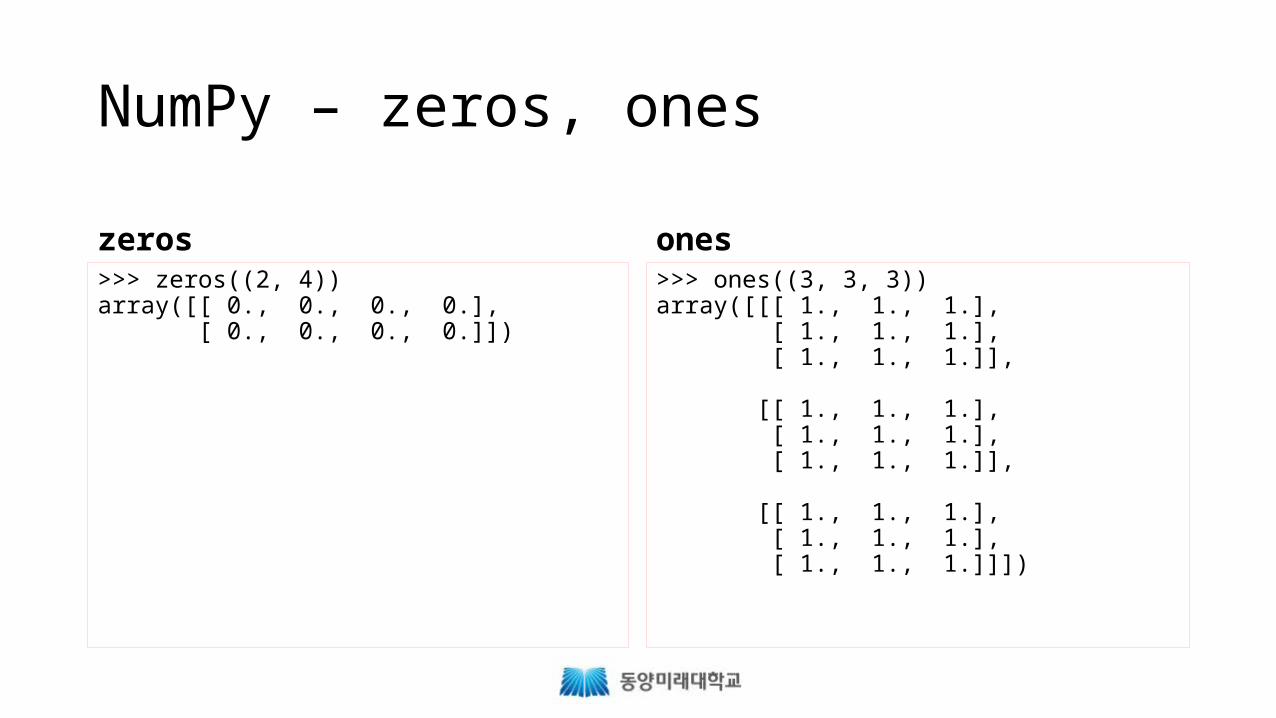
zeros>>> zeros((2, 4))array([[ 0., 0., 0., 0.], [ 0., 0., 0., 0.]])
ones>>> ones((3, 3, 3))array([[[ 1., 1., 1.], [ 1., 1., 1.], [ 1., 1., 1.]],
[[ 1., 1., 1.], [ 1., 1., 1.], [ 1., 1., 1.]],
[[ 1., 1., 1.], [ 1., 1., 1.], [ 1., 1., 1.]]])
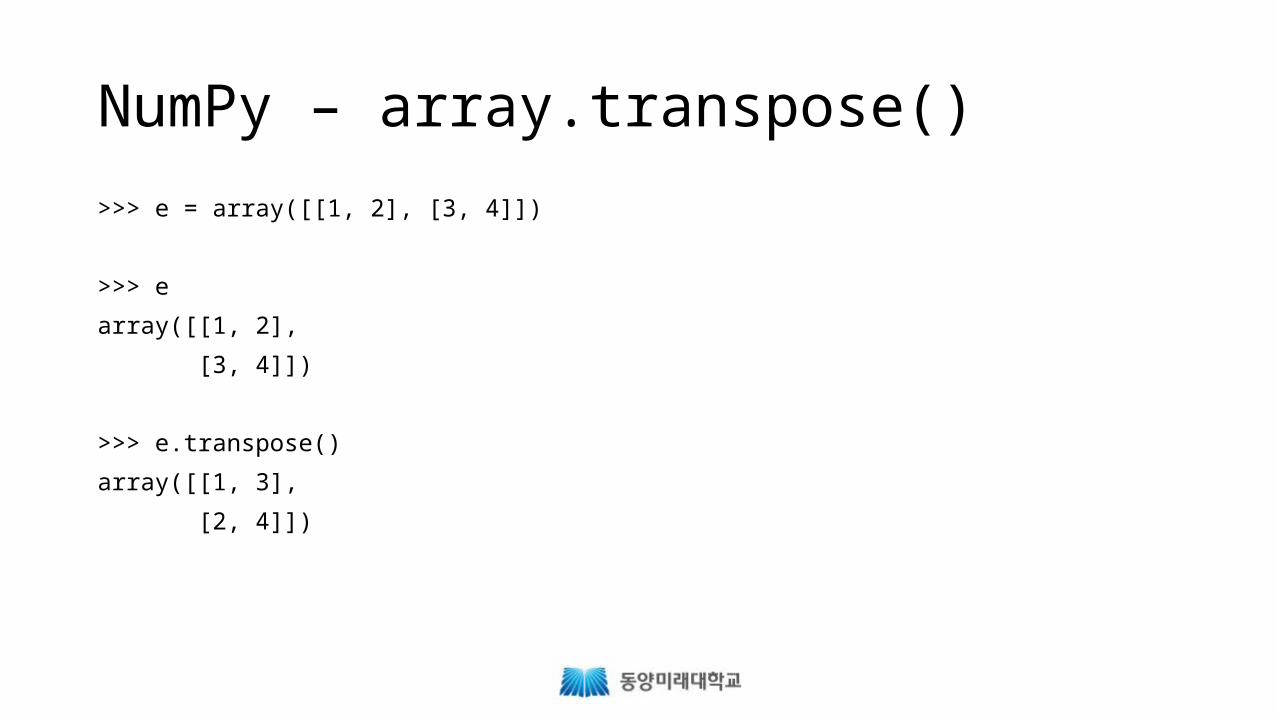
NumPy – array.transpose()
>>> e = array([[1, 2], [3, 4]])
>>> e
array([[1, 2],
[3, 4]])
>>> e.transpose()
array([[1, 3],
[2, 4]])
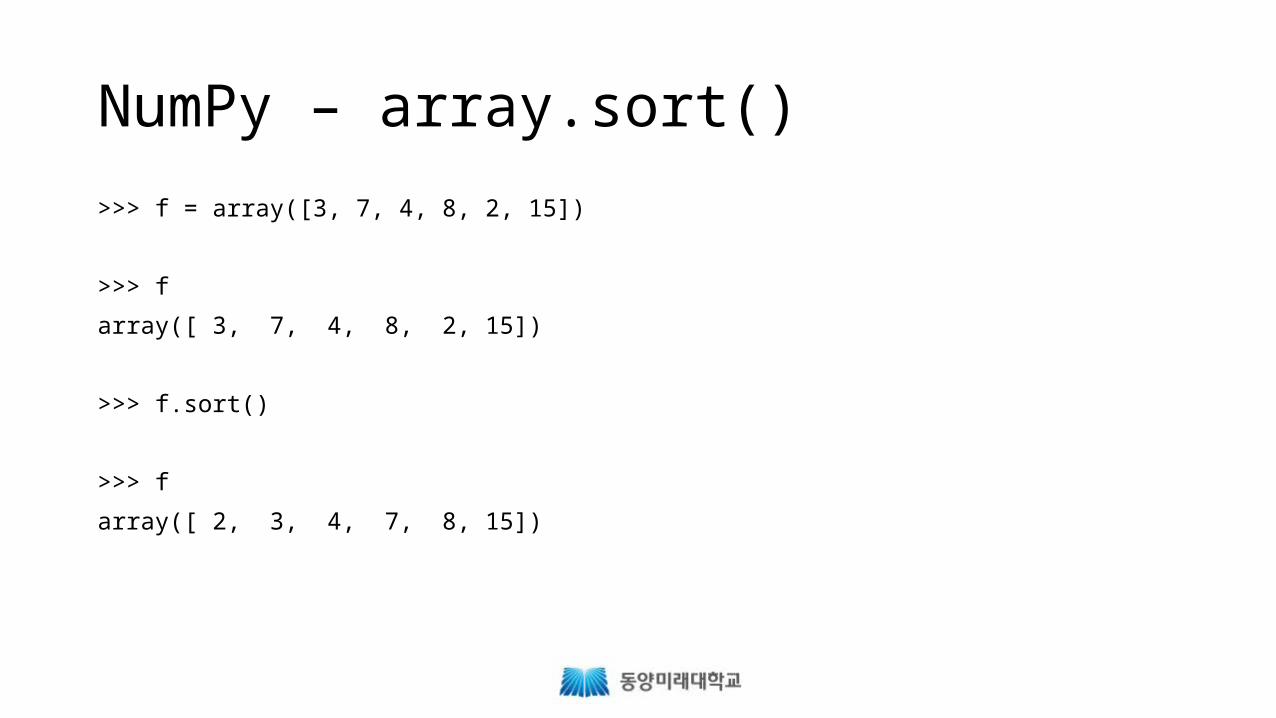
NumPy – array.sort()
>>> f = array([3, 7, 4, 8, 2, 15])
>>> f
array([ 3, 7, 4, 8, 2, 15])
>>> f.sort()
>>> f
array([ 2, 3, 4, 7, 8, 15])
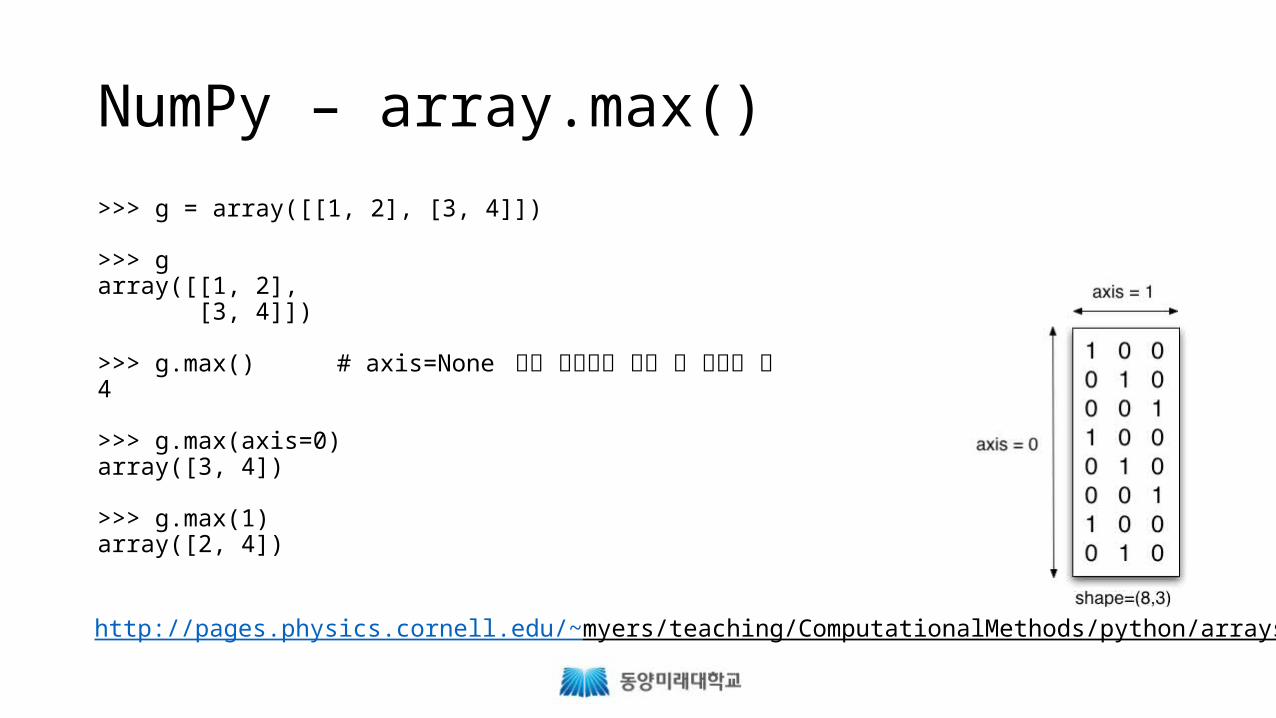
NumPy – array.max()
>>> g = array([[1, 2], [3, 4]])
>>> garray([[1, 2], [3, 4]])
>>> g.max() # axis=None 배열 전체에서 가장 큰 스칼라 값4
>>> g.max(axis=0)array([3, 4])
>>> g.max(1)array([2, 4])
http://pages.physics.cornell.edu/~myers/teaching/ComputationalMethods/python/arrays.html

PIL & PillowPython Image Library

PIL & Pillow
• PIL(Python Image Library)
• Pillow: PIL 의 fork
• 이미지의 썸네일을 만들고 , 형식을 변환하고 , 크기를 바꾸는 등의 일들을 자동으로 처리하는 스크립트를 작성할 수 있음• 설치
[dongyang] > conda search pil[dongyang] > conda install pillow
• 참고 자료• http://effbot.org/imagingbook/ • http://pillow.readthedocs.org/ • < 예제 중심의 Python 3> 159 ~ 179 페이지
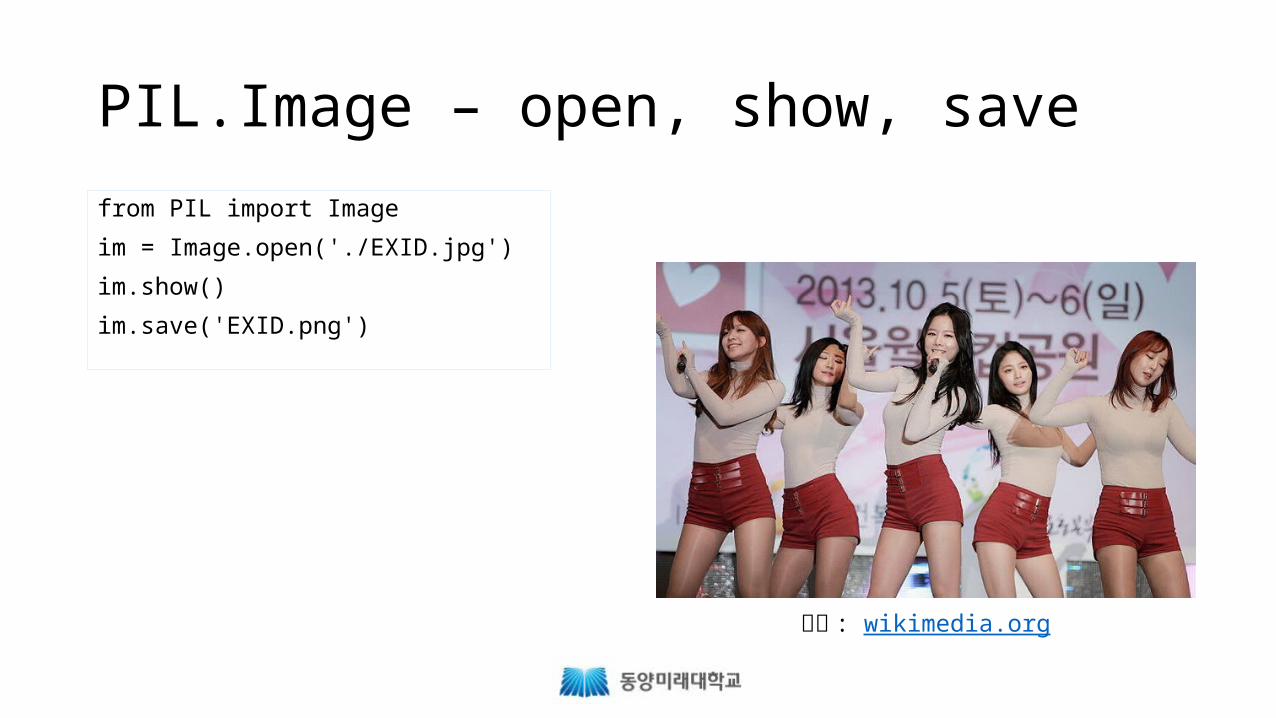
PIL.Image – open, show, save
from PIL import Image
im = Image.open('./EXID.jpg')
im.show()
im.save('EXID.png')
사진 : wikimedia.org
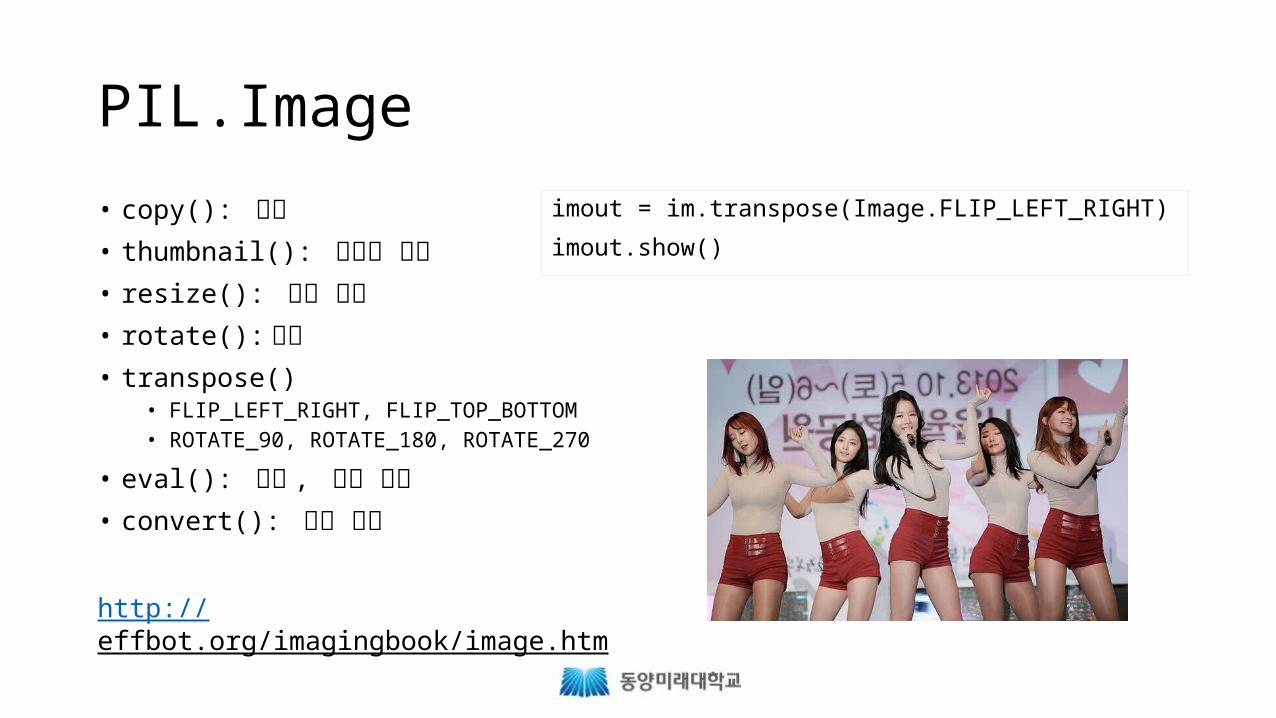
PIL.Image
• copy(): 복사• thumbnail(): 썸네일 생성• resize(): 크기 변경• rotate(): 회전• transpose()
• FLIP_LEFT_RIGHT, FLIP_TOP_BOTTOM• ROTATE_90, ROTATE_180, ROTATE_270
• eval(): 밝기 , 색상 조정• convert(): 모드 변경
http://effbot.org/imagingbook/image.htm
imout = im.transpose(Image.FLIP_LEFT_RIGHT)
imout.show()
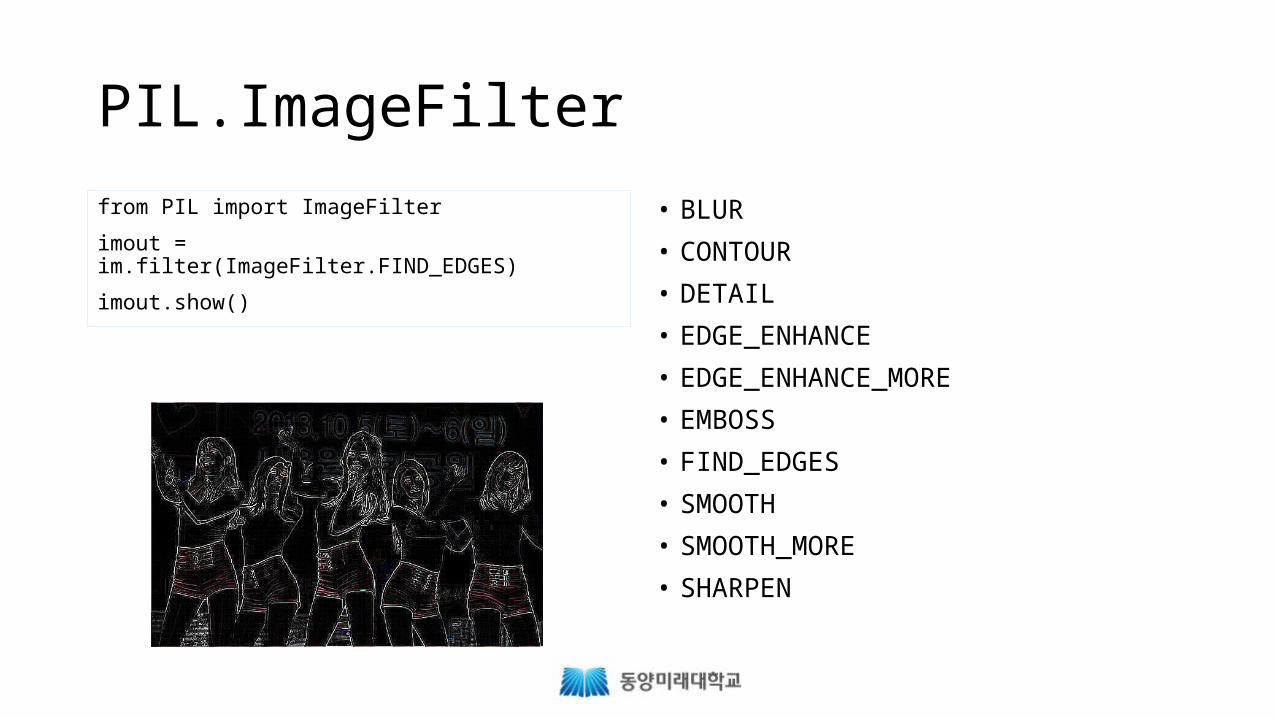
PIL.ImageFilter
from PIL import ImageFilter
imout = im.filter(ImageFilter.FIND_EDGES)
imout.show()
• BLUR
• CONTOUR
• DETAIL
• EDGE_ENHANCE
• EDGE_ENHANCE_MORE
• EMBOSS
• FIND_EDGES
• SMOOTH
• SMOOTH_MORE
• SHARPEN

PIL.ImageDraw
In [1]: from PIL import Image, ImageDraw
In [2]: SIZE = 256
In [3]: im = Image.new("L", (SIZE, SIZE))
In [4]: d = ImageDraw.Draw(im)
In [5]: for x in range(SIZE): ...: for y in range(SIZE): ...: d.point((x,y), 0) ...:
In [6]: im.show()

PIL.ImageDraw
In [7]: for x in range(SIZE):
for y in range(SIZE):
d.point((x,y), x)
....:
In [8]: im.show()
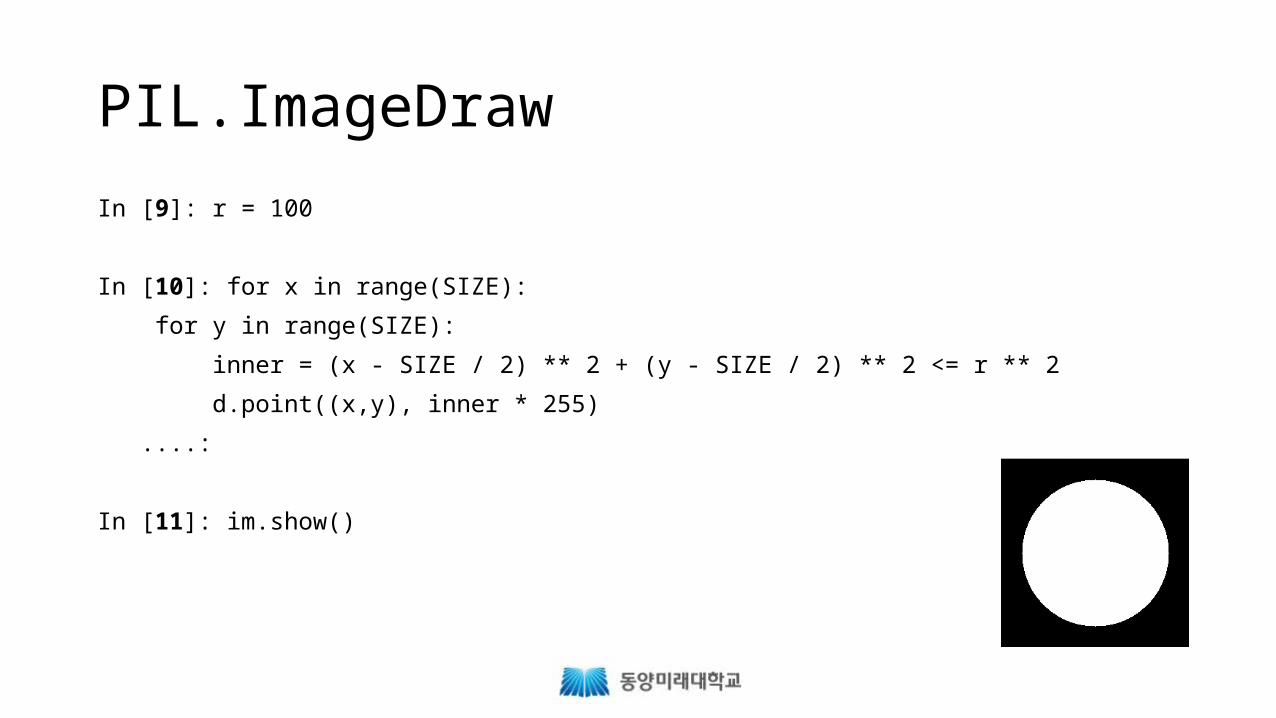
PIL.ImageDraw
In [9]: r = 100
In [10]: for x in range(SIZE):
for y in range(SIZE):
inner = (x - SIZE / 2) ** 2 + (y - SIZE / 2) ** 2 <= r ** 2
d.point((x,y), inner * 255)
....:
In [11]: im.show()
pandasPython 을 위한 데이터 분석 도구http://pandas.pydata.org/
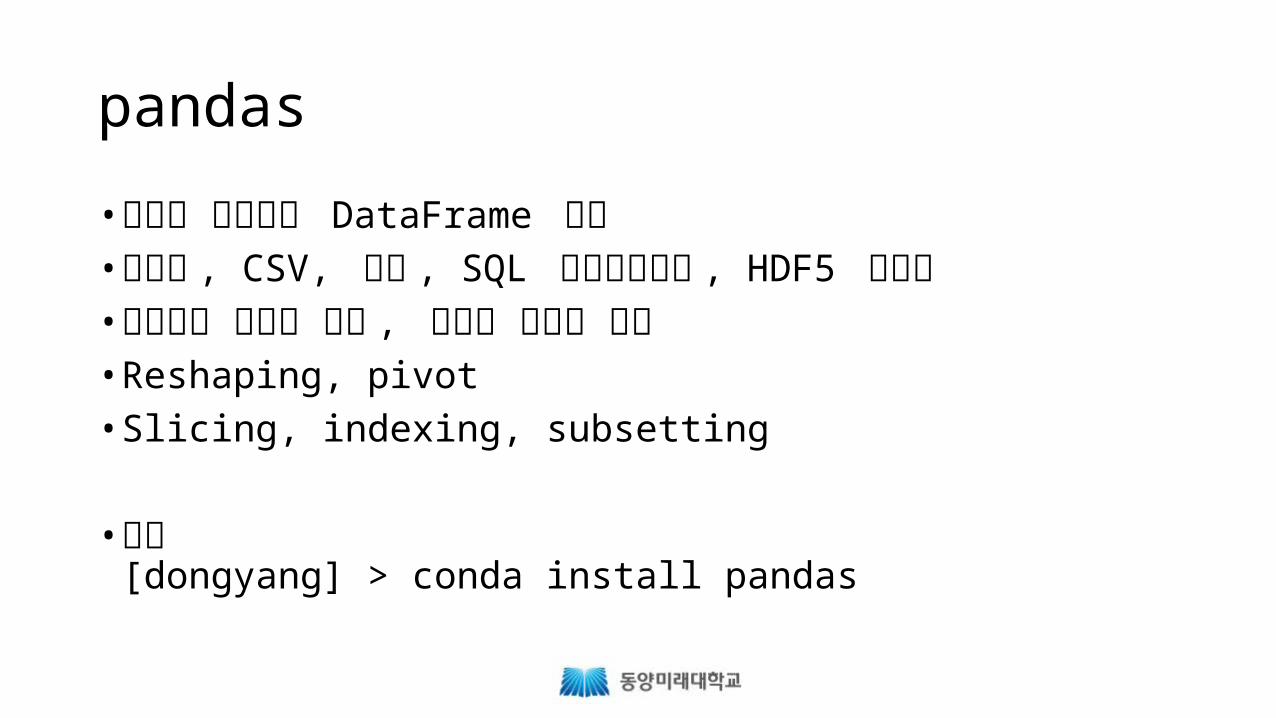
pandas
• 빠르고 효율적인 DataFrame 개체• 텍스트 , CSV, 엑셀 , SQL 데이터베이스 , HDF5 입출력• 지능적인 데이터 정렬 , 누락된 데이터 처리• Reshaping, pivot• Slicing, indexing, subsetting
• 설치[dongyang] > conda install pandas
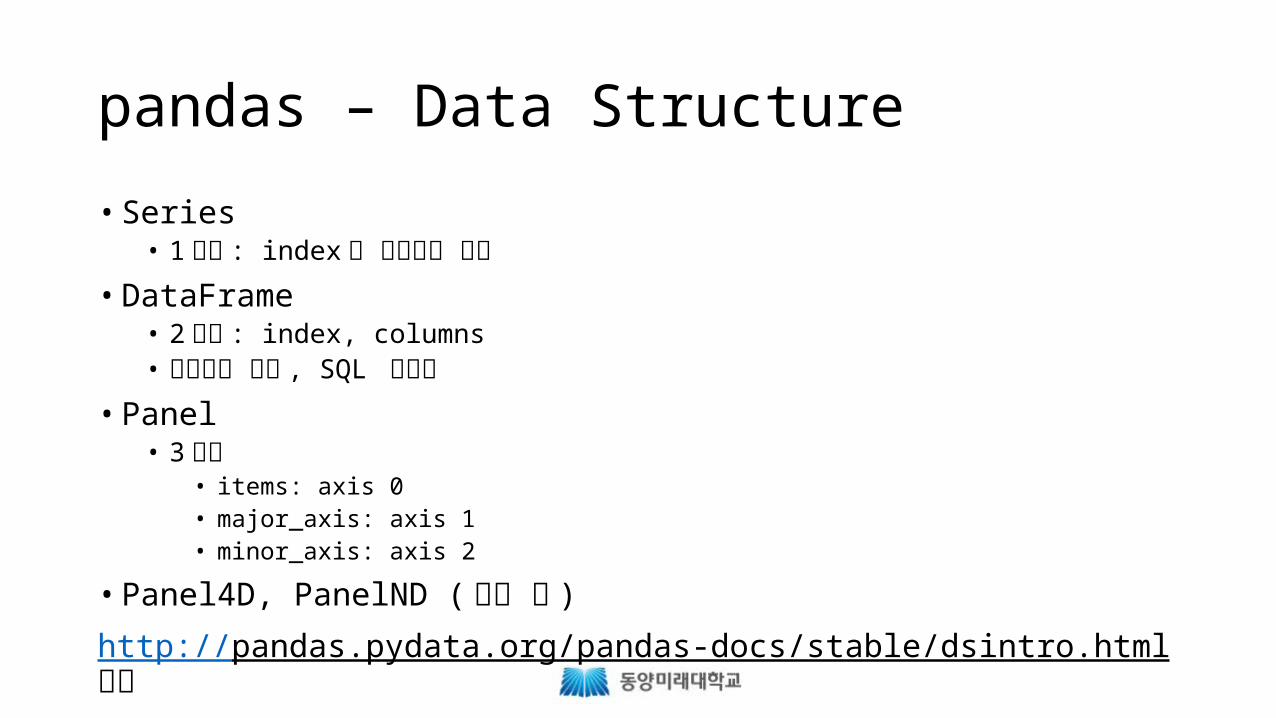
pandas – Data Structure
• Series• 1 차원 : index 를 사용하여 참조
• DataFrame• 2 차원 : index, columns• 스프레드 시트 , SQL 테이블
• Panel• 3 차원
• items: axis 0• major_axis: axis 1• minor_axis: axis 2
• Panel4D, PanelND ( 실험 중 )
http://pandas.pydata.org/pandas-docs/stable/dsintro.html 참조
pandas – Series
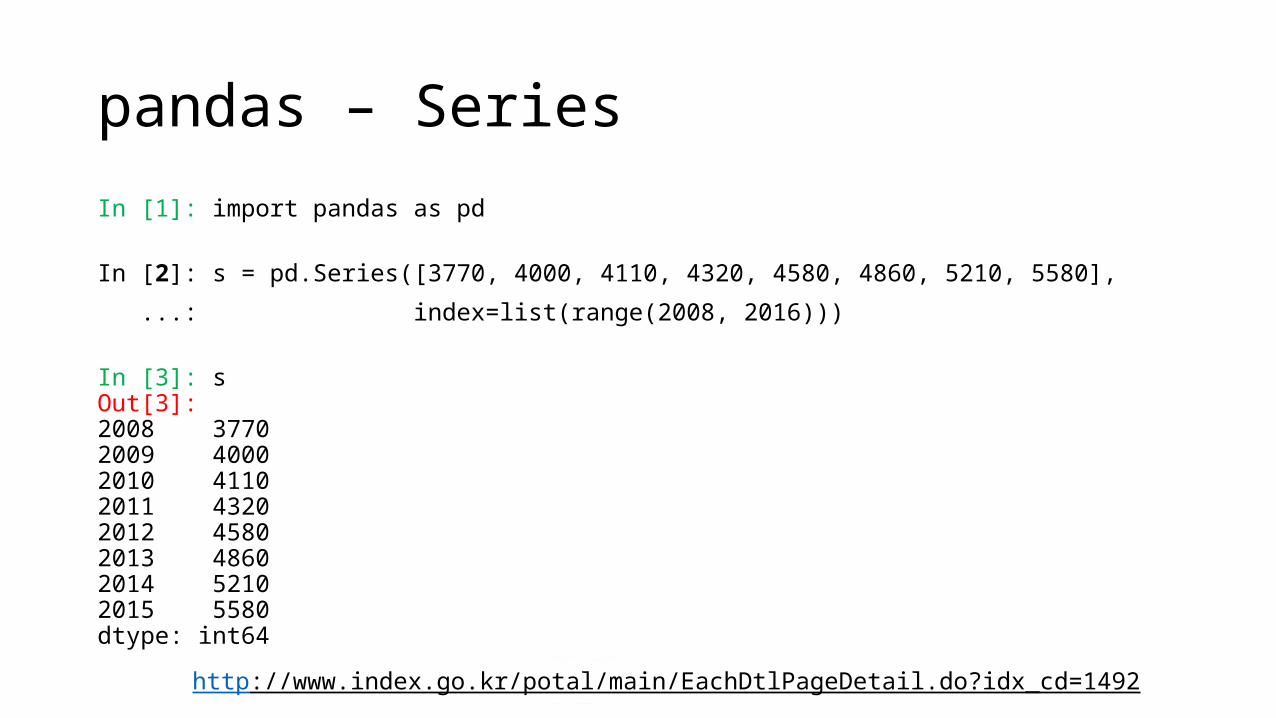
In [1]: import pandas as pd
In [2]: s = pd.Series([3770, 4000, 4110, 4320, 4580, 4860, 5210, 5580],
...: index=list(range(2008, 2016)))
In [3]: sOut[3]:2008 37702009 40002010 41102011 43202012 45802013 48602014 52102015 5580dtype: int64
http://www.index.go.kr/potal/main/EachDtlPageDetail.do?idx_cd=1492
pandas – Series
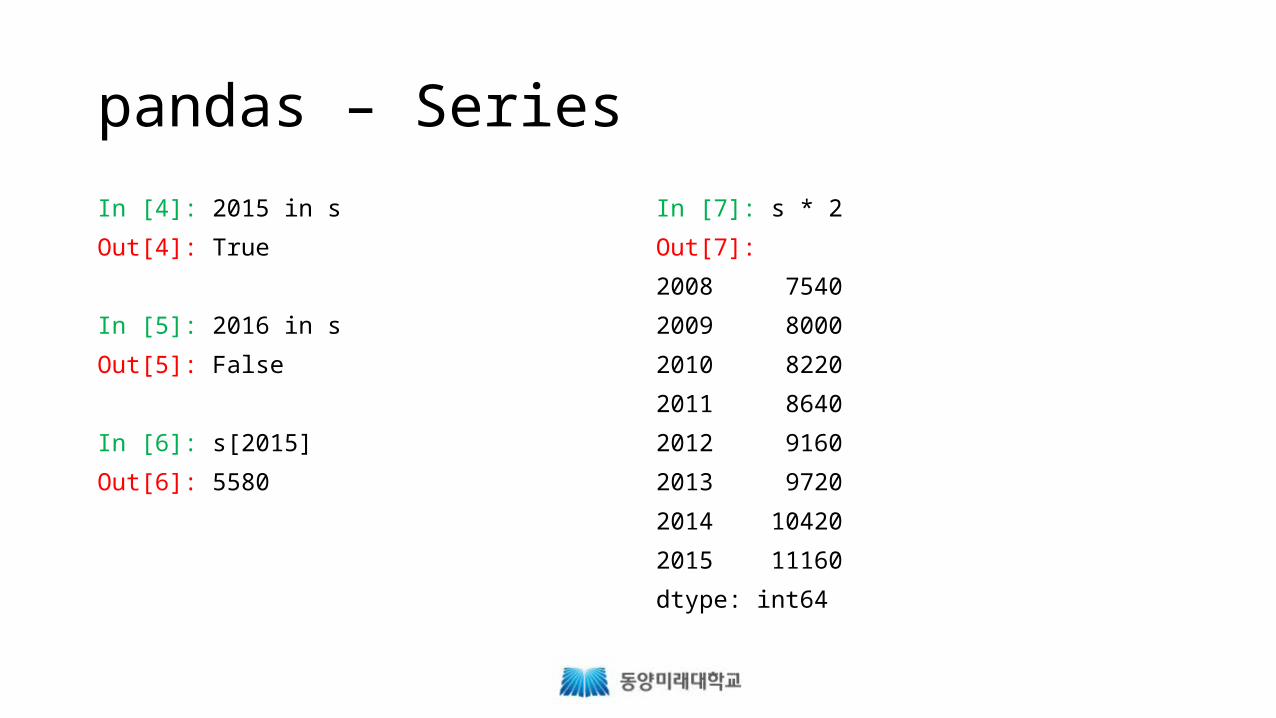
In [4]: 2015 in s
Out[4]: True
In [5]: 2016 in s
Out[5]: False
In [6]: s[2015]
Out[6]: 5580
In [7]: s * 2
Out[7]:
2008 7540
2009 8000
2010 8220
2011 8640
2012 9160
2013 9720
2014 10420
2015 11160
dtype: int64
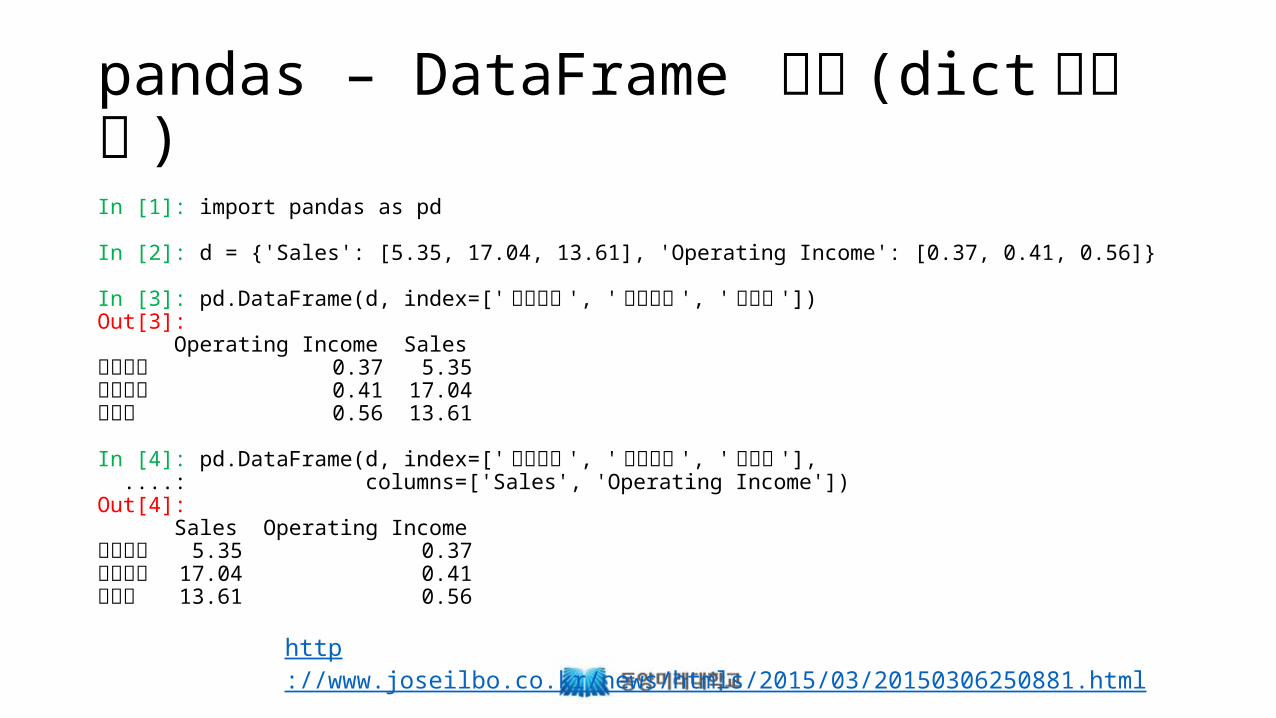
pandas – DataFrame 생성 (dict 로부터 )In [1]: import pandas as pd
In [2]: d = {'Sales': [5.35, 17.04, 13.61], 'Operating Income': [0.37, 0.41, 0.56]}
In [3]: pd.DataFrame(d, index=[' 롯데리아 ', ' 맥도날드 ', ' 버거킹 '])Out[3]: Operating Income Sales롯데리아 0.37 5.35맥도날드 0.41 17.04버거킹 0.56 13.61
In [4]: pd.DataFrame(d, index=[' 롯데리아 ', ' 맥도날드 ', ' 버거킹 '], ....: columns=['Sales', 'Operating Income'])Out[4]: Sales Operating Income롯데리아 5.35 0.37맥도날드 17.04 0.41버거킹 13.61 0.56
http://www.joseilbo.co.kr/news/htmls/2015/03/20150306250881.html
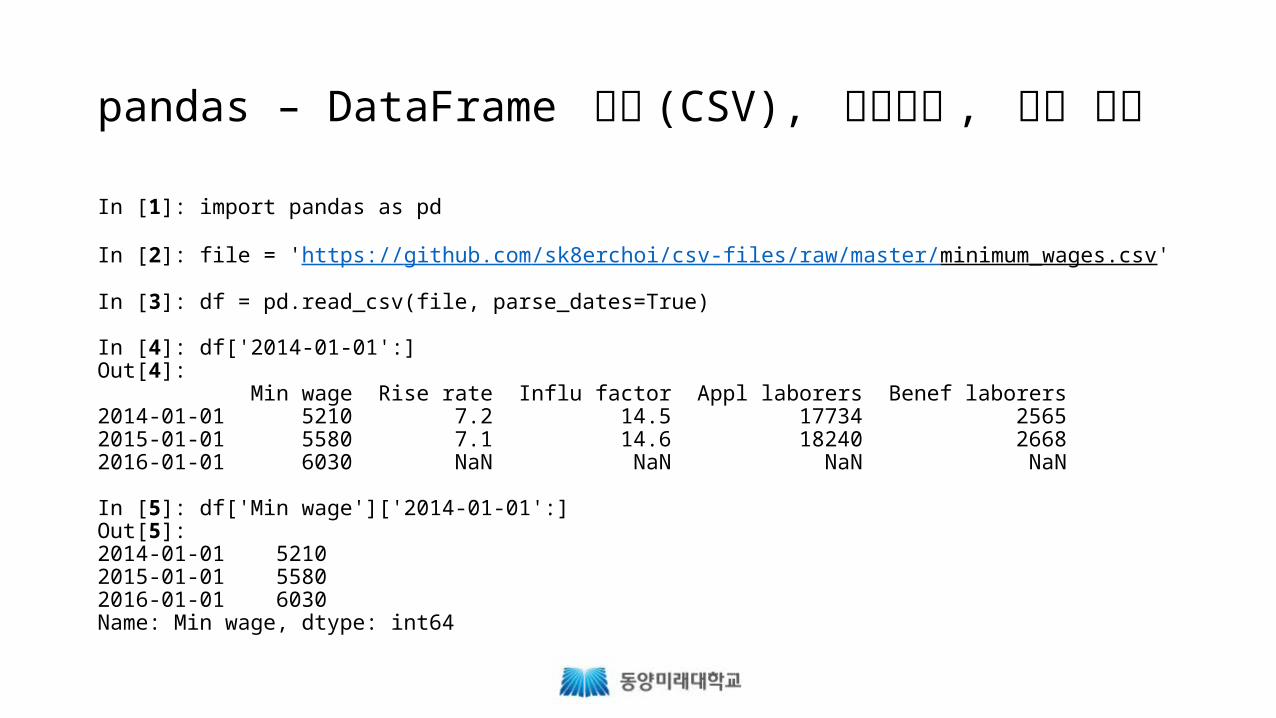
pandas – DataFrame 생성 (CSV), 슬라이싱 , 컬럼 선택
In [1]: import pandas as pd
In [2]: file = 'https://github.com/sk8erchoi/csv-files/raw/master/minimum_wages.csv'
In [3]: df = pd.read_csv(file, parse_dates=True)
In [4]: df['2014-01-01':]Out[4]: Min wage Rise rate Influ factor Appl laborers Benef laborers2014-01-01 5210 7.2 14.5 17734 25652015-01-01 5580 7.1 14.6 18240 26682016-01-01 6030 NaN NaN NaN NaN
In [5]: df['Min wage']['2014-01-01':]Out[5]: 2014-01-01 52102015-01-01 55802016-01-01 6030Name: Min wage, dtype: int64

pandas – plot
In [6]: df['Min wage']['2010-01-01':].plot()
Out[6]: <matplotlib.axes._subplots.AxesSubplot at 0x108705208>
In [7]: import matplotlib.pyplot as plt
In [8]: plt.show()
최저임금 http://www.index.go.kr/potal/main/EachDtlPageDetail.do?idx_cd=1492

pandas – 복수의 컬럼 선택 , 정렬In [1]: import pandas as pd
In [2]: file = "https://raw.githubusercontent.com/sk8erchoi/csv-files/master/college_reg_fee_2015.csv"
In [3]: df = pd.read_csv(file)
In [4]: df[['Name', 'Avg']][:3]Out[4]: Name Avg0 ICT 폴리텍대학 22001 가톨릭상지대학교 55042 강동대학교 5725
In [5]: df[['Name', 'Avg']].sort(['Avg'], ascending=False).head(3)Out[5]: Name Avg72 서울예술대학교 810118 계원예술대학교 756461 백제예술대학교 7486 • 2015 년 전문대학 등록금 현황 http://khei-khei.tistory.com/1430
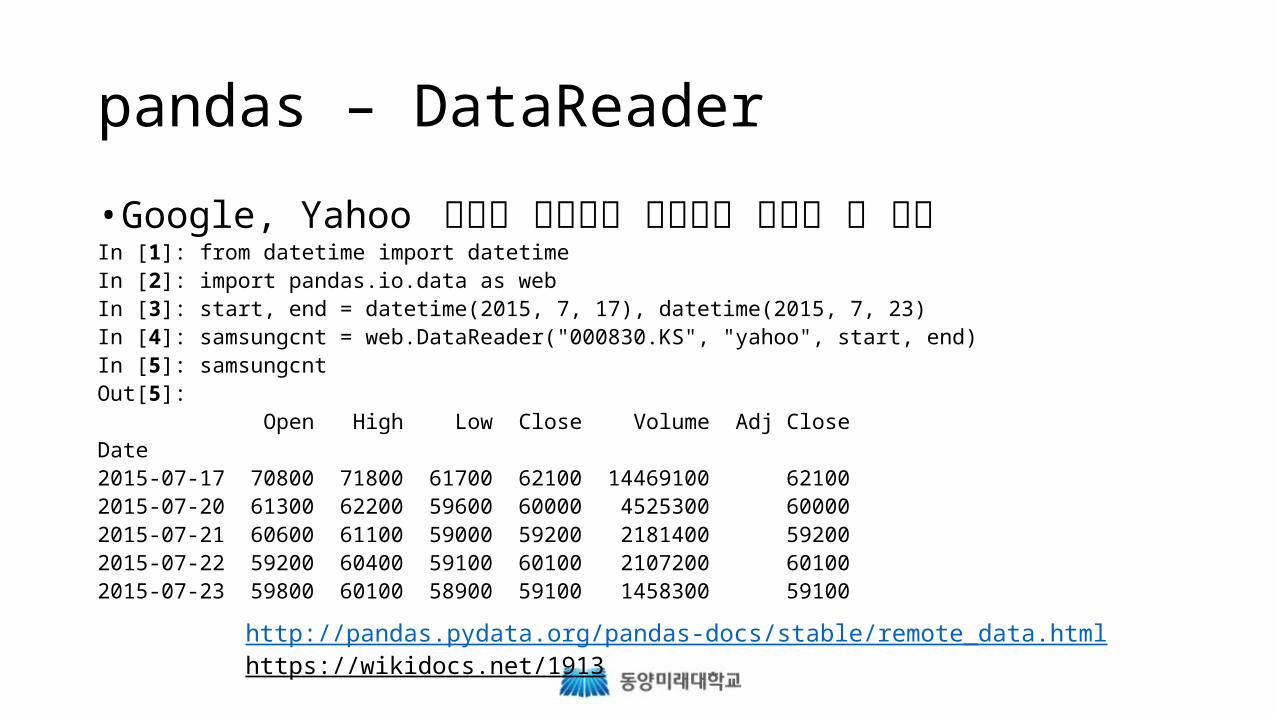
pandas – DataReader
• Google, Yahoo 등에서 제공하는 데이터를 받아올 수 있음In [1]: from datetime import datetimeIn [2]: import pandas.io.data as webIn [3]: start, end = datetime(2015, 7, 17), datetime(2015, 7, 23)In [4]: samsungcnt = web.DataReader("000830.KS", "yahoo", start, end)In [5]: samsungcntOut[5]: Open High Low Close Volume Adj CloseDate 2015-07-17 70800 71800 61700 62100 14469100 621002015-07-20 61300 62200 59600 60000 4525300 600002015-07-21 60600 61100 59000 59200 2181400 592002015-07-22 59200 60400 59100 60100 2107200 601002015-07-23 59800 60100 58900 59100 1458300 59100
http://pandas.pydata.org/pandas-docs/stable/remote_data.htmlhttps://wikidocs.net/1913
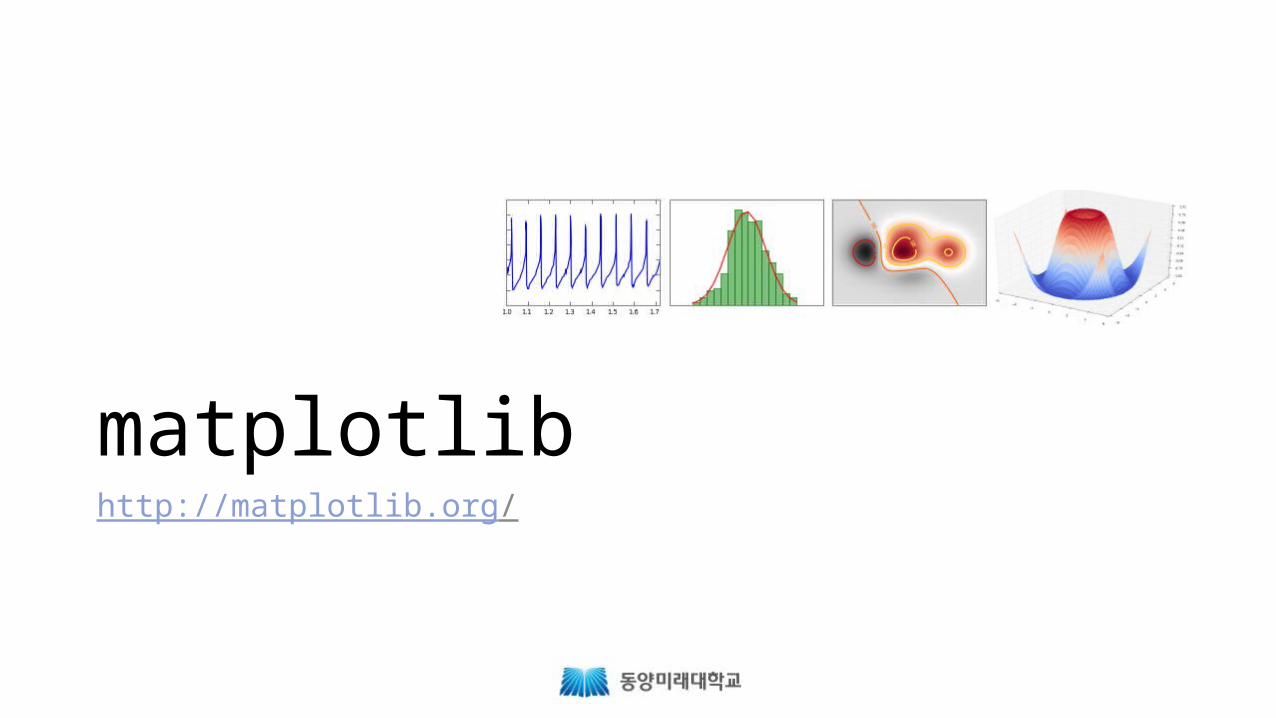
matplotlib
• 2D, 3D 플로팅 라이브러리• LaTeX 형식의 라벨과 텍스트 사용 가능• 그림 (figure) 내의 각 요소를 제어할 수 있음• 여러 형식으로 저장 (PNG, PDF, SVG, …)• 대화식 혹은 일괄 작업 방식으로 사용할 수 있음• MATLAB 방식 또는 객체 지향 방식으로 사용
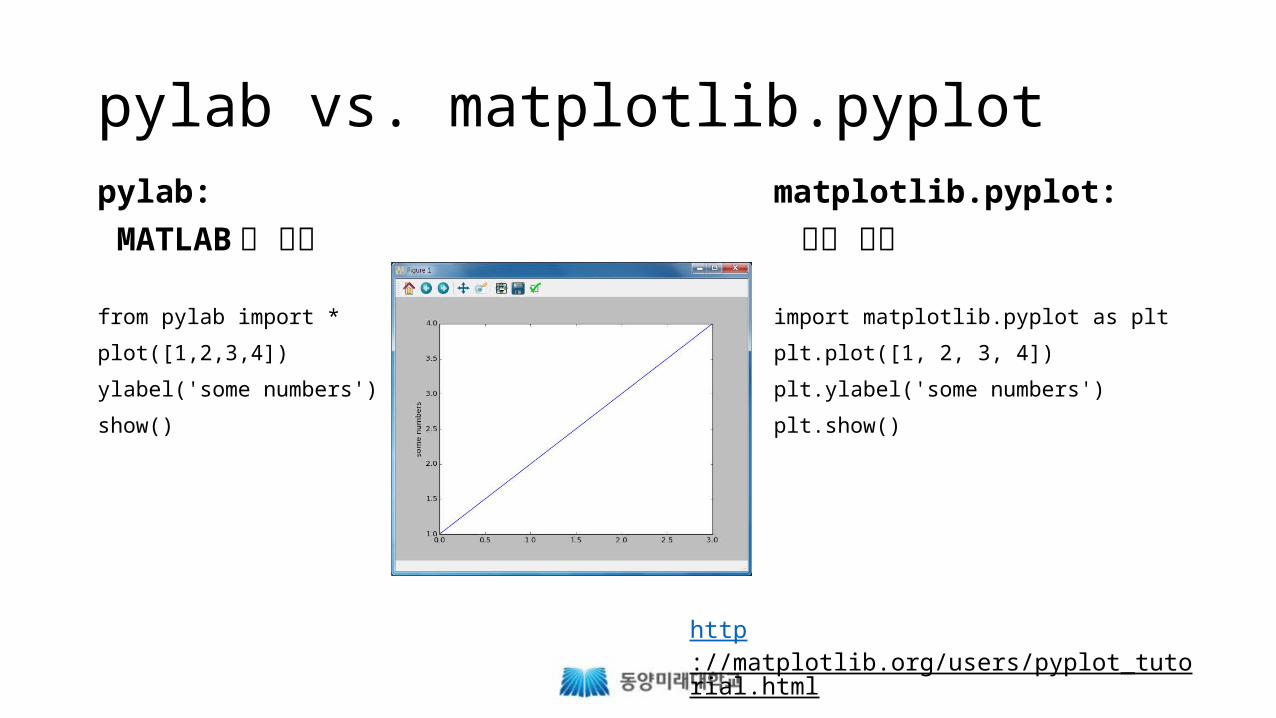
pylab vs. matplotlib.pyplotpylab:
MATLAB 과 유사
from pylab import *
plot([1,2,3,4])
ylabel('some numbers')
show()
matplotlib.pyplot:
객체 지향
import matplotlib.pyplot as plt
plt.plot([1, 2, 3, 4])
plt.ylabel('some numbers')
plt.show()
http://matplotlib.org/users/pyplot_tutorial.html
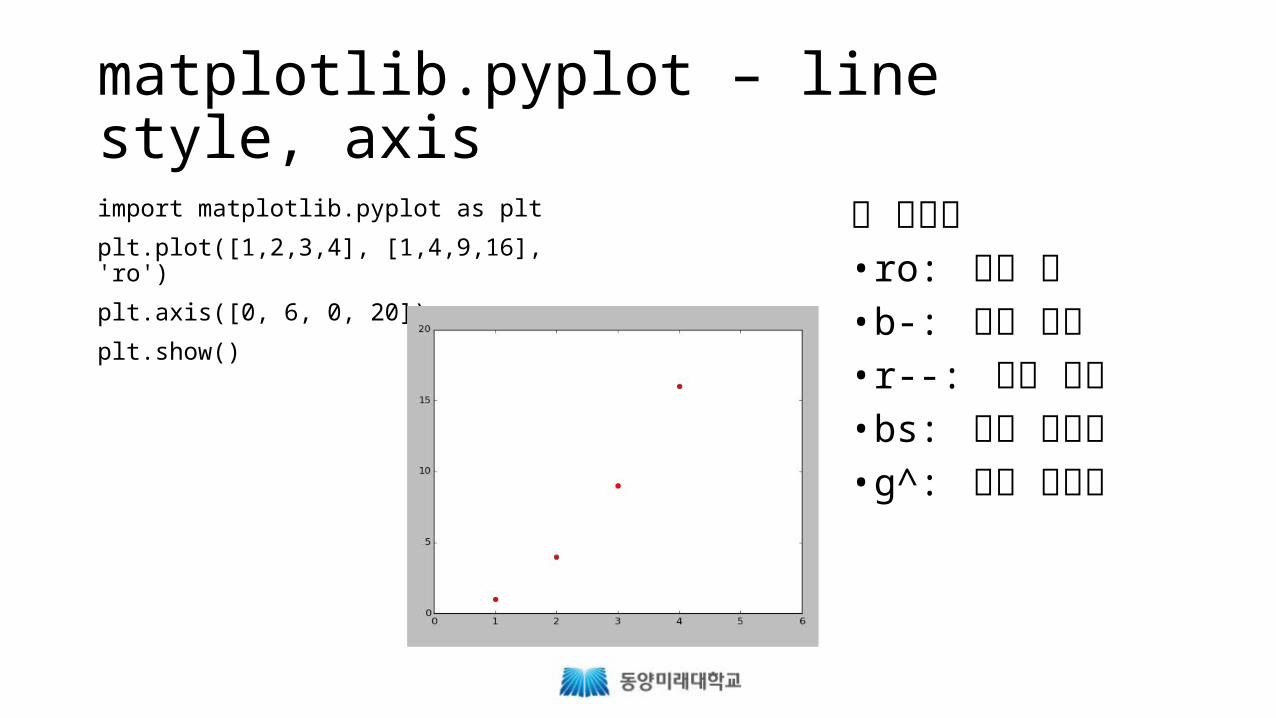
matplotlib.pyplot – line style, axis
import matplotlib.pyplot as plt
plt.plot([1,2,3,4], [1,4,9,16], 'ro')
plt.axis([0, 6, 0, 20])
plt.show()
선 스타일• ro: 붉은 원• b-: 파란 실선• r--: 붉은 점선• bs: 파란 사각형• g^: 녹색 삼각형
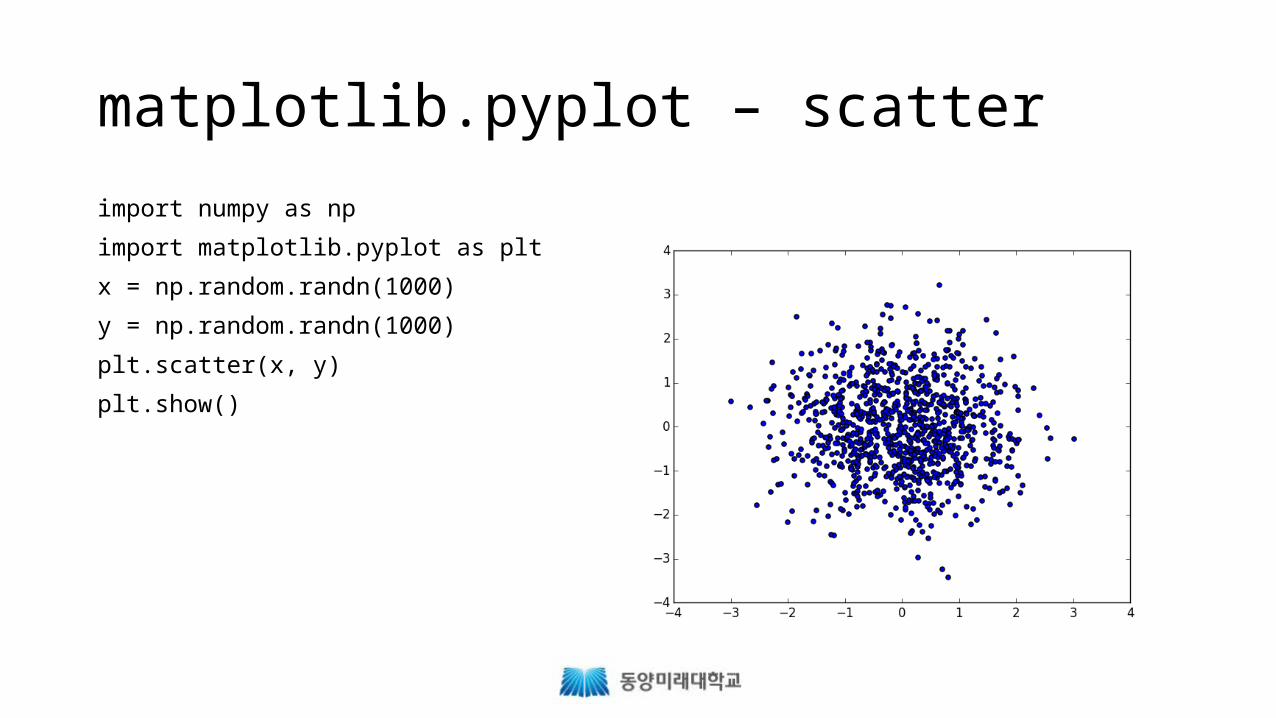
matplotlib.pyplot – scatter
import numpy as np
import matplotlib.pyplot as plt
x = np.random.randn(1000)
y = np.random.randn(1000)
plt.scatter(x, y)
plt.show()
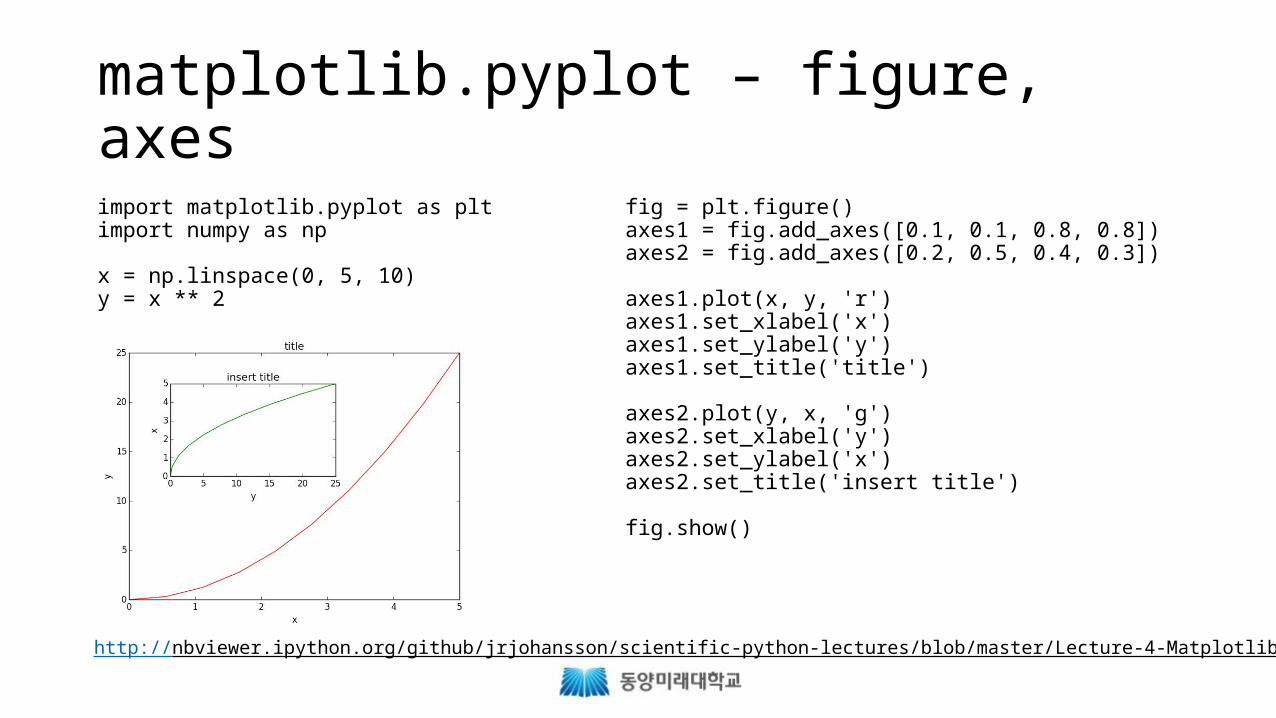
matplotlib.pyplot – figure, axes
import matplotlib.pyplot as pltimport numpy as np
x = np.linspace(0, 5, 10)y = x ** 2
fig = plt.figure()axes1 = fig.add_axes([0.1, 0.1, 0.8, 0.8])axes2 = fig.add_axes([0.2, 0.5, 0.4, 0.3])
axes1.plot(x, y, 'r')axes1.set_xlabel('x')axes1.set_ylabel('y')axes1.set_title('title')
axes2.plot(y, x, 'g')axes2.set_xlabel('y')axes2.set_ylabel('x')axes2.set_title('insert title')
fig.show()
http://nbviewer.ipython.org/github/jrjohansson/scientific-python-lectures/blob/master/Lecture-4-Matplotlib.ipynb
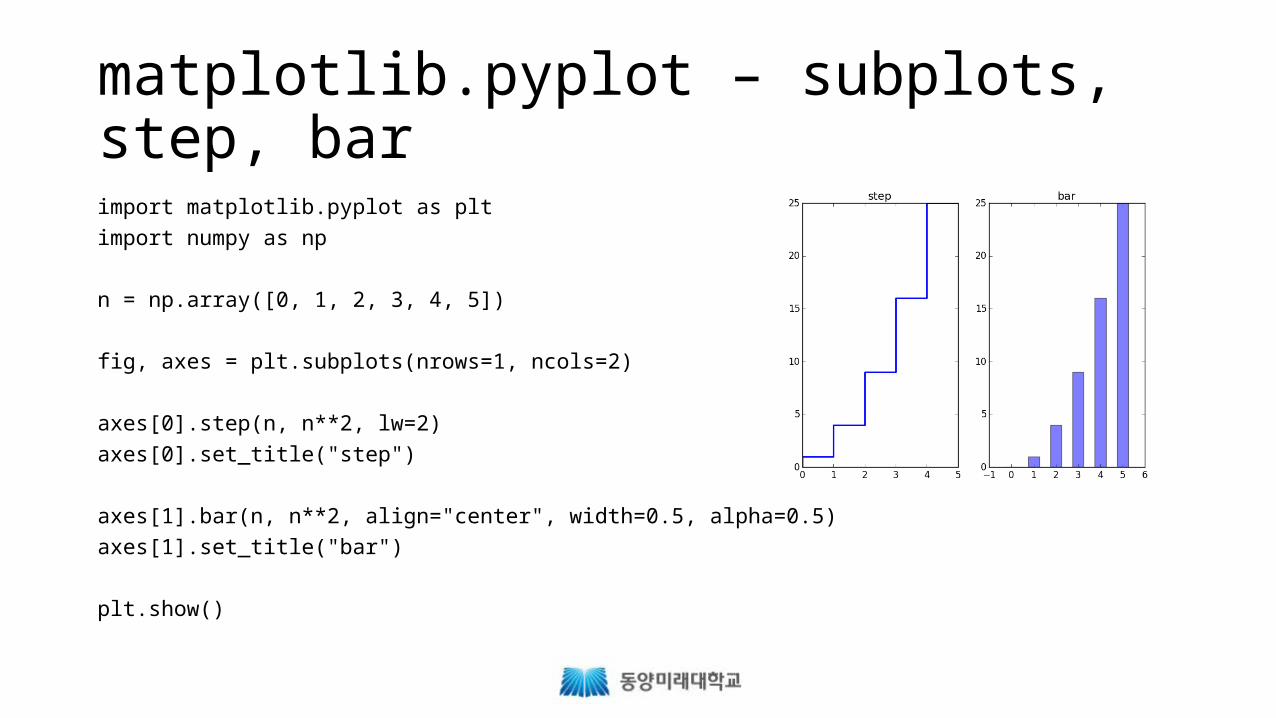
matplotlib.pyplot – subplots, step, barimport matplotlib.pyplot as plt
import numpy as np
n = np.array([0, 1, 2, 3, 4, 5])
fig, axes = plt.subplots(nrows=1, ncols=2)
axes[0].step(n, n**2, lw=2)
axes[0].set_title("step")
axes[1].bar(n, n**2, align="center", width=0.5, alpha=0.5)
axes[1].set_title("bar")
plt.show()
More
• Polar• Histogram • Colormap• Contour• 3D (Surface, Wireframe)• 참고 자료• Beginner’s Guide http://matplotlib.org/users/beginner.html• http://
nbviewer.ipython.org/github/jrjohansson/scientific-python-lectures/blob/master/Lecture-4-Matplotlib.ipynb
Recommended