United Kingdom
Q1'18 Earnings Presentation
24 April 2018
2
Santander UK Group Holdings and Banco Santander, S.A. ("Santander") both caution that this presentation contains statements that constitute “forward-looking statements” within the meaning of the U.S. Private Securities Litigation Reform Act of 1995.
Forward-looking statements may be identified by words such as “expect”, “project”, “anticipate”, “should”, “intend”, “probability”, “risk”, “VaR”, “RORAC”, “RoRWA”, “TNAV”, “target”, “goal”, “objective”, “estimate”, “future” and similar expressions. These
forward-looking statements are found in various places throughout this presentation and include, without limitation, statements concerning our future business development and economic performance and our shareholder remuneration policy. While these
forward-looking statements represent our judgment and future expectations concerning the development of our business, a number of risks, uncertainties and other important factors could cause actual developments and results to differ materially from our
expectations. These factors include, but are not limited to: (1) general market, macro-economic, industry, governmental and regulatory trends; (2) movements in local and international securities markets, currency exchange rates and interest rates; (3)
competitive pressures; (4) technological developments; and (5) changes in the financial position or credit worthiness of our customers, obligors and counterparties. Numerous factors, including those reflected in the Annual Report on Form 20-F filed with
the Securities and Exchange Commission of the United States of America (the “SEC”) –under “Key Information-Risk Factors”- and in the Documento de Registro de Acciones filed with the Spanish Securities Market Commission (the “CNMV”) –under
“Factores de Riesgo”- could affect the future results of Santander and could result in other results deviating materially from those anticipated in the forward-looking statements. Other unknown or unpredictable factors could cause actual results to differ
materially from those in the forward-looking statements.
Forward-looking statements speak only as of the date of this presentation and are based on the knowledge, information available and views taken on such date; such knowledge, information and views may change at any time. Santander does not
undertake any obligation to update or revise any forward-looking statement, whether as a result of new information, future events or otherwise.
The information contained in this presentation is subject to, and must be read in conjunction with, all other publicly available information, including, where relevant any fuller disclosure document published by Santander or Santander UK Group Holdings.
Any person at any time acquiring securities must do so only on the basis of such person's own judgment as to the merits or the suitability of the securities for its purpose and only on such information as is contained in such public information having taken
all such professional or other advice as it considers necessary or appropriate in the circumstances and not in reliance on the information contained in the presentation. No investment activity should be undertaken on the basis of the information contained
in this presentation. In making this presentation available, Santander UK Group Holdings and Santander give no advice and makes no recommendation to buy, sell or otherwise deal in shares in Santander or in any other securities or investments
whatsoever.
Neither this presentation nor any of the information contained therein constitutes an offer to sell or the solicitation of an offer to buy any securities. No offering of securities shall be made in the United States except pursuant to registration under the U.S.
Securities Act of 1933, as amended, or an exemption therefrom. Nothing contained in this presentation is intended to constitute an invitation or inducement to engage in investment activity for the purposes of the prohibition on financial promotion in the
U.K. Financial Services and Markets Act 2000.
Note: Statements as to historical performance or financial accretion are not intended to mean that future performance, share price or future earnings (including earnings per share) for any period will necessarily match or exceed those of any prior year.
Nothing in this presentation should be construed as a profit forecast.
The businesses included in each of our geographic segments and the accounting principles under which their results are presented here may differ from the included businesses and local applicable accounting principles of our public subsidiaries in such
geographies. Accordingly, the results of operations and trends shown for our geographic segments may differ materially from those of such subsidiaries.
In addition to the financial information prepared under International Financial Reporting Standards (“IFRS”), this presentation includes certain alternative performance measures as defined in the Guidelines on Alternative Performance Measures issued by
the European Securities and Markets Authority on 5 October 2015 (ESMA/2015/1415es) as well as Non-IFRS measures. The APMs and Non-IFRS Measures are performance measures that have been calculated using the financial information from the
Santander Group but that are not defined or detailed in the applicable financial information framework and therefore have neither been audited nor are capable of being completely audited. These APMs and Non-IFRS Measures are been used to allow for
a better understanding of the financial performance of the Santander Group but should be considered only as additional information and in no case as a replacement of the financial information prepared under IFRS. Moreover, the way the Santander
Group defines and calculates these APMs and Non-IFRS Measures may differ to the way these are calculated by other companies that use similar measures, and therefore they may not be comparable. Please refer to the quarterly financial Report for
further details of the APMs and Non-IFRS Measures used, including its definition or a reconciliation between any applicable management indicators and the financial data presented in the consolidated financial statements prepared under IFR, see Section
26 of the Documento de Registro de Acciones for Banco Santander filed with the CNMV on July 4, 2017 (available on the Web page of the CNMV -www.cnmv.es- and at Banco Santander -www.santander.com) and Item 3A of the Annual Report on Form
20-F for the year ended December 31, 2016, filed with the U.S. Securities and Exchange Commission on March 31, 2017 (the “Form 20-F”). For a discussion of the accounting principles used in translation of foreign currency-denominated assets and
liabilities to euros, see note 2(a) to our consolidated financial statements on Form 20-F and to our consolidated financial statements available on the CNMV’s website (www.cnmv.es) and on Banco Santander’s website (www.santander.com).
This presentation has not been filed, reviewed or approved by any regulator, governmental regulatory body or securities exchange in any jurisdiction or territory.
To the fullest extent permitted by law, neither Santander UK Group Holdings nor Santander accept any liability whatsoever for any direct or consequential loss arising from any use of or reliance on this presentation.
By attending / reading the presentation you agree to be bound by these provisions.
Note: The results information contained in this presentation has been prepared according to Spanish accounting criteria, regulation and Banco Santander group policy in a manner applicable to all subsidiaries of the Banco Santander Group. As a result it
may differ from that disclosed locally by Santander UK. The results information in this presentation includes all of the Banco Santander group operations in the UK even if they are in Santander UK consolidated Group.
Santander has a standard listing of its ordinary shares on the London Stock Exchange and Santander UK continues to have its preference shares listed on the London Stock Exchange. Further information in relation to Santander UK can be found at:
www.santander.co.uk/uk/about-santander-uk. Neither the content of Santander UK’s website nor any website accessible by hyperlinks on Santander UK’s website is incorporated in, or forms part of, this presentation.
Santander UK Group Holdings plc. Registered Office: 2 Triton Square, Regent's Place, London, NW1 3AN, United Kingdom. Registered Number 8700698. Registered in England. www.santander.co.uk. Telephone 0870 607 6000. Calls may be recorded
or monitored. Santander UK Group Holdings plc. and its subsidiaries operate primarily in the UK, are regulated by the UK Prudential Regulation Authority (‘PRA’) and the Financial Conduct Authority (‘FCA’) and are part of the Banco Santander, S.A. group
(the ‘Banco Santander group’). Santander UK plc’s Financial Services Register number is 106054. Santander UK plc. is also licensed by the Financial Supervision Commission of the Isle of Man for its branch in the Isle of Man. Deposits held with the Isle
of Man branch are covered by the Isle of Man Depositors’ Compensation Scheme as set out in the Isle of Man Depositors’ Compensation Scheme Regulations 2010.In the Isle of Man, Santander UK plc’s principal place of business is at 19/21 Prospect
Hill, Douglas, Isle of Man, IM1 1ET. Santander and the flame logo are registered trademarks. Banco Santander S.A. London Branch is regulated by the Financial Conduct Authority.
Disclaimer
3
1. Macroeconomic environment and financial system
2. Strategy and business
3. Results
4. Appendix
Index
Macroeconomic environment
and financial system
01
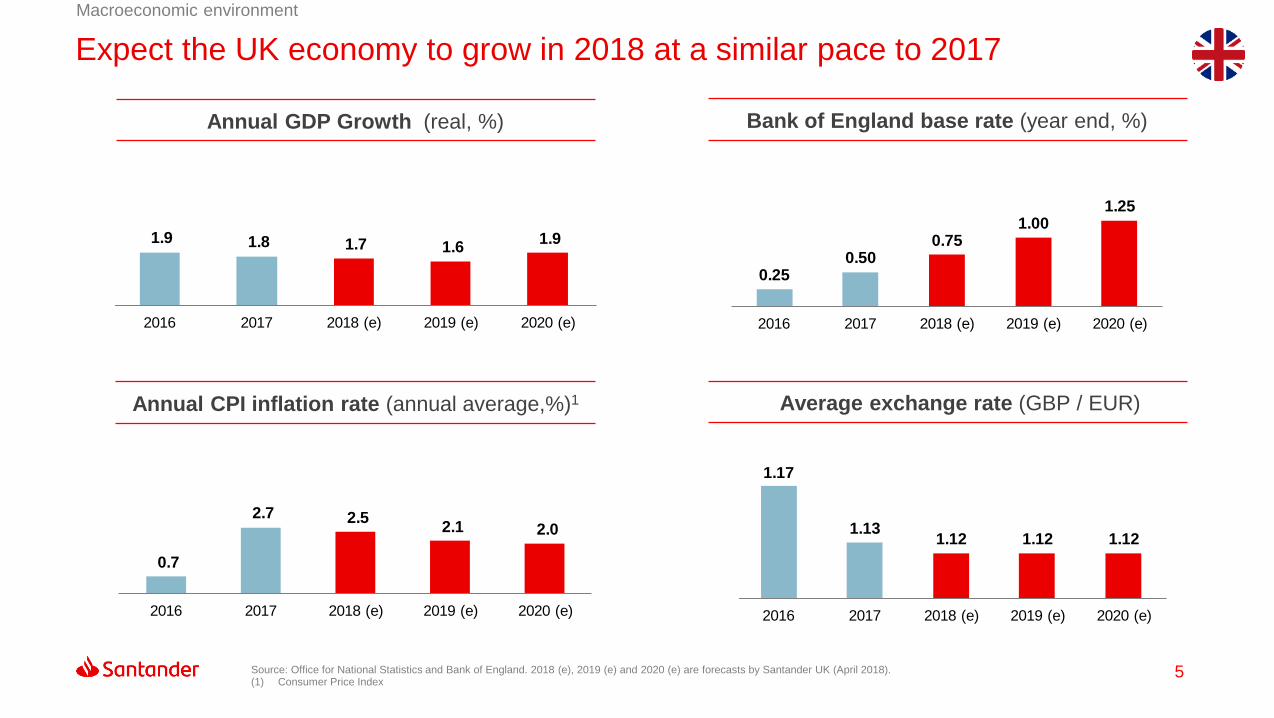
5Source: Office for National Statistics and Bank of England. 2018 (e), 2019 (e) and 2020 (e) are forecasts by Santander UK (April 2018). (1) Consumer Price Index
Macroeconomic environment
Annual GDP Growth (real, %) Bank of England base rate (year end, %)
Annual CPI inflation rate (annual average,%)1 Average exchange rate (GBP / EUR)
0.250.50
0.751.00
1.25
2016 2017 2018 (e) 2019 (e) 2020 (e)
1.9 1.8 1.7 1.6 1.9
2016 2017 2018 (e) 2019 (e) 2020 (e)
0.7
2.7 2.5 2.1 2.0
2016 2017 2018 (e) 2019 (e) 2020 (e)
1.17
1.131.12 1.12 1.12
2016 2017 2018 (e) 2019 (e) 2020 (e)
Expect the UK economy to grow in 2018 at a similar pace to 2017
6
Macroeconomic environment
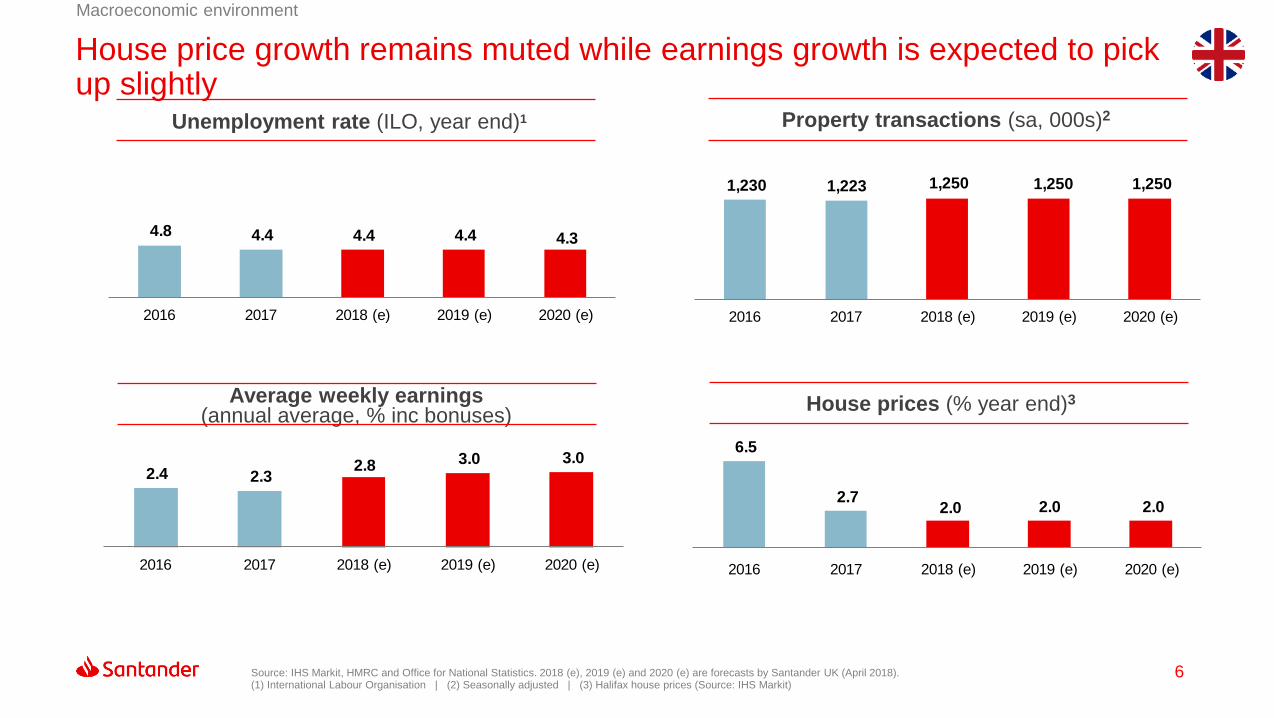
Unemployment rate (ILO, year end)1 Property transactions (sa, 000s)2
Average weekly earnings (annual average, % inc bonuses)
House prices (% year end)3
Source: IHS Markit, HMRC and Office for National Statistics. 2018 (e), 2019 (e) and 2020 (e) are forecasts by Santander UK (April 2018). (1) International Labour Organisation | (2) Seasonally adjusted | (3) Halifax house prices (Source: IHS Markit)
4.8 4.4 4.4 4.4 4.3
2016 2017 2018 (e) 2019 (e) 2020 (e)
1,230 1,223 1,250 1,250 1,250
2016 2017 2018 (e) 2019 (e) 2020 (e)
6.5
2.7 2.0 2.0 2.0
2016 2017 2018 (e) 2019 (e) 2020 (e)
2.4 2.3 2.8 3.0 3.0
2016 2017 2018 (e) 2019 (e) 2020 (e)
House price growth remains muted while earnings growth is expected to pick up slightly
7
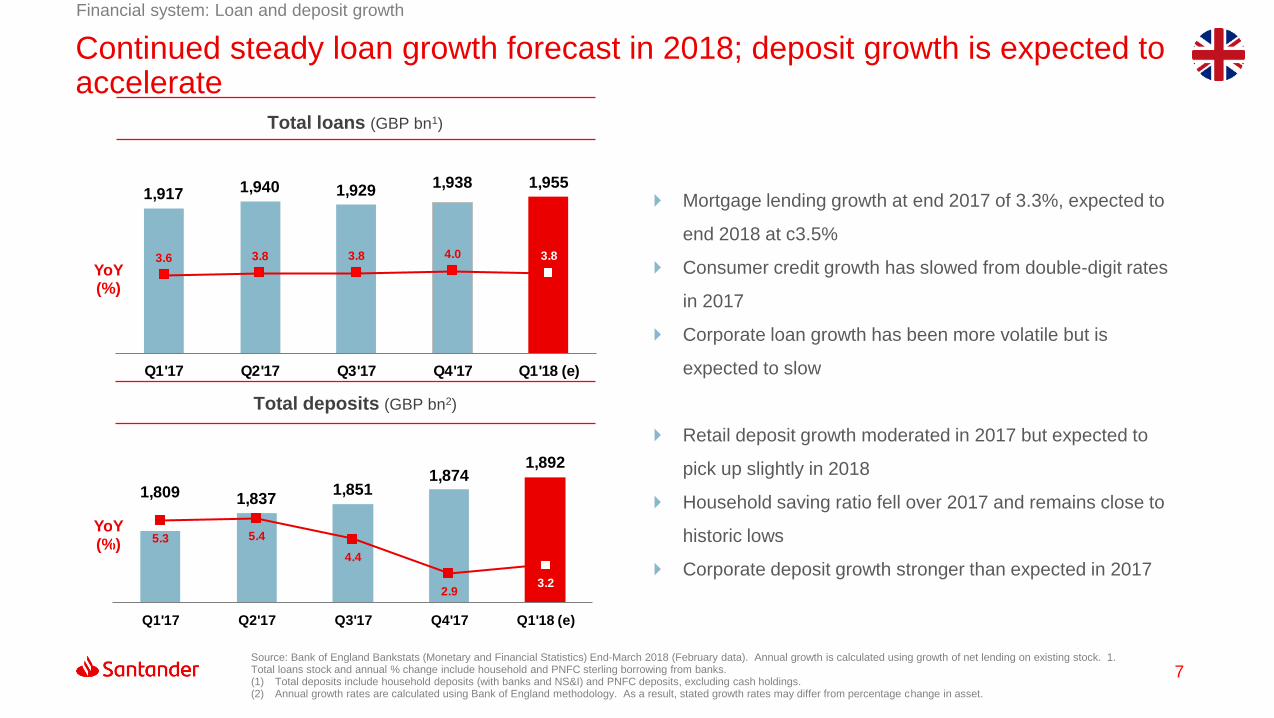
Financial system: Loan and deposit growth
Total loans (GBP bn1)
Mortgage lending growth at end 2017 of 3.3%, expected to
end 2018 at c3.5%
Consumer credit growth has slowed from double-digit rates
in 2017
Corporate loan growth has been more volatile but is
expected to slow
Retail deposit growth moderated in 2017 but expected to
pick up slightly in 2018
Household saving ratio fell over 2017 and remains close to
historic lows
Corporate deposit growth stronger than expected in 2017
YoY (%)
Total deposits (GBP bn2)
Source: Bank of England Bankstats (Monetary and Financial Statistics) End-March 2018 (February data). Annual growth is calculated using growth of net lending on existing stock. 1. Total loans stock and annual % change include household and PNFC sterling borrowing from banks.(1) Total deposits include household deposits (with banks and NS&I) and PNFC deposits, excluding cash holdings. (2) Annual growth rates are calculated using Bank of England methodology. As a result, stated growth rates may differ from percentage change in asset.
1,917 1,940 1,9291,938 1,955
3.6 3.8 3.8 4.0 3.8
Q1'17 Q2'17 Q3'17 Q4'17 Q1'18 (e)
1,809 1,8371,851
1,8741,892
5.3 5.4
4.4
2.93.2
Q1'17 Q2'17 Q3'17 Q4'17 Q1'18 (e)
YoY (%)
Continued steady loan growth forecast in 2018; deposit growth is expected to accelerate

Strategy and
business
02
9
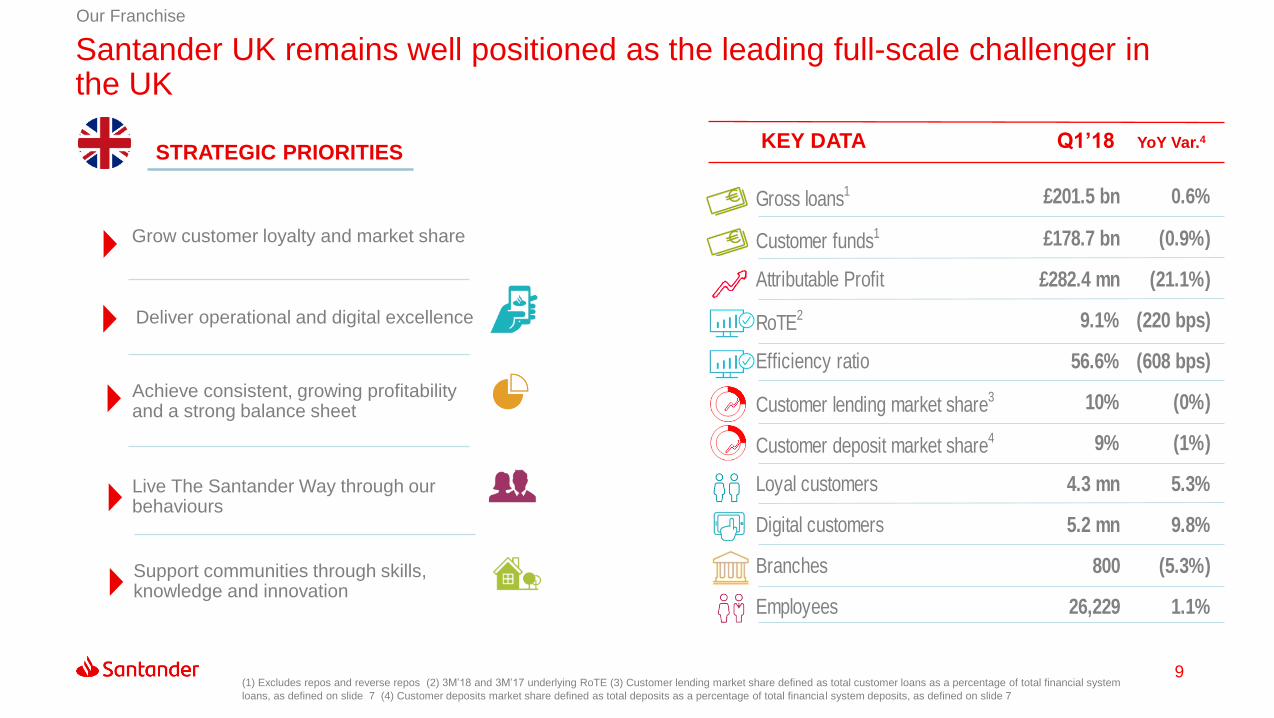
Our Franchise
STRATEGIC PRIORITIES
Grow customer loyalty and market share
KEY DATA Q1’18 YoY Var.4
Deliver operational and digital excellence
Achieve consistent, growing profitability and a strong balance sheet
Live The Santander Way through our behaviours
Gross loans1 £201.5 bn 0.6%
Customer funds1 £178.7 bn (0.9%)
Attributable Profit £282.4 mn (21.1%)
RoTE2 9.1% (220 bps)
Efficiency ratio 56.6% (608 bps)
Customer lending market share3 10% (0%)
Customer deposit market share4 9% (1%)
Loyal customers 4.3 mn 5.3%
Digital customers 5.2 mn 9.8%
Branches 800 (5.3%)
Employees 26,229 1.1%
(1) Excludes repos and reverse repos (2) 3M’18 and 3M’17 underlying RoTE (3) Customer lending market share defined as total customer loans as a percentage of total financial system
loans, as defined on slide 7 (4) Customer deposits market share defined as total deposits as a percentage of total financial system deposits, as defined on slide 7
Support communities through skills, knowledge and innovation
Santander UK remains well positioned as the leading full-scale challenger in the UK
10
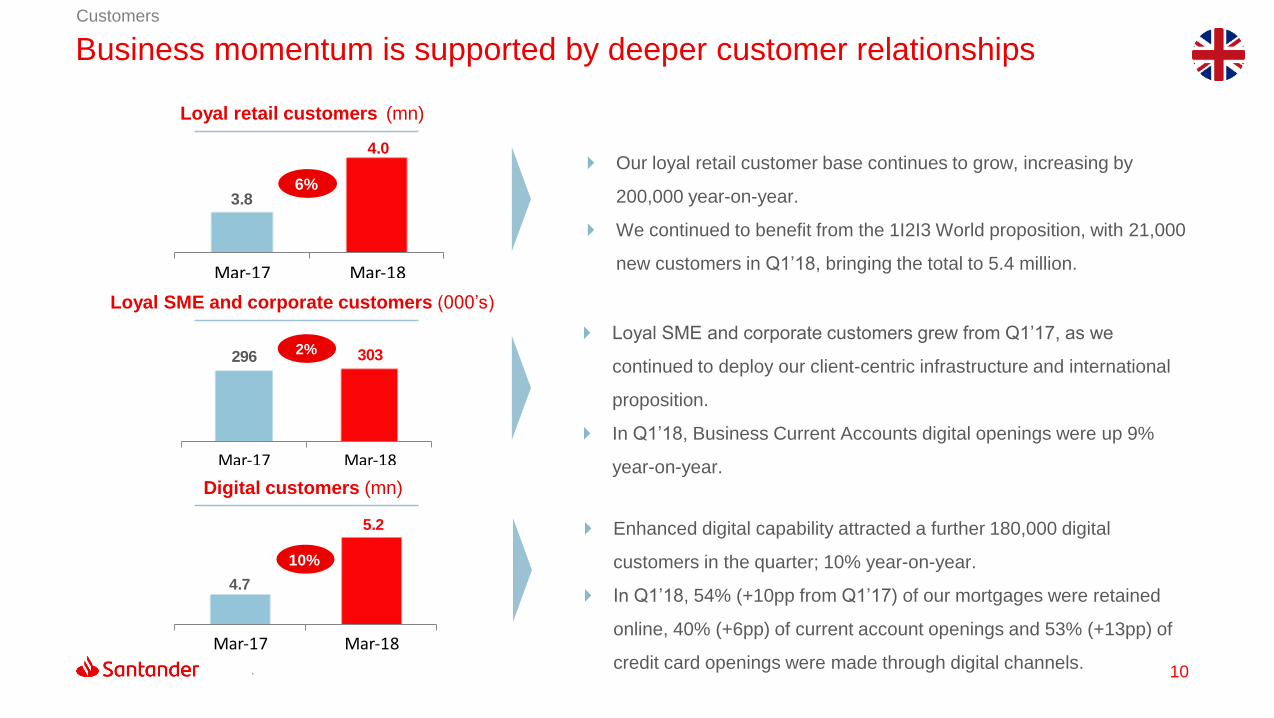
Customers
Loyal retail customers (mn)
Loyal SME and corporate customers grew from Q1’17, as we
continued to deploy our client-centric infrastructure and international
proposition.
In Q1’18, Business Current Accounts digital openings were up 9%
year-on-year.
Loyal SME and corporate customers (000’s)
Enhanced digital capability attracted a further 180,000 digital
customers in the quarter; 10% year-on-year.
In Q1’18, 54% (+10pp from Q1’17) of our mortgages were retained
online, 40% (+6pp) of current account openings and 53% (+13pp) of
credit card openings were made through digital channels.
Digital customers (mn)
.
4.7
5.2
Mar-17 Mar-18
10%
296 303
Mar-17 Mar-18
2%
3.8
4.0
Mar-17 Mar-18
6%
Our loyal retail customer base continues to grow, increasing by
200,000 year-on-year.
We continued to benefit from the 1I2I3 World proposition, with 21,000
new customers in Q1’18, bringing the total to 5.4 million.
Business momentum is supported by deeper customer relationships
11
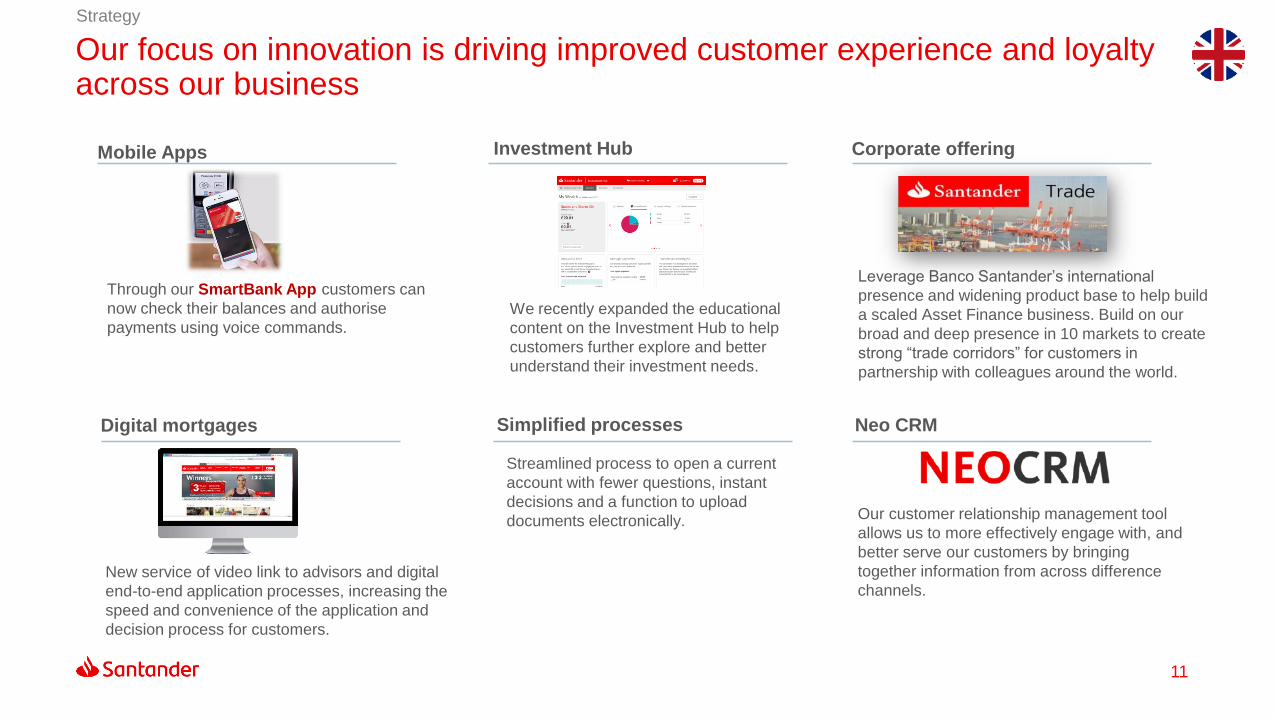
Strategy
Mobile Apps
Through our SmartBank App customers can
now check their balances and authorise
payments using voice commands.
Digital mortgages
New service of video link to advisors and digital
end-to-end application processes, increasing the
speed and convenience of the application and
decision process for customers.
Corporate offering
Neo CRM
Our customer relationship management tool
allows us to more effectively engage with, and
better serve our customers by bringing
together information from across difference
channels.
Investment Hub
We recently expanded the educational
content on the Investment Hub to help
customers further explore and better
understand their investment needs.
Simplified processes
Leverage Banco Santander’s international
presence and widening product base to help build
a scaled Asset Finance business. Build on our
broad and deep presence in 10 markets to create
strong “trade corridors” for customers in
partnership with colleagues around the world.
Streamlined process to open a current
account with fewer questions, instant
decisions and a function to upload
documents electronically.
Our focus on innovation is driving improved customer experience and loyalty across our business
12
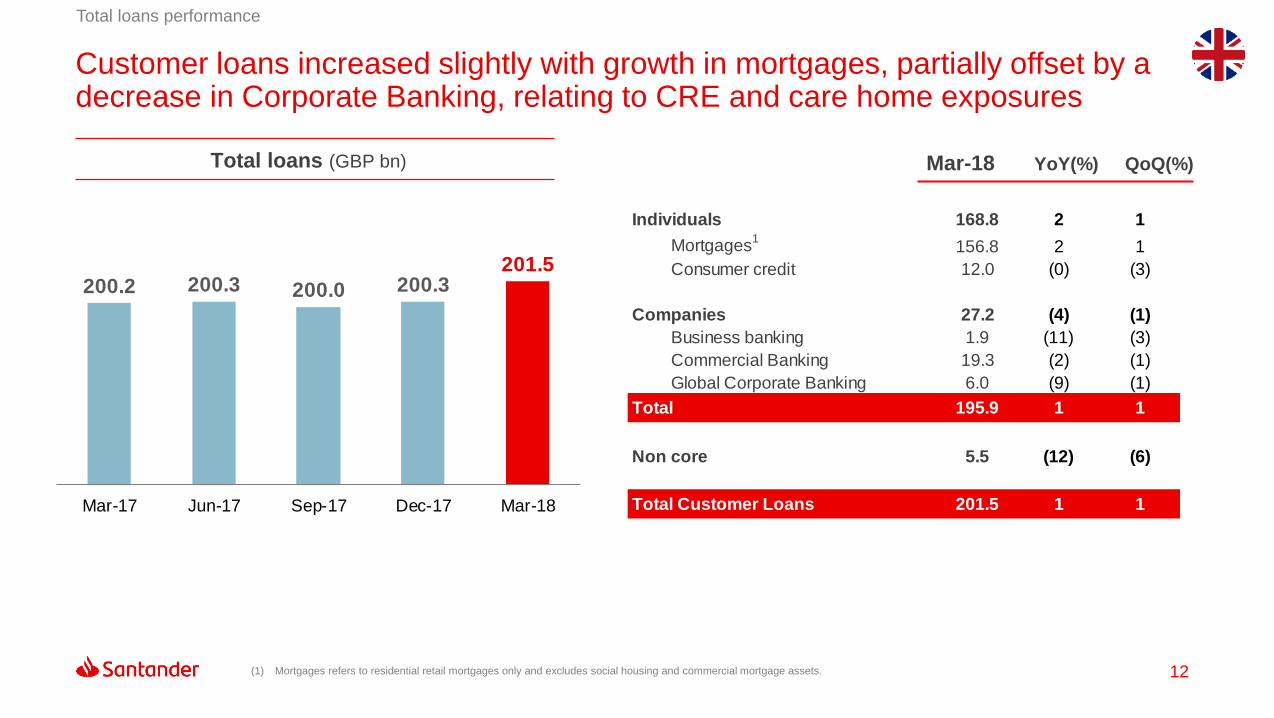
Total loans performance
Total loans (GBP bn) Mar-18 YoY(%) QoQ(%)
(1) Mortgages refers to residential retail mortgages only and excludes social housing and commercial mortgage assets.
Individuals 168.8 2 1
Mortgages1
156.8 2 1
Consumer credit 12.0 (0) (3)
Companies 27.2 (4) (1)
Business banking 1.9 (11) (3)
Commercial Banking 19.3 (2) (1)
Global Corporate Banking 6.0 (9) (1)
Total 195.9 1 1
Non core 5.5 (12) (6)
Total Customer Loans 201.5 1 1
200.2 200.3 200.0 200.3201.5
Mar-17 Jun-17 Sep-17 Dec-17 Mar-18
Customer loans increased slightly with growth in mortgages, partially offset by a decrease in Corporate Banking, relating to CRE and care home exposures
13
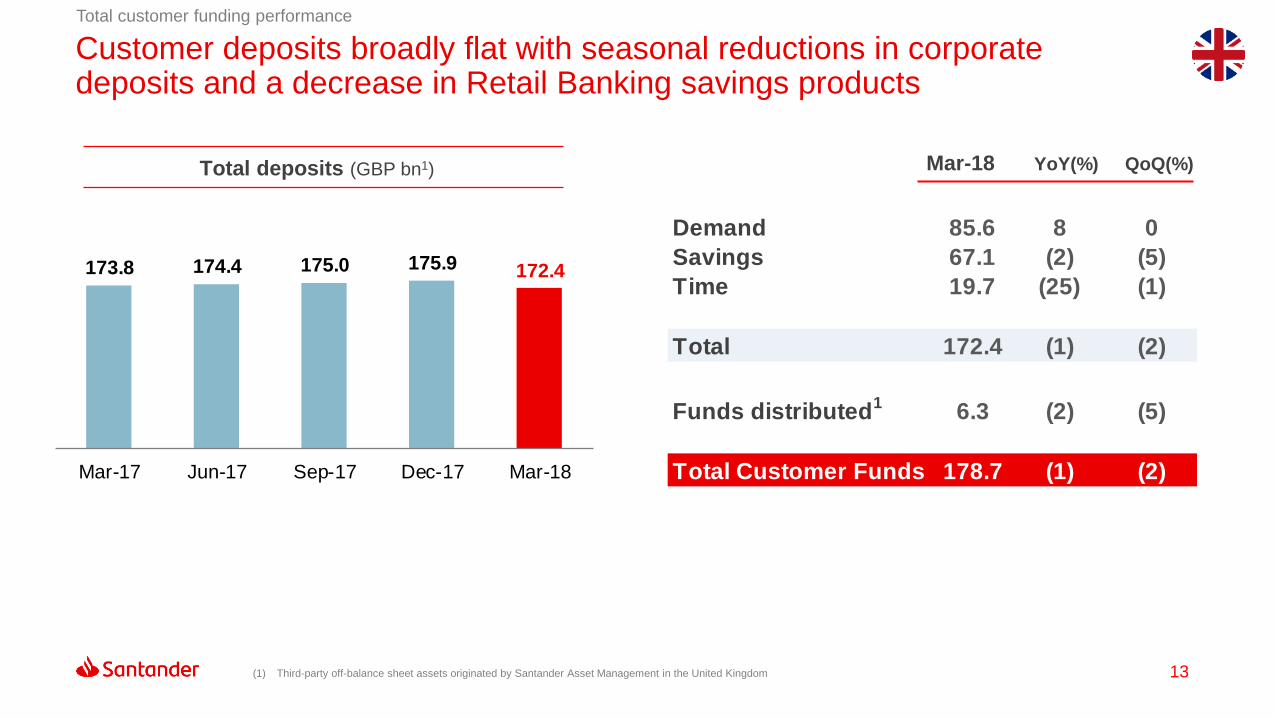
Total customer funding performance
Total deposits (GBP bn1) Mar-18 YoY(%) QoQ(%)
(1) Third-party off-balance sheet assets originated by Santander Asset Management in the United Kingdom
Demand 85.6 8 0
Savings 67.1 (2) (5)
Time 19.7 (25) (1)
Total 172.4 (1) (2)
Funds distributed1
6.3 (2) (5)
Total Customer Funds 178.7 (1) (2)
173.8 174.4 175.0 175.9 172.4
Mar-17 Jun-17 Sep-17 Dec-17 Mar-18
Customer deposits broadly flat with seasonal reductions in corporate deposits and a decrease in Retail Banking savings products
Results
03
15
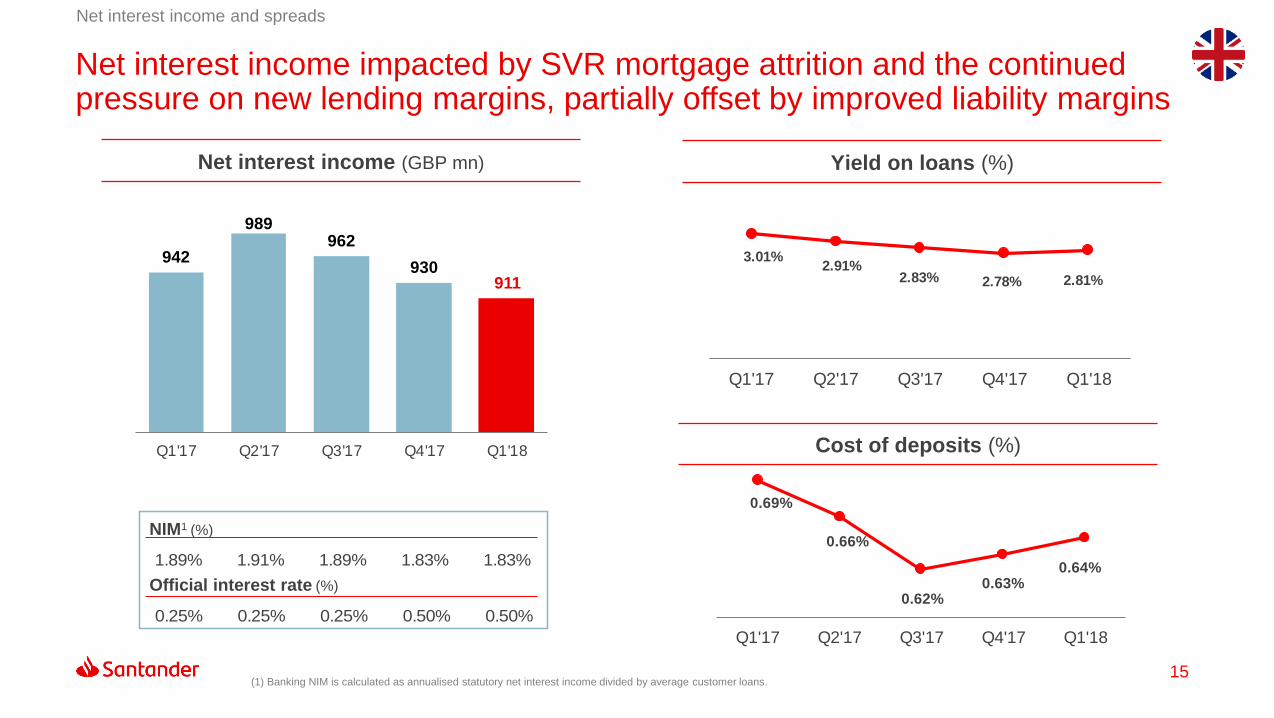
Net interest income impacted by SVR mortgage attrition and the continued pressure on new lending margins, partially offset by improved liability margins
Net interest income and spreads
(1) Banking NIM is calculated as annualised statutory net interest income divided by average customer loans.
NIM1 (%)
Official interest rate (%)
Net interest income (GBP mn) Yield on loans (%)
Cost of deposits (%)
942
989962
930911
Q1'17 Q2'17 Q3'17 Q4'17 Q1'18
1.89% 1.91% 1.89% 1.83% 1.83%
0.25% 0.25% 0.25% 0.50% 0.50%
3.01%2.91%
2.83% 2.78% 2.81%
Q1'17 Q2'17 Q3'17 Q4'17 Q1'18
Q1'17 Q2'17 Q3'17 Q4'17 Q1'18
0.69%
0.66%
0.62%0.63%
0.64%
Q1'17 Q2'17 Q3'17 Q4'17 Q1'18
16
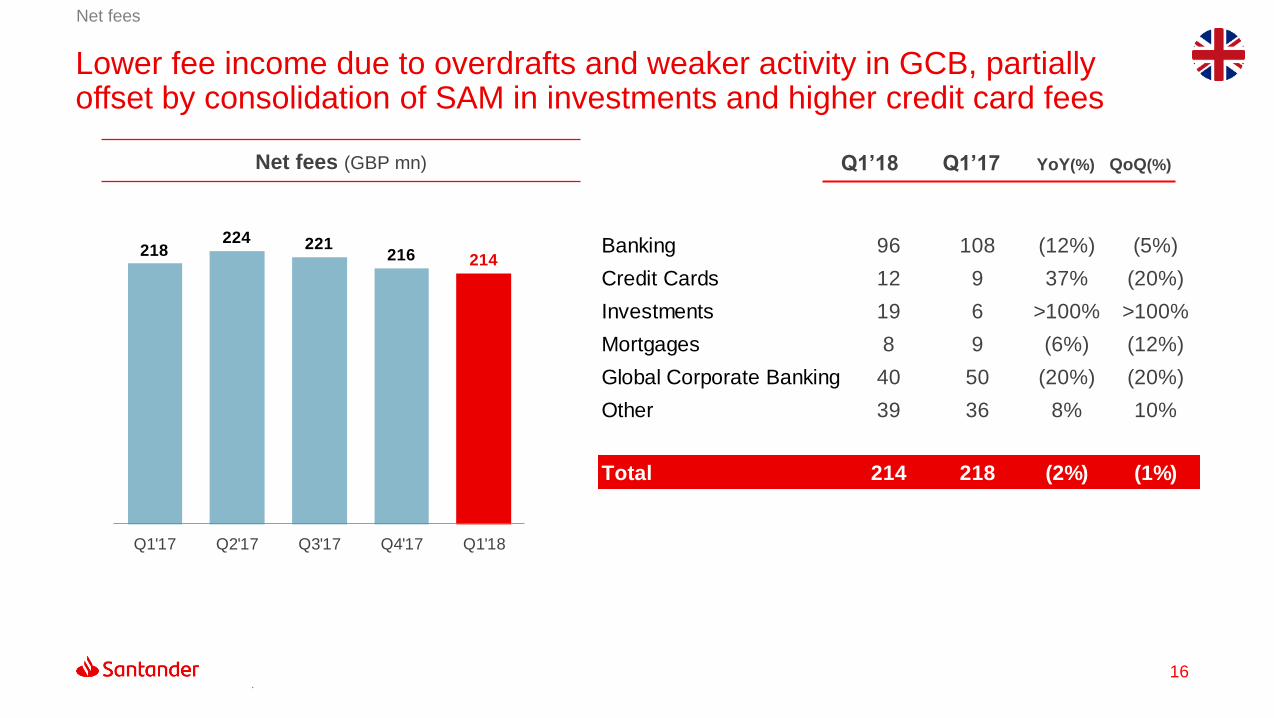
Lower fee income due to overdrafts and weaker activity in GCB, partially offset by consolidation of SAM in investments and higher credit card fees
Net fees
Net fees (GBP mn) Q1’18 Q1’17 YoY(%) QoQ(%)
.
218224 221
216 214
Q1'17 Q2'17 Q3'17 Q4'17 Q1'18
Banking 96 108 (12%) (5%)
Credit Cards 12 9 37% (20%)
Investments 19 6 >100% >100%
Mortgages 8 9 (6%) (12%)
Global Corporate Banking 40 50 (20%) (20%)
Other 39 36 8% 10%
Total 214 218 (2%) (1%)
17
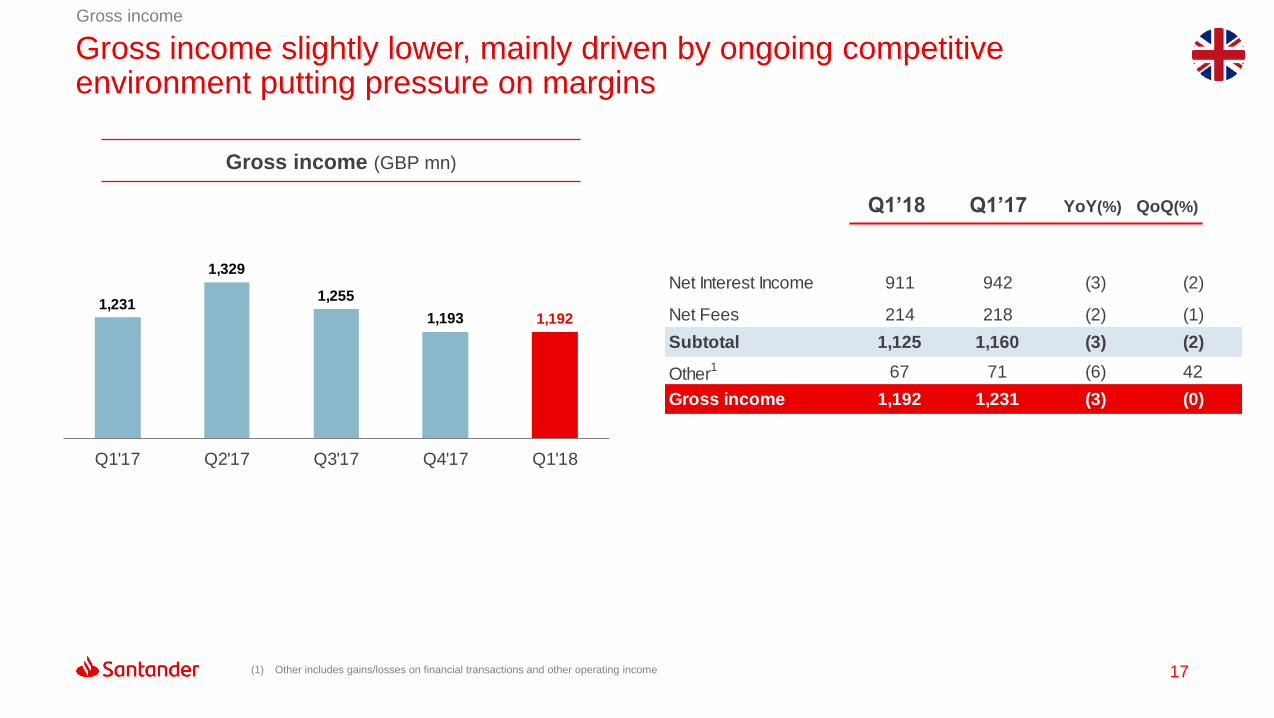
Gross income slightly lower, mainly driven by ongoing competitive environment putting pressure on margins
Gross income
Gross income (GBP mn)
Q1’18 Q1’17 YoY(%) QoQ(%)
(1) Other includes gains/losses on financial transactions and other operating income
1,231
1,329
1,255
1,193 1,192
Q1'17 Q2'17 Q3'17 Q4'17 Q1'18
Net Interest Income 911 942 (3) (2)
Net Fees 214 218 (2) (1)
Subtotal 1,125 1,160 (3) (2)
Other1 67 71 (6) 42
Gross income 1,192 1,231 (3) (0)
18
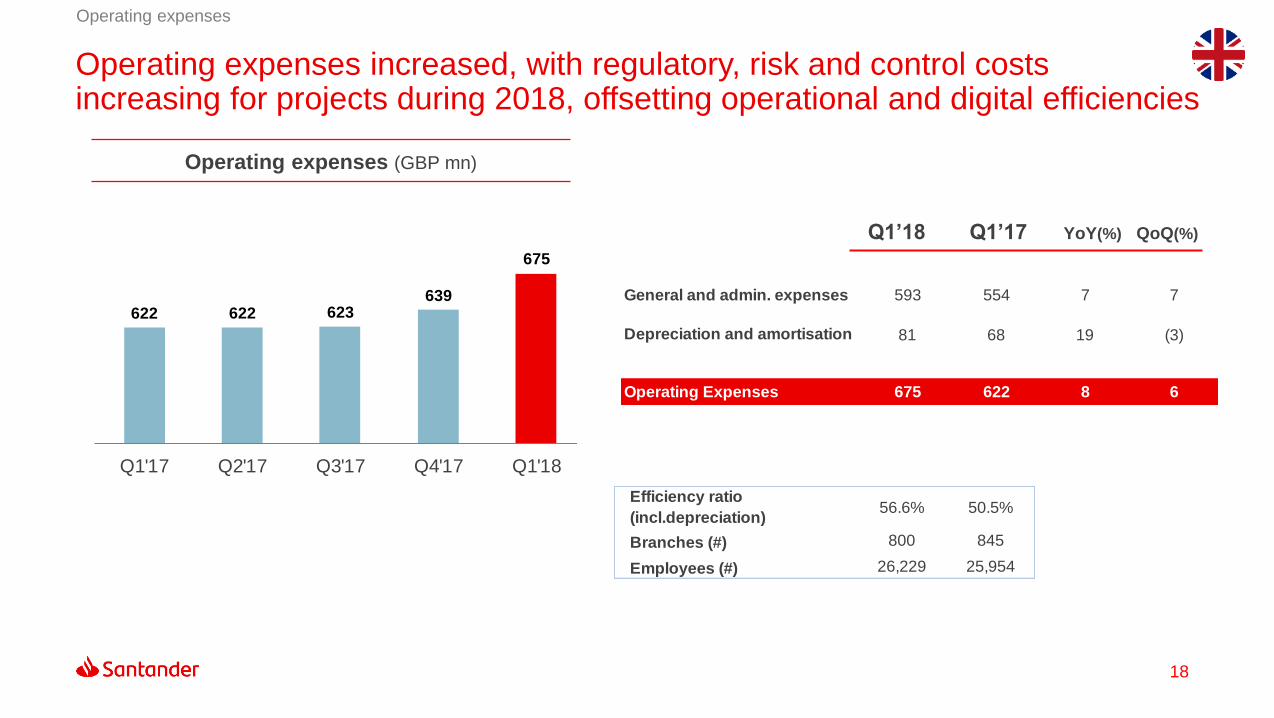
Operating expenses increased, with regulatory, risk and control costs increasing for projects during 2018, offsetting operational and digital efficiencies
Operating expenses
Operating expenses (GBP mn)
Q1’18 Q1’17 YoY(%) QoQ(%)
622 622 623639
675
Q1'17 Q2'17 Q3'17 Q4'17 Q1'18
General and admin. expenses 593 554 7 7
Depreciation and amortisation 81 68 19 (3)
Operating Expenses 675 622 8 6
Efficiency ratio
(incl.depreciation)56.6% 50.5%
Branches (#) 800 845
Employees (#) 26,229 25,954
19
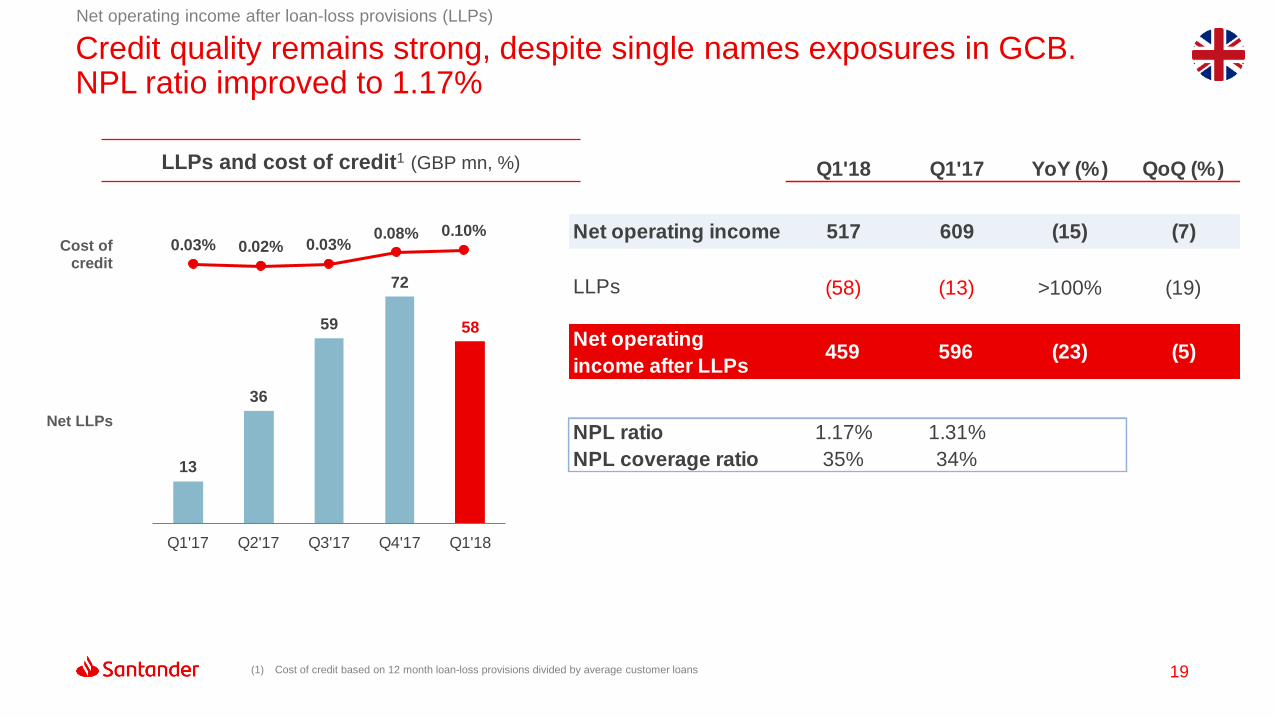
Credit quality remains strong, despite single names exposures in GCB. NPL ratio improved to 1.17%
Net operating income after loan-loss provisions (LLPs)
LLPs and cost of credit1 (GBP mn, %)
Cost of credit
Net LLPs
(1) Cost of credit based on 12 month loan-loss provisions divided by average customer loans
13
36
59
72
58
Q1'17 Q2'17 Q3'17 Q4'17 Q1'18
0.03% 0.02% 0.03%0.08% 0.10%
Q1'18 Q1'17 YoY (%) QoQ (%)
Net operating income 517 609 (15) (7)
LLPs (58) (13) >100% (19)
Net operating
income after LLPs459 596 (23) (5)
NPL ratio 1.17% 1.31%
NPL coverage ratio 35% 34%
20
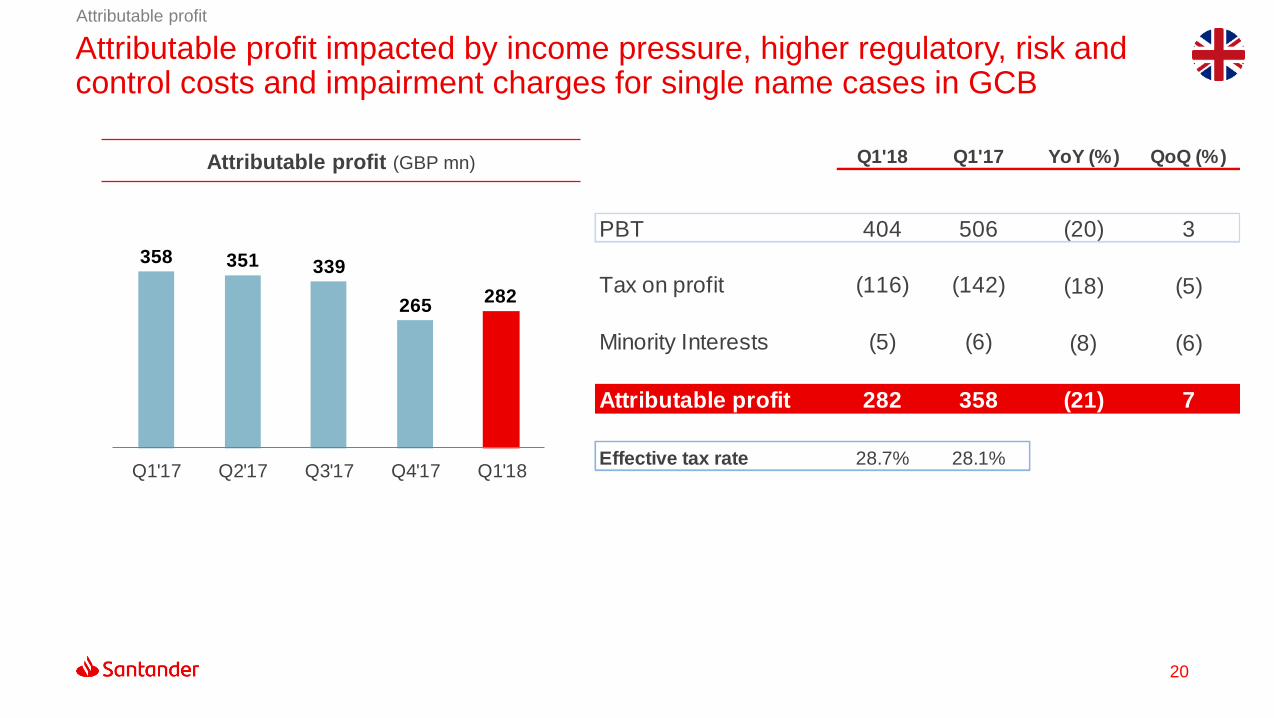
Attributable profit impacted by income pressure, higher regulatory, risk and control costs and impairment charges for single name cases in GCB
Attributable profit
Attributable profit (GBP mn) Q1'18 Q1'17 YoY (%) QoQ (%)
PBT 404 506 (20) 3
Tax on profit (116) (142) (18) (5)
Minority Interests (5) (6) (8) (6)
Attributable profit 282 358 (21) 7
Effective tax rate 28.7% 28.1%
358 351 339
265282
Q1'17 Q2'17 Q3'17 Q4'17 Q1'18
21
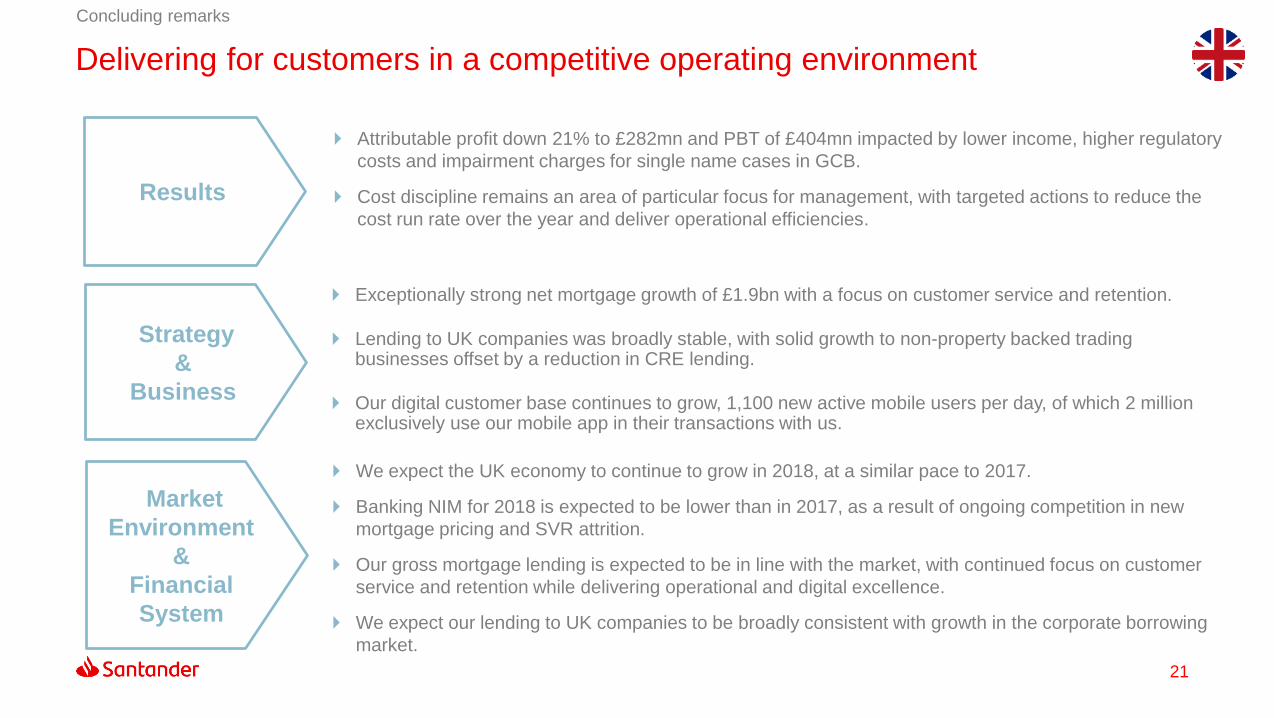
Concluding remarks
Results
Exceptionally strong net mortgage growth of £1.9bn with a focus on customer service and retention.
Lending to UK companies was broadly stable, with solid growth to non-property backed trading businesses offset by a reduction in CRE lending.
Our digital customer base continues to grow, 1,100 new active mobile users per day, of which 2 million exclusively use our mobile app in their transactions with us.
Strategy
&
Business
Attributable profit down 21% to £282mn and PBT of £404mn impacted by lower income, higher regulatory
costs and impairment charges for single name cases in GCB.
Cost discipline remains an area of particular focus for management, with targeted actions to reduce the
cost run rate over the year and deliver operational efficiencies.
Market
Environment
&
Financial
System
Delivering for customers in a competitive operating environment
We expect the UK economy to continue to grow in 2018, at a similar pace to 2017.
Banking NIM for 2018 is expected to be lower than in 2017, as a result of ongoing competition in new
mortgage pricing and SVR attrition.
Our gross mortgage lending is expected to be in line with the market, with continued focus on customer
service and retention while delivering operational and digital excellence.
We expect our lending to UK companies to be broadly consistent with growth in the corporate borrowing
market.
Appendix
04
23
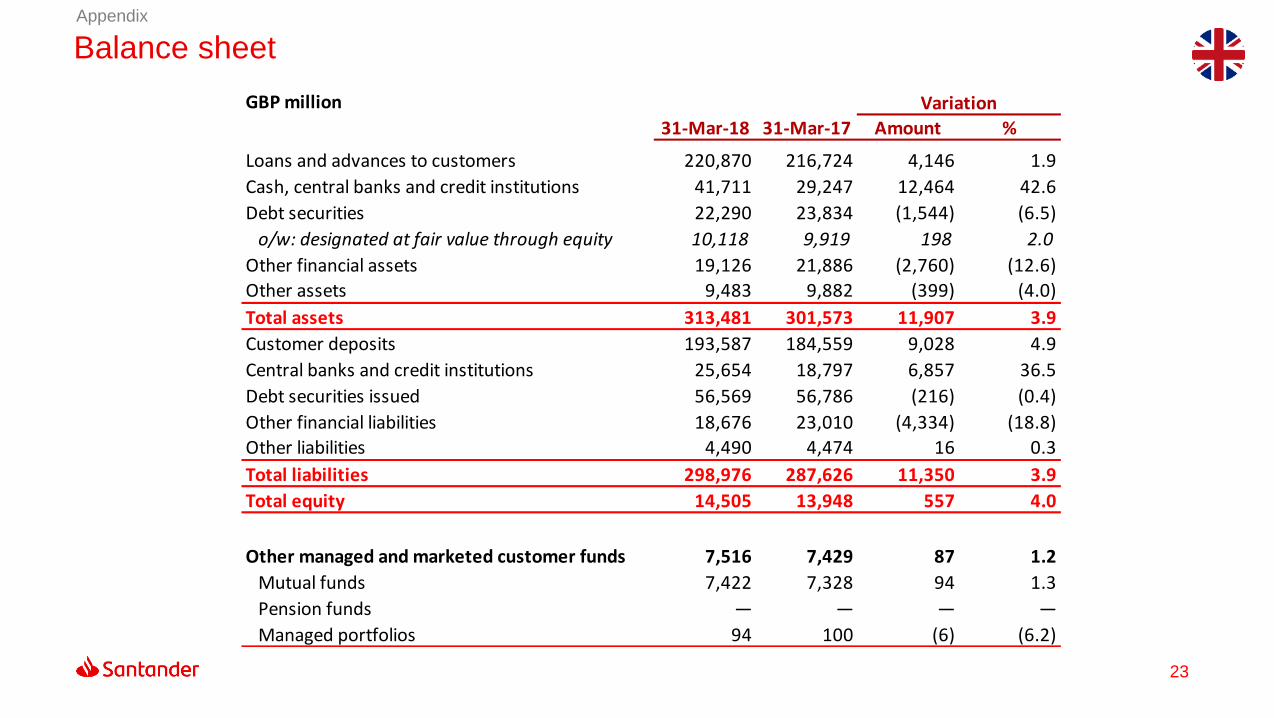
Balance sheetAppendix
GBP million Variation
31-Mar-18 31-Mar-17 Amount %
Loans and advances to customers 220,870 216,724 4,146 1.9
Cash, central banks and credit institutions 41,711 29,247 12,464 42.6
Debt securities 22,290 23,834 (1,544) (6.5)
o/w: designated at fair value through equity 10,118 9,919 198 2.0
Other financial assets 19,126 21,886 (2,760) (12.6)
Other assets 9,483 9,882 (399) (4.0)
Total assets 313,481 301,573 11,907 3.9
Customer deposits 193,587 184,559 9,028 4.9
Central banks and credit institutions 25,654 18,797 6,857 36.5
Debt securities issued 56,569 56,786 (216) (0.4)
Other financial liabilities 18,676 23,010 (4,334) (18.8)
Other liabilities 4,490 4,474 16 0.3
Total liabilities 298,976 287,626 11,350 3.9
Total equity 14,505 13,948 557 4.0
Other managed and marketed customer funds 7,516 7,429 87 1.2
Mutual funds 7,422 7,328 94 1.3
Pension funds — — — —
Managed portfolios 94 100 (6) (6.2)
24
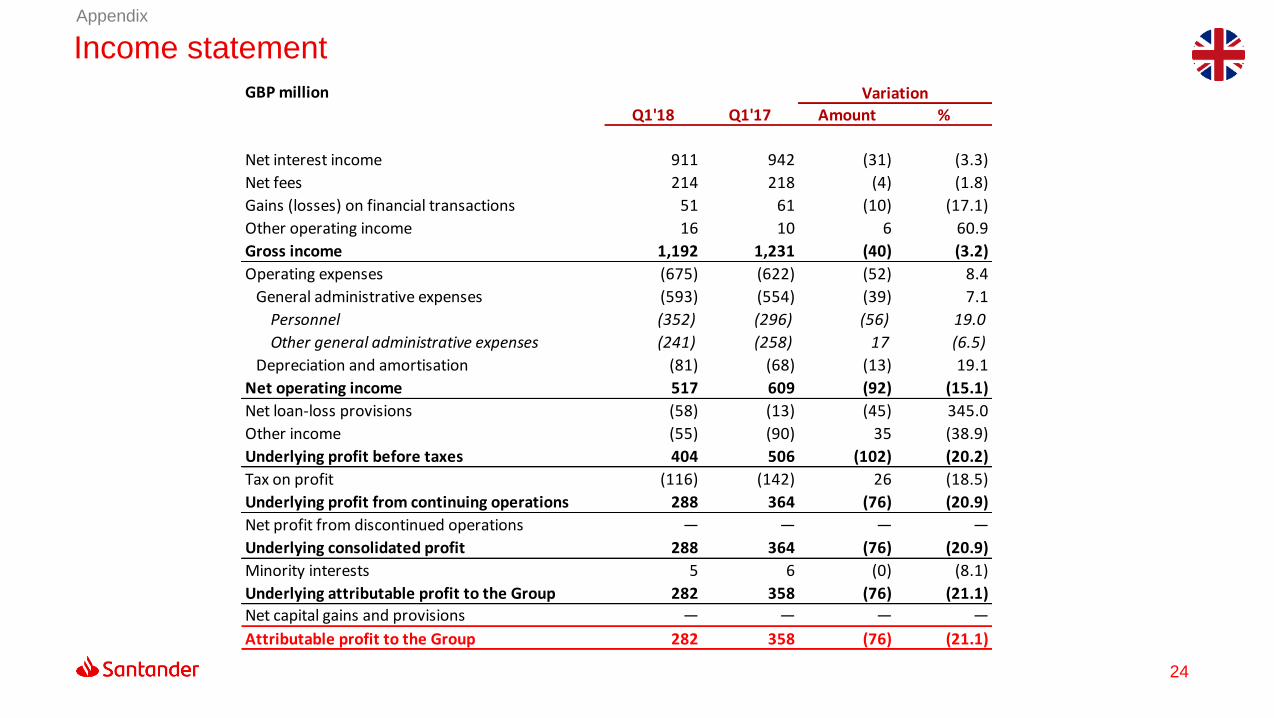
Income statementAppendix
GBP million Variation
Q1'18 Q1'17 Amount %
Net interest income 911 942 (31) (3.3)
Net fees 214 218 (4) (1.8)
Gains (losses) on financial transactions 51 61 (10) (17.1)
Other operating income 16 10 6 60.9
Gross income 1,192 1,231 (40) (3.2)
Operating expenses (675) (622) (52) 8.4
General administrative expenses (593) (554) (39) 7.1
Personnel (352) (296) (56) 19.0
Other general administrative expenses (241) (258) 17 (6.5)
Depreciation and amortisation (81) (68) (13) 19.1
Net operating income 517 609 (92) (15.1)
Net loan-loss provisions (58) (13) (45) 345.0
Other income (55) (90) 35 (38.9)
Underlying profit before taxes 404 506 (102) (20.2)
Tax on profit (116) (142) 26 (18.5)
Underlying profit from continuing operations 288 364 (76) (20.9)
Net profit from discontinued operations — — — —
Underlying consolidated profit 288 364 (76) (20.9)
Minority interests 5 6 (0) (8.1)
Underlying attributable profit to the Group 282 358 (76) (21.1)
Net capital gains and provisions — — — —
Attributable profit to the Group 282 358 (76) (21.1)
25
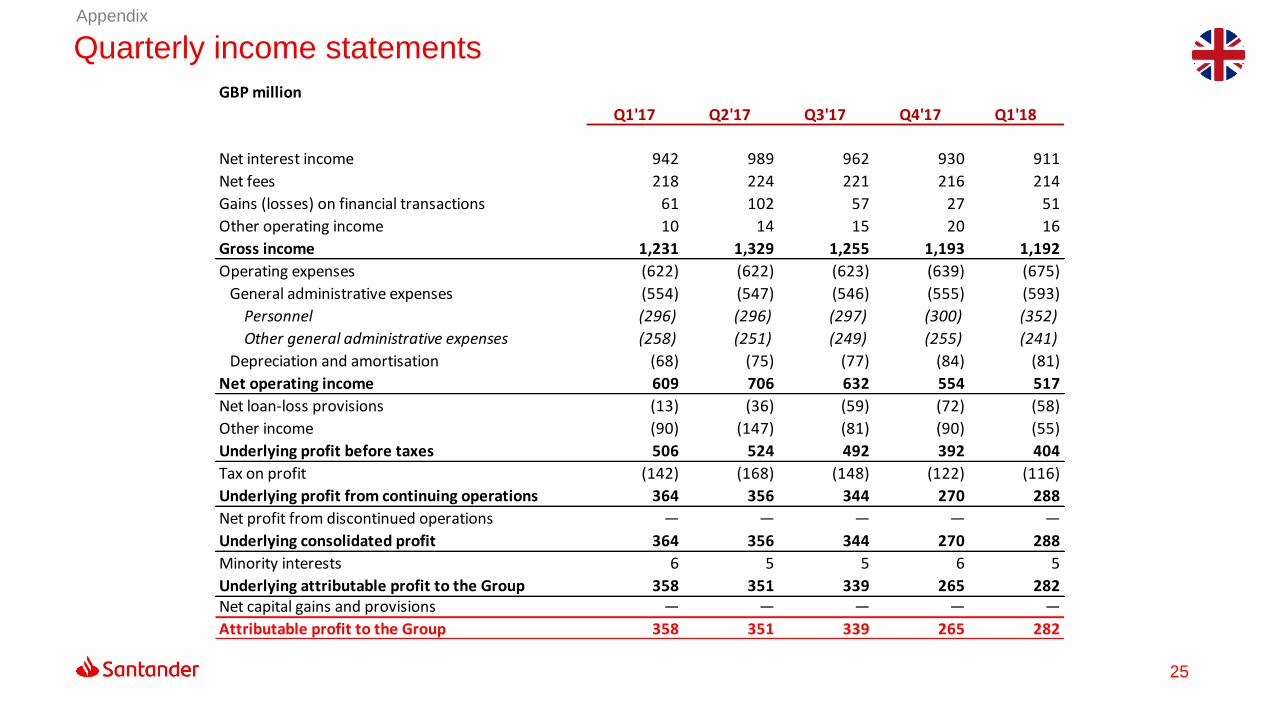
Quarterly income statementsAppendix
GBP million
Q1'17 Q2'17 Q3'17 Q4'17 Q1'18
Net interest income 942 989 962 930 911
Net fees 218 224 221 216 214
Gains (losses) on financial transactions 61 102 57 27 51
Other operating income 10 14 15 20 16
Gross income 1,231 1,329 1,255 1,193 1,192
Operating expenses (622) (622) (623) (639) (675)
General administrative expenses (554) (547) (546) (555) (593)
Personnel (296) (296) (297) (300) (352)
Other general administrative expenses (258) (251) (249) (255) (241)
Depreciation and amortisation (68) (75) (77) (84) (81)
Net operating income 609 706 632 554 517
Net loan-loss provisions (13) (36) (59) (72) (58)
Other income (90) (147) (81) (90) (55)
Underlying profit before taxes 506 524 492 392 404
Tax on profit (142) (168) (148) (122) (116)
Underlying profit from continuing operations 364 356 344 270 288
Net profit from discontinued operations — — — — —
Underlying consolidated profit 364 356 344 270 288
Minority interests 6 5 5 6 5
Underlying attributable profit to the Group 358 351 339 265 282Net capital gains and provisions — — — — —
Attributable profit to the Group 358 351 339 265 282
Thank you.
Our purpose is to help people
and business prosper.
Our culture is based on believing
that everything we do should be:
Recommended