8/11/2019 separacion por dielectroforesis.pdf
http://slidepdf.com/reader/full/separacion-por-dielectroforesispdf 1/10
Separation of Submicron Bioparticles by Dielectrophoresis
Hywel Morgan, Michael P. Hughes, and Nicolas G. GreenBioelectronic Research Centre, Department of Electronic and Electrical Engineering, University of Glasgow, Glasgow G12 8QQ, Scotland
ABSTRACT Submicron particles such as latex spheres and viruses can be manipulated and characterized using dielectro-
phoresis. By the use of appropriate microelectrode arrays, particles can be trapped or moved between regions of high or lowelectric fields. The magnitude and direction of the dielectrophoretic force on the particle depends on its dielectric properties,
so that a heterogeneous mixture of particles can be separated to produce a more homogeneous population. In this paper the
controlled separation of submicron bioparticles is demonstrated. With electrode arrays fabricated using direct write electron
beam lithography, it is shown that different types of submicron latex spheres can be spatially separated. The separation
occurs as a result of differences in magnitude and/or direction of the dielectrophoretic force on different populations of
particles. These differences arise mainly because the surface properties of submicron particles dominate their dielectro-
phoretic behavior. It is also demonstrated that tobacco mosaic virus and herpes simplex virus can be manipulated and
spatially separated in a microelectrode array.
INTRODUCTION
When biological particles are subjected to an AC field, a
dipole moment is induced in the particle. In a diverging field the polarized particles experience a force that can cause
them to move to regions of high or low electric field,
depending on the particle polarizability compared with the
suspending medium. This force was termed dielectrophore-
sis (DEP) by Pohl (1951, 1978). The magnitude of the
dipole moment depends on the polarizability of the particle,
and this in turn is governed by the dielectric properties of
the particle and the medium (Pohl, 1978; Jones, 1995). Thus
by choosing an appropriate medium conductivity and per-
mittivity, particles of similar (but not identical) dielectric
properties can be separated efficiently. For example, similar
bacterial species can be separated from each other by using
gradients in conductivity (Markx et al., 1996). It has also been demonstrated that leukemic cells (Becker et al., 1994),
breast cancer cells (Becker et al., 1995), and CD34 cells
(Stephens et al., 1996) can be separated or enriched from
human blood. Recent work has shown that submicron par-
ticles can be elegantly manipulated using dielectrophoretic
methods. For example, combined electrophoretic and di-
electrophoretic forces have been used to trap and manipu-
late DNA on planar microelectrodes (Washizu and Kuro-
sawa, 1990; Washizu et al., 1995; Asbury and van den
Engh, 1998). An efficient and effective method for the
direct manipulation and separation of submicron particles
could ultimately lead to the development of revolutionary
methods for the analysis of biological material, using inte-
grated microfabricated bioelectronic analysis devices, i.e., a
laboratory on a chip.
In this paper we present evidence that DEP can be used as
a means of separating submicron particles according to their dielectric properties. Using microfabricated electrodes, we
show that at the correct frequency and medium conductiv-
ity, submicron latex particles can be separated according to
their surface charge properties and that two viruses, tobacco
mosaic virus and herpes simplex virus, can be separated.
THEORY
Hydrodynamics
A particle in fluid experiences a drag force, given by Stokes
law as FDrag f v, where f is the friction factor of the
particle. A particle less than 10 m in diameter movingunder the influence of a force F can be considered to always
move at the terminal velocity given by F/ f . For low Reyn-
olds numbers, the friction factor for a spherical particle is
given by f 6r , where r is the hydrodynamic radius of
the particle, v is the particle velocity, and is the viscosity
of the medium.
Dielectrophoresis
The time-averaged DEP force is (Jones, 1995)
FDEP 2 r 3mRe K E rms2 (1)
where E rms is the rms electric field, r is the particle radius,
is the angular field frequency, and Re{ } indicates the
real part of. The factor K ( ) is a measure of the effective
polarizability of the particle (the Clausius-Mossotti factor),
given by
K * p *m
* p *m (2)
where * p and *
m are the complex permittivities of the
particle and the medium, respectively. The complex permit-
tivity is defined as * j ( / ), where j 1, is
Received for publication 29 December 1998 and in final form 6 April 1999.
Address reprint requests to Dr. Hywel Morgan, Bioelectronic Research
Centre, Department of Electronic and Electrical Engineering, University of
Glasgow, Glasgow G12 8QQ, Scotland. Tel.: 44-141-330-5237; Fax: 44-
141-330-4907; E-mail: [email protected].
© 1999 by the Biophysical Society
0006-3495/99/07/516/10 $2.00
516 Biophysical Journal Volume 77 July 1999 516 –525

8/11/2019 separacion por dielectroforesis.pdf
http://slidepdf.com/reader/full/separacion-por-dielectroforesispdf 2/10
the permittivity, and is the conductivity of the dielectric.
For the case of a multishelled particle, the polarizability can
be determined using the smeared-out or multishell model
(Irimajiri et al., 1979; Huang et al., 1992).
The Clausius-Mossotti factor not only depends on the
dielectric properties of the particle and medium, but also on
the frequency of the applied field. Variations in this factor
give rise to a dielectrophoretic force that is frequency de-
pendent and unique to a particular particle type. For a
sphere, the real part of K ( ) is bounded by the limits 1 Re{ K ( )}
1
2 and varies with the frequency of the
applied field and the complex permittivity of the medium.
Positive DEP occurs when Re{ K ( )} 0, the force is
toward the high electric field, and the particles collect at the
electrode edges. The converse of this is negative DEP,
which occurs when Re{ K ( )} 0, the force is in the
direction of decreasing field strength, and the particles are
repelled from the electrode edge.
Ignoring Brownian motion and the buoyancy force, the
equation of motion can be written as
md v
d t FDEP FDrag (3)
For small particles (low Reynolds numbers) the instanta-
neous velocity is proportional to the instantaneous dielec-
trophoretic force, so that v (FDEP/ f ), or substituting for
FDEP,
v2 r 3mRe K E rms
2
f (4)
so that for a spherical particle the dielectrophoretic mobility
is given by
uDEP r 2mRe K
3 (5)
in the direction of E 2. It can be seen that for a spherical
particle the dielectrophoretic mobility depends on the sur-
face area of the particle, together with the real component of
the polarizability. Thus DEP could potentially be used to
achieve highly controlled selective separation of particles.
Fluid heating
As indicated by Eq. 5, the dielectrophoretic mobility of a particle scales directly with the surface area, so that to
manipulate small particles (1 m diameter), larger elec-
tric field gradients are required. The use of microfabricated
electrodes as a means of generating high electric fields has
meant that the dielectrophoretic movement of submicron
particles has now been established beyond doubt (Washizu
et al., 1994; Schnelle et al., 1996; Muller et al., 1996;
Morgan and Green, 1997; Green et al., 1997). However,
Joule heating of the fluid occurs, which in certain circum-
stance can give rise to fluid motion that generates additional
Stokes forces on the particles.
For a conducting fluid, the power generated (per unit
volume) is given by W E2 (Wm3). In dielectro-
phoretic systems, microelectrode arrays are used so that the
volume in which this heat is generated is very small, and
typical power dissipation is in the range of 1–10 mW.
Thermal equilibrium is achieved rapidly, within 1 ms of
application of the electric field (Ramos et al., 1998), and
both calculations and measurements show that for low con-
ductivity media the steady-state temperature rise is small
and not sufficient to denature biological samples.
As an example, it has been shown that for the simple case
of an interdigitated electrode geometry in contact with a
medium of conductivity 0.01 Sm1 (with 20 V peak to peak
applied), the steady-state temperature rise can be calculated
to be 6°C (Ramos et al., 1998). This can be compared with
a value of 2°C measured within 250 m of the electrodes.
In most cases such temperature increments are unlikely to
result in the loss of biological activity. However, the tem-
perature rise is proportional to medium conductivity, so that
for 100 mM phosphate buffer ( m 1 Sm1), the temper-
ature rise would approach 100°C for the same applied voltage, which is clearly sufficient to cause degradation of
the sample. Reducing the dimensions of the system means
that the voltage required to produce a given electric field
strength is lower, and as a result both the power dissipation
and the temperature increment are reduced. Thus it can
clearly be seen that to achieve the controlled dielectro-
phoretic manipulation of submicron particles without caus-
ing a localized temperature rise, small-feature-size micro-
electrodes must be used.
The heat generation and dissipation are nonuniform, so
that gradients in the conductivity and/or permittivity of the
suspending medium occur, and these discontinuities pro-
duce volume forces on the liquid (Stratton, 1941), which are
referred to as the electrothermal force. The conductivity
gradient produces free volume charge and gives rise to the
Coulomb force, and the permittivity gradient produces the
dielectric force. In different frequency ranges either the
Coulomb or the dielectric force dominates, and the transi-
tion from one to the other occurs at a frequency f c, given by
(Ramos et al., 1998)
c 2 f c 1
2
T
T
1/2
(6)
where (/ ) is the charge relaxation time of the liquid;
(1/ ) ( /T ) and (1/) (/T ) are the normalized temper-
ature dependence of the conductivity and permittivity of the
medium, respectively. (For water, (1/ ) ( /T ) 2% per
degree and (1/) (/T ) 0.4% per degree (Lide, 1994).)
At the frequency given by Eq. 6, the electrothermal force
will have a minimal effect on the dielectrophoretic manip-
ulation/separation of the particles. Thus optimal separation
of submicron particles can be achieved by choosing a fre-
quency at or close to f c.
Morgan et al. Dielectrophoresis of Submicron Particles 517
8/11/2019 separacion por dielectroforesis.pdf
http://slidepdf.com/reader/full/separacion-por-dielectroforesispdf 3/10
MATERIALS AND METHODS
Electrode fabrication
For particle manipulation and separation, electrodes of the polynomial and
castellated design were used (Huang and Pethig, 1991; Price et al., 1988;
Pethig et al., 1992). Electrodes were constructed on glass substrates, using
direct-write electron beam lithography. The electrodes were fabricated by
writing the pattern onto quartz mask plates (Hoya), using a Leica EBPG
HR5 beamwriter, operating at 50 kV. After development of the resist, metal(titanium/palladium/gold) was evaporated onto the exposed mask plate.
Lift-off in acetone was used to complete the electrode. Although the
dimensions of the electrodes are not submicron, electron beam lithographic
methods guarantee precise and controlled electrode geometry at 50-nm
scale resolution, so that the electric field configuration is well reproduced.
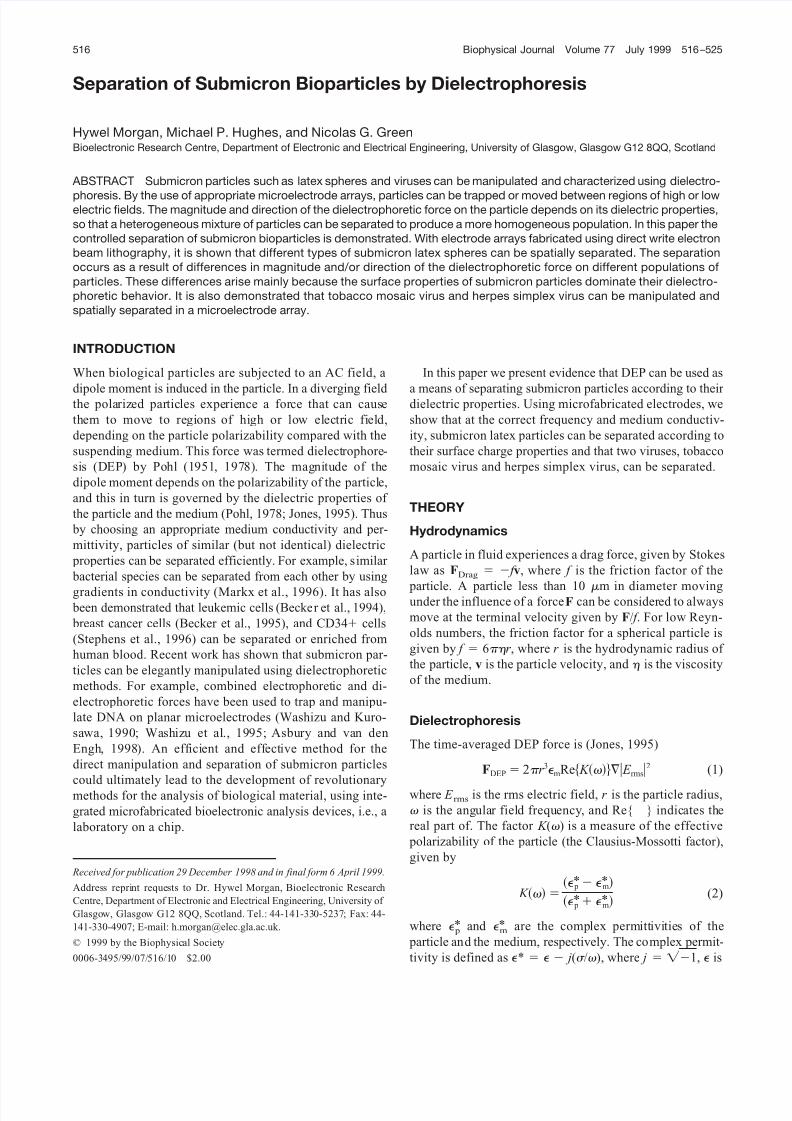
Photographs of the two electrodes used in this work are shown in Fig.
1. The polynomial electrode is shown in Fig. 1 a, and this design generates
a high electric field along all of the electrode edges, with a minimum in the
field at the center. Thus particles experiencing positive DEP will move to
the electrode edges, and those experiencing negative DEP will move into
the center, where, if they have negative buoyancy, they will remain
trapped. The castellated electrodes (Fig. 1 b) produce regions of high
electric field along the tips of the castellations and well-defined regions of
minimum electric field in the bays between the tips, as shown in the figure.
Further details of the 3-D electric field distribution for these electrodes
have been published elsewhere (Wang et al., 1993; Green et al., 1997;
Green and Morgan, 1997).
Latex spheres
Carboxylate-modified latex spheres were obtained from Molecular Probes
(Eugene, OR). The spheres had a net negative charge and were supplied
preloaded with a fluorescent dye. Particles with diameters of 216, 282, and
557 nm were used as supplied by the manufacturer and resuspended in 0.1
mM KCl at a particle concentration of 2 106 v/v.
For some experiments a monolayer of protein (IgG) was immobilized
on the latex particles according to the following method. Two hundred fifty
microliters of microspheres at 2% w/v was mixed with 500 l of 10%
(w/v) 1-ethyl-3-(3-dimethylaminopropyl) carbodiimide (EDAC) solution
and 250 l 50 mM KH2PO4. The solution was incubated for 30 min atroom temperature, then dialyzed against 0.1 M Borax solution for 1 h. Two
hundred fifty microliters of 10 mg/ml protein (mouse IgG) was then added
to the dialyzed spheres, and the solution was incubated for 2–4 h at room
temperature. One hundred microliters of 1 M glycine was added to stop the
reaction, and the protein-functionalized spheres were further purified, by
either centrifugation or dialysis.
Virus preparation
Tobacco mosaic virus (TMV) and herpes simplex virus (HSV) type 1 were
used as model biological particles. TMV is a plant virus; it is a 280-nm-
long protein tube surrounding a core of RNA (Mathews, 1981). HSV-1 is
one of the largest mammalian viruses and is a spherical enveloped DNA-
containing particle of 250 nm diameter (Whitley, 1996). The preparation
and fluorescent labeling of both TMV and HSV has been reported else-
where (Green et al., 1997; Hughes et al., 1998).
Dielectrophoresis separation experiments
Particles for DEP separation experiments were prepared from stock solu-
tion by centrifugation and resuspension in an appropriate buffer. A micro-
liter volume chamber was constructed around the electrode, using glass
spacers and adhesives. The chamber had a depth of 50 m and a sample
volume on the order of 1 l. Virus solution was pipetted into the chamber,
and the assembly was sealed with a coverslip. The electrodes were ener-
gized using a signal generator providing 20-V peak-to-peak sinusoidal
signals over the frequency range 1 kHz to 20 MHz. Potentials were applied
with a 180° phase difference between adjacent electrodes. Particle move-
ment was observed with a Nikon Microphot microscope, a Photonic
Science Isis II image-intensifying camera, and a Sony S-VHS video re-
corder. Photographs were also taken with 3200 ASA color film. Conduc-
tivity measurements were performed with a Hewlett-Packard 4192A im-
pedance analyzer and a Sentek conductivity cell in the frequency range 100
kHz to 1 MHz.
FIGURE 1 Photograph showing the two types of electrodes used in this
work. (a) A polynomial electrode. (b) A section of the repeat pattern of a
castellated electrode. The electrodes are fabricated using direct write elec-
tron beam lithography and consist of a Ti/Pd/Au layer on a glass substrate.
The dimensions of the polynomial electrode are 2 m between adjacent
arms and 6 m across the center, and the characteristic dimensions of the
castellations vary between 1 and 15 m.
518 Biophysical Journal Volume 77 July 1999
8/11/2019 separacion por dielectroforesis.pdf
http://slidepdf.com/reader/full/separacion-por-dielectroforesispdf 4/10
DEP force calculations
Latex particles
The dielectrophoretic response of the latex particle is governed by the
Clausius-Mossotti factor (Eq. 2). For submicron particles the response is
dominated by the particle conductivity, which in turn is governed by the
surface charge on the particle. The conductivity of a latex particle can be
written as the sum of the bulk conductivity and the surface conductivity,
i.e., p
b
(2 K s/r ) (Arnold et al., 1987), where K s is the surfaceconductance and b is the bulk conductivity (approximately zero for latex).
The surface conductivity of the three sizes of particles used in this work
have been calculated previously (Green and Morgan, 1997; Green and
Morgan, 1999), so that by using Eq. 2, the polarizability and thus the force
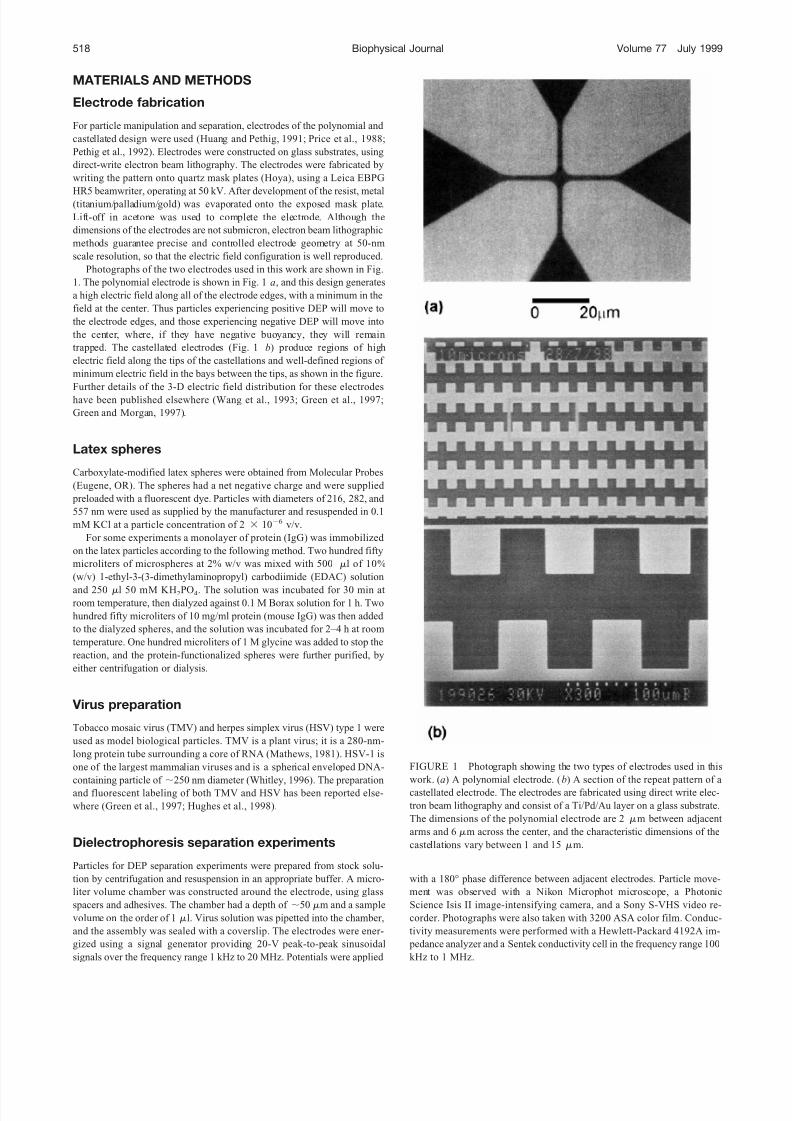
on each particle can be calculated. Fig. 2 a shows the frequency depen-
dence of the Clausius-Mossotti factor for the 216-nm and 557-nm particles
with the particle permittivity p 2.55 and a medium conductivity m
1 mSm1. For this calculation the surface conductance of the particle was
set at 2.32 nS. It can be seen that in the frequency range between 3 and 7
MHz, the 216-nm particles experience positive DEP, whereas the 557-nm
particles experience negative DEP, so that the two particle types could be
spatially separated. Although the polarization factor for the 216-nm particle
is greater, it can be seen from Fig. 2 b that the dielectrophoretic mobility
is greater for the 557-nm particle. Thus in a dynamic flow-through sepa-
ration system with constant field gradient (and at low frequencies), the
larger particles would elute ahead of the smaller particles.
Virus
HSV is a spherical enveloped particle, and consequently the frequency-
dependent force on the particle follows the trend predicted using the
single-shell model (Hughes et al., 1998) and Eq. 2. TMV is rod-shaped, and
in this case, assuming that the particle is aligned with the field, the DEP
force can be written as (Morgan and Green, 1997)
FDEP a2b
3 mRe* p *m
*mE2 (7)
where a is the radius of the rod and b is the half-length.
It has been shown that the TMV particle can be approximated to a solid
homogeneous dielectric cylinder with a particle relative permittivity p
55 and conductivity p
0.085 Sm
1
(Morgan and Green, 1997). Incontrast, HSV consists of a conducting core surrounded by an insulating
membrane (similar to a cell). Experiments have shown (Hughes et al.,
1998) that to a first approximation HSV can be modeled as a single-shelled
dielectric sphere, with an internal permittivity i 70 and conductivity
i 8 mSm1, surrounded by an insulating membrane with a permittivity
mem 10, bulk conductivity mem 108 Sm1, and surface conduc-
tance K s 3.5 nS.
Using the above parameters, a plot of the frequency variation of the
polarization factor, estimated from Eq. 2 for HSV and Eq. 7 for TMV, was
calculated as a function of frequency at a medium conductivity of 10
mSm1. The results are shown in Fig. 3. It can be seen that in the frequency
range shown, the force on the TMV remains positive (the virus is always
more polarizable than the medium), whereas for HSV for frequencies up to
4 MHz the force is positive but then goes negative. Although this figure
FIGURE 2 (a) A plot of the Clausius-Mossotti factor versus frequency
for 216-nm- (– – –) and 557-nm-diameter (——) latex particles with a
particle permittivity p 2.55 and a medium conductivity m 1 mSm1.
The surface conductance was set at 2.32 nS for both particles. (b) A plot of
the dielectrophoretic mobility for the 216-nm- (– – –) and 557-nm-diame-
ter (——) particles calculated from Eq. 5. Particle permittivity p 2.55,
and medium conductivity m 1 mSm1. The surface conductance was
set at 2.32 nS for both particles.
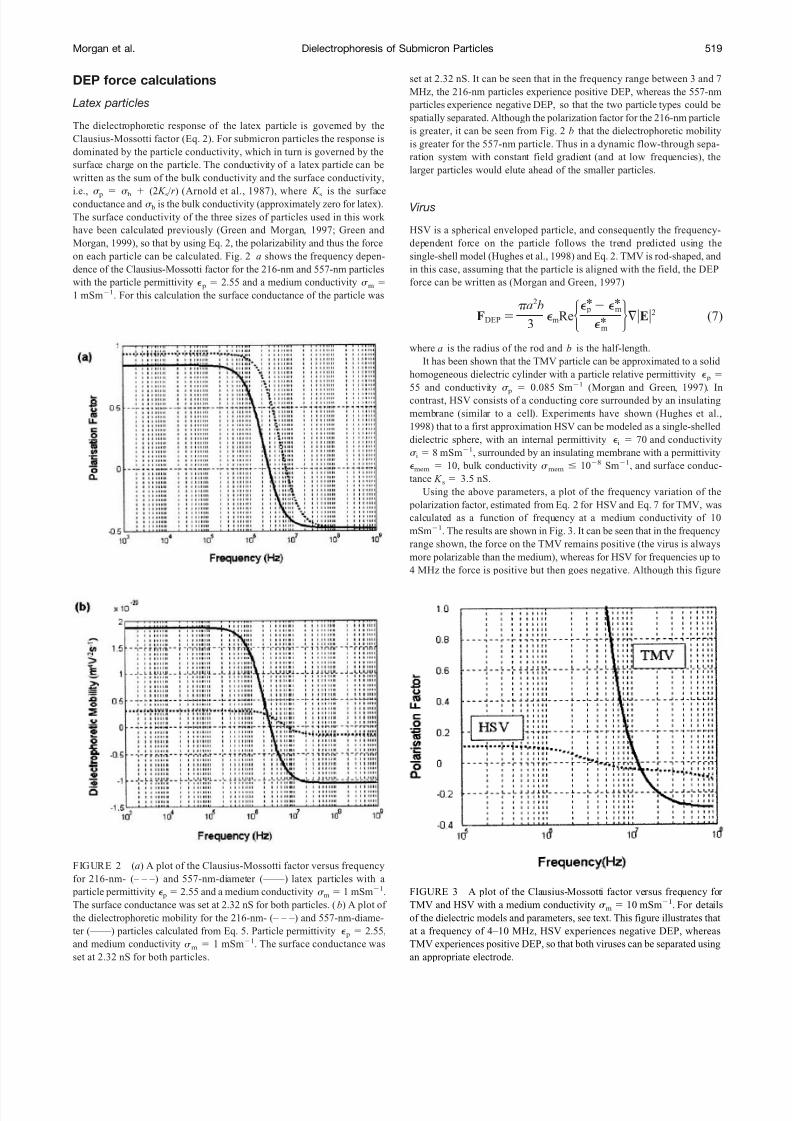
FIGURE 3 A plot of the Clausius-Mossotti factor versus frequency for
TMV and HSV with a medium conductivity m 10 mSm1. For details
of the dielectric models and parameters, see text. This figure illustrates that
at a frequency of 4–10 MHz, HSV experiences negative DEP, whereas
TMV experiences positive DEP, so that both viruses can be separated using
an appropriate electrode.
Morgan et al. Dielectrophoresis of Submicron Particles 519
8/11/2019 separacion por dielectroforesis.pdf
http://slidepdf.com/reader/full/separacion-por-dielectroforesispdf 5/10
does not show the absolute force on the virus particles, it does represent the
direction and frequency variation of the force. This figure shows that for
any frequency in the range 4–10 MHz, the two viruses should respond in
completely different directions to the electric field, with TMV experiencing
positive DEP and HSV experiencing negative DEP, implying that the
spatial separation of the two species should be possible.
RESULTS
Dielectrophoretic manipulation
Latex particles
The frequency-dependent dielectrophoretic properties of
submicron latex particles have been well characterized
(Green and Morgan, 1997, 1999). Their response is domi-
nated by surface charge effects, and at low conductivities
the particles exhibit almost exclusively positive DEP,
changing to negative DEP at frequencies above the Max-
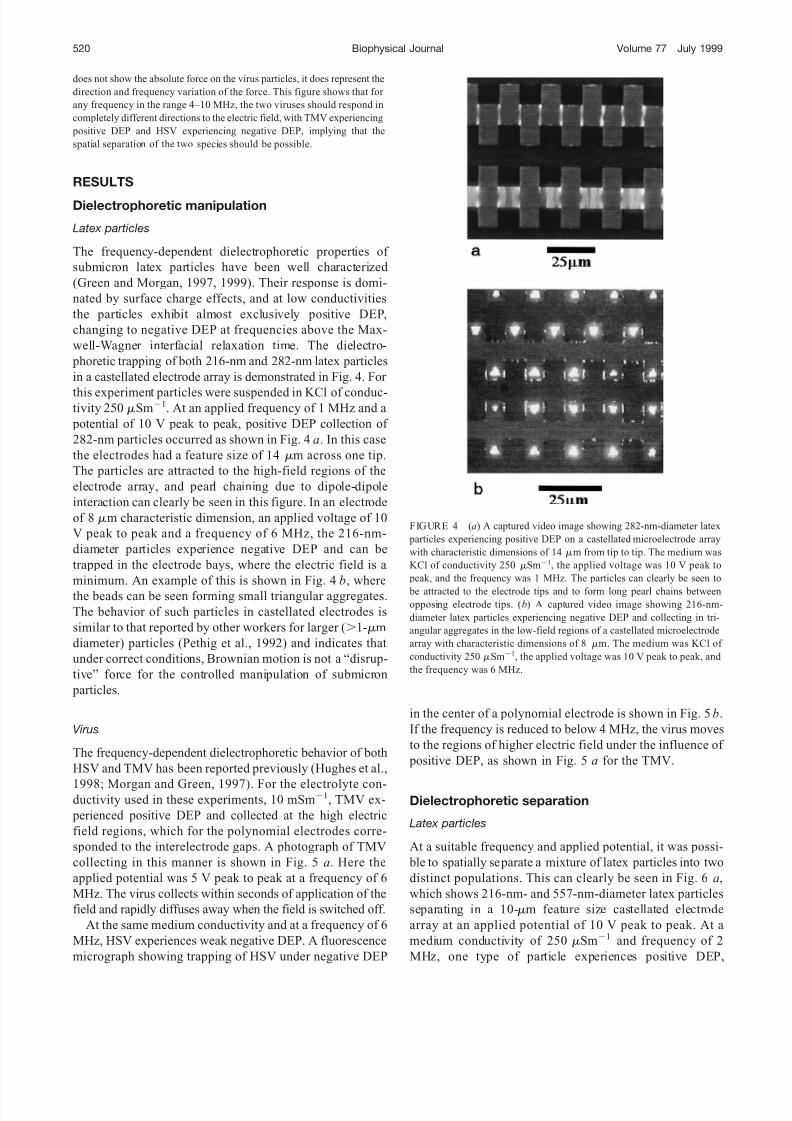
well-Wagner interfacial relaxation time. The dielectro-
phoretic trapping of both 216-nm and 282-nm latex particles
in a castellated electrode array is demonstrated in Fig. 4. For
this experiment particles were suspended in KCl of conduc-tivity 250 Sm1. At an applied frequency of 1 MHz and a
potential of 10 V peak to peak, positive DEP collection of
282-nm particles occurred as shown in Fig. 4 a. In this case
the electrodes had a feature size of 14 m across one tip.
The particles are attracted to the high-field regions of the
electrode array, and pearl chaining due to dipole-dipole
interaction can clearly be seen in this figure. In an electrode
of 8 m characteristic dimension, an applied voltage of 10
V peak to peak and a frequency of 6 MHz, the 216-nm-
diameter particles experience negative DEP and can be
trapped in the electrode bays, where the electric field is a
minimum. An example of this is shown in Fig. 4 b, where
the beads can be seen forming small triangular aggregates.
The behavior of such particles in castellated electrodes is
similar to that reported by other workers for larger (1-m
diameter) particles (Pethig et al., 1992) and indicates that
under correct conditions, Brownian motion is not a “disrup-
tive” force for the controlled manipulation of submicron
particles.
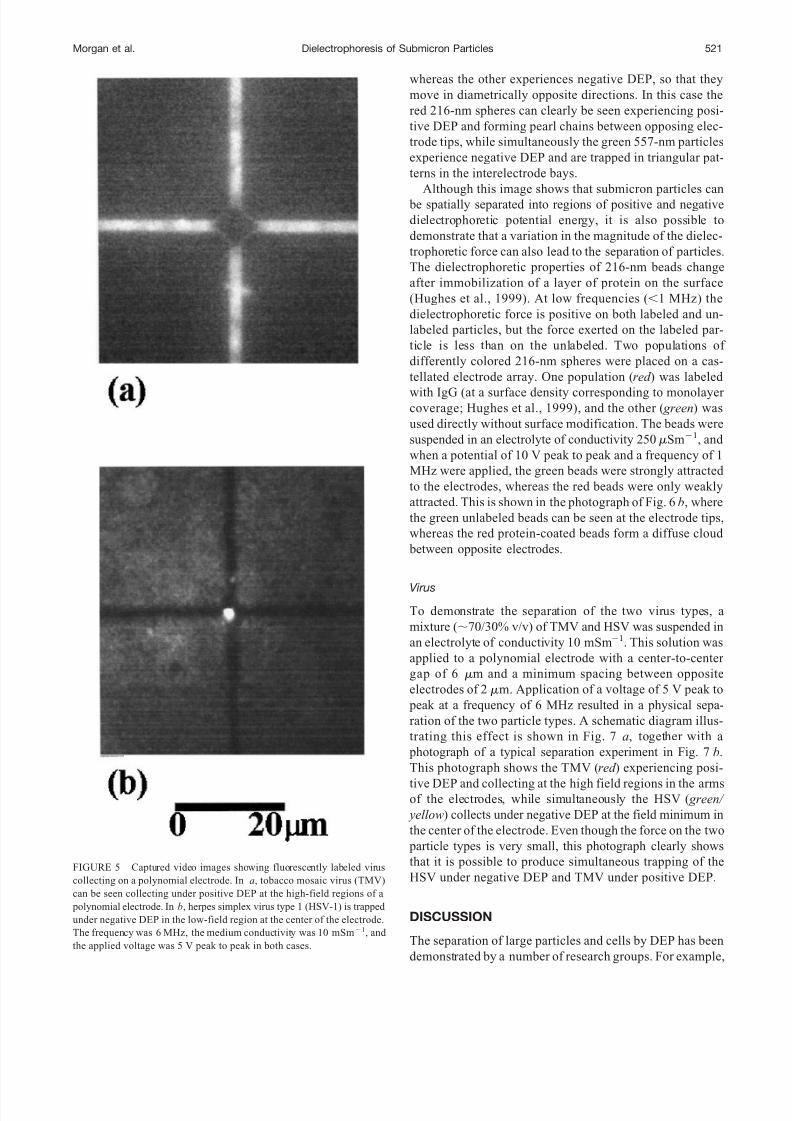
Virus
The frequency-dependent dielectrophoretic behavior of both
HSV and TMV has been reported previously (Hughes et al.,
1998; Morgan and Green, 1997). For the electrolyte con-ductivity used in these experiments, 10 mSm1, TMV ex-
perienced positive DEP and collected at the high electric
field regions, which for the polynomial electrodes corre-
sponded to the interelectrode gaps. A photograph of TMV
collecting in this manner is shown in Fig. 5 a. Here the
applied potential was 5 V peak to peak at a frequency of 6
MHz. The virus collects within seconds of application of the
field and rapidly diffuses away when the field is switched off.
At the same medium conductivity and at a frequency of 6
MHz, HSV experiences weak negative DEP. A fluorescence
micrograph showing trapping of HSV under negative DEP
in the center of a polynomial electrode is shown in Fig. 5 b.
If the frequency is reduced to below 4 MHz, the virus moves
to the regions of higher electric field under the influence of
positive DEP, as shown in Fig. 5 a for the TMV.
Dielectrophoretic separation
Latex particles
At a suitable frequency and applied potential, it was possi-
ble to spatially separate a mixture of latex particles into two
distinct populations. This can clearly be seen in Fig. 6 a,
which shows 216-nm- and 557-nm-diameter latex particles
separating in a 10-m feature size castellated electrode
array at an applied potential of 10 V peak to peak. At a
medium conductivity of 250 Sm1 and frequency of 2
MHz, one type of particle experiences positive DEP,
FIGURE 4 (a) A captured video image showing 282-nm-diameter latex
particles experiencing positive DEP on a castellated microelectrode array
with characteristic dimensions of 14 m from tip to tip. The medium was
KCl of conductivity 250 Sm1, the applied voltage was 10 V peak to
peak, and the frequency was 1 MHz. The particles can clearly be seen to
be attracted to the electrode tips and to form long pearl chains betweenopposing electrode tips. (b) A captured video image showing 216-nm-
diameter latex particles experiencing negative DEP and collecting in tri-
angular aggregates in the low-field regions of a castellated microelectrode
array with characteristic dimensions of 8 m. The medium was KCl of
conductivity 250 Sm1, the applied voltage was 10 V peak to peak, and
the frequency was 6 MHz.
520 Biophysical Journal Volume 77 July 1999
8/11/2019 separacion por dielectroforesis.pdf
http://slidepdf.com/reader/full/separacion-por-dielectroforesispdf 6/10
whereas the other experiences negative DEP, so that they
move in diametrically opposite directions. In this case the
red 216-nm spheres can clearly be seen experiencing posi-
tive DEP and forming pearl chains between opposing elec-
trode tips, while simultaneously the green 557-nm particles
experience negative DEP and are trapped in triangular pat-
terns in the interelectrode bays.
Although this image shows that submicron particles can
be spatially separated into regions of positive and negative
dielectrophoretic potential energy, it is also possible to
demonstrate that a variation in the magnitude of the dielec-
trophoretic force can also lead to the separation of particles.
The dielectrophoretic properties of 216-nm beads change
after immobilization of a layer of protein on the surface
(Hughes et al., 1999). At low frequencies (1 MHz) the
dielectrophoretic force is positive on both labeled and un-
labeled particles, but the force exerted on the labeled par-
ticle is less than on the unlabeled. Two populations of
differently colored 216-nm spheres were placed on a cas-
tellated electrode array. One population (red ) was labeled
with IgG (at a surface density corresponding to monolayer coverage; Hughes et al., 1999), and the other ( green) was
used directly without surface modification. The beads were
suspended in an electrolyte of conductivity 250 Sm1, and
when a potential of 10 V peak to peak and a frequency of 1
MHz were applied, the green beads were strongly attracted
to the electrodes, whereas the red beads were only weakly
attracted. This is shown in the photograph of Fig. 6 b, where
the green unlabeled beads can be seen at the electrode tips,
whereas the red protein-coated beads form a diffuse cloud
between opposite electrodes.
Virus
To demonstrate the separation of the two virus types, a
mixture (70/30% v/v) of TMV and HSV was suspended in
an electrolyte of conductivity 10 mSm1. This solution was
applied to a polynomial electrode with a center-to-center
gap of 6 m and a minimum spacing between opposite
electrodes of 2 m. Application of a voltage of 5 V peak to
peak at a frequency of 6 MHz resulted in a physical sepa-
ration of the two particle types. A schematic diagram illus-
trating this effect is shown in Fig. 7 a, together with a
photograph of a typical separation experiment in Fig. 7 b.
This photograph shows the TMV (red ) experiencing posi-
tive DEP and collecting at the high field regions in the armsof the electrodes, while simultaneously the HSV ( green/
yellow) collects under negative DEP at the field minimum in
the center of the electrode. Even though the force on the two
particle types is very small, this photograph clearly shows
that it is possible to produce simultaneous trapping of the
HSV under negative DEP and TMV under positive DEP.
DISCUSSION
The separation of large particles and cells by DEP has been
demonstrated by a number of research groups. For example,
FIGURE 5 Captured video images showing fluorescently labeled virus
collecting on a polynomial electrode. In a, tobacco mosaic virus (TMV)
can be seen collecting under positive DEP at the high-field regions of a
polynomial electrode. In b, herpes simplex virus type 1 (HSV-1) is trapped
under negative DEP in the low-field region at the center of the electrode.
The frequency was 6 MHz, the medium conductivity was 10 mSm1, and
the applied voltage was 5 V peak to peak in both cases.
Morgan et al. Dielectrophoresis of Submicron Particles 521
8/11/2019 separacion por dielectroforesis.pdf
http://slidepdf.com/reader/full/separacion-por-dielectroforesispdf 7/10
the spatial separation of particles on a microelectrode struc-
ture has been demonstrated for a range of microorganisms
(Wang et al., 1993; Markx et al., 1994b) and mammalian
cells (Becker et al., 1994; Gascoyne et al., 1992). Batch
separation methods have been proposed in which weakly
held particles are carried out of the electrode system by fluid
flow (Markx and Pethig, 1995; Markx et al., 1996; Talary et
al., 1995). Furthermore, DEP combined with field-flow
fractionation methods have been employed for continuous
particle separation systems (Markx et al., 1997; Wang et al.,
1998). The combination of field-flow fractionation with
DEP has recently been demonstrated to be a useful method
for enhancing the separation efficiency of a particle sepa-
rator. Indeed, Washizu et al. (1994) used a combination of
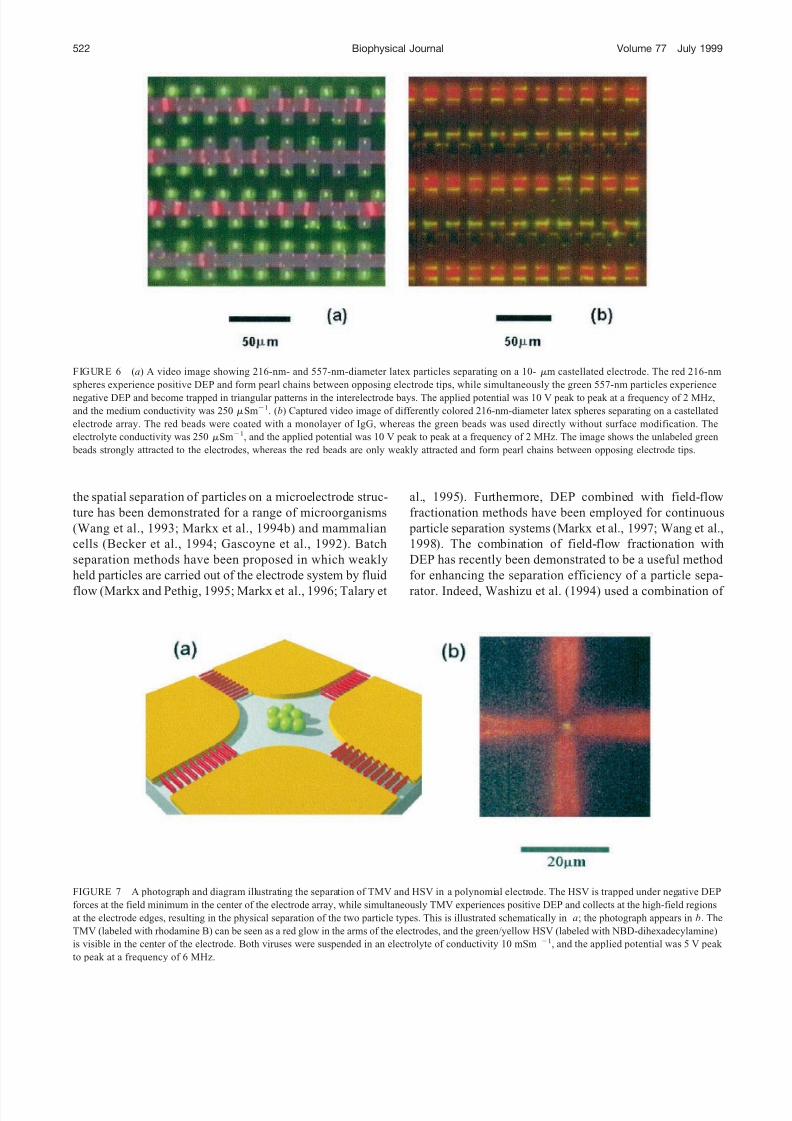
FIGURE 6 (a) A video image showing 216-nm- and 557-nm-diameter latex particles separating on a 10- m castellated electrode. The red 216-nm
spheres experience positive DEP and form pearl chains between opposing electrode tips, while simultaneously the green 557-nm particles experience
negative DEP and become trapped in triangular patterns in the interelectrode bays. The applied potential was 10 V peak to peak at a frequency of 2 MHz,
and the medium conductivity was 250 Sm1. (b) Captured video image of differently colored 216-nm-diameter latex spheres separating on a castellated
electrode array. The red beads were coated with a monolayer of IgG, whereas the green beads was used directly without surface modification. The
electrolyte conductivity was 250 Sm1, and the applied potential was 10 V peak to peak at a frequency of 2 MHz. The image shows the unlabeled green
beads strongly attracted to the electrodes, whereas the red beads are only weakly attracted and form pearl chains between opposing electrode tips.
FIGURE 7 A photograph and diagram illustrating the separation of TMV and HSV in a polynomial electrode. The HSV is trapped under negative DEP
forces at the field minimum in the center of the electrode array, while simultaneously TMV experiences positive DEP and collects at the high-field regions
at the electrode edges, resulting in the physical separation of the two particle types. This is illustrated schematically in a; the photograph appears in b. The
TMV (labeled with rhodamine B) can be seen as a red glow in the arms of the electrodes, and the green/yellow HSV (labeled with NBD-dihexadecylamine)
is visible in the center of the electrode. Both viruses were suspended in an electrolyte of conductivity 10 mSm 1, and the applied potential was 5 V peak
to peak at a frequency of 6 MHz.
522 Biophysical Journal Volume 77 July 1999
8/11/2019 separacion por dielectroforesis.pdf
http://slidepdf.com/reader/full/separacion-por-dielectroforesispdf 8/10
dielectrophoretic forces and fluid flow to demonstrate sep-
aration of proteins. More recently, the controlled separation
of a range of micron-sized latex particles with differing
surface functionality has been demonstrated through com-
bined DEP and gravitational field-flow fractionation meth-
ods (Wang et al., 1998).
In the original work of Davis and Giddings (1986) it was
proposed that field-flow fractionation could be used in
combination with DEP forces and diffusion forces to sepa-
rate submicron particles. For a collection of submicron
particles in equilibrium, the effects of Brownian motion
give rise to an additional energy that can disturb the system.
Until recently it was considered that the deterministic move-
ment of submicron particles by dielectrophoretic forces
alone could not be achieved at realizable electric field
strengths (Pohl, 1978). This presumption was based on the
argument that the force required to move submicron parti-
cles had to overcome a diffusion barrier. However, it has
now been shown that even proteins can be manipulated by
dielectrophoretic forces (Washizu et al., 1994). To control
the movement of particles smaller than 1 m, the applied force must be of sufficient magnitude such that the force
that arises from the thermal energy of the system (and which
gives rise to Brownian motion) is of secondary importance.
In this work we have shown that the positive and negative
dielectrophoretic collection of submicron particles can be
accomplished by using suitable electrode arrays and that the
general behavior is similar to that reported for larger parti-
cles. For example, at the correct frequencies and voltages
particles can be seen to collect at the high electric field
regions of electrode edges and to form pearl chains (Fig. 4
a). At higher frequencies particles can also be trapped by
negative dielectrophoretic forces in small triangular aggre-
gates (Fig. 4 b) similar to the patterns reported for larger
particles such as cells and bacteria (Pethig et al., 1992).
Significantly, through appropriate choice of medium con-
ductivity, applied frequency, and voltage, the photographs
of Figs. 6 and 7 show that submicron particles and viruses
can be spatially separated on a microelectrode array. How-
ever, the successful manipulation of such small particles
does require the use of high electric fields generated in
small volumes, which inevitably leads to the generation of
heat in the system. Although natural convection is negligi-
ble (Ramos et al., 1998), the high electric field gives rise to
volume forces on the liquid (the electrothermal force). Gen-
erally at field strengths in the range of 105
to 106
Vm1
, our observations indicate that although these forces are present
and give rise to fluid motion, the influence is less than the
dielectrophoretic force acting on the particles (Ramos et al.,
1998).
Theoretical predictions indicate that the electrothermal
force should tend to zero at a frequency corresponding
approximately to the charge relaxation time of the liquid,
given exactly by Eq. 6. Thus if dielectrophoretic separation
were to be performed at this frequency, the electrothermally
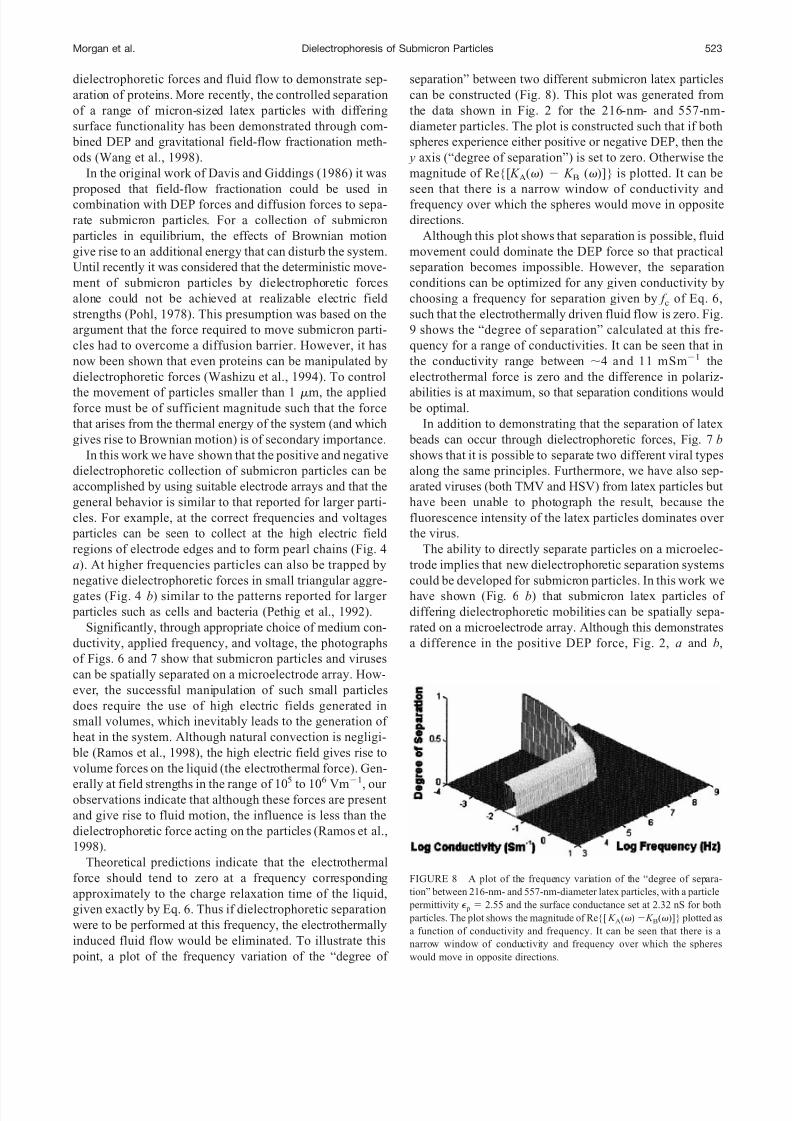
induced fluid flow would be eliminated. To illustrate this
point, a plot of the frequency variation of the “degree of
separation” between two different submicron latex particles
can be constructed (Fig. 8). This plot was generated from
the data shown in Fig. 2 for the 216-nm- and 557-nm-
diameter particles. The plot is constructed such that if both
spheres experience either positive or negative DEP, then the
y axis (“degree of separation”) is set to zero. Otherwise the
magnitude of Re{[ K A( ) K B ( )]} is plotted. It can be
seen that there is a narrow window of conductivity and
frequency over which the spheres would move in opposite
directions.
Although this plot shows that separation is possible, fluid
movement could dominate the DEP force so that practical
separation becomes impossible. However, the separation
conditions can be optimized for any given conductivity by
choosing a frequency for separation given by f c of Eq. 6,
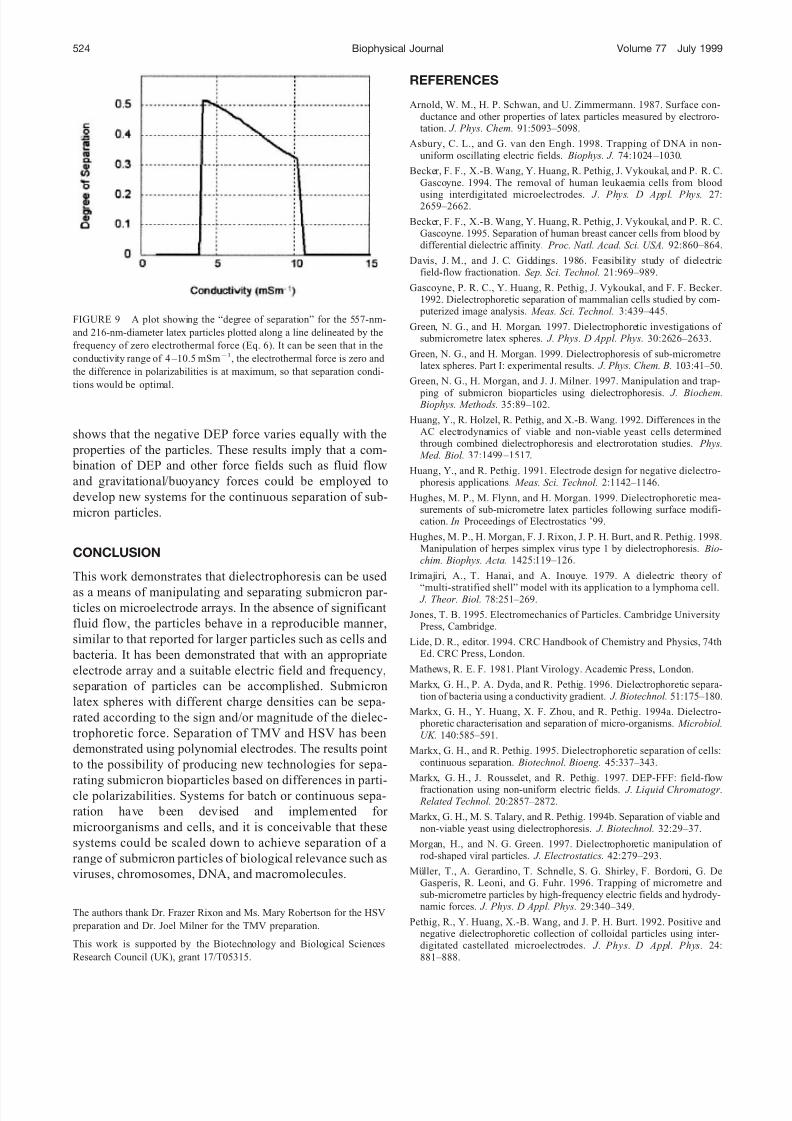
such that the electrothermally driven fluid flow is zero. Fig.
9 shows the “degree of separation” calculated at this fre-
quency for a range of conductivities. It can be seen that in
the conductivity range between 4 and 11 mSm1 the
electrothermal force is zero and the difference in polariz-
abilities is at maximum, so that separation conditions would be optimal.
In addition to demonstrating that the separation of latex
beads can occur through dielectrophoretic forces, Fig. 7 b
shows that it is possible to separate two different viral types
along the same principles. Furthermore, we have also sep-
arated viruses (both TMV and HSV) from latex particles but
have been unable to photograph the result, because the
fluorescence intensity of the latex particles dominates over
the virus.
The ability to directly separate particles on a microelec-
trode implies that new dielectrophoretic separation systems
could be developed for submicron particles. In this work we
have shown (Fig. 6 b) that submicron latex particles of
differing dielectrophoretic mobilities can be spatially sepa-
rated on a microelectrode array. Although this demonstrates
a difference in the positive DEP force, Fig. 2, a and b,
FIGURE 8 A plot of the frequency variation of the “degree of separa-
tion” between 216-nm- and 557-nm-diameter latex particles, with a particle
permittivity p 2.55 and the surface conductance set at 2.32 nS for both
particles. The plot shows the magnitude of Re{[ K A( ) K B( )]} plotted as
a function of conductivity and frequency. It can be seen that there is a
narrow window of conductivity and frequency over which the spheres
would move in opposite directions.
Morgan et al. Dielectrophoresis of Submicron Particles 523
8/11/2019 separacion por dielectroforesis.pdf
http://slidepdf.com/reader/full/separacion-por-dielectroforesispdf 9/10
shows that the negative DEP force varies equally with the
properties of the particles. These results imply that a com-
bination of DEP and other force fields such as fluid flow
and gravitational/buoyancy forces could be employed to
develop new systems for the continuous separation of sub-
micron particles.
CONCLUSION
This work demonstrates that dielectrophoresis can be used
as a means of manipulating and separating submicron par-ticles on microelectrode arrays. In the absence of significant
fluid flow, the particles behave in a reproducible manner,
similar to that reported for larger particles such as cells and
bacteria. It has been demonstrated that with an appropriate
electrode array and a suitable electric field and frequency,
separation of particles can be accomplished. Submicron
latex spheres with different charge densities can be sepa-
rated according to the sign and/or magnitude of the dielec-
trophoretic force. Separation of TMV and HSV has been
demonstrated using polynomial electrodes. The results point
to the possibility of producing new technologies for sepa-
rating submicron bioparticles based on differences in parti-cle polarizabilities. Systems for batch or continuous sepa-
ration have been devised and implemented for
microorganisms and cells, and it is conceivable that these
systems could be scaled down to achieve separation of a
range of submicron particles of biological relevance such as
viruses, chromosomes, DNA, and macromolecules.
The authors thank Dr. Frazer Rixon and Ms. Mary Robertson for the HSV
preparation and Dr. Joel Milner for the TMV preparation.
This work is supported by the Biotechnology and Biological Sciences
Research Council (UK), grant 17/T05315.
REFERENCES
Arnold, W. M., H. P. Schwan, and U. Zimmermann. 1987. Surface con-ductance and other properties of latex particles measured by electroro-tation. J. Phys. Chem. 91:5093–5098.
Asbury, C. L., and G. van den Engh. 1998. Trapping of DNA in non-uniform oscillating electric fields. Biophys. J. 74:1024 –1030.
Becker, F. F., X.-B. Wang, Y. Huang, R. Pethig, J. Vykoukal, and P. R. C.Gascoyne. 1994. The removal of human leukaemia cells from blood
using interdigitated microelectrodes. J. Phys. D Appl. Phys. 27:2659–2662.
Becker, F. F., X.-B. Wang, Y. Huang, R. Pethig, J. Vykoukal, and P. R. C.Gascoyne. 1995. Separation of human breast cancer cells from blood bydifferential dielectric affinity. Proc. Natl. Acad. Sci. USA. 92:860–864.
Davis, J. M., and J. C. Giddings. 1986. Feasibility study of dielectricfield-flow fractionation. Sep. Sci. Technol. 21:969–989.
Gascoyne, P. R. C., Y. Huang, R. Pethig, J. Vykoukal, and F. F. Becker.1992. Dielectrophoretic separation of mammalian cells studied by com- puterized image analysis. Meas. Sci. Technol. 3:439–445.
Green, N. G., and H. Morgan. 1997. Dielectrophoretic investigations of submicrometre latex spheres. J. Phys. D Appl. Phys. 30:2626–2633.
Green, N. G., and H. Morgan. 1999. Dielectrophoresis of sub-micrometrelatex spheres. Part I: experimental results. J. Phys. Chem. B. 103:41–50.
Green, N. G., H. Morgan, and J. J. Milner. 1997. Manipulation and trap-
ping of submicron bioparticles using dielectrophoresis. J. Biochem. Biophys. Methods. 35:89–102.
Huang, Y., R. Holzel, R. Pethig, and X.-B. Wang. 1992. Differences in theAC electrodynamics of viable and non-viable yeast cells determined through combined dielectrophoresis and electrorotation studies. Phys.
Med. Biol. 37:1499 –1517.
Huang, Y., and R. Pethig. 1991. Electrode design for negative dielectro- phoresis applications. Meas. Sci. Technol. 2:1142–1146.
Hughes, M. P., M. Flynn, and H. Morgan. 1999. Dielectrophoretic mea-surements of sub-micrometre latex particles following surface modifi-cation. In Proceedings of Electrostatics ’99.
Hughes, M. P., H. Morgan, F. J. Rixon, J. P. H. Burt, and R. Pethig. 1998.Manipulation of herpes simplex virus type 1 by dielectrophoresis. Bio-chim. Biophys. Acta. 1425:119–126.
Irimajiri, A., T. Hanai, and A. Inouye. 1979. A dielectric theory of
“multi-stratified shell” model with its application to a lymphoma cell. J. Theor. Biol. 78:251–269.
Jones, T. B. 1995. Electromechanics of Particles. Cambridge UniversityPress, Cambridge.
Lide, D. R., editor. 1994. CRC Handbook of Chemistry and Physics, 74thEd. CRC Press, London.
Mathews, R. E. F. 1981. Plant Virology. Academic Press, London.
Markx, G. H., P. A. Dyda, and R. Pethig. 1996. Dielectrophoretic separa-tion of bacteria using a conductivity gradient. J. Biotechnol. 51:175–180.
Markx, G. H., Y. Huang, X. F. Zhou, and R. Pethig. 1994a. Dielectro- phoretic characterisation and separation of micro-organisms. Microbiol.UK. 140:585–591.
Markx, G. H., and R. Pethig. 1995. Dielectrophoretic separation of cells:continuous separation. Biotechnol. Bioeng. 45:337–343.
Markx, G. H., J. Rousselet, and R. Pethig. 1997. DEP-FFF: field-flow
fractionation using non-uniform electric fields. J. Liquid Chromatogr. Related Technol. 20:2857–2872.
Markx, G. H., M. S. Talary, and R. Pethig. 1994b. Separation of viable and non-viable yeast using dielectrophoresis. J. Biotechnol. 32:29–37.
Morgan, H., and N. G. Green. 1997. Dielectrophoretic manipulation of rod-shaped viral particles. J. Electrostatics. 42:279–293.
Muller, T., A. Gerardino, T. Schnelle, S. G. Shirley, F. Bordoni, G. DeGasperis, R. Leoni, and G. Fuhr. 1996. Trapping of micrometre and sub-micrometre particles by high-frequency electric fields and hydrody-namic forces. J. Phys. D Appl. Phys. 29:340–349.
Pethig, R., Y. Huang, X.-B. Wang, and J. P. H. Burt. 1992. Positive and negative dielectrophoretic collection of colloidal particles using inter-digitated castellated microelectrodes. J. Phys. D Appl. Phys. 24:881–888.
FIGURE 9 A plot showing the “degree of separation” for the 557-nm-
and 216-nm-diameter latex particles plotted along a line delineated by the
frequency of zero electrothermal force (Eq. 6). It can be seen that in the
conductivity range of 4 –10.5 mSm1, the electrothermal force is zero and
the difference in polarizabilities is at maximum, so that separation condi-
tions would be optimal.
524 Biophysical Journal Volume 77 July 1999
8/11/2019 separacion por dielectroforesis.pdf
http://slidepdf.com/reader/full/separacion-por-dielectroforesispdf 10/10
Pohl, H. A. 1951. The motion and precipitation of suspensoids in divergentelectric fields. J. Appl. Phys. 22:869–871.
Pohl, H. A. 1978. Dielectrophoresis. Cambridge University Press, Cam- bridge.
Price, J. A. R., J. P. H. Burt, and R. Pethig. 1988. Applications of a newoptical technique for measuring the dielectrophoretic behaviour of mi-cro-organisms. Biochim. Biophys. Acta. 964:221–230.
Ramos, A., H. Morgan, N. G. Green, and A. Castellanos. 1998. ACelectrokinetics: a review of forces in microelectrode structures. J. Phys.
D Appl. Phys. 31:2338–2353.Schnelle, T., S. Muller, S. Fiedler, G. Shirely, K. Ludwig, A. Hermann, and
G. Fuhr. 1996. Trapping of viruses in high-frequency electric field cages. Naturwissenschaften. 83:172–176.
Stephens, M., M. S. Talary, R. Pethig, A. K. Burnett, and K. I. Mills. 1996.The dielectrophoretic enrichment of CD34 cells from peripheral blood stem-cell harvests. Bone Marrow Transplant. 18:777–782.
Stratton, J. A. 1941. Electromagnetic Theory. McGraw-Hill, New York.
Talary, M., K. I. Mills, T. Hoy, A. K. Burnett, and R. Pethig. 1995.Dielectrophoretic separation and enrichment of CD34 cell subpopula-
tions from bone marrow and peripheral blood stem cells. Med. Biol. Eng.Comp. 33:235–237.
Wang, X.-B., Y. Huang, J. P. H. Burt, G. H. Markx, and R. Pethig. 1993.Selective dielectrophoretic confinement of bioparticles in potential en-ergy wells. J. Phys. D Appl. Phys. 26:1278–1285.
Wang, X. B., J. Vykoukal, F. F. Becker, and P. R. C. Gascoyne. 1998.Separation of polystyrene microbeads using dielectrophoretic/gravitational field-flow fractionation. Biophys. J. 74:2689–2701.
Washizu, M., and O. Kurosawa. 1990. Electrostatic manipulation of DNA
in microfabricated structures. IEEE Trans. Ind. Appl. 26:1165–1172.
Washizu, M., O. Kurosawa, I. Arai, S. Suzuki, and N. Shimamoto. 1995.Applications of electrostatic stretch-and-positioning of DNA. IEEE Trans. Ind. Appl. 31:447–456.
Washizu, M., S. Suzuki, O. Kurosawa, T. Nishizaka, and T. Shinohara.1994. Molecular dielectrophoresis of biopolymers. IEEE Trans. Ind.
Appl. 30:835–843.
Whitley, R. J. 1996. Fields’ Virology. B. N. Fields et al., editors. Lippin-cott-Raven, Philadelphia. 2297–2342.
Morgan et al. Dielectrophoresis of Submicron Particles 525
Recommended