Chinese Journal of Oceanology and LimnologyVol. 29 No. 3, P. 591-602, 2011DOI: 10.1007/s00343-011-0098-3
Zooplankton spatial and diurnal variations in the Changjiang River estuary before operation of the Three Gorges Dam*
GAO Xuelu (高学鲁)1, 2, SONG Jinming (宋金明)1, **, LI Xuegang (李学刚)1
1 Key Laboratory of Marine Ecology & Environmental Sciences, Institute of Oceanology, Chinese Academy of Sciences, Qingdao 266071, China
2 Key Laboratory of Coastal Environment Processes, Yantai Institute of Coastal Zone Research, Chinese Academy of Sciences, Yantai 264003, China
Received Apr. 23, 2010; revision accepted June 11, 2010© Chinese Society for Oceanology and Limnology, Science Press, and Springer-Verlag Berlin Heidelberg 2011
Abstract Estuarine plankton communities can serve as indicators of ecosystem modification in response to anthropogenic influences. The main objectives of this study were to describe the spatial distribution and diurnal variability in zooplankton abundance and biomass over almost entire salinity gradient of the Changjiang (Yangtze) River estuary and to provide a background reference for future studies. To accomplish this, data were collected from 29 stations in the estuary from May 19 to 26, 2003, including two anchor stations. The spatial and diurnal variations in zooplankton characteristics, i.e. abundance, biomass, and gross taxonomic composition, were examined. Generally, both the abundance and biomass gradually increased seaward and presented distinct spatial variations. In addition, the spatial data revealed a significant correlation between abundance and biomass; however, there was no significant correlation between abundance and biomass for the diurnal data. Although the zooplankton composition indicated distinct spatial differences in terms of dominant groups, copepods accounted for >50% of the total zooplankton abundance in most regions and times. Three zooplankton assemblages were recognized through hierarchical cluster analysis. These assemblages existed along the salinity gradient from fresh water to seawater, and their positions coincided with those of the three principal water masses in the estuary. The assemblages were classified as: (1) true estuarine, (2) estuarine and marine, and (3) euryhaline marine, which were characterized by the copepods Sinocalanus dorrii, Labidocera euchaeta, and Calanus sinicus, respectively. Both spatial and diurnal data indicated that there was no significant correlation between zooplankton abundance/biomass and depth-integrated phytoplankton abundance.
Keyword: zooplankton; abundance; biomass; community composition; Changjiang (Yangtze) River estuary; China
1 INTRODUCTIONAs transition areas between land and sea, estuaries
are characterized by a variety of inter-related biotic and abiotic structural components and intensive chemical, physical, and biological processes (Telesh, 2004). Estuaries act as filters that trap both natural and anthropogenic materials from the continents before they delivered to the open sea (Sharp et al., 1984). In addition, estuaries are frequently areas of high fertility and dense phytoplankton and zooplankton populations. It is believed that the magnitude of global anthropogenic N and P flux is comparable to that of natural flux (Wu, 1999), and
* Supported by the National Natural Science Foundation of China for Creative Research Groups (No. 40821004), the Knowledge Innovation Program of Chinese Academy of Sciences (No. KZCX1-YW-06-02), and the National Basic Research Program of China (973 Program) (No. 2007CB407305)** Corresponding author: [email protected]
that this flux can elicit either positive or negative responses in the ecological health of estuaries (Gianesella et al., 2000). Plankton participates in the functioning of these marginal filters by producing and structuring the matter, energy, and information fluxes in the ecosystems (Telesh, 2004). Thus, when properly identified, measured on a unified basis and monitored, the variability (or stability) in the
592 Vol.29CHIN. J. OCEANOL. LIMNOL., 29(3), 2011
structural and functional parameters of estuarine plankton communities can serve as an indicator of ecosystem modifications in response to eutrophication/pollution stress (Telesh, 2004).
The Changjiang (Yangtze) River, which is more than 6 300 km long, drains a 1.96 × 10⁶ km2 area of China and empties an average of about 9 × 10¹¹ m3 of freshwater into the East China Sea annually (Beardsley et al., 1985; Chen et al., 2001). The flow of riverine water is highly seasonal, and 70% of the annual supply is discharged from the lower reaches of the Changjiang River during the wet season from May to October. The estuary, which is presently about 120 km long and more than 90 km wide at its outer limit, is mesotidal and characterized by a complex morphology (Li and Chen, 1998; Yang et al., 2003). In the Changjiang estuary, tidal influence reaches as far as 640 km inland (Chen et al., 1999) and freshwater influence extends ca. 200 km into the sea (Milliman et al., 1986). As a result, the saline interface varies considerably with depth and width. In addition, mixing of fresh and saline water occurs from the head of the mouth bar to the mouth of the estuary (Chen et al., 1999). Local tides are typically semidiurnal, with a maximum ranging from 4.6 to 6.0 m. The mean flow speed of the tidal cycles is <1.0 m/s; however, it reaches up to 2.0 m/s in the main river channels, with a maximum recorded value of 2.45 m/s (Yang et al., 2001).
There is great commercial interest in the Changjiang estuary because it is an important spawning and nursing ground for many fish. With the rapid economic development that has occurred in Shanghai and other cities in the Changjiang drainage area, nutrients loaded from the river have increased dramatically over the last two decades. Increased sewage export and overuse of agricultural fertilizers are believed to be the key physical-biological causes of eutrophication in the estuary and the adjacent western inner shelf of the East China Sea. Currently, these waters are subject to frequent occurrence of red tides, which pose a serious environmental threat. In addition, eutrophication has resulted in a change in species composition, food chain structure and element cycling in the marine ecosystem. When compared to other areas such as the Arabian Sea (Reckermann et al., 1997; Edwards et al., 1999), Gulf of Mexico (Strom et al., 1996), South Atlantic (Froneman et al., 1996) and Washington Coast (Landry et al., 1982), microzooplankton grazing pressure on primary productivity in the vicinity of
the Changjiang estuary is high (Sun et al., 2003). Strombidium sulcatum is a key species that controls the growth of Prorocentrum dentatum (Sun et al., 2003), which is a species of phytoplankton that has reportedly become the main causative agent of red tide in the vicinity of the Changjiang estuary in recent years (Hong, 2003).
Since the 1950s, many investigations of zooplankton in the Changjiang estuary have been conducted (Chen et al., 1985; 1995a, b; Xu et al., 1995a, b; 1999; Guo et al., 2003; Sun et al., 2003; Xu et al., 2003). However, the majority of these studies have focused on small areas or topics, such as the turbidity maximum and plume front zone. Indeed, studies covering the entire estuary are scarce. Furthermore, the Three Gorges Dam in the middle stream of the Changjiang River, which was constructed to generate power and improve flood control and navigation, began to store water on June 1, 2003. Its construction has caused widespread scientific controversy and worldwide concern because is the project is expected to lead to serious changes in the primary characteristics of the Changjiang Discharge, which may influence the ecosystem of the Changjiang River and the East China Sea. A multidisciplinary investigation was conducted in the Changjiang estuary from May 19 to 26, 2003, immediately before the Three Gorges Dam began to store water, and a series of papers have been published based on the results of this investigation (Gao et al., 2005a; 2005b; Li et al., 2006; Gao et al., 2007a; 2007b; 2008). The primary objectives of the present study are to describe the spatial distribution and diurnal variability in zooplankton abundance and biomass over almost the entire salinity gradient of the Changjiang estuary and to provide a background reference for future studies.
2 MATERIAL AND METHODThis study was conducted from May 19 to 26,
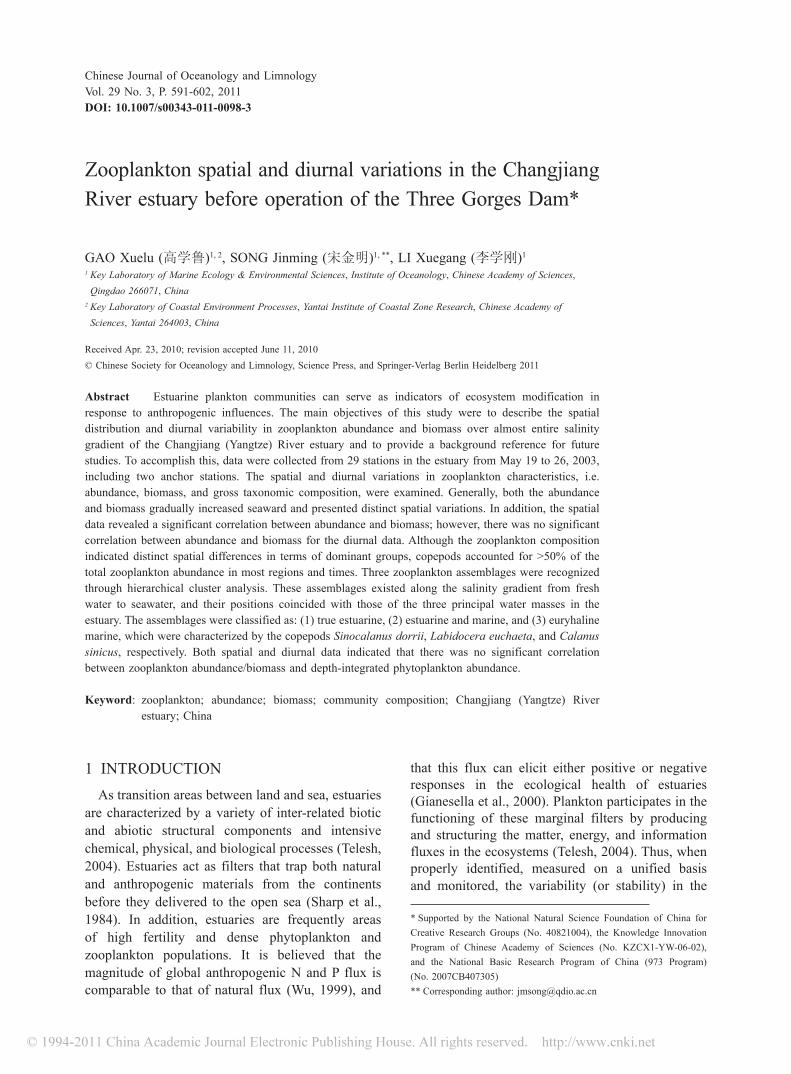
2003, on board the R/V Zhe Hai Huan Jian. Twenty-nine stations were established over two intersecting transects identified as A and B (Fig.1). Transect A extended from the freshwater river to the saltwater sea and covered almost the entire salinity gradient. Transect B ran across the edge of the bar area (Chen et al., 1999) and covered the entire river mouth. At Stations 13 and 20 (Anchor Stations) located at the estuarine mixed water mass and seawater mass, respectively, parameters were measured at 4-h intervals over a period of 48 h. Water sample collections were guided by a SeaBird CTD probe
No.3 593GAO et al.: Zooplankton in the Changjiang River estuary
and collected using a 5.0-L Niskin bottle. Water samples were taken at depths of 0 m and 2 m above the bottom if the water depth was <10 m, and at 0 m, 5 m, 10 m, 20 m and 2 m above the bottom if the water depth was >10 m.
Physical seawater parameters such as temperature, salinity, pH and dissolved oxygen (DO) were determined using in situ instruments. To measure the inorganic nutrient parameters, water samples were filtered immediately after collection through pre-cleaned 0.45 μm pore-size cellulose filters, which were subsequently preserved by freezing and storage in the dark until analysis. Inorganic nutrients were determined by spectrophotometric methods (Grasshoff et al., 1983), which had precisions identified in Zhang et al. (1997). Water samples for chlorophyll a (Chl-a) analysis were filtered through Whatman GF/F filters that were subsequently frozen until further analysis by the spectrophotometric method described by Lorenzen (1967). To determine the suspended particulate matter (SPM), a known volume of well-mixed sample was filtered through a dried and weighed membrane filter with a pore size of 0.45 μm. The particulate-laden filter was then rinsed with deionized water to remove the sea salt and frozen until reweighing after drying at 60°C to a constant weight. The phytoplankton abundance was determined using a sedimentation method (Gao et al., 2005a).
At all sampling stations/time, zooplankton were collected with a plankton net (mouth diameter: 0.8 m, mesh size: 505 μm) that was towed vertically from 2 m above the sea-bed to the surface. To reduce the effects of the current on zooplankton collection, the ship was moored in a proper direction and a heavy plummet was tied to the bottom of the net.
After the net was retrieved, samples were preserved in seawater containing 5% buffered formalin for further analysis. The filtered water volume was calculated from the wire length and the net mouth area assuming 100% filtration efficiency. A subsample was obtained from each sample for identification and enumeration purposes. The zooplankton abundance (ind./m3) was calculated and larger taxonomic groups such as chaetognaths and copepods were identified. In addition, most copepods were identified and counted at the species level. The number of individuals observed per taxa depended on the zooplankton abundance. Specifically, for samples with low zooplankton abundance, all specimens were observed, while at least a dozen organisms were observed for samples with high zooplankton abundance. The zooplankton dry weight in mg/m3 was measured by oven drying (60°C, 24 h) a portion of each sample after removing the impurities. All zooplankton sampling and laboratory analyses were conducted according to the Specifications for Oceanographic Survey (State Oceanic Administration, 1991).
3 RESULT AND DISCUSSION3.1 Environmental variables
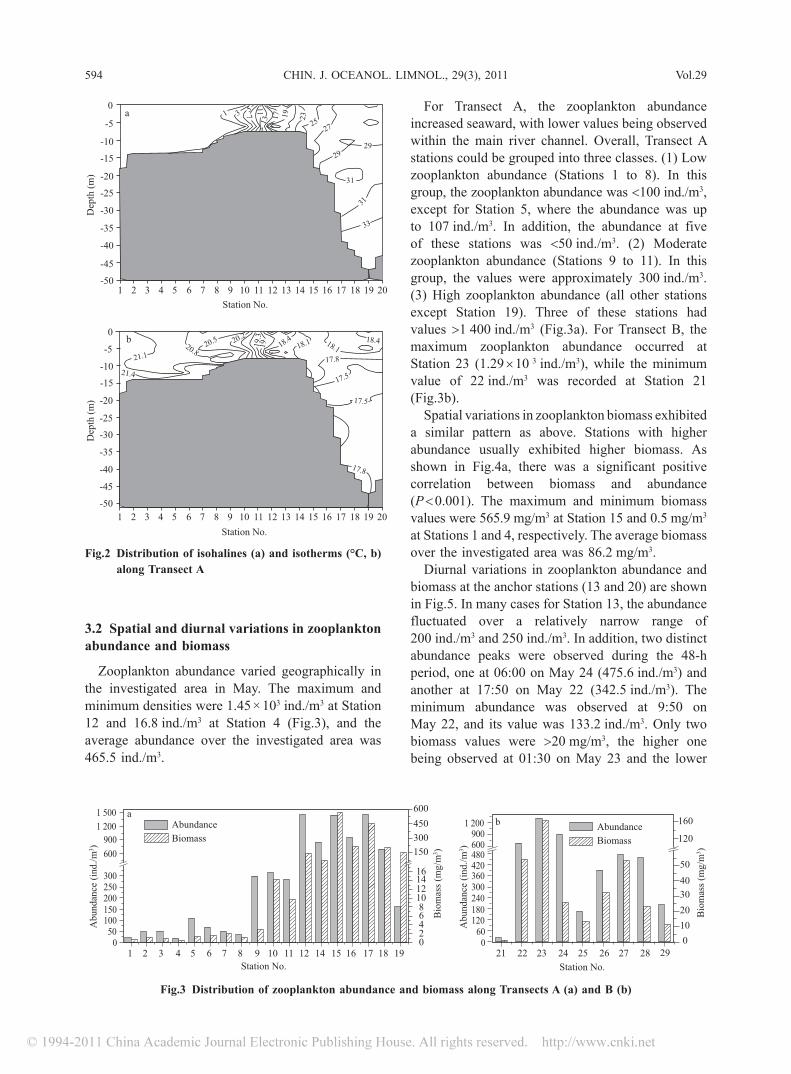
The most pronounced spatial gradient in the Changjiang estuary was salinity, which decreased from >30 at the furthest seaward station to freshwater within the main river channel. The temperature increased a few degrees from Station 20 to Station 1, while the suspended particulate matter load fluctuated slightly before it reached the mouth and then increased rapidly to the highest value in the area of maximum turbidity around Station 12. Beyond station 12 the particulate matter decreased gradually to the lowest value in the vicinity of Station 20. Particulate values as high as approximately 600 mg/L were measured in the zone of maximum turbidity. Surface nitrate, phosphate, and silicate variations showed similar trends, and decreased seaward. The pH, DO and Chl-a variations also showed similar trends and increased seaward (Gao et al., 2005b; Gao et al., 2007b; 2008). The salinity of the water column at Anchor Stations 13 and 20 over the investigated period of 48 h was 16.8±3.3 (mean±standard deviation) and 29.4±2.3, respectively, while the temperature was 19.0±0.6°C and 17.9±0.5°C, respectively. Isohalines and isotherms along Transect A are presented in Fig.2.
Fig.1 Location of sampling stations in the Changjiang River estuary
32.0°
N
31.5°
31.0°
30.5°
30.0°121.0° 121.5° 122.0° 122.5° 123.0° 123.5° 124.0°E
Chongming Is.
N12
34
56 7
89
1011
1213
141516
1718
1920
21
222324
25
26272829
East China Sea
Hangzhou Bay
Tra
nsec
t B
Transect A
Shanghai
Zhoushan
594 Vol.29CHIN. J. OCEANOL. LIMNOL., 29(3), 2011
3.2 Spatial and diurnal variations in zooplankton abundance and biomass
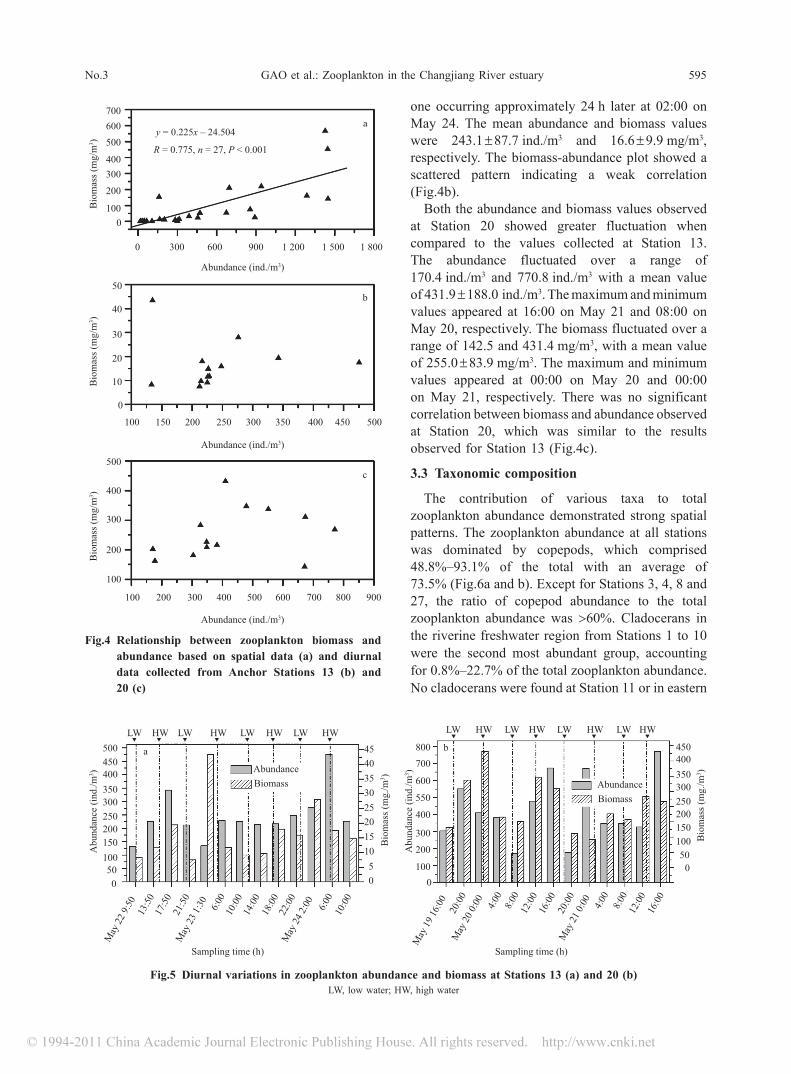
Zooplankton abundance varied geographically in the investigated area in May. The maximum and minimum densities were 1.45 × 10³ ind./m3 at Station 12 and 16.8 ind./m3 at Station 4 (Fig.3), and the average abundance over the investigated area was 465.5 ind./m3.
For Transect A, the zooplankton abundance increased seaward, with lower values being observed within the main river channel. Overall, Transect A stations could be grouped into three classes. (1) Low zooplankton abundance (Stations 1 to 8). In this group, the zooplankton abundance was <100 ind./m3, except for Station 5, where the abundance was up to 107 ind./m3. In addition, the abundance at five of these stations was <50 ind./m3. (2) Moderate zooplankton abundance (Stations 9 to 11). In this group, the values were approximately 300 ind./m3. (3) High zooplankton abundance (all other stations except Station 19). Three of these stations had values >1 400 ind./m3 (Fig.3a). For Transect B, the maximum zooplankton abundance occurred at Station 23 (1.29 × 10 3 ind./m3), while the minimum value of 22 ind./m3 was recorded at Station 21 (Fig.3b).
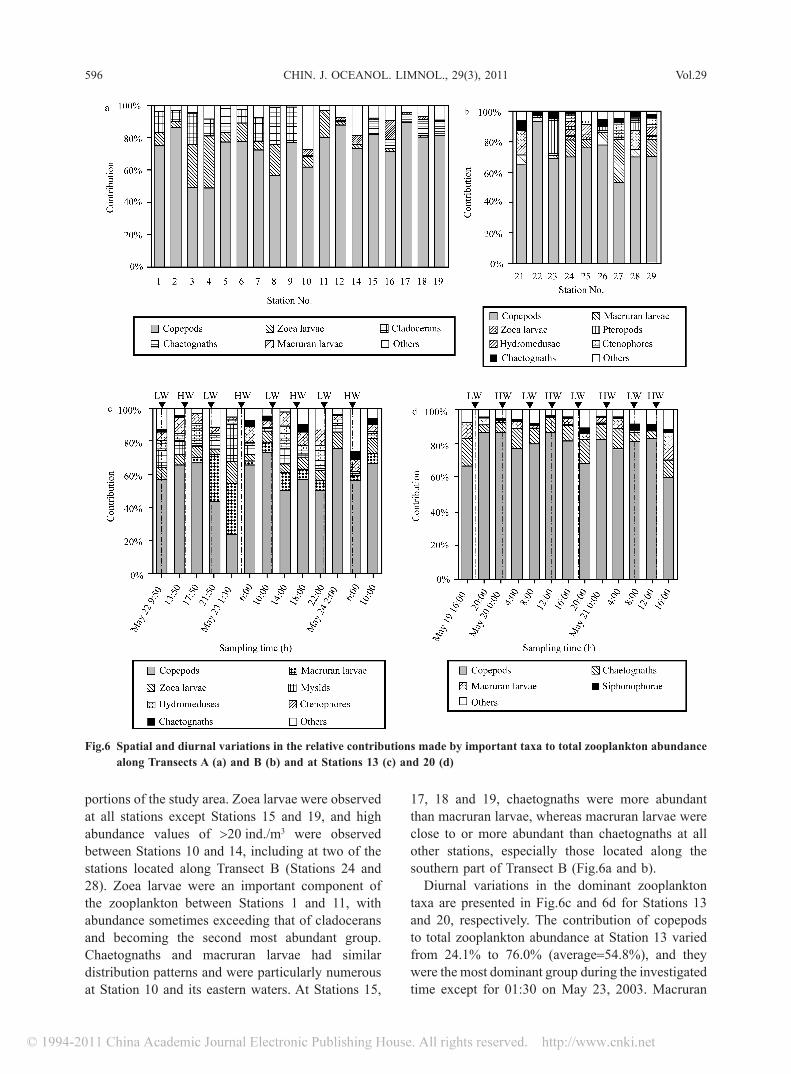
Spatial variations in zooplankton biomass exhibited a similar pattern as above. Stations with higher abundance usually exhibited higher biomass. As shown in Fig.4a, there was a significant positive correlation between biomass and abundance (P < 0.001). The maximum and minimum biomass values were 565.9 mg/m3 at Station 15 and 0.5 mg/m3 at Stations 1 and 4, respectively. The average biomass over the investigated area was 86.2 mg/m3.
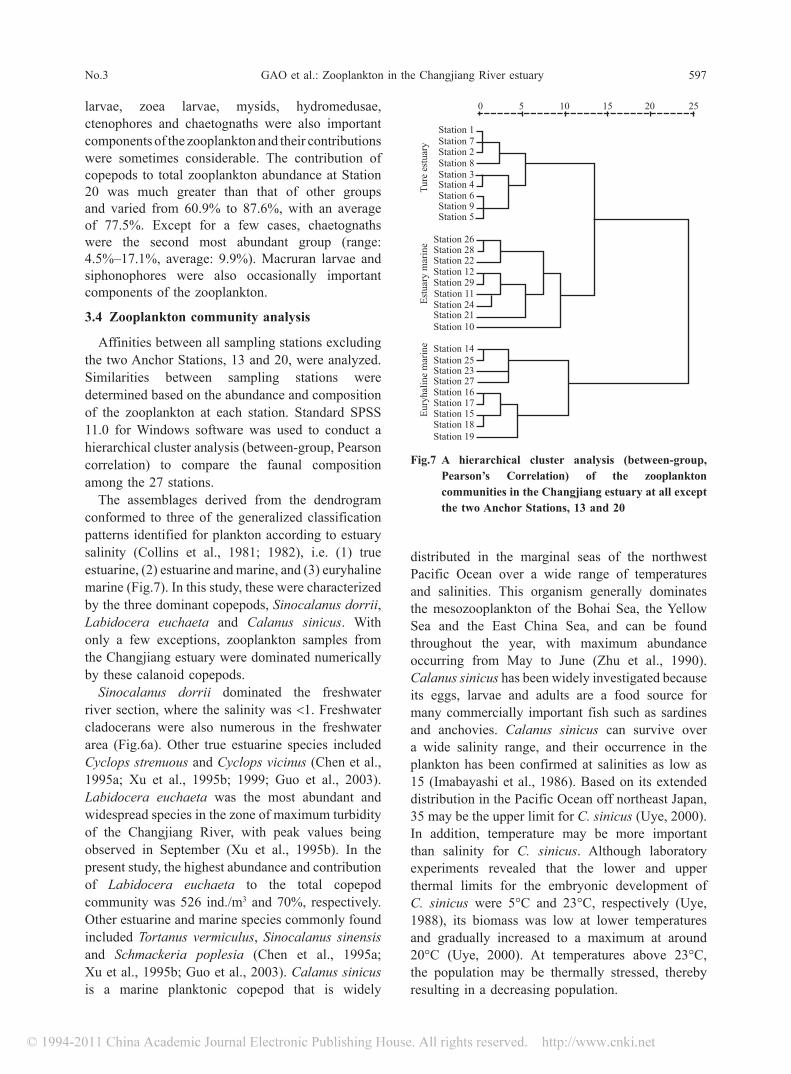
Diurnal variations in zooplankton abundance and biomass at the anchor stations (13 and 20) are shown in Fig.5. In many cases for Station 13, the abundance fluctuated over a relatively narrow range of 200 ind./m3 and 250 ind./m3. In addition, two distinct abundance peaks were observed during the 48-h period, one at 06:00 on May 24 (475.6 ind./m3) and another at 17:50 on May 22 (342.5 ind./m3). The minimum abundance was observed at 9:50 on May 22, and its value was 133.2 ind./m3. Only two biomass values were >20 mg/m3, the higher one being observed at 01:30 on May 23 and the lower
Fig.2 Distribution of isohalines (a) and isotherms (°C, b) along Transect A
Fig.3 Distribution of zooplankton abundance and biomass along Transects A (a) and B (b)
1 500
1 200900
600
30025020015010050
01 2 3 4 5 6 7 8 9 10 11 12 14 15 16 17 18 19
1086420
121416
150
300
450
600
Abu
ndan
ce (
ind.
/m3 )
aAbundance
Biomass
Bio
mas
s (m
g/m
3 )
Abu
ndan
ce (
ind.
/m3 )
Station No. Station No.
Abundance
Biomass600
1 200
480420360300240180120
600
900b
21 22 23 24 25 26 27 28 29
Bio
mas
s (m
g/m
3 )
40
30
20
10
0
160
120
50
Station No.
Station No.
Dep
th (
m)
Dep
th (
m)
0
-5
-10
-15
-20
-25
-30
-35
-40
-45
-50
a
1 2 3 4 5 6 7 8 9 10 11 12 13 14 15 16 17 18 19 20
-5
-10
-15
-20
-25
-30
-35
-40
-45
-50
0b
1 2 3 4 5 6 7 8 9 10 11 12 13 14 15 16 17 18 19 20
1 3 57
11
1317 19 23
2527
2929
31
31
33
21.1
21.4
20.820.5 20.2
19.3
19 18.418.1 18.1
17.8
17.5
17.5
17.8
18.4
No.3 595GAO et al.: Zooplankton in the Changjiang River estuary
one occurring approximately 24 h later at 02:00 on May 24. The mean abundance and biomass values were 243.1 ± 87.7 ind./m3 and 16.6 ± 9.9 mg/m3, respectively. The biomass-abundance plot showed a scattered pattern indicating a weak correlation (Fig.4b).
Both the abundance and biomass values observed at Station 20 showed greater fluctuation when compared to the values collected at Station 13. The abundance fluctuated over a range of 170.4 ind./m3 and 770.8 ind./m3 with a mean value of 431.9 ± 188.0 ind./m3. The maximum and minimum values appeared at 16:00 on May 21 and 08:00 on May 20, respectively. The biomass fluctuated over a range of 142.5 and 431.4 mg/m3, with a mean value of 255.0 ± 83.9 mg/m3. The maximum and minimum values appeared at 00:00 on May 20 and 00:00 on May 21, respectively. There was no significant correlation between biomass and abundance observed at Station 20, which was similar to the results observed for Station 13 (Fig.4c).
3.3 Taxonomic composition
The contribution of various taxa to total zooplankton abundance demonstrated strong spatial patterns. The zooplankton abundance at all stations was dominated by copepods, which comprised 48.8%–93.1% of the total with an average of 73.5% (Fig.6a and b). Except for Stations 3, 4, 8 and 27, the ratio of copepod abundance to the total zooplankton abundance was >60%. Cladocerans in the riverine freshwater region from Stations 1 to 10 were the second most abundant group, accounting for 0.8%–22.7% of the total zooplankton abundance. No cladocerans were found at Station 11 or in eastern
Fig.4 Relationship between zooplankton biomass and abundance based on spatial data (a) and diurnal data collected from Anchor Stations 13 (b) and 20 (c)
Fig.5 Diurnal variations in zooplankton abundance and biomass at Stations 13 (a) and 20 (b) LW, low water; HW, high water
LW HW LW HW LW HW LW HW
500
450400
350300
250200150
10050
0
Abu
ndan
ce (
ind.
/m3 )
May
22
9:50
May
24
2:00
13:5
0
21:5
0M
ay 2
3 1:
30 6:00
10:0
014
:00
18:0
022
:00
6:00
10:0
0
17:5
0
45
40
35
30
25
20
15
10
5
0
Bio
mas
s (m
g./m
3 )
450400
350300
250200150
10050
0
Bio
mas
s (m
g./m
3 )
Sampling time (h)
LW HW LW HW LW HW LW HW
800
700
600
550
400
300
200
100
0
Abu
ndan
ce (
ind.
/m3 )
May
19
16:0
020
:00
8:00
May
21
0:00
12:0
016
:00
20:0
0
4:00
4:00
May
20
0:00 8:00
12:0
016
:00
Sampling time (h)
a b
Abundance
Biomass
Abundance
Biomass
700
600
500
400
300
200
100
0
Bio
mas
s (m
g/m
3 )B
iom
ass
(mg/
m3 )
Bio
mas
s (m
g/m
3 )
30
20
10
0
40
50
3000 600 900 1 200 1 500 1 800
Abundance (ind./m3)
150100 200 250 300 350 400 450 500
Abundance (ind./m3)
Abundance (ind./m3)
500
400
300
200
100
500400300200100 900800700600
c
b
ay = 0.225x – 24.504
R = 0.775, n = 27, P < 0.001
596 Vol.29CHIN. J. OCEANOL. LIMNOL., 29(3), 2011
portions of the study area. Zoea larvae were observed at all stations except Stations 15 and 19, and high abundance values of >20 ind./m3 were observed between Stations 10 and 14, including at two of the stations located along Transect B (Stations 24 and 28). Zoea larvae were an important component of the zooplankton between Stations 1 and 11, with abundance sometimes exceeding that of cladocerans and becoming the second most abundant group. Chaetognaths and macruran larvae had similar distribution patterns and were particularly numerous at Station 10 and its eastern waters. At Stations 15,
17, 18 and 19, chaetognaths were more abundant than macruran larvae, whereas macruran larvae were close to or more abundant than chaetognaths at all other stations, especially those located along the southern part of Transect B (Fig.6a and b).
Diurnal variations in the dominant zooplankton taxa are presented in Fig.6c and 6d for Stations 13 and 20, respectively. The contribution of copepods to total zooplankton abundance at Station 13 varied from 24.1% to 76.0% (average=54.8%), and they were the most dominant group during the investigated time except for 01:30 on May 23, 2003. Macruran
Fig.6 Spatial and diurnal variations in the relative contributions made by important taxa to total zooplankton abundance along Transects A (a) and B (b) and at Stations 13 (c) and 20 (d)
No.3 597GAO et al.: Zooplankton in the Changjiang River estuary
larvae, zoea larvae, mysids, hydromedusae, ctenophores and chaetognaths were also important components of the zooplankton and their contributions were sometimes considerable. The contribution of copepods to total zooplankton abundance at Station 20 was much greater than that of other groups and varied from 60.9% to 87.6%, with an average of 77.5%. Except for a few cases, chaetognaths were the second most abundant group (range: 4.5%–17.1%, average: 9.9%). Macruran larvae and siphonophores were also occasionally important components of the zooplankton.
3.4 Zooplankton community analysis
Affinities between all sampling stations excluding the two Anchor Stations, 13 and 20, were analyzed. Similarities between sampling stations were determined based on the abundance and composition of the zooplankton at each station. Standard SPSS 11.0 for Windows software was used to conduct a hierarchical cluster analysis (between-group, Pearson correlation) to compare the faunal composition among the 27 stations.
The assemblages derived from the dendrogram conformed to three of the generalized classification patterns identified for plankton according to estuary salinity (Collins et al., 1981; 1982), i.e. (1) true estuarine, (2) estuarine and marine, and (3) euryhaline marine (Fig.7). In this study, these were characterized by the three dominant copepods, Sinocalanus dorrii, Labidocera euchaeta and Calanus sinicus. With only a few exceptions, zooplankton samples from the Changjiang estuary were dominated numerically by these calanoid copepods.
Sinocalanus dorrii dominated the freshwater river section, where the salinity was <1. Freshwater cladocerans were also numerous in the freshwater area (Fig.6a). Other true estuarine species included Cyclops strenuous and Cyclops vicinus (Chen et al., 1995a; Xu et al., 1995b; 1999; Guo et al., 2003). Labidocera euchaeta was the most abundant and widespread species in the zone of maximum turbidity of the Changjiang River, with peak values being observed in September (Xu et al., 1995b). In the present study, the highest abundance and contribution of Labidocera euchaeta to the total copepod community was 526 ind./m3 and 70%, respectively. Other estuarine and marine species commonly found included Tortanus vermiculus, Sinocalanus sinensis and Schmackeria poplesia (Chen et al., 1995a; Xu et al., 1995b; Guo et al., 2003). Calanus sinicus is a marine planktonic copepod that is widely
distributed in the marginal seas of the northwest Pacific Ocean over a wide range of temperatures and salinities. This organism generally dominates the mesozooplankton of the Bohai Sea, the Yellow Sea and the East China Sea, and can be found throughout the year, with maximum abundance occurring from May to June (Zhu et al., 1990). Calanus sinicus has been widely investigated because its eggs, larvae and adults are a food source for many commercially important fish such as sardines and anchovies. Calanus sinicus can survive over a wide salinity range, and their occurrence in the plankton has been confirmed at salinities as low as 15 (Imabayashi et al., 1986). Based on its extended distribution in the Pacific Ocean off northeast Japan, 35 may be the upper limit for C. sinicus (Uye, 2000). In addition, temperature may be more important than salinity for C. sinicus. Although laboratory experiments revealed that the lower and upper thermal limits for the embryonic development of C. sinicus were 5°C and 23°C, respectively (Uye, 1988), its biomass was low at lower temperatures and gradually increased to a maximum at around 20°C (Uye, 2000). At temperatures above 23°C, the population may be thermally stressed, thereby resulting in a decreasing population.
Fig.7 A hierarchical cluster analysis (between-group, Pearson’s Correlation) of the zooplankton communities in the Changjiang estuary at all except the two Anchor Stations, 13 and 20
0 5 10 15 20 25
Station 1Station 7Station 2Station 8Station 3Station 4Station 6Station 9Station 5
Station 26Station 28Station 22Station 12Station 29Station 11Station 24Station 21Station 10
Station 14Station 25Station 23Station 27Station 16Station 17Station 15Station 18Station 19
Tur
e es
tuar
yE
stua
ry m
arin
eE
uryh
alin
e m
arin
e
598 Vol.29CHIN. J. OCEANOL. LIMNOL., 29(3), 2011
3.5 Possible environmental factors influencing zooplankton
3.5.1 Water masses
In aquatic pelagic systems, structure and function are controlled to a large extent by physical forces (Azeiteiro et al., 2003). Indeed, the importance of horizontal gradients in salinity and temperature in determining the distribution of estuarine organisms is now well documented (Wooldridge, 1999). The interaction between physical and biological processes occurs over a wide range of temporal and spatial scales. Plankton exhibit complex responses to the environmental variability through changes at the individual (e.g. physiological growth and condition), population (migration, reproduction, and mortality), and community (species composition) levels of organization (Azeiteiro et al., 2003). These processes have important consequences for the dynamics of aquatic systems.
The Changjiang River estuary and its nearby coastal waters can be divided into three principal water masses: (1) freshwater from the Changjiang River; (2) seawater (continental shelf waters) entering the East China Sea, either with the Yellow Sea longshore current from the north or the Taiwan Warm Current and its branches from the south and (3) the transition zone between freshwater and seawater, resulting in estuarine mixed water (Chen et al., 1999).
The salinity between Stations 10 and 16 changed quickly, indicating that the freshwater and seawater interacted with each other to form an estuarine mixed water mass around this area. Stations 10 and 16 could be regarded as the salt-wedge and estuarine front, respectively (Chen et al., 1999). Variation in water temperature decreased in a downriver direction. As a result, the freshwater mass was characterized by low salinity and high temperature, while the opposite was true for the seawater mass (Fig.2). The interactions between water masses with different salinities and temperatures have profound effects on the zooplankton community and control most of the dispersal and mortality processes of this area. Thus, the positions of different zooplankton community structures coincided with those of the three principal water masses in the Changjiang estuary in this study to some extent (Figs.2a and 7).
3.5.2 Tides
Excluding mortality and population growth, temporal variations in zooplankton abundance essentially depend on two factors: (1) transport by
horizontal currents and (2) vertical migration (Morgado et al., 2003). Hill (1991a, b, c; 1995) showed that when daily vertical migration occurs in systems that are subject to tidal currents, horizontal transport over tens or hundreds of kilometers may occur.
Tides have an extensive influence on physical, geochemical and biological processes in coastal areas. The effect of tides on zooplankton abundance, biomass and composition in different coastal areas is related to geographical characteristics; therefore, regional differences exist. Studies of a tropical estuary in Brazil revealed that the spring/neap tide cycle and the times of high (HW) and low water (LW) were important factors determining the structure of the zooplankton community, whereas time of day had no effect (Krumme et al., 2004). Abundance and biomass were greatest at LW when species numbers were lowest, while the opposite was true for HW when species numbers were highest. These findings are in contrast to other coastal areas such as the Seine estuary (Dauvin et al., 1998) and nearshore areas of tropical Australia (Robertson et al., 1988), where densities and total abundances were greater at high tide than at low tide. Previous studies of the turbidity maximum of the Changjiang estuary showed that biomasses were much lower at neap tide than at spring tide, especially during the wet season. Biomasses at LW were much higher than at HW during spring tide in the dry season and neap tide in both the dry and wet seasons, while the opposite was true for spring tide during the wet season (Xu et al., 1995b; 1999). In this study, data from Anchor Stations 13 and 20 appeared to indicate that, in most cases, biomass increased during flooding and decreased during ebbing (Fig.5). The impact of the tide on zooplankton abundance and composition was not as great as on its biomass (Figs.5, 6c, 6d).
Our data lacked direct evidence of a pattern of tidal-related vertical migration since the samples were only obtained from vertical hauls from 2 m above the bottom to the surface. However, selective tidal stream transport in layers of different salinities is not likely to occur in the well-mixed shallow part of the Changjiang estuary. Previous studies have indicated that Calanus sinicus in the plume front of the Changjiang estuary, which is a dominant zooplankton species in this area, was mainly distributed in the upper 10 m layer during winter and in the upper 30 m layer during summer (Xu et al., 1995a); however, there were no reports of its vertical migration.
No.3 599GAO et al.: Zooplankton in the Changjiang River estuary
3.5.3 Riverine discharges
Riverine discharges have long been recognized as one of the factors contributing to the high productivity of estuaries. Although there is little evidence that river inputs of terrestrial carbon make a direct contribution to coastal food webs, such exported nutrients may stimulate in situ production in estuaries and thus enhance the survivorship and growth of fish and crustaceans in these systems (Loneragan et al., 1999). Moreover, river discharge into estuaries is characterized by variability under natural conditions, influencing plankton community composition and dynamics in the receiving waters (Haertel et al., 1967; Hodgkin et al., 1971; Ambler et al., 1985; Mallin et al., 1993). It is believed that reductions in the freshwater influx into estuaries will have a dramatic effect on ecosystem function, including zooplankton productivity, with subsequent shifts in energy flow patterns (Whitfield et al., 1988). Large storage reservoirs bring about changes in volume, quality and the distribution of water flowing downstream, which could lead to the breakdown of natural patterns of plankton variability. For example, diatoms use Si in their external frustules, and if the Si:N ratio is <1:1, diatoms may be replaced by diatoms with less silicified frustules or with non-diatoms and the diatom→zooplankton→fish (DZF) food webs will be compromised (Turner et al., 1998; Dortch et al., 2001). The Changjiang Three Gorges Project (TGP), which is the largest hydroelectric project in China, has already begun to store water. When this project is completed, the Changjiang discharge will be regulated on a seasonal basis, with a reduction in October but an increase from January to April. Furthermore, the sediment discharge of the Changjiang to the ocean will be significantly reduced after the TGP comes online, which could provide a deeper euphotic zone over the entire Changjiang estuary for the growth of phytoplankton. The combination of these factors will influence the zooplankton in the study area, although its influence may not be immediately considerable.
3.5.4 Eutrophication
Eutrophication, has been recognized as one of the most serious threats to the health of coastal marine systems today. At the beginning of the 1980s, nitrate at the river end-member of the Changjiang estuary was approximately 65 μmol/L in summer and dropped slightly to between 40 and 50 μmol/L in winter, while phosphate was <1 μmol/L during both seasons
(Edmond et al., 1985). The results of the present study show that the nitrate level has nearly doubled over the past 20 years, reaching an average of 111 μmol/L at the surface of the freshwater mass between Stations 1 and 10. Phosphate also increased correspondingly to >1 μmol/L and as high as 2.03 μmol/L at the surface of Station 8 (Gao et al., 2007a). The influence of this nutrient enrichment on the ecosystem of the Changjiang estuary has been indicated by the frequent occurrence of red tides owing to excessive phytoplankton blooms. Indeed, a total of 102 red tide events were reported between April and November 1986–1998 by surface-monitoring (SKLECR, 2000).
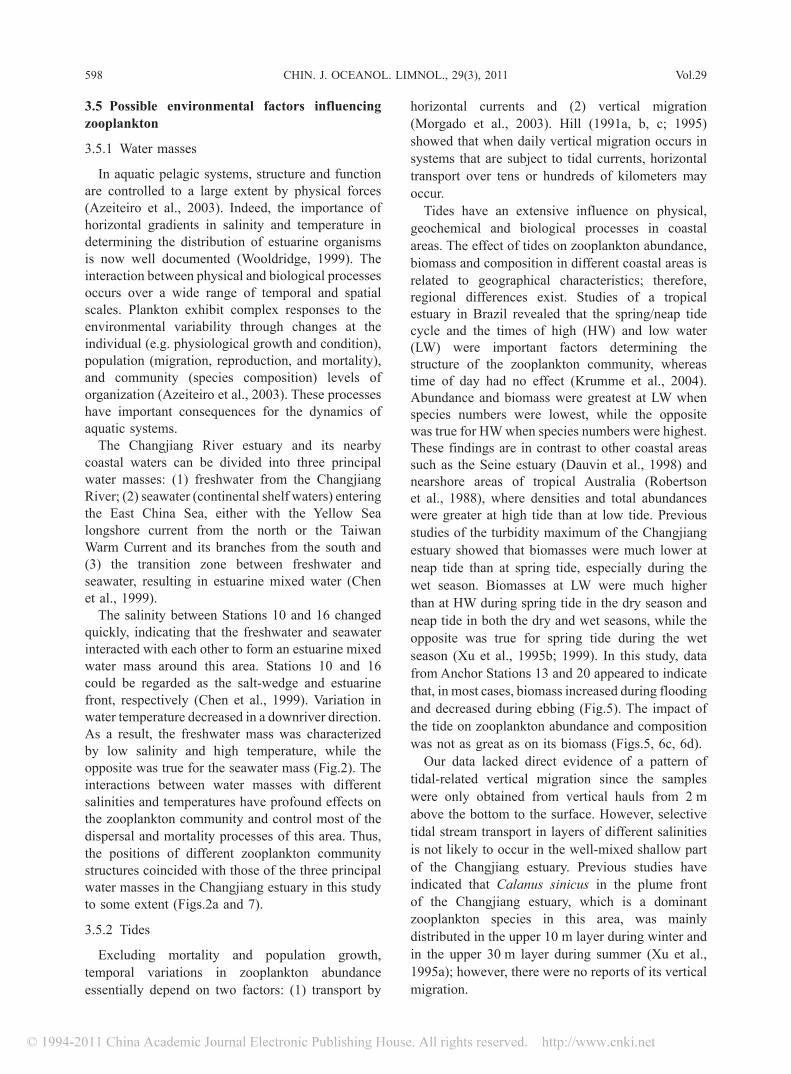
Eutrophication causes changes in the species composition, structure and function of marine communities in many areas of the world. A general shift from diatoms to dinoflagellates has been observed in the Changjiang River estuary phytoplankton. Red tides caused by the dinoflagellate, Prorocentrum dentatum, have become common in recent years and occurred during this cruise (Gao et al., 2005a). Based on the “bottom-up” process, a higher phytoplankton abundance may initially be beneficial to herbivorous zooplankton because it provides more food. However, data gained during the present study indicated that there were no significant correlations between zooplankton abundance/biomass and depth-integrated phytoplankton abundance (from surface to 2 m above the bottom) for the spatial or diurnal data (Fig.8). This was probably because nearly all areas possessing high phytoplankton abundance were dominated by the dinoflagellate Prorocentrum dentatum, which are not a preferred food for copepods due to their small size (Marcus, 2004). As a result, these organisms are the most important component of the zooplankton in the study area. It is difficult to determine if there are changes in the abundance, biomass and community composition of zooplankton >505 μm in response to eutrophication because of a lack of comparable data. Furthermore, our knowledge of zooplankton <505 μm is limited; therefore, further investigations on these plankton components should be conducted.
4 CONCLUSIONIn the Changjiang estuary, the spatial distribution
of zooplankton abundance and biomass showed distinct geographical variations in May 2003. Generally, both abundance and biomass gradually increased in downriver direction. The average abundance and biomass over the investigated area
600 Vol.29CHIN. J. OCEANOL. LIMNOL., 29(3), 2011
were 465.5 ind./m3 and 86.2 mg/m3, respectively. The fluctuation in zooplankton abundance and biomass was stronger in the seawater mass than in the estuarine mixed water mass over 48 h. Spatial data showed significant correlation between abundance and biomass, but there was no significant correlation between these values for diurnal data. Although the zooplankton composition in terms of dominant groups indicated distinct spatial differences, copepods accounted for >50% of the total zooplankton in most regions and times.
Three zooplankton assemblages were recognized through hierarchical cluster analysis. These existed along the salinity gradient from fresh water to the sea, and their positions coincided with those of the three principal water masses in the Changjiang estuary to some extent. The assemblages were classified as: (1) true estuarine, (2) estuarine and marine, and (3) euryhaline marine, and were characterized by the copepods Sinocalanus dorrii, Labidocera euchaeta and Calanus sinicus, respectively. Both spatial and diurnal data indicated no significant
correlation between zooplankton abundance/biomass and depth-integrated phytoplankton abundance.
Research of zooplankton in the Changjiang River estuary is insufficient. Therefore, long-term monitoring of the zooplankton ecology within this area is needed to investigate the effects of the rapid environmental changes that are currently occurring in the economic circle of the Changjiang Delta, Eastern China.
References
Ambler J W, Cloern J E, Hutchinson A. 1985. Seasonal cycles of zooplankton from San Francisco Bay. Hydrobiologia, 129: 177-197.
Azeiteiro U M, Marques J C. 2003. Intrtoducing “plankton responses to environmental variability”. Acta Oecologica, 24: S1.
Beardsley R C, Limeburner R, Yu H, Cannon G A. 1985. Discharge of the Changjiang (Yangtze River) into the East China Sea. Continental Shelf Research, 4: 57-76.
Chen J, Li D, Chen B, Hu F, Zhu H, Liu C. 1999. The processes of dynamic sedimentation in the Changjiang estuary. Journal of Sea Research, 41: 129-140.
Chen Y Q, Xu Z L, Wang Y L, Hu F X, Han M B, Yan H C. 1995a. An ecological study on zooplankton in plume
Fig.8 Relationship between zooplankton abundance and biomass with depth-integrated phytoplankton abundance for spatial (a, b) and diurnal data obtained from Anchor Stations 13 (c, d) and 20 (e, f)
1 6001 4001 2001 000
800600400200
0
0 500 1 000 1 500 2 000 2 500
Zoo
plan
kton
abu
ndan
ce (
ind.
/m3 )
500
600
400
300
200
100
0 10 20 30 40 50 200 220 240
900800700
600500400300200100
0 500 1 000 1 500 2 000 2 500
Phytoplankton abundance (103 cells/L)
500450
400
350
300250
200150
100
Zoo
plan
kton
abu
ndan
ce (
ind.
/m3 )
50
0
40
30
20
10
0 10 20 30 40 50 200 220 240
0 500 1 000 1 500 2 000 2 500
0 500 1 000 1 500 2 000 2 500
600450300150
8060
40
20
0
a
c
e
b
d
f
Phytoplankton abundance (103 cells/L)
No.3 601GAO et al.: Zooplankton in the Changjiang River estuary
front zone of Changjiang (Yangtze) River estuarine area. II. Species composition, community structure and indicator species. Journal of Fishery Sciences of China, 2(1): 59-63. (in Chinese with English abstract)
Chen Y Q, Xu Z L, Wang Y L, Hu F X, Hu H, Gu G C. 1995b. An ecological study on zooplankton in plume front zone of Changjiang (Yangtze) River estuarine area. I. Biomass distribution of dominant species. Journal of Fishery Sciences of China, 2(1): 49-58. (in Chinese with English abstract)
Chen Y Q, Zhen G X, Zhu Q Q. 1985. A preliminary study of the zooplankton in the Chanjiang estuary area. Donghai Marine Science, 3(3): 53-61. (in Chinese with English abstract)
Chen Z, Li J, Shen H, Wang Z. 2001. Yangtze River of China: historical analysis of discharge variability and sediment flux. Geomorphology, 41: 77-91.
Collins N R, Williams R. 1981. Zooplankton of the Bristol Channel and Severn Estuary. The distribution of four copepods in relation to salinity. Marine Biology, 64: 273-283.
Collins N R, Williams R. 1982. Zooplankton communities in the Bristol Channel and Severn estuary. Marine Ecology Progress Series, 9: 1-11.
Dauvin J C, Thiébaut E, Wang Z. 1998. Short-term changes in the mesozooplanktonic community in the Seine ROFI (Region of Freshwater Influence) (eastern English Channel). Journal of Plankton Research, 20: 1 145-1 167.
Dortch Q, Rabalais N N, Turner R E, Qureshi N A. 2001. Impacts of changing Si/N ratios and phytoplankton species composition. In: Rabalais N N, Turner R E eds. Coastal and Estuarine Studies 58. Coastal Hypoxia: Consequences for Living Resources and Ecosystems. American Geophysical Union, Washington D.C. p.37-48.
Edmond J M, Spivack A, Grant B C, Hu M H, Chen Z, Chen S, Zeng X. 1985. Chemical dynamics of the Changjiang estuary. Continental Shelf Research, 4: 17-36.
Edwards E S, Burkill P H, Stelfox C E. 1999. Zooplankton herbivory in the Arabian Sea during and after the SW monsoon, 1994. Deep-Sea Research II, 46: 843-863.
Froneman P W, Perissinotto R. 1996. Microzooplankton grazing and protozooplankton community structure in the south Atlantic and in the Atlantic sector of the Southern Ocean. Deep-Sea Research I, 43: 703-721.
Froneman P W, Perissinotto R, McQuaid C D. 1996. Seasonal variations in microzooplankton grazing in the region of the Subtropical Convergence. Marine Biology, 126: 433-442.
Gao X L, Song J M. 2005a. Phytoplankton distributions and their relationship with the environment in the Changjiang estuary, China. Marine Pollution Bulletin, 50: 327-335.
Gao X L, Song J M. 2007a. The concentrations of dissolved inorganic nitrogen, phosphorus and silicon in the Changjiang (Yangtze) River estuary in 2003. Oceanologia et Limnologia Sinica, 38: 420-431. (in Chinese with English abstract)
Gao X L, Song J M. 2008. Dissolved oxygen and O2 flux across water-air interface of the Changjiang estuary in May 2003. Journal of Marine Systems, 74: 343-350.
Gao X L, Song J M, Li N, Li X G. 2007b. Spatial distribution and diurnal variation of chemical oxygen demand at the beginning of the rainy season in the Changjiang (Yangtze) River estuary. Chinese Journal of Oceanology and Limnology, 25: 254-260.
Gao X L, Song J M, Li X G, Yuan H M, Li N. 2005b. Spatial and temporal variations in pH and total alkalinity at the beginning of the rainy season in the Changjiang estuary, China. Acta Oceanologica Sinica, 24(5): 68-77.
Gianesella S M F, Saldanha-Corrêa F M P, Teixeira C. 2000. Tidal effects on nutrients and phytoplankton distribution in Bertioga Channel, São Paulo, Brazil. Aquatic Ecosystem Health and Management, 3: 533-544.
Grasshoff K, Ehrhardt M, Kremling K. 1983. Methods of Seawater Analysis, 2nd Edition. Verlag Chemie GmbH D6940 Weinheim. 419p.
Guo P Y, Shen H T, Liu A C, Wang J H, Yang Y L. 2003. The species composition, community structure and diversity of zooplankton in Changjiang estuary. Acta Ecologica Sinica, 23(5): 892-900. (in Chinese with English abstract)
Haertel L, Osterberg C. 1967. Ecology of zooplankton, benthos and fishes in the Columbia River estuary. Ecology, 48: 459-472.
Hill A E. 1991a. A mechanism for horizontal zooplankton transport by vertical migration in tidal currents. Marine Biology, 111: 485-492.
Hill A E. 1991b. Advection-diffusion-mortality solutions for investigating pelagic larval dispersal. Marine Ecology Progress Series, 70: 117-128.
Hill A E. 1991c. Vertical migration in tidal currents. Marine Ecology Progress Series, 75: 39-54.
Hill A E. 1995. The kinematical principles governing horizontal transport induced by vertical migration in tidal flows. Journal of the Marine Biological Association of the United Kingdom, 75: 3-13.
Hodgkin E P, Rippingale R J. 1971. Interspecies conflict in estuarine copepods. Limnology and Oceanography, 16: 573-576.
Hong J C. 2003. Ecological study on red tide in the China main estuaries and bays. Part VI. Changjiang estuary. In: Qi Y Z ed. China Inshore Red Tide. Science Press, Beijing, China. p.159-178.
Imabayashi H, Endo T. 1986. Distribution of near-bottom plankton in the Ohta River estuary, Hiroshima Bay, in relation to salinity. Bulletin of the Plankton Society of Japan, 33: 113-123.
Krumme U, Liang T H. 2004. Tidal-induced changes in a copepod-dominated zooplankton community in a macrotidal mangrove channel in northern Brazil. Zoological Studies, 43: 404-414.
Landry M R, Hassett R P. 1982. Estimating the grazing impact of marine micro-zooplankton. Marine Biology, 67: 283-288.
Li J F, Chen Z. 1998. Sediment resuspension and implications for turbidity maximum in the Changjiang estuary. Marine Geology, 148: 117-124.
Li X L, Song J M, Yuan H M. 2006. Inorganic carbon of sediments in the Yangtze River Estuary and Jiaozhou Bay. Biogeochemistry, 77: 177-197.
Loneragan N R, Bunn S E. 1999. River flows and estuarine ecosystems: Implications for coastal fisheries from a
602 Vol.29CHIN. J. OCEANOL. LIMNOL., 29(3), 2011
review and a case study of the Logan River, southeast Queensland. Australian Journal of Ecology, 24: 431-440.
Lorenzen C J. 1967. Determination of chlorophyll and phaeopigments: spectrophotometric equations. Limnology and Oceanography, 12: 343-346.
Mallin M A, Paerl H W, Rudek J, Bates P W. 1993. Regulation of estuarine primary production by watershed rainfall and river flow. Marine Ecology Progress Series, 93: 199-203.
Marcus N. 2004. An overview of the impacts of eutrophication and chemical pollutions on copepods of the coastal zone. Zoological Studies, 43: 211-217.
Milliman J D, Shen H, Yang Z, Mead R H. 1986. Transport and deposition of river sediment in the Changjiang estuary and adjacent continental shelf. Continental Shelf Research, 4: 37-45.
Morgado F, Queiroga H, Melo F, Sorbe J. 2003. Zooplankton abundance in a coastal station off the Ria de Aveiro inlet (north-western Portugal): relations with tidal and day/night cycles. Acta Oecologica, 24: S175-S181.
Reckermann M, Veldhuis M J W. 1997. Trophic interaction between picophytoplankton and micro- and nanozooplankton in the western Arabian Sea during the NE monsoon 1993. Aquatic Microbial Ecology, 12: 263-273.
Robertson A I, Dixon P, Daniel P A. 1988. Zooplankton dynamics in mangrove and other nearshore habitats in tropical Australia. Marine Ecology Progress Series, 43: 139-150.
Sharp J H, Pennock J R, Church T M, Tramontano J M, Cifuentes L A. 1984. The estuarine interaction of nutrients, organics and metals: a case study in the Delaware estuary. In: Kennedy V S ed. The Estuary as a Filter. Academic Press, New York. p.241-258.
SKLECR (The State Key Laboratory of Estuarine and Coastal Research). 2000. Environment Investigation in the Changjiang estuary, Technical Report. East China Normal University, Shanghai, China. 182p.
State Oceanic Administration, 1991. Specifications for Oceanographic Survey. Standards Press of China, Beijing.
Strom S L, Strom M W. 1996. Microplankton growth, grazing and community structure in the northern Gulf of Mexico. Marine Ecology Progress Series, 130: 229-240.
Sun J, Liu D Y, Wang Z L, Shi X Y, Li R X, Zhu M Y. 2003. Microzooplankton herbivory during red tide-frequent-occurrence period in spring in the East China Sea. Chinese Journal of Applied Ecology, 14(7): 1 073-1 080. (in Chinese with English abstract)
Telesh I V. 2004. Plankton of the Baltic estuarine ecosystems with emphasis on Neva estuary: a review of present knowledge and research perspectives. Marine Pollution Bulletin, 49: 206-219.
Turner R E, Qureshi N A, Rabalais N N, Dortch Q, Justić D, Shaw R, Cope J. 1998. Fluctuating silicate:nitrate ratios
and coastal plankton food webs. Proceedings of the National Academy of Sciences, 95: 13 048-13 051.
Uye S. 1988. Temperature-dependent development and growth of Calanus sinicus (Copepoda: Calanoida) in the laboratory. Hydrobiologia, 167/168: 285-293.
Uye S. 2000. Why does Calanus sinicus prosper in the shelf ecosystem of the Northwest Pacific Ocean? ICES Journal of Marine Science, 57: 1 850-1 855.
Whitfield A K, Wooldridge T H. 1988. Changes in freshwater supplies to southern African estuaries: some theoretical and practical considerations. In: Dyer K R, Orth R J eds. Changes in Fluxes in Estuaries. Olsen & Olsen, Denmark. p.41-49.
Wooldridge T. 1999. Estuarine zooplankton community structure and dynamics. In: Allanson B R, Baird D eds. Estuaries of South Africa. Cambridge University Press, Cambridge, United Kingdom, p.141-166.
Wu R S S. 1999. Eutrophication, water borne pathogens and xenobiotic compounds: environmental risks and challenges. Marine Pollution Bulletin, 39: 11-22.
Xu Z L, Hong B, Zhu M Y, Chen Y Q. 2003. Ecological characteristics of zooplankton in frequent HAB areas of the East China Sea in spring. Chinese Journal of Applied Ecology, 14(7): 1 081-1 085. (in Chinese with English abstract)
Xu Z L, Wang Y L, Bai X M, Chen Y Q. 1999. An ecological study on zooplankton in the Changjiang estuary. Journal of Fishery of China, 6(5): 55-58. (in Chinese with English abstract)
Xu Z L, Wang Y L, Chen Y Q, Hu H, Han M B, Li X H. 1995a. An ecological study on zooplankton in plume front zone of Changjiang (Yangtze) River estuarine area. III. Vertical distribution of dominant species. Journal of Fishery Sciences of China, 2(1): 64-70. (in Chinese with English abstract)
Xu Z L, Wang Y L, Chen Y Q, Shen H T. 1995b. An ecological study on zooplankton in maximum turbid zone of estuarine area of Changjiang (Yangtze) River. Journal of Fishery Sciences of China, 2(1): 39-48. (in Chinese with English abstract)
Yang S, Ding P, Chen S. 2001. Changes in progradation rate of the tidal flats at the mouth of the Changjiang (Yangtze) River, China. Geomorphology, 38: 167-180.
Yang S L, Belkin I M, Belkina A I, Zhao Q Y, Zhu J, Ding P X. 2003. Delta response to decline in sediment supply from the Yangtze River: evidence of the recent four decades and expectations for the next half-century. Estuarine, Coastal and Shelf Science, 57: 689-699.
Zhang J, Yu Z G, Liu S M, Xu H, Liu M G. 1997. Dynamics of nutrient elements in three estuaries of North China: the Luanhe, Shuangtaizihe and Yalujiang. Estuaries, 20(1): 110-123.
Zhu D, Iverson A. 1990. Anchovy and other fish resources in the Yellow Sea and East China Sea November 1984-April 1988. Marine Fisheries Research, 11: 1-143. (in Chinese with English abstract)
Recommended