Embed Size (px)
Citation preview

April 23, 2014
Bladex Corporate Presentation
Results as of March 31, 2015
2
“This presentation contains forward-looking statements. These statements are made under the “safe harbor” provisions
established by the U.S. Private Securities Litigation Reform Act of 1995. Forward-looking statements involve inherent risks
and uncertainties. The forward-looking statements in this presentation reflect the expectations of the Bank’s management
and are based on currently available data; however, actual experience with respect to these factors is subject to future
events and uncertainties, which could materially impact the Bank’s expectations. A number of factors could cause actual
performance and results to differ materially from those contained in any forward-looking statement, including but not limited
to the following: the anticipated growth of the Bank’s credit portfolio, including its trade finance portfolio; the continuation of
the Bank’s preferred creditor status; the impact of increasing interest rates and of improving macroeconomic environment in
the Region on the Bank’s financial condition; the execution of the Bank’s strategies and initiatives, including its revenue
diversification strategy; the adequacy of the Bank’s allowance for credit losses; the need for additional provisions for credit
losses; the volatility of the Bank’s Treasury trading revenues; the Bank’s ability to achieve future growth and increase its
number of clients, the Bank’s ability to reduce its liquidity levels and increase its leverage; the Bank’s ability to maintain its
investment-grade credit ratings; the availability and mix of future sources of funding for the Bank’s lending operations;
potential trading losses; existing and future governmental banking and tax regulations; the possibility of fraud; and the
adequacy of the Bank’s sources of liquidity to replace large deposit withdrawals.”
Table of Contents Page
Who We Are: Bladex - The Latin America Trade Finance Bank….………………………..…………….…..4
How We Manage Our Portfolio…….…………………………………………………………………..….…...14
Liquidity Management & Funding……………………………………………………………………….……..19
Our Financial Performance ………………….………………………………………………………….……...22
3
Who We Are:
BLADEX - The Latin America Trade Finance Bank
4
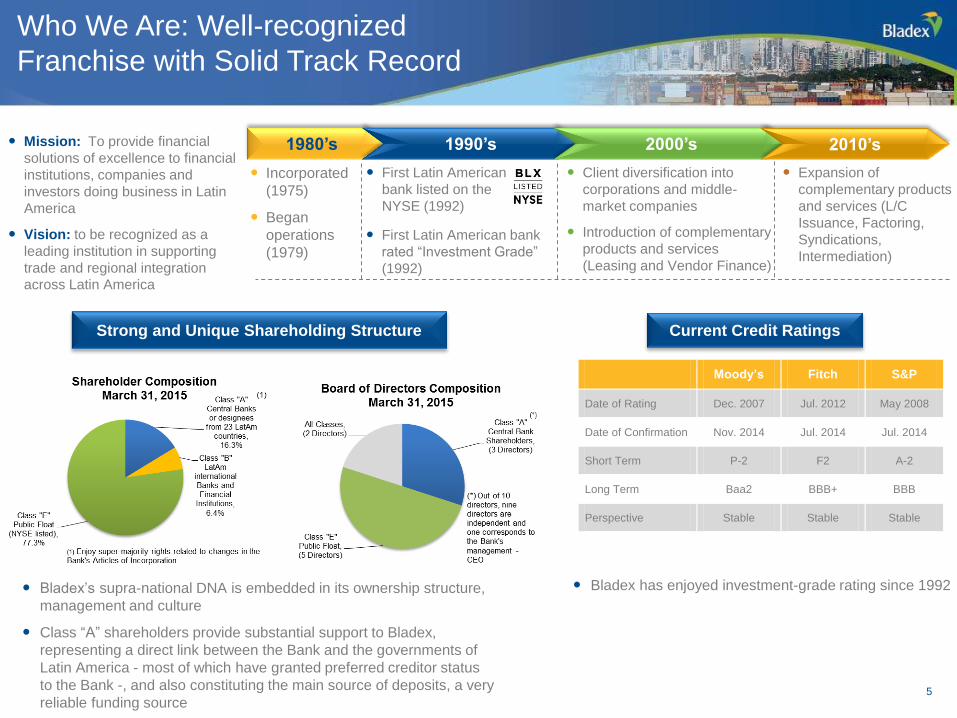
Who We Are: Well-recognized
Franchise with Solid Track Record
Incorporated
(1975)
Began
operations
(1979)
First Latin American
bank listed on the
NYSE (1992)
Client diversification into
corporations and middle-
market companies
Introduction of complementary
products and services
(Leasing and Vendor Finance)
Current Credit Ratings
1980’s 1990’s 2000’s
Moody’s Fitch S&P
Date of Rating Dec. 2007 Jul. 2012 May 2008
Date of Confirmation Nov. 2014 Jul. 2014 Jul. 2014
Short Term P-2 F2 A-2
Long Term Baa2 BBB+ BBB
Perspective Stable Stable Stable
5
2010’s
Expansion of
complementary products
and services (L/C
Issuance, Factoring,
Syndications,
Intermediation)
Mission: To provide financial
solutions of excellence to financial
institutions, companies and
investors doing business in Latin
America
Vision: to be recognized as a
leading institution in supporting
trade and regional integration
across Latin America
Strong and Unique Shareholding Structure
Bladex’s supra-national DNA is embedded in its ownership structure,
management and culture
Class “A” shareholders provide substantial support to Bladex,
representing a direct link between the Bank and the governments of
Latin America - most of which have granted preferred creditor status
to the Bank -, and also constituting the main source of deposits, a very
reliable funding source
Bladex has enjoyed investment-grade rating since 1992
First Latin American bank
rated “Investment Grade”
(1992)
5
6
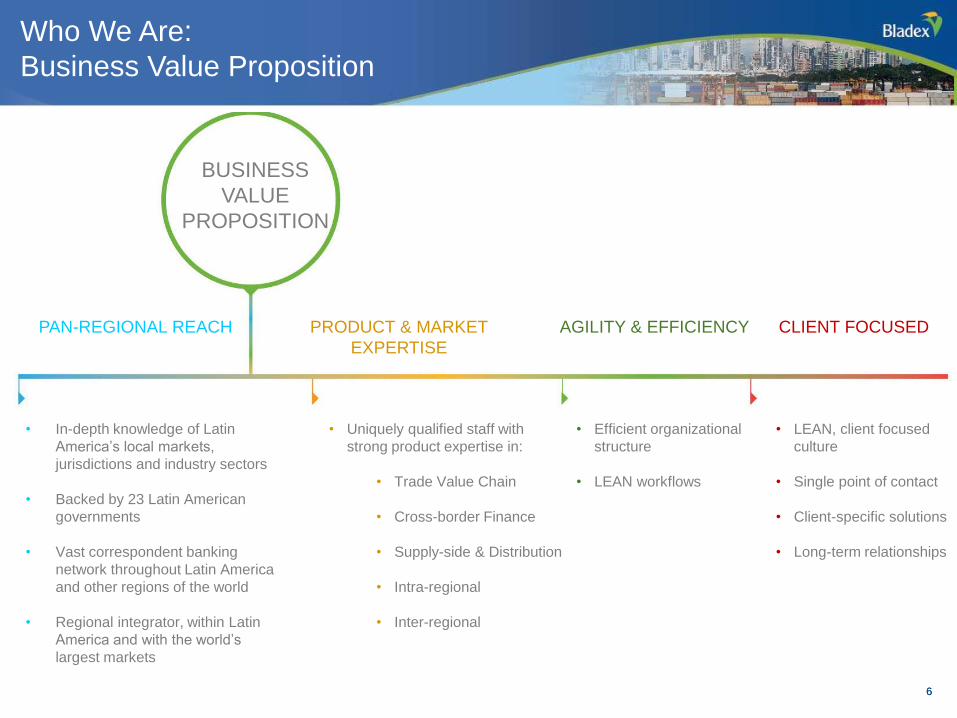
Who We Are:
Business Value Proposition
6 6
6
PAN-REGIONAL REACH CLIENT FOCUSED AGILITY & EFFICIENCY PRODUCT & MARKET
EXPERTISE
BUSINESS
VALUE
PROPOSITION
• In-depth knowledge of Latin
America’s local markets,
jurisdictions and industry sectors
• Backed by 23 Latin American
governments
• Vast correspondent banking
network throughout Latin America
and other regions of the world
• Regional integrator, within Latin
America and with the world’s
largest markets
• Uniquely qualified staff with
strong product expertise in:
• Trade Value Chain
• Cross-border Finance
• Supply-side & Distribution
• Intra-regional
• Inter-regional
• Efficient organizational
structure
• LEAN workflows
• LEAN, client focused
culture
• Single point of contact
• Client-specific solutions
• Long-term relationships
7
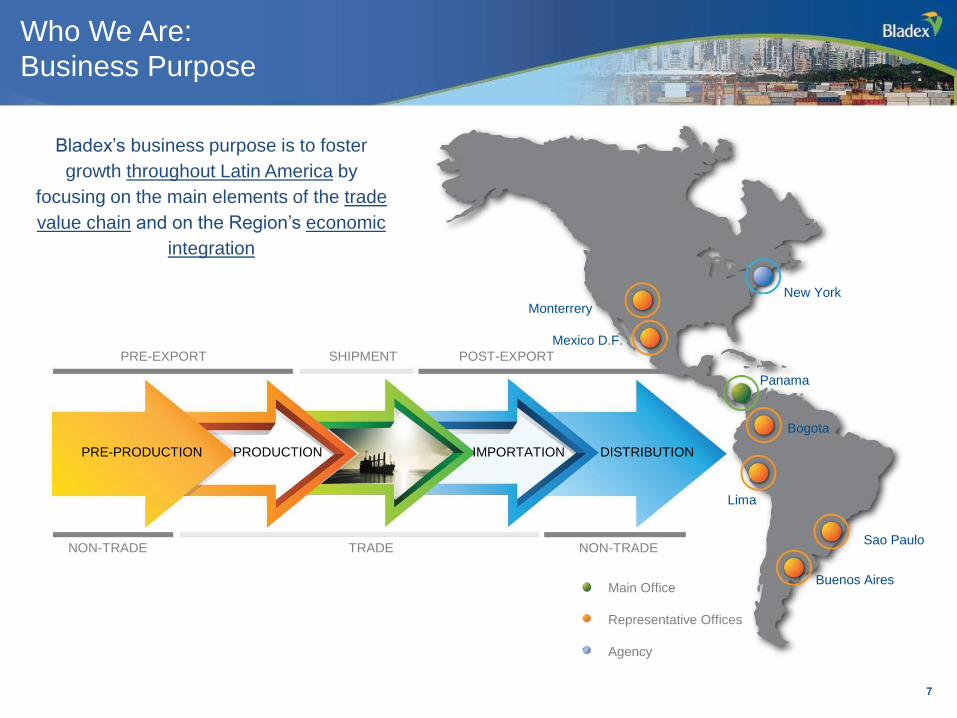
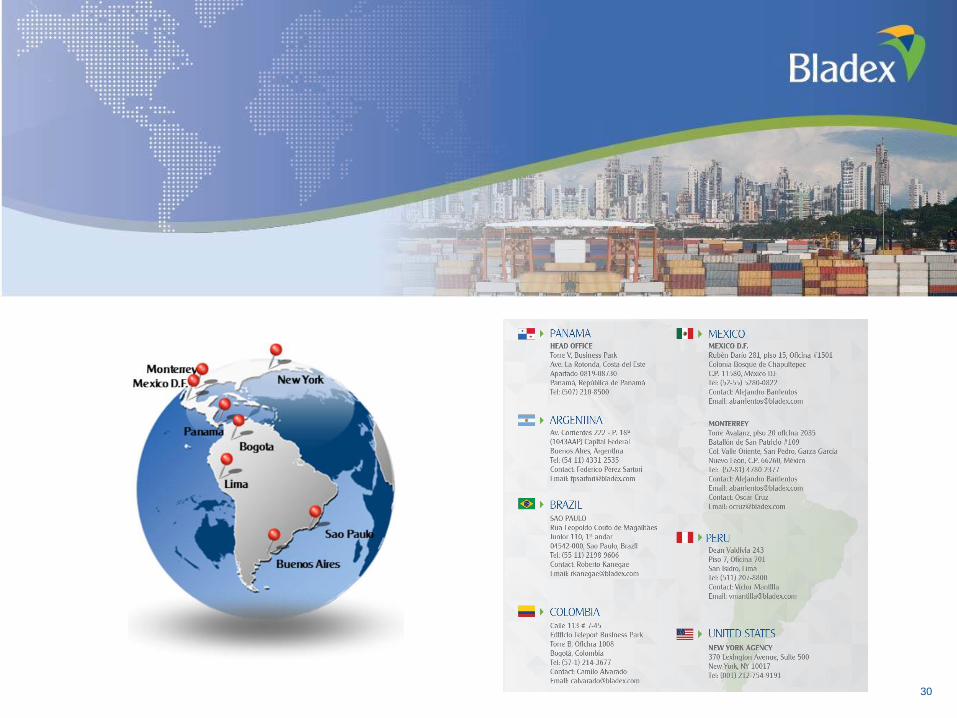
Who We Are:
Business Purpose
7 7
7
PRE-PRODUCTION PRODUCTION IMPORTATION DISTRIBUTION
New York
Monterrery
Buenos Aires
Lima
Panama
Mexico D.F.
Bogota
Sao Paulo
Main Office
Representative Offices
Agency
PRE-EXPORT SHIPMENT POST-EXPORT
NON-TRADE TRADE NON-TRADE
Bladex’s business purpose is to foster
growth throughout Latin America by
focusing on the main elements of the trade
value chain and on the Region’s economic
integration
8
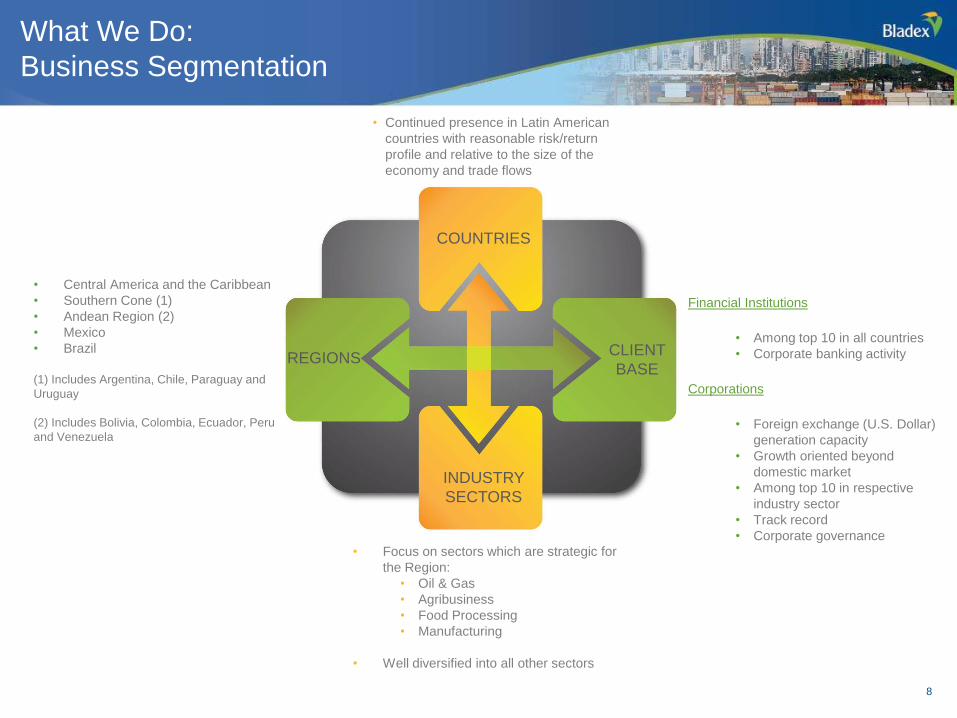
What We Do:
Business Segmentation
REGIONS
INDUSTRY
SECTORS
COUNTRIES
CLIENT
BASE
• Central America and the Caribbean
• Southern Cone (1)
• Andean Region (2)
• Mexico
• Brazil
(1) Includes Argentina, Chile, Paraguay and
Uruguay
(2) Includes Bolivia, Colombia, Ecuador, Peru
and Venezuela
Financial Institutions
• Among top 10 in all countries
• Corporate banking activity
Corporations
• Foreign exchange (U.S. Dollar)
generation capacity
• Growth oriented beyond
domestic market
• Among top 10 in respective
industry sector
• Track record
• Corporate governance
• Focus on sectors which are strategic for
the Region:
• Oil & Gas
• Agribusiness
• Food Processing
• Manufacturing
• Well diversified into all other sectors
• Continued presence in Latin American
countries with reasonable risk/return
profile and relative to the size of the
economy and trade flows
8
9
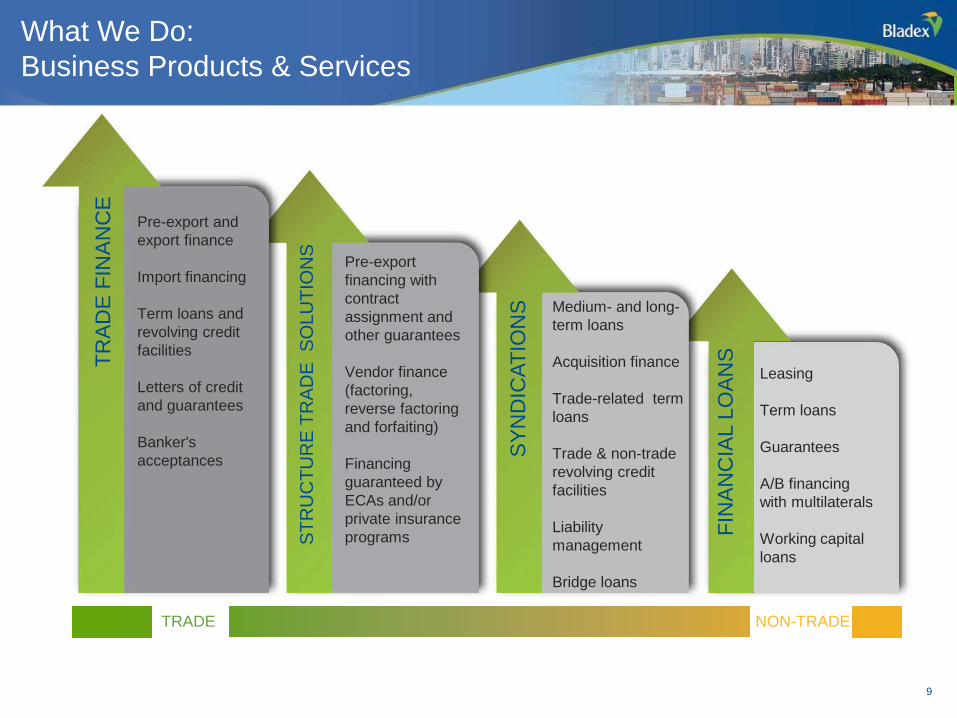
What We Do:
Business Products & Services
9
Pre-export and
export finance
Import financing
Term loans and
revolving credit
facilities
Letters of credit
and guarantees
Banker's
acceptances
Pre-export
financing with
contract
assignment and
other guarantees
Vendor finance
(factoring,
reverse factoring
and forfaiting)
Financing
guaranteed by
ECAs and/or
private insurance
programs
Medium- and long-
term loans
Acquisition finance
Trade-related term
loans
Trade & non-trade
revolving credit
facilities
Liability
management
Bridge loans
Leasing
Term loans
Guarantees
A/B financing
with multilaterals
Working capital
loans
TRADE NON-TRADE
TR
AD
E F
INA
NC
E
ST
RU
CT
UR
E T
RA
DE
S
OL
UT
ION
S
SY
ND
ICA
TIO
NS
FIN
AN
CIA
L L
OA
NS
10
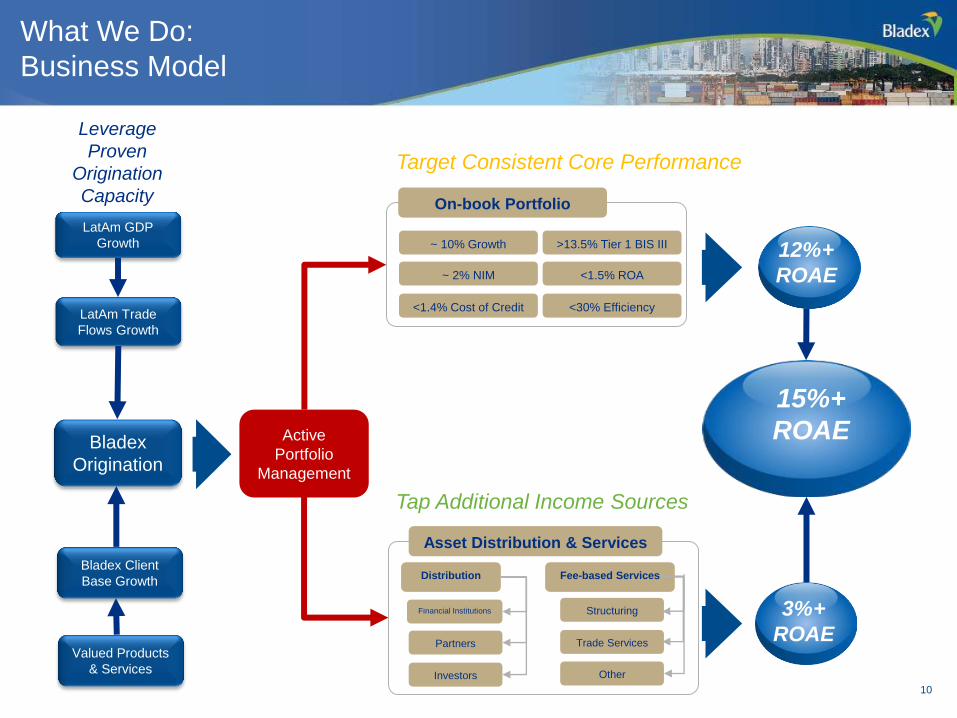
What We Do:
Business Model
Leverage
Proven
Origination
Capacity
Target Consistent Core Performance
LatAm GDP
Growth
LatAm Trade
Flows Growth
Bladex
Origination
Bladex Client
Base Growth
Valued Products
& Services
Active
Portfolio
Management
~ 2% NIM <1.5% ROA
<1.4% Cost of Credit <30% Efficiency
~ 10% Growth
On-book Portfolio
>13.5% Tier 1 BIS III
Partners Trade Services
Investors Other
Financial Institutions
Distribution
Structuring
Fee-based Services
Asset Distribution & Services
Tap Additional Income Sources
NY006PF6_1.cdr 3%+
ROAE
15%+
ROAE
NY006PF6_1.cdr 12%+
ROAE
10
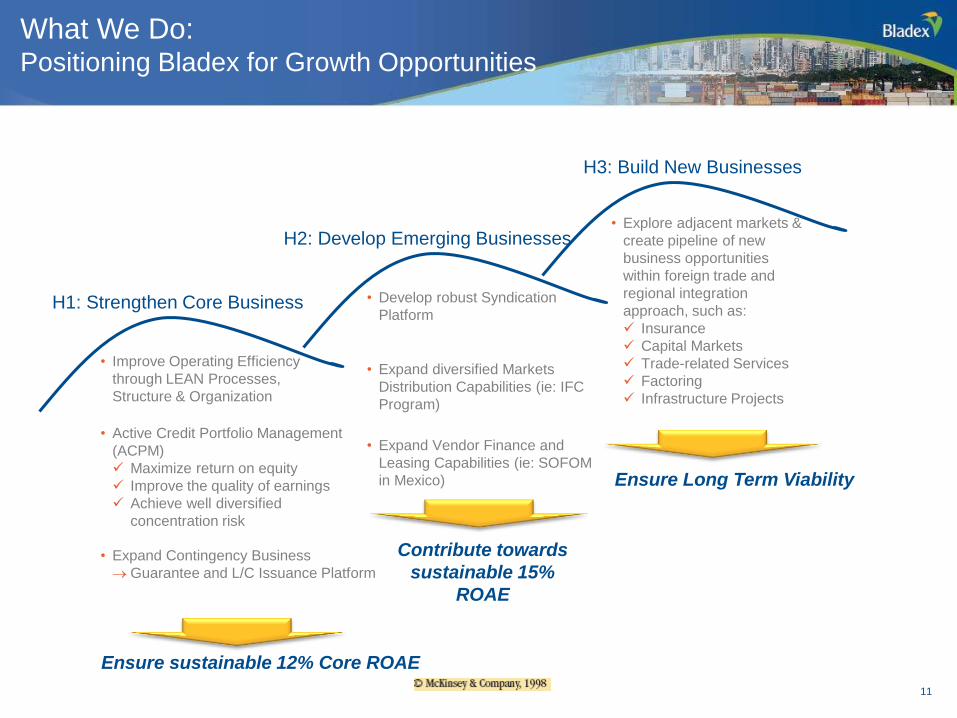
What We Do: Positioning Bladex for Growth Opportunities
• Improve Operating Efficiency
through LEAN Processes,
Structure & Organization
• Active Credit Portfolio Management
(ACPM)
Maximize return on equity
Improve the quality of earnings
Achieve well diversified
concentration risk
• Expand Contingency Business
Guarantee and L/C Issuance Platform
• Develop robust Syndication
Platform
• Expand diversified Markets
Distribution Capabilities (ie: IFC
Program)
• Expand Vendor Finance and
Leasing Capabilities (ie: SOFOM
in Mexico)
Ensure sustainable 12% Core ROAE
Contribute towards
sustainable 15%
ROAE
• Explore adjacent markets &
create pipeline of new
business opportunities
within foreign trade and
regional integration
approach, such as:
Insurance
Capital Markets
Trade-related Services
Factoring
Infrastructure Projects
Ensure Long Term Viability
11
H1: Strengthen Core Business
H2: Develop Emerging Businesses
H3: Build New Businesses
11
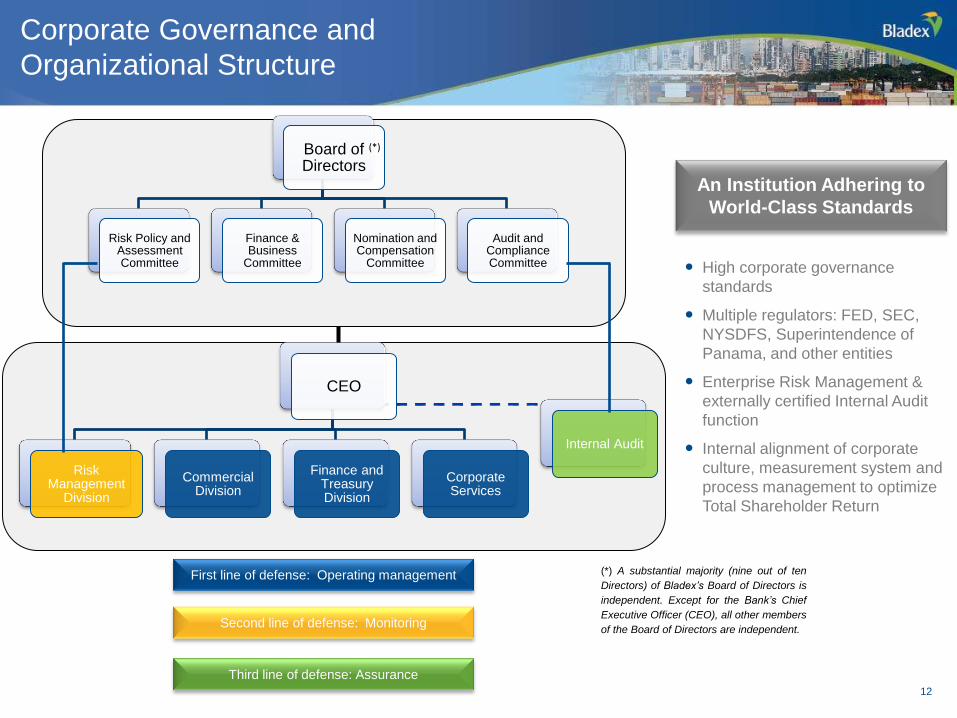
Second line of defense: Monitoring
Third line of defense: Assurance
First line of defense: Operating management
Corporate Governance and
Organizational Structure
Board of Directors
Risk Policy and Assessment Committee
Finance & Business
Committee
Nomination and Compensation
Committee
Audit and Compliance Committee
CEO
Risk Management
Division
Commercial Division
Finance and Treasury Division
Corporate Services
Internal Audit
An Institution Adhering to
World-Class Standards
High corporate governance
standards
Multiple regulators: FED, SEC,
NYSDFS, Superintendence of
Panama, and other entities
Enterprise Risk Management &
externally certified Internal Audit
function
Internal alignment of corporate
culture, measurement system and
process management to optimize
Total Shareholder Return
(*)
(*) A substantial majority (nine out of ten
Directors) of Bladex’s Board of Directors is
independent. Except for the Bank’s Chief
Executive Officer (CEO), all other members
of the Board of Directors are independent.
12
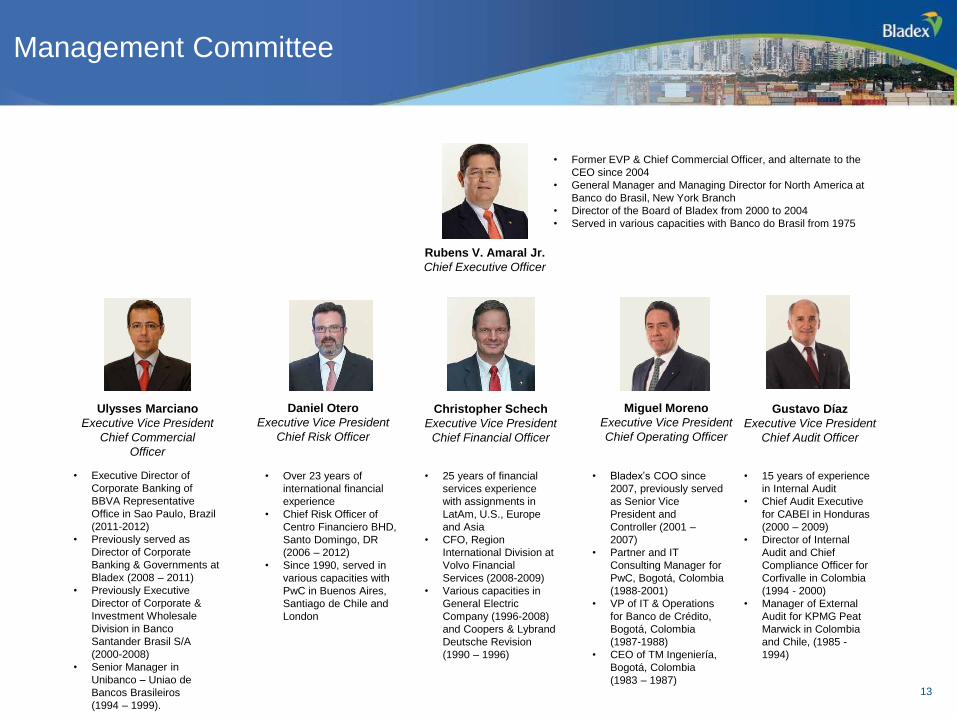
Rubens V. Amaral Jr.
Chief Executive Officer
Ulysses Marciano
Executive Vice President
Chief Commercial
Officer
Daniel Otero
Executive Vice President
Chief Risk Officer
Christopher Schech
Executive Vice President
Chief Financial Officer
Miguel Moreno
Executive Vice President
Chief Operating Officer
Gustavo Díaz
Executive Vice President
Chief Audit Officer
• Executive Director of
Corporate Banking of
BBVA Representative
Office in Sao Paulo, Brazil
(2011-2012)
• Previously served as
Director of Corporate
Banking & Governments at
Bladex (2008 – 2011)
• Previously Executive
Director of Corporate &
Investment Wholesale
Division in Banco
Santander Brasil S/A
(2000-2008)
• Senior Manager in
Unibanco – Uniao de
Bancos Brasileiros
(1994 – 1999).
• Over 23 years of
international financial
experience
• Chief Risk Officer of
Centro Financiero BHD,
Santo Domingo, DR
(2006 – 2012)
• Since 1990, served in
various capacities with
PwC in Buenos Aires,
Santiago de Chile and
London
• 25 years of financial
services experience
with assignments in
LatAm, U.S., Europe
and Asia
• CFO, Region
International Division at
Volvo Financial
Services (2008-2009)
• Various capacities in
General Electric
Company (1996-2008)
and Coopers & Lybrand
Deutsche Revision
(1990 – 1996)
• Bladex’s COO since
2007, previously served
as Senior Vice
President and
Controller (2001 –
2007)
• Partner and IT
Consulting Manager for
PwC, Bogotá, Colombia
(1988-2001)
• VP of IT & Operations
for Banco de Crédito,
Bogotá, Colombia
(1987-1988)
• CEO of TM Ingeniería,
Bogotá, Colombia
(1983 – 1987)
• 15 years of experience
in Internal Audit
• Chief Audit Executive
for CABEI in Honduras
(2000 – 2009)
• Director of Internal
Audit and Chief
Compliance Officer for
Corfivalle in Colombia
(1994 - 2000)
• Manager of External
Audit for KPMG Peat
Marwick in Colombia
and Chile, (1985 -
1994)
• Former EVP & Chief Commercial Officer, and alternate to the
CEO since 2004
• General Manager and Managing Director for North America at
Banco do Brasil, New York Branch
• Director of the Board of Bladex from 2000 to 2004
• Served in various capacities with Banco do Brasil from 1975
Management Committee
13 13
How We Manage Our Portfolio
14
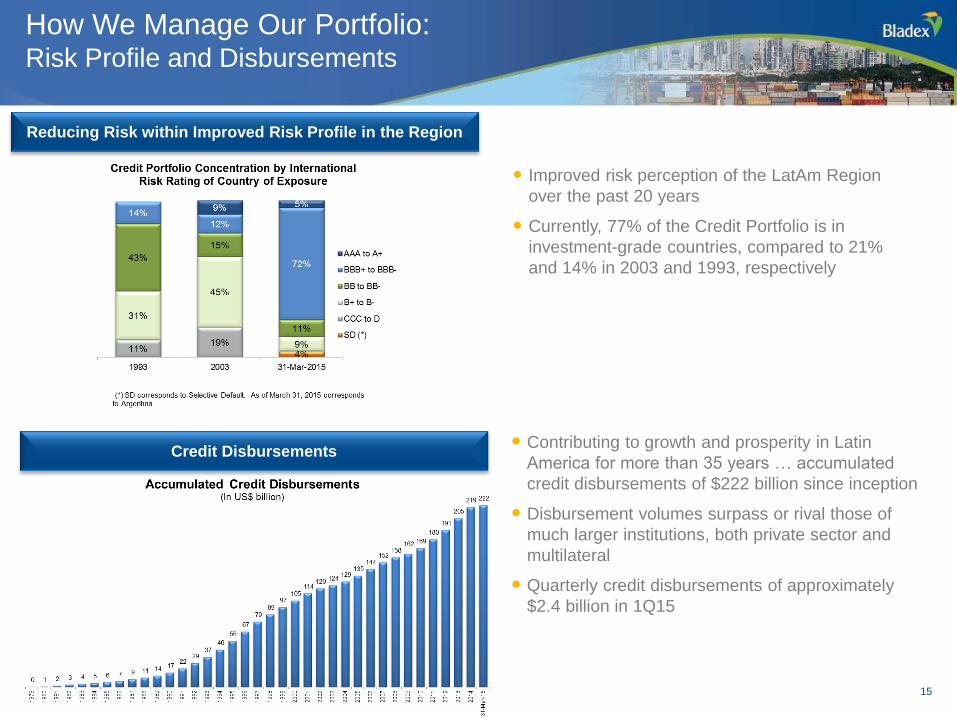
Improved risk perception of the LatAm Region
over the past 20 years
Currently, 77% of the Credit Portfolio is in
investment-grade countries, compared to 21%
and 14% in 2003 and 1993, respectively
15
Reducing Risk within Improved Risk Profile in the Region
Credit Disbursements Contributing to growth and prosperity in Latin
America for more than 35 years … accumulated
credit disbursements of $222 billion since inception
Disbursement volumes surpass or rival those of
much larger institutions, both private sector and
multilateral
Quarterly credit disbursements of approximately
$2.4 billion in 1Q15
How We Manage Our Portfolio: Risk Profile and Disbursements
15
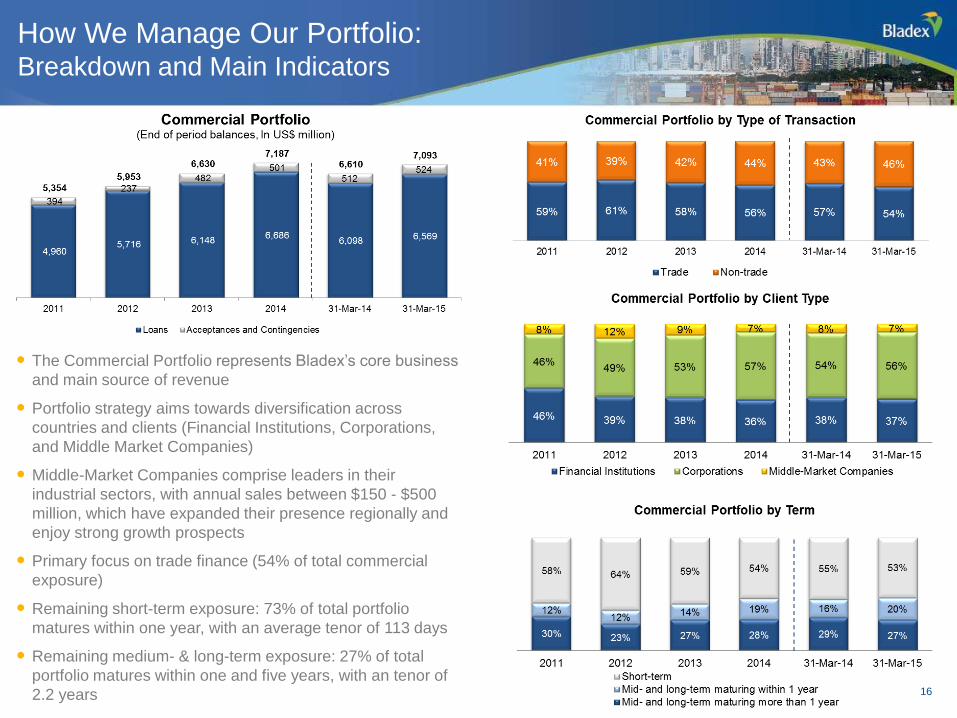
How We Manage Our Portfolio: Breakdown and Main Indicators
The Commercial Portfolio represents Bladex’s core business
and main source of revenue
Portfolio strategy aims towards diversification across
countries and clients (Financial Institutions, Corporations,
and Middle Market Companies)
Middle-Market Companies comprise leaders in their
industrial sectors, with annual sales between $150 - $500
million, which have expanded their presence regionally and
enjoy strong growth prospects
Primary focus on trade finance (54% of total commercial
exposure)
Remaining short-term exposure: 73% of total portfolio
matures within one year, with an average tenor of 113 days
Remaining medium- & long-term exposure: 27% of total
portfolio matures within one and five years, with an tenor of
2.2 years 16
16
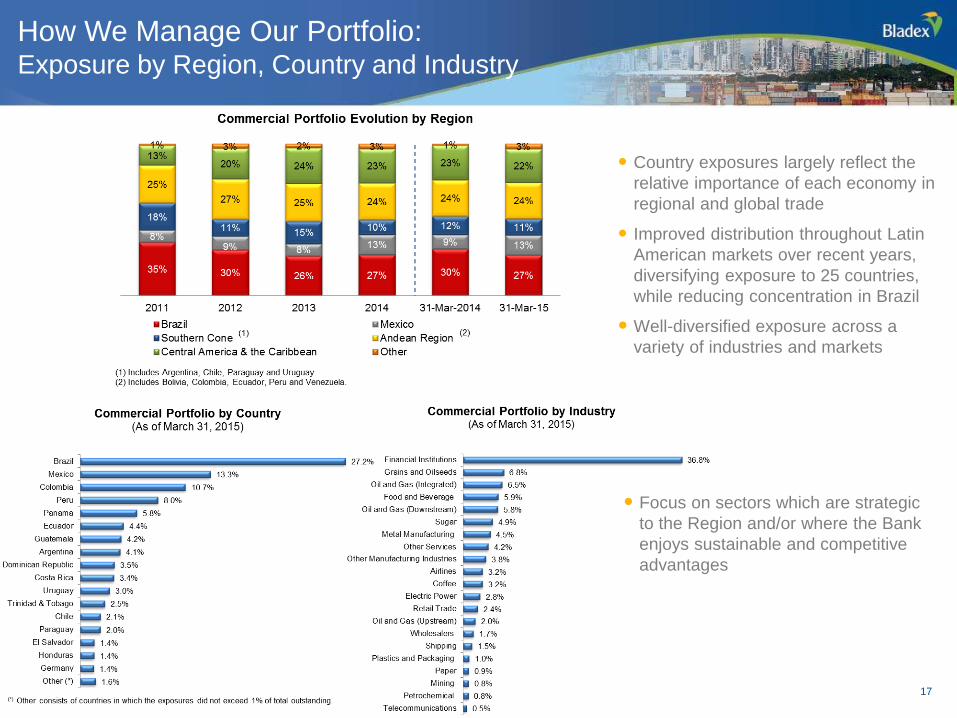
How We Manage Our Portfolio: Exposure by Region, Country and Industry
Country exposures largely reflect the
relative importance of each economy in
regional and global trade
Improved distribution throughout Latin
American markets over recent years,
diversifying exposure to 25 countries,
while reducing concentration in Brazil
Well-diversified exposure across a
variety of industries and markets
17 17
Focus on sectors which are strategic
to the Region and/or where the Bank
enjoys sustainable and competitive
advantages
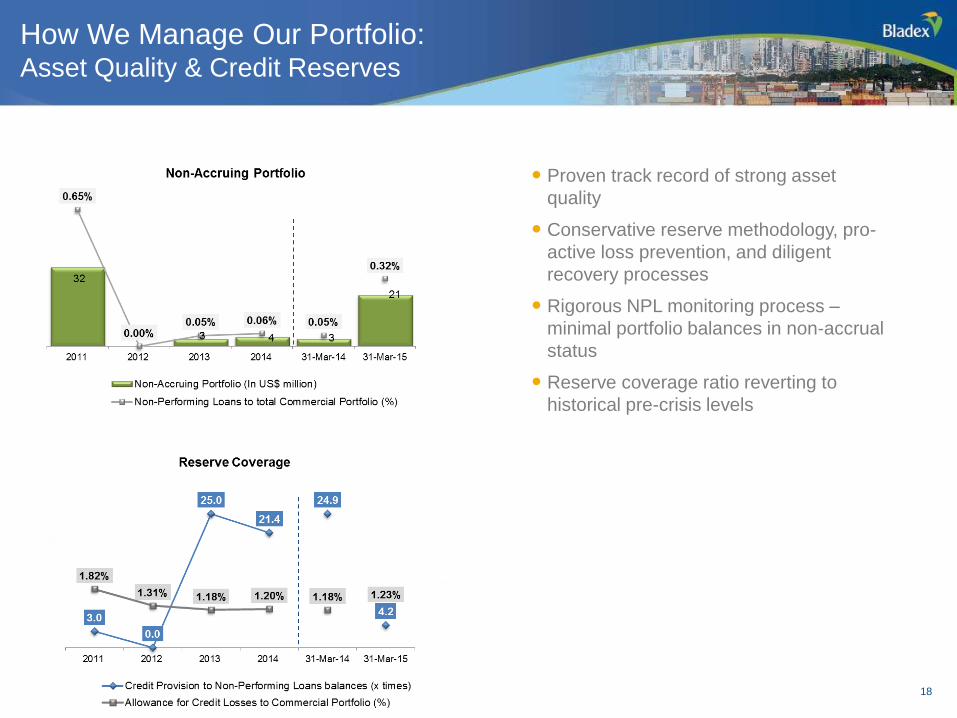
How We Manage Our Portfolio: Asset Quality & Credit Reserves
Proven track record of strong asset
quality
Conservative reserve methodology, pro-
active loss prevention, and diligent
recovery processes
Rigorous NPL monitoring process –
minimal portfolio balances in non-accrual
status
Reserve coverage ratio reverting to
historical pre-crisis levels
18 18
Liquidity Management & Funding
19
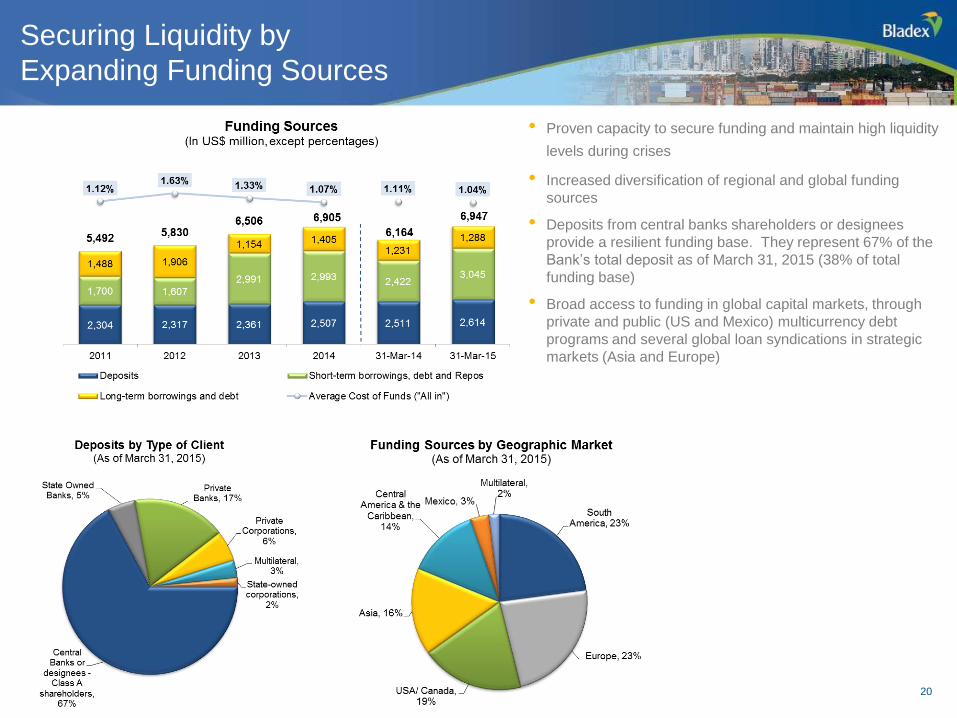
Securing Liquidity by
Expanding Funding Sources
• Proven capacity to secure funding and maintain high liquidity
levels during crises
• Increased diversification of regional and global funding
sources
• Deposits from central banks shareholders or designees
provide a resilient funding base. They represent 67% of the
Bank’s total deposit as of March 31, 2015 (38% of total
funding base)
• Broad access to funding in global capital markets, through
private and public (US and Mexico) multicurrency debt
programs and several global loan syndications in strategic
markets (Asia and Europe)
20 20
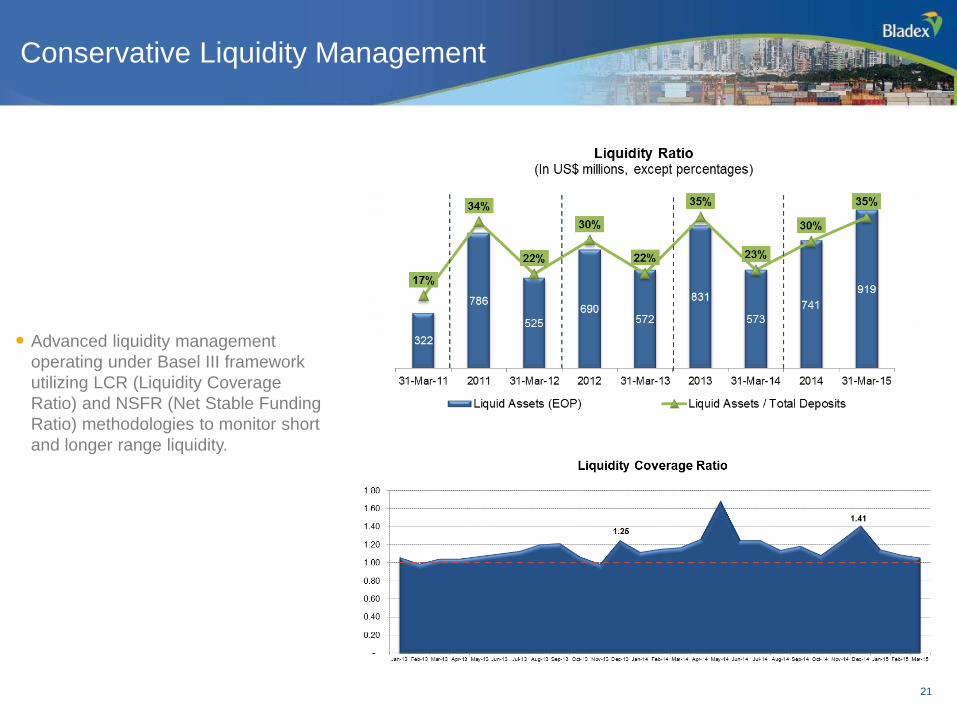
Conservative Liquidity Management
21 21
Advanced liquidity management
operating under Basel III framework
utilizing LCR (Liquidity Coverage
Ratio) and NSFR (Net Stable Funding
Ratio) methodologies to monitor short
and longer range liquidity.
Our Financial Performance
22
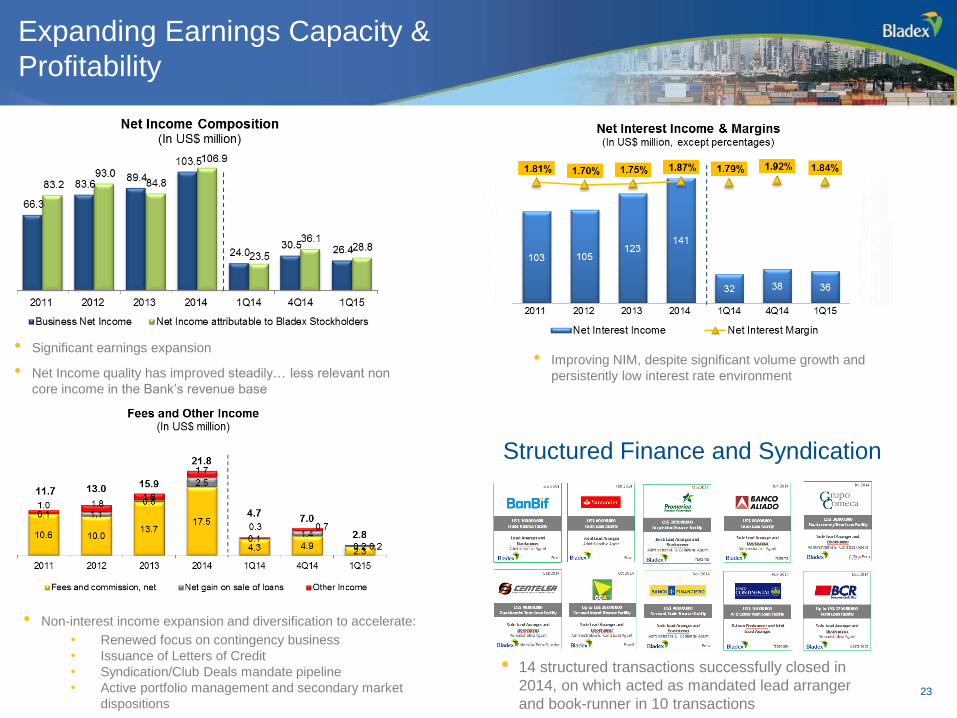
Expanding Earnings Capacity &
Profitability
• Improving NIM, despite significant volume growth and
persistently low interest rate environment
• Significant earnings expansion
• Net Income quality has improved steadily… less relevant non
core income in the Bank’s revenue base
• Non-interest income expansion and diversification to accelerate:
• Renewed focus on contingency business
• Issuance of Letters of Credit
• Syndication/Club Deals mandate pipeline
• Active portfolio management and secondary market
dispositions
Structured Finance and Syndication
• 14 structured transactions successfully closed in
2014, on which acted as mandated lead arranger
and book-runner in 10 transactions 23
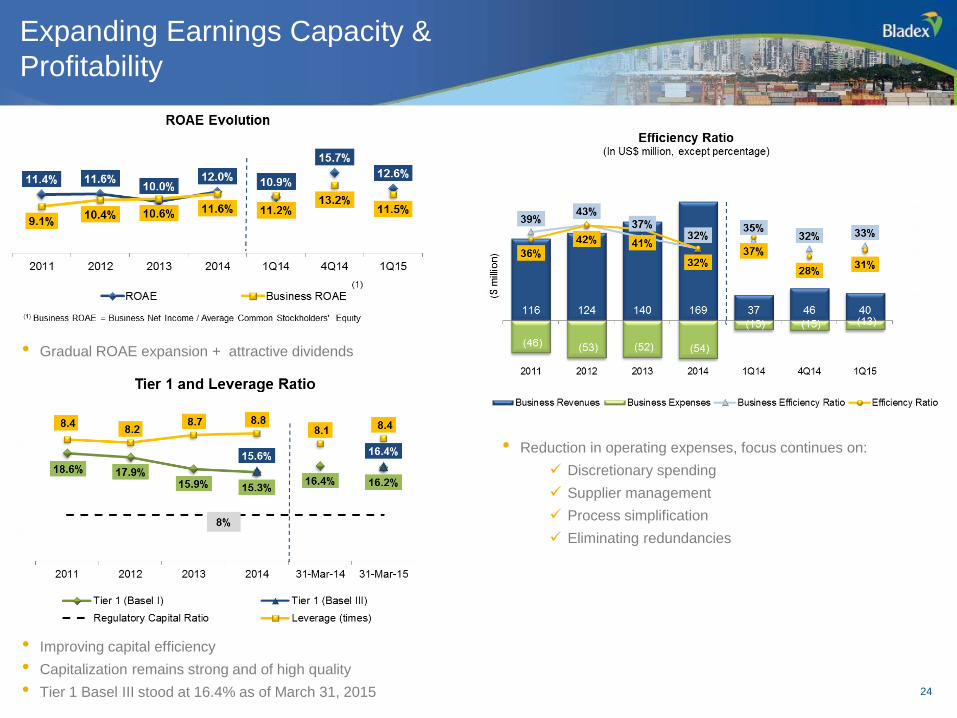
Expanding Earnings Capacity &
Profitability
• Reduction in operating expenses, focus continues on:
Discretionary spending
Supplier management
Process simplification
Eliminating redundancies
• Gradual ROAE expansion + attractive dividends
• Improving capital efficiency
• Capitalization remains strong and of high quality
• Tier 1 Basel III stood at 16.4% as of March 31, 2015 24
25
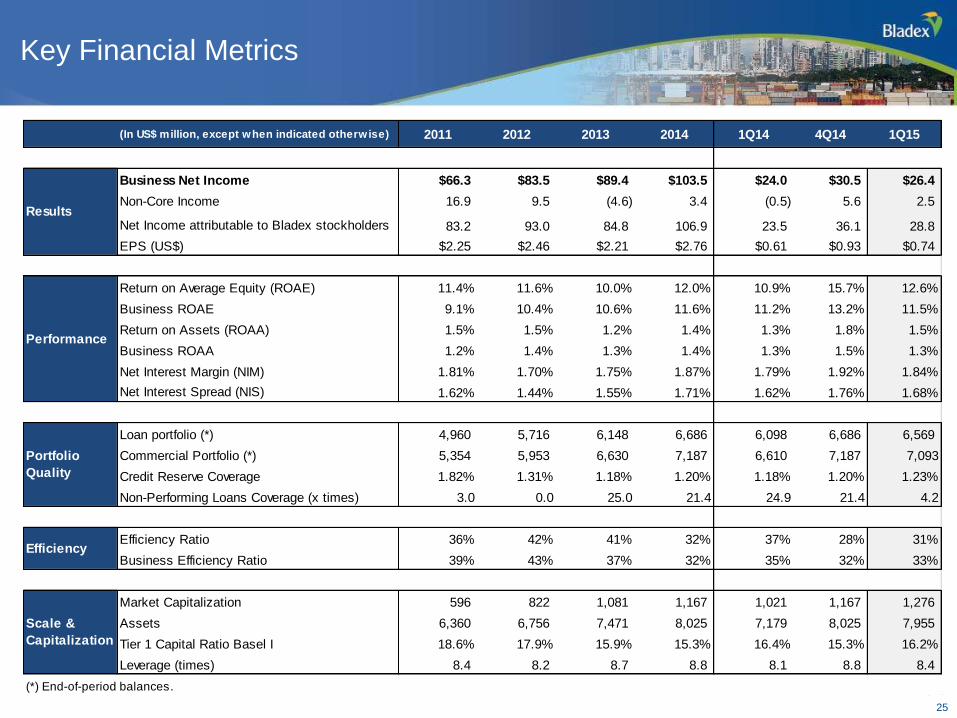
Key Financial Metrics
25
(In US$ million, except when indicated otherwise) 2011 2012 2013 2014 1Q14 4Q14 1Q15
Business Net Income $66.3 $83.5 $89.4 $103.5 $24.0 $30.5 $26.4
Non-Core Income 16.9 9.5 (4.6) 3.4 (0.5) 5.6 2.5
Net Income attributable to Bladex stockholders 83.2 93.0 84.8 106.9 23.5 36.1 28.8
EPS (US$) $2.25 $2.46 $2.21 $2.76 $0.61 $0.93 $0.74
Return on Average Equity (ROAE) 11.4% 11.6% 10.0% 12.0% 10.9% 15.7% 12.6%
Business ROAE 9.1% 10.4% 10.6% 11.6% 11.2% 13.2% 11.5%
Return on Assets (ROAA) 1.5% 1.5% 1.2% 1.4% 1.3% 1.8% 1.5%
Business ROAA 1.2% 1.4% 1.3% 1.4% 1.3% 1.5% 1.3%
Net Interest Margin (NIM) 1.81% 1.70% 1.75% 1.87% 1.79% 1.92% 1.84%
Net Interest Spread (NIS) 1.62% 1.44% 1.55% 1.71% 1.62% 1.76% 1.68%
Loan portfolio (*) 4,960 5,716 6,148 6,686 6,098 6,686 6,569
Commercial Portfolio (*) 5,354 5,953 6,630 7,187 6,610 7,187 7,093
Credit Reserve Coverage 1.82% 1.31% 1.18% 1.20% 1.18% 1.20% 1.23%
Non-Performing Loans Coverage (x times) 3.0 0.0 25.0 21.4 24.9 21.4 4.2
Efficiency Ratio 36% 42% 41% 32% 37% 28% 31%
Business Efficiency Ratio 39% 43% 37% 32% 35% 32% 33%
Market Capitalization 596 822 1,081 1,167 1,021 1,167 1,276
Assets 6,360 6,756 7,471 8,025 7,179 8,025 7,955
Tier 1 Capital Ratio Basel I 18.6% 17.9% 15.9% 15.3% 16.4% 15.3% 16.2%
Leverage (times) 8.4 8.2 8.7 8.8 8.1 8.8 8.4
(*) End-of-period balances.
Results
Portfolio
Quality
Performance
Efficiency
Scale &
Capitalization
25
26
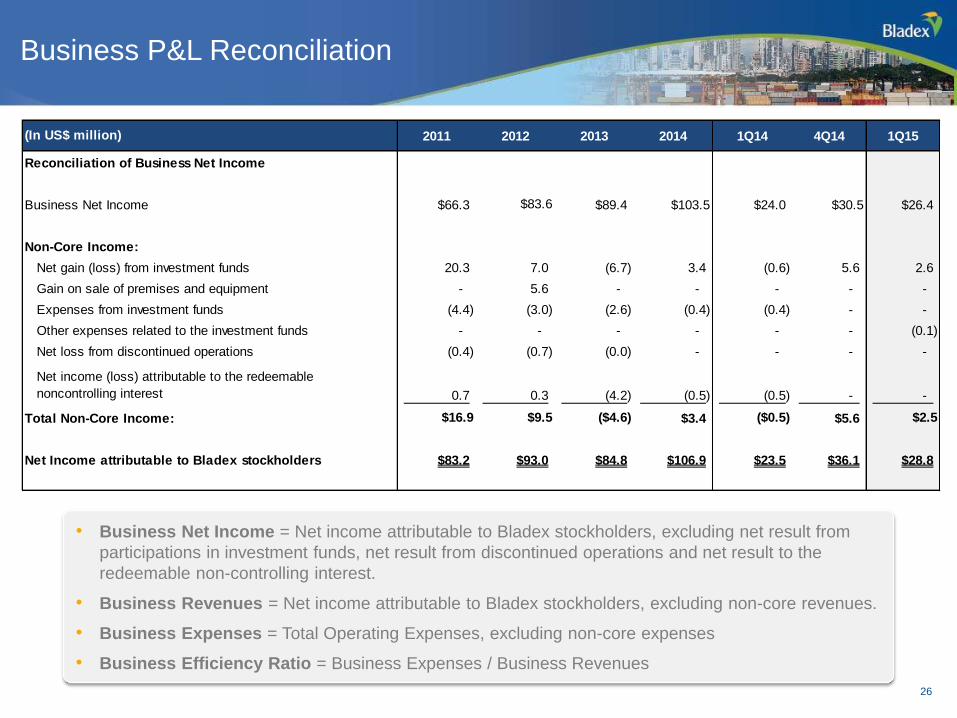
• Business Net Income = Net income attributable to Bladex stockholders, excluding net result from
participations in investment funds, net result from discontinued operations and net result to the
redeemable non-controlling interest.
• Business Revenues = Net income attributable to Bladex stockholders, excluding non-core revenues.
• Business Expenses = Total Operating Expenses, excluding non-core expenses
• Business Efficiency Ratio = Business Expenses / Business Revenues
Business P&L Reconciliation
26
2011 2012 2013 2014 1Q14 4Q14 1Q15
Reconciliation of Business Net Income
Business Net Income $66.3 $83.6 $89.4 $103.5 $24.0 $30.5 $26.4
Non-Core Income:
Net gain (loss) from investment funds 20.3 7.0 (6.7) 3.4 (0.6) 5.6 2.6
Gain on sale of premises and equipment - 5.6 - - - - -
Expenses from investment funds (4.4) (3.0) (2.6) (0.4) (0.4) - -
Other expenses related to the investment funds - - - - - - (0.1)
Net loss from discontinued operations (0.4) (0.7) (0.0) - - - -
0.7 0.3 (4.2) (0.5) (0.5) - -
Total Non-Core Income: $16.9 $9.5 ($4.6) $3.4 ($0.5) $5.6 $2.5
Net Income attributable to Bladex stockholders $83.2 $93.0 $84.8 $106.9 $23.5 $36.1 $28.8
- - -
(In US$ million)
Net income (loss) attributable to the redeemable
noncontrolling interest
27
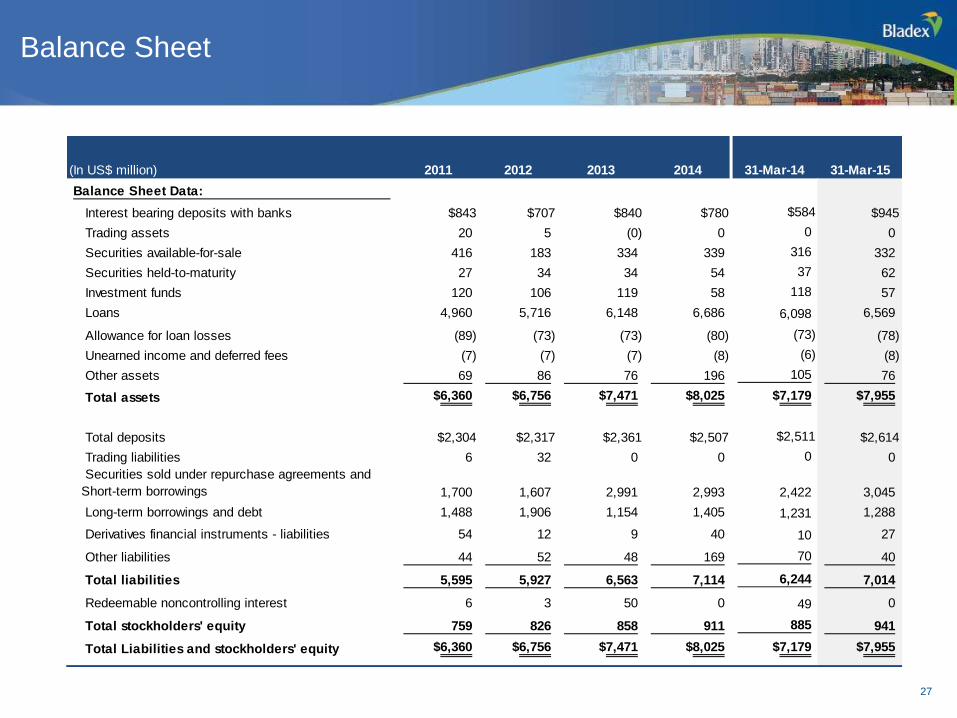
Balance Sheet
27
(In US$ million) 2011 2012 2013 2014 31-Mar-14 31-Mar-15
Balance Sheet Data:
Interest bearing deposits with banks $843 $707 $840 $780 $584 $945
Trading assets 20 5 (0) 0 0 0
Securities available-for-sale 416 183 334 339 316 332
Securities held-to-maturity 27 34 34 54 37 62
Investment funds 120 106 119 58 118 57
Loans 4,960 5,716 6,148 6,686 6,098 6,569
Allowance for loan losses (89) (73) (73) (80) (73) (78)
Unearned income and deferred fees (7) (7) (7) (8) (6) (8)
Other assets 69 86 76 196 105 76
Total assets $6,360 $6,756 $7,471 $8,025 $7,179 $7,955
Total deposits $2,304 $2,317 $2,361 $2,507 $2,511 $2,614
Trading liabilities 6 32 0 0 0 0
Securities sold under repurchase agreements and
Short-term borrowings 1,700 1,607 2,991 2,993 2,422 3,045
Long-term borrowings and debt 1,488 1,906 1,154 1,405 1,231 1,288
Derivatives financial instruments - liabilities 54 12 9 40 10 27
Other liabilities 44 52 48 169 70 40
Total liabilities 5,595 5,927 6,563 7,114 6,244 7,014
Redeemable noncontrolling interest 6 3 50 0 49 0
Total stockholders' equity 759 826 858 911 885 941
Total Liabilities and stockholders' equity $6,360 $6,756 $7,471 $8,025 $7,179 $7,955
28
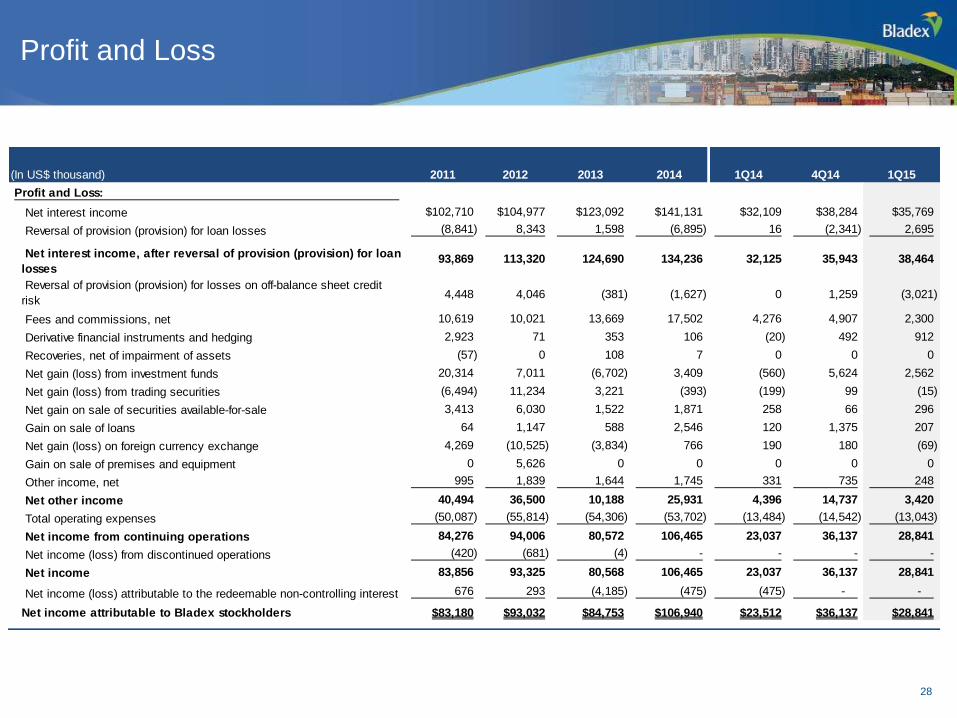
Profit and Loss
28
(In US$ thousand) 2011 2012 2013 2014 1Q14 4Q14 1Q15
Profit and Loss:
Net interest income $102,710 $104,977 $123,092 $141,131 $32,109 $38,284 $35,769
Reversal of provision (provision) for loan losses (8,841) 8,343 1,598 (6,895) 16 (2,341) 2,695
Net interest income, after reversal of provision (provision) for loan
losses 93,869 113,320 124,690 134,236 32,125 35,943 38,464
Reversal of provision (provision) for losses on off-balance sheet credit
risk 4,448 4,046 (381) (1,627) 0 1,259 (3,021)
Fees and commissions, net 10,619 10,021 13,669 17,502 4,276 4,907 2,300
Derivative financial instruments and hedging 2,923 71 353 106 (20) 492 912
Recoveries, net of impairment of assets (57) 0 108 7 0 0 0
Net gain (loss) from investment funds 20,314 7,011 (6,702) 3,409 (560) 5,624 2,562
Net gain (loss) from trading securities (6,494) 11,234 3,221 (393) (199) 99 (15)
Net gain on sale of securities available-for-sale 3,413 6,030 1,522 1,871 258 66 296
Gain on sale of loans 64 1,147 588 2,546 120 1,375 207
Net gain (loss) on foreign currency exchange 4,269 (10,525) (3,834) 766 190 180 (69)
Gain on sale of premises and equipment 0 5,626 0 0 0 0 0
Other income, net 995 1,839 1,644 1,745 331 735 248
Net other income 40,494 36,500 10,188 25,931 4,396 14,737 3,420
Total operating expenses (50,087) (55,814) (54,306) (53,702) (13,484) (14,542) (13,043)
Net income from continuing operations 84,276 94,006 80,572 106,465 23,037 36,137 28,841
Net income (loss) from discontinued operations (420) (681) (4) - - - -
Net income 83,856 93,325 80,568 106,465 23,037 36,137 28,841
Net income (loss) attributable to the redeemable non-controlling interest 676 293 (4,185) (475) (475) - -
Net income attributable to Bladex stockholders $83,180 $93,032 $84,753 $106,940 $23,512 $36,137 $28,841
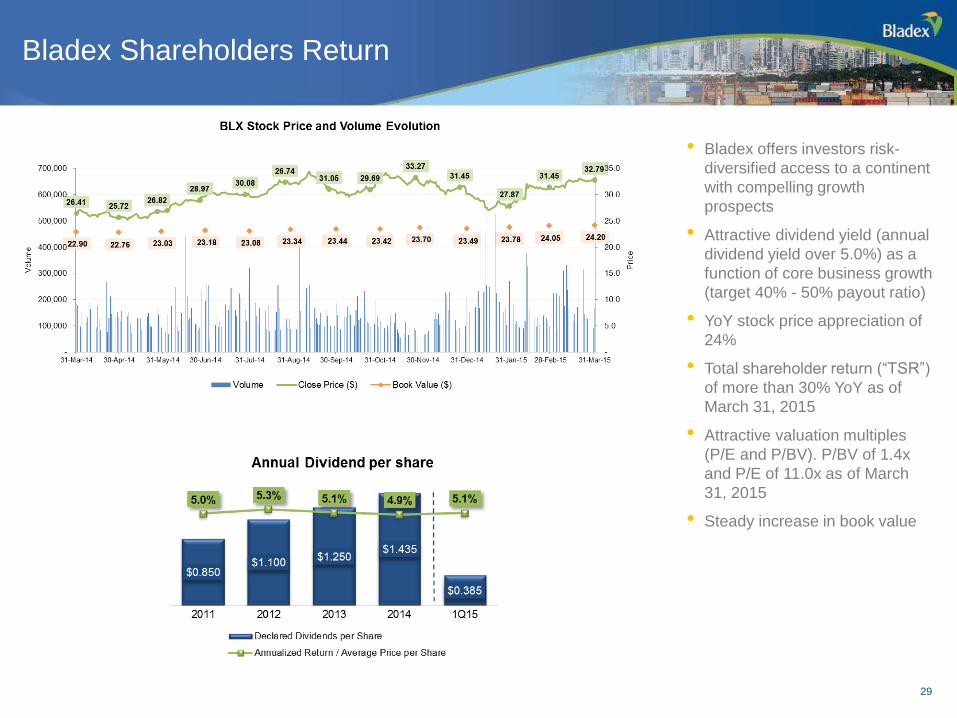
Bladex Shareholders Return
• Bladex offers investors risk-
diversified access to a continent
with compelling growth
prospects
• Attractive dividend yield (annual
dividend yield over 5.0%) as a
function of core business growth
(target 40% - 50% payout ratio)
• YoY stock price appreciation of
24%
• Total shareholder return (“TSR”)
of more than 30% YoY as of
March 31, 2015
• Attractive valuation multiples
(P/E and P/BV). P/BV of 1.4x
and P/E of 11.0x as of March
31, 2015
• Steady increase in book value
29
30