Embed Size (px)
Citation preview

Fifth Third Bank | All Rights Reserved
Sandler O’Neill & Partners, L.P.2008 East Coast Financial Services Conference
Dan PostonEVP & Controller
November 13, 2008

2 Fifth Third Bank | All Rights Reserved
Fifth Third overview
^ As of 9/30/2008* As of 10/14/2008** Nilson, March 2008
Naples
Raleigh
Cincinnati
FlorenceLouisville
Lexington
Nashville
Atlanta
Augusta
Orlando
Tampa
Naples
Raleigh
Charlotte
Huntington
PittsburghCleveland
Columbus
Toledo
Detroit
Grand Rapids
Traverse City
Chicago
Evansville
Jacksonville
Indianapolis
St. Louis
$116 billion assets #13^
$8 billion market cap #12*
1,298 banking centers
Over 2,300 ATMs
18 affiliates in 12 states
World’s 5th largest merchant acquirer**

3 Fifth Third Bank | All Rights Reserved
Increasing net interest income
3.00%
3.20%
3.40%
3.60%
3.80%
4.00%
3Q07 4Q07 1Q08 2Q08* 3Q08*$500
$550
$600
$650
$700
$750
$800
$850
$900
Net interest income NIM
Core growth rate: 12%
* 3Q08 reported results: 41% year-over-year growth and 4.24% NIM. Results above exclude $130 million charge related to leveraged lease litigation in 2Q08 and exclude $31 million and $215 million in loan discount accretion from the First Charter acquisition in 2Q08 and 3Q08, respectively.

4 Fifth Third Bank | All Rights Reserved
Fee income growth and diversification
$0
$100
$200
$300
$400
$500
$600
$700
$800
$900
3Q07 4Q07 1Q08 2Q08 3Q08
Core growth rate: 14%
Payment processing
Deposit service charges
Investment advisory
Corporate banking
Mortgage
Secs/other
YOY growth
+11%
+13%
-5%
+15%
+74%
NM
Continued strong growth in processing, deposit fees and corporate banking fees
Reported year-over-year fee income growth of 5%. Results above exclude $76 million in litigation revenue from a prior acquisition and $27 million BOLI charge in 3Q08. Excludes $152 million BOLI charge and $273 million Visa IPO gain in 1Q08; excludes $177 million BOLI charge in 4Q07; excludes $31 million of gains from asset sales and $2 million in BOLI charge in 3Q07; excludes securities gains/losses in all quarters.

5 Fifth Third Bank | All Rights Reserved
FTPS: key growth engine3Q08 revenue
38%
35%
27%
Merchant Services
FinancialInstitutions
Bankcard
$0$50
$100$150$200$250
3Q06
4Q06
1Q07
2Q07
3Q07
4Q07
1Q08
2Q08
3Q08
FI/EFT Bankcard Merchant
+19%
2-Yr CAGRCAGR: 14% (11% YOY)
Merchant• 4th Largest U.S. Acquirer• Over 37,500 merchants• $26.7B in credit/debit processing volume• Over 5.6B acquired transactions• e.g. Nordstrom, Saks, Walgreen's, Office Max, Barnes and Noble, U.S. Treasury
Bankcard• $1.7B in outstanding balances• 1.6mm cardholders• Top three Debit MasterCard Issuer• 23rd largest U.S. bankcard issuer
YOY growth
+17%
+7%
+9%
+19%
+6%
Financial Institutions• 2,700 FI relationships• 877mm POS/ATM transactions
6 Fifth Third Bank | All Rights Reserved
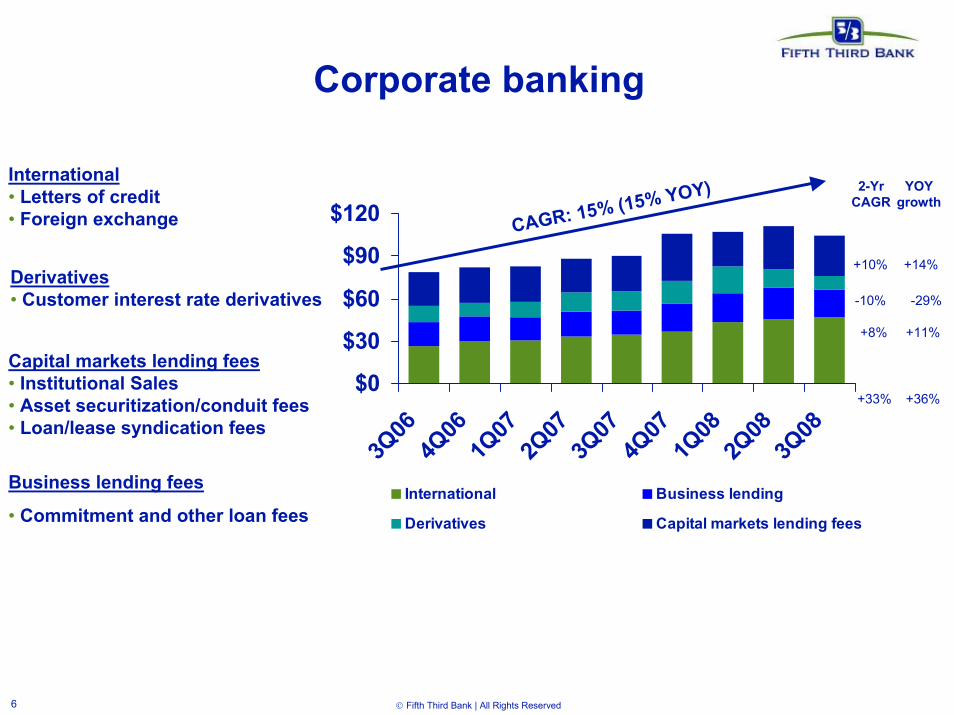
Corporate banking
$0
$30
$60
$90
$120
3Q06
4Q06
1Q07
2Q07
3Q07
4Q07
1Q08
2Q08
3Q08
International Business lending
Derivatives Capital markets lending fees
CAGR: 15% (15% YOY) 2-Yr CAGR
YOY growth
+10%
-10%
+8%
+33%
+14%
-29%
+11%
+36%
Derivatives• Customer interest rate derivatives
Business lending fees
• Commitment and other loan fees
International• Letters of credit• Foreign exchange
Capital markets lending fees• Institutional Sales• Asset securitization/conduit fees• Loan/lease syndication fees
7 Fifth Third Bank | All Rights Reserved
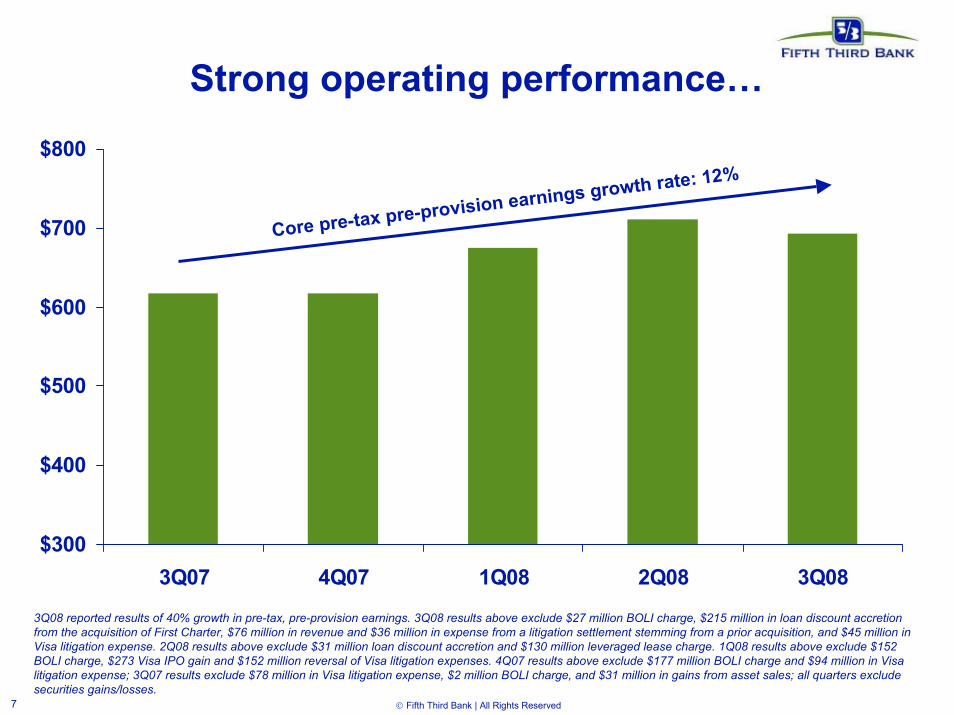
Strong operating performance…
$300
$400
$500
$600
$700
$800
3Q07 4Q07 1Q08 2Q08 3Q08
3Q08 reported results of 40% growth in pre-tax, pre-provision earnings. 3Q08 results above exclude $27 million BOLI charge, $215 million in loan discount accretion from the acquisition of First Charter, $76 million in revenue and $36 million in expense from a litigation settlement stemming from a prior acquisition, and $45 million in Visa litigation expense. 2Q08 results above exclude $31 million loan discount accretion and $130 million leveraged lease charge. 1Q08 results above exclude $152 BOLI charge, $273 Visa IPO gain and $152 million reversal of Visa litigation expenses. 4Q07 results above exclude $177 million BOLI charge and $94 million in Visa litigation expense; 3Q07 results exclude $78 million in Visa litigation expense, $2 million BOLI charge, and $31 million in gains from asset sales; all quarters exclude securities gains/losses.
Core pre-tax pre-provision earnings growth rate: 12%

8 Fifth Third Bank | All Rights Reserved
…offset by credit costs
-$1,000
-$800
-$600
-$400
-$200
$0
$200
$400
$600
$800
3Q07 4Q07 1Q08 2Q08 3Q08
Core pre-tax pre-provision earnings growth rat
Net charge-
offs
Additional provision
e: 12%
See note on p. 7 for adjustments.
9 Fifth Third Bank | All Rights Reserved
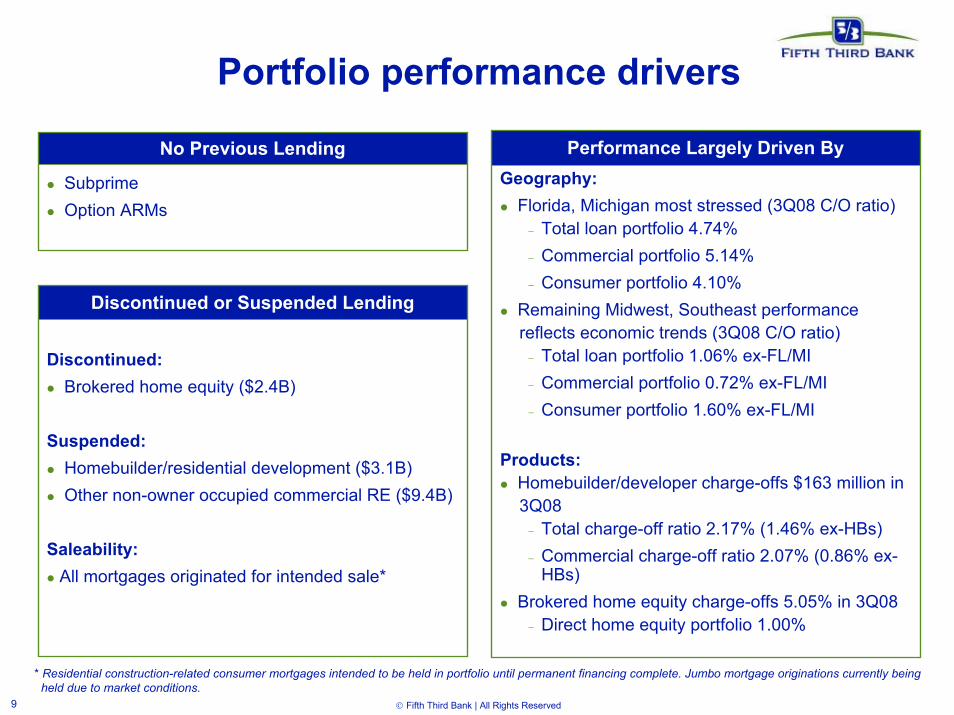
Portfolio performance drivers
Performance Largely Driven ByGeography:
Florida, Michigan most stressed (3Q08 C/O ratio)− Total loan portfolio 4.74%− Commercial portfolio 5.14%− Consumer portfolio 4.10%
Remaining Midwest, Southeast performancereflects economic trends (3Q08 C/O ratio) − Total loan portfolio 1.06% ex-FL/MI− Commercial portfolio 0.72% ex-FL/MI− Consumer portfolio 1.60% ex-FL/MI
Products:Homebuilder/developer charge-offs $163 million in3Q08− Total charge-off ratio 2.17% (1.46% ex-HBs)− Commercial charge-off ratio 2.07% (0.86% ex-
HBs)Brokered home equity charge-offs 5.05% in 3Q08− Direct home equity portfolio 1.00%
No Previous Lending
SubprimeOption ARMs
Discontinued or Suspended Lending
Discontinued:Brokered home equity ($2.4B)
Suspended: Homebuilder/residential development ($3.1B)Other non-owner occupied commercial RE ($9.4B)
Saleability: All mortgages originated for intended sale*
* Residential construction-related consumer mortgages intended to be held in portfolio until permanent financing complete. Jumbo mortgage originations currently being held due to market conditions.
10 Fifth Third Bank | All Rights Reserved
Loss mitigation activities
Reset policies and guidelines
— Eliminated all brokered home equity production
— Significantly tightened underwriting limits and exception authorities
— Further restrictions on consumer guidelines for weaker geographies
— Suspended all new residential development lending and non-owner occupied commercial property lending
— New concentration limits for commercial portfolio
Loss mitigation and containment
— Implemented Watch and Criticized Asset Reduction initiative
— Major expansion of commercial and consumer workout teams
— Implemented aggressive home equity line management program
— Expanded consumer credit outreach program
— Rigorous review of geographic exposures
— Continue to evaluate potential sales of problem loans

11 Fifth Third Bank | All Rights Reserved
• Capital plan and targets designed to help ensure strong capital levels, positioning Fifth Third to absorb significant potential losses and provisions in a potentially more difficult environment through 2009
• Revised capital targets in June 2008 in order to provide greater cushion
• Strengthened Fifth Third’s capital position through several capital actions:— Capital actions intended to maintain a Tier 1 ratio within target range if credit cycle
significantly deteriorates without further capital issuance– Capital issuance – Issued $1.1 billion of Tier 1 capital in the form of convertible
preferred securities - achieved new Tier 1 target immediately– Dividend reduction – Reducing quarterly common dividend to $0.15 per share,
conserves $1.2 billion in common equity through the end of 2009 relative to previous $0.44 level per share
– Asset sales/dispositions – No longer pursuing additional capital via sale of non-core businesses but will continue to evaluate businesses from a strategic planning perspective
Received preliminary approval for U.S. Treasury investment of $3.45 billion in senior preferred stock
6.2%12.3%8.6%
3Q08
6-7%11.5-12.5%
8-9%
Target
N/A10%6%
Regulatory “well- capitalized”
minimum
9.3%TE/TA15.3%Total Capital11.6%
3Q08 pro forma for $3.45B CPP
Tier 1 Capital
Ratio
Strong capital position
12 Fifth Third Bank | All Rights Reserved
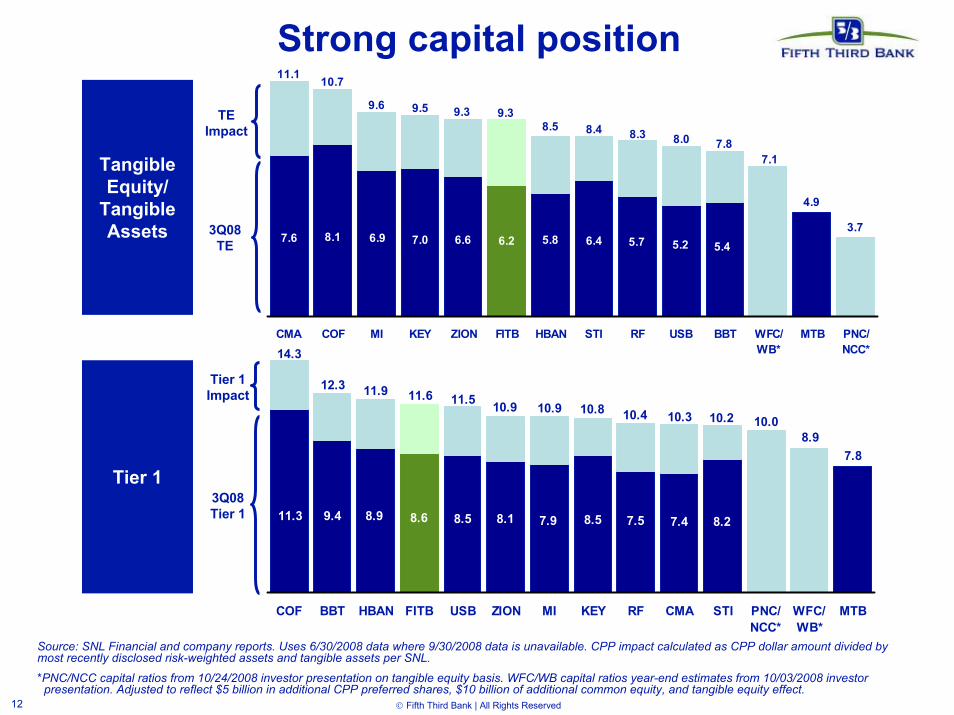
Strong capital position
Source: SNL Financial and company reports. Uses 6/30/2008 data where 9/30/2008 data is unavailable. CPP impact calculated as CPP dollar amount divided by most recently disclosed risk-weighted assets and tangible assets per SNL.
*PNC/NCC capital ratios from 10/24/2008 investor presentation on tangible equity basis. WFC/WB capital ratios year-end estimates from 10/03/2008 investor presentation. Adjusted to reflect $5 billion in additional CPP preferred shares, $10 billion of additional common equity, and tangible equity effect.
TEImpact
3Q08 TE
Tier 1 Impact
3Q08 Tier 1
Tangible Equity/
Tangible Assets
Tier 1
7.1
5.45.25.76.45.86.26.67.06.97.6 8.13.7
4.9
11.1 10.7
9.6 9.5 9.3 9.38.5 8.4 8.3 8.0 7.8
CMA COF MI KEY ZION FITB HBAN STI RF USB BBT WFC/WB*
MTB PNC/NCC*
9.411.3 8.9 8.6 8.5 8.1 7.9 8.5 7.5 7.4 8.2
7.8
10.08.9
14.3
12.3 11.9 11.6 11.5 10.9 10.9 10.8 10.4 10.3 10.2
COF BBT HBAN FITB USB ZION MI KEY RF CMA STI PNC/NCC*
WFC/WB*
MTB

13 Fifth Third Bank | All Rights Reserved
Fifth Third differentiators
Integrated affiliate delivery model
Strong sales culture
Operational efficiency
Streamlined decision making
Integrated payments platform (FTPS)
Acquisition integration
Customer satisfaction

14 Fifth Third Bank | All Rights Reserved
Bradenton-Sarasota-Venice, FL
2008 Rank Institution (ST)
2008 Number
of Branches
2008 Total
Deposits in Market ($000)
2008 Total
Market Share
(%)1 Bank of America 38 3,563,501 21.312 Wachovia Corp. 34 3,123,006 18.683 SunTrust 35 1,812,254 10.844 Pro Forma Fifth Third 17 685,391 4.104 Century Financial Group 10 657,159 3.935 Corp. 8 532,228 3.186 BB&T 16 462,948 2.777 Northern Trust 4 433,101 2.598 Fifth Third 13 420,807 2.529 Regions Financial 22 413,923 2.4810 RBC Centura 12 355,152 2.1211 Bank of Commerce 3 291,141 1.7412 Colonial BancGroup 8 283,775 1.7013 LandMark Financial 6 265,416 1.5914 Freedom Bank 4 264,584 1.5815 Superior Bancorp 3 250,859 1.50
Total 336 16,721,587
Freedom Bank• 1.16% deposit premium – assumed all
deposits
• Exclusive right to purchase branches at appraised value within 90 days of close
• Increases market share from 8th to 4th in Bradenton-Sarasota-Venice MSA
15 Fifth Third Bank | All Rights Reserved
Summary and prioritiesDelivery of strong operating results remains a hallmark of Fifth Third despite sluggish economy
— Despite a difficult operating environment, core businesses are creating new and profitable opportunities to enhance franchise value
Fifth Third has taken steps to ensure it is well-positioned to weather potential further deterioration in the credit environment
— Michigan and Florida exposures and stressed housing markets have pressured earnings
— Proactive measures to mitigate exposures including tightened credit standards for new loans as well as operational revisions to contain credit losses in existing portfolios
Capital plan designed to maintain strong capital levels under significant additional stress in credit trends
— With a strong capital position, Fifth Third expects to successfully navigate through the current difficult market conditions and continue to be one of the strongest retail and commercial banking organizations in the U.S.
16 Fifth Third Bank | All Rights Reserved
Cautionary statementThis report may contain forward-looking statements about Fifth Third Bancorp within the meaning of Sections 27A of the Securities Act of 1933, as amended, and Rule 175 promulgated thereunder, and 21E of the Securities Exchange Act of 1934, as amended, and Rule 3b-6 promulgated thereunder, that involve inherent risks and uncertainties. This report may contain certain forward-looking statements with respect to the financial condition, results of operations, plans, objectives, future performance and business of Fifth Third Bancorp including statements preceded by, followed by or that include the words or phrases such as “believes,” “expects,” “anticipates,” “plans,” “trend,” “objective,” “continue,” “remain” or similar expressions or future or conditional verbs such as “will,” “would,” “should,” “could,” “might,” “can,” “may” or similar expressions. There are a number of important factors that could cause future results to differ materially from historical performance and these forward-looking statements. Factors that might cause such a difference include, but are not limited to: (1) general economic conditions and weakening in the economy, specifically the real estate market, either national or in the states in which Fifth Third, does business, are less favorable than expected; (2) deteriorating credit quality; (3) political developments, wars or other hostilities may disrupt or increase volatility in securities markets or other economic conditions; (4) changes in the interest rate environment reduce interest margins; (5) prepayment speeds, loan origination and sale volumes, charge-offs and loan loss provisions; (6) Fifth Third’s ability to maintain required capital levels and adequate sources of funding and liquidity; (7) changes and trends in capital markets; (8) competitive pressures among depository institutions increase significantly; (9) effects of critical accounting policies and judgments; (10) changes in accounting policies or procedures as may be required by the Financial Accounting Standards Board or other regulatory agencies; (11) legislative or regulatory changes or actions, or significant litigation, adversely affect Fifth Third, or the businesses in which Fifth Third, one is engaged; (12) ability to maintain favorable ratings from rating agencies; (13) fluctuation of Fifth Third’s stock price; (14) ability to attract and retain key personnel; (15) ability to receive dividends from its subsidiaries; (16) potentially dilutive effect of future acquisitions on current shareholders' ownership of Fifth Third; (17) effects of accounting or financial results of one or more acquired entities; (18) difficulties in combining the operations of acquired entities; (19) inability to generate the gains on sale and related increase in shareholders’ equity that it anticipates from the sale of certain non-core businesses; (20) loss of income from the sale of certain non-core businesses could have an adverse effect on Fifth Third’s earnings and future growth; (21) ability to secure confidential information through the use of computer systems and telecommunications networks; (22) the impact of reputational risk created by these developments on such matters as business generation and retention, funding and liquidity; and (23) the Treasury providing satisfactory definitive documentation for its purchase of senior preferred shares and agreement on final terms and conditions. Additional information concerning factors that could cause actual results to differ materially from those expressed or implied in the forward-looking statements is available in the Bancorp's Annual Report on Form 10-K for the year ended December 31, 2007, filed with the United States Securities and Exchange Commission (SEC). Copies of this filing are available at no cost on the SEC's Web site at www.sec.gov or on the Fifth Third’s Web site at www.53.com. Fifth Third undertakes no obligation to release revisions to these forward-looking statements or reflect events or circumstances after the date of this report.


![토마스 피케티 자신이 요약 정리한 [21세기 자본론]의 핵심 보고서입니다](https://img.pdfslide.tips/doc/110x75/53f192d58d7f72e94b8b49a6/-21-.jpg)