Embed Size (px)
Citation preview
Q4-2015: Performance
review
April 27, 2015

2
Certain statements in these slides are forward-looking statements.
These statements are based on management's current expectations and
are subject to uncertainty and changes in circumstances. Actual results
may differ materially from those included in these statements due to a
variety of factors. More information about these factors is contained in
ICICI Bank's filings with the US Securities and Exchange Commission.
All financial and other information in these slides, other than financial
and other information for specific subsidiaries where specifically
mentioned, is on an unconsolidated basis for ICICI Bank Limited only
unless specifically stated to be on a consolidated basis for ICICI Bank
Limited and its subsidiaries. Please also refer to the statement of
unconsolidated, consolidated and segmental results required by Indian
regulations that has, along with these slides, been filed with the stock
exchanges in India where ICICI Bank’s equity shares are listed and with
the New York Stock Exchange and the US Securities and Exchange
Commission, and is available on our website www.icicibank.com

FY2015: Performance highlights
3
13.9% increase in standalone profit after tax from `
98.10 bn in FY2014 (April 2013-March 2014) to `
111.75 bn in FY2015 (April 2014-March 2015)
Net interest income increased by 15.6% year-on-year;
net interest margin improved by 15 basis points from
3.33% in FY2014 to 3.48% in FY2015
Cost to income ratio improved to 36.8% in FY2015
from 38.2% in FY2014
10.9% increase in consolidated profit after tax from
` 110.41 bn in FY2014 to ` 122.47 bn in FY2015
Consolidated return on average net worth for FY2015
at 15.0%
Profitability

Q4-2015: Performance highlights
4
10.2% increase in standalone profit after tax from `
26.52 bn in Q4-2014 (January-March 2014) to `
29.22 bn in Q4-2015 (January-March 2015)
Net interest income increased by 16.6% year-on-
year; net interest margin improved from 3.35% in
Q4-2014 to 3.57% in Q4-2015
13.3% increase in consolidated profit after tax from
` 27.24 bn in Q4-2014 to ` 30.85 bn in Q4-2015
Consolidated return on average net worth
(annualised) at 14.5%
Profitability

5
Advances increased by 14.4% year-on-year to `
3,875.22 billion at March 31, 2015
Retail advances growth at 24.6% year-on-year at
March 31, 2015
Domestic corporate loan growth at 9.6%
Period end CASA ratio at 45.5% at March 31,
2015 compared to 42.9% at March 31, 2014 and
44.0% at December 31, 2014
Average CASA ratio at 39.9% for Q4-2015
Net NPA ratio at 1.40% at March 31, 2015
(December 31, 2014: 1.12%; March 31, 2014:
0.82%)
Balance sheet
Q4-2015: Performance highlights
6
Standalone results
7
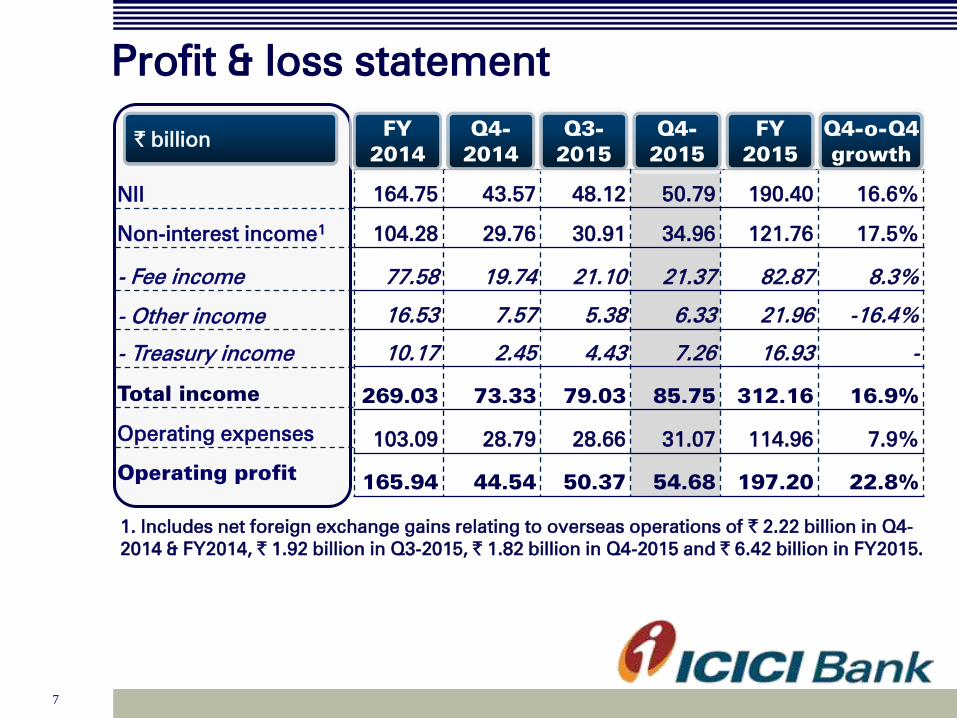
Profit & loss statement
1. Includes net foreign exchange gains relating to overseas operations of ` 2.22 billion in Q4-
2014 & FY2014, ` 1.92 billion in Q3-2015, ` 1.82 billion in Q4-2015 and ` 6.42 billion in FY2015.
NII
Non-interest income1
- Fee income
- Other income
- Treasury income
Total income
Operating expenses
Operating profit
` billion
164.75 43.57 48.12 50.79 190.40 16.6%
104.28 29.76 30.91 34.96 121.76 17.5%
77.58 19.74 21.10 21.37 82.87 8.3%
16.53
7.57 5.38
6.33 21.96 -16.4%
10.17 2.45 4.43 7.26 16.93 -
269.03 73.33 79.03 85.75 312.16 16.9%
103.09 28.79 28.66 31.07 114.96 7.9%
165.94 44.54 50.37 54.68 197.20 22.8%
FY
2014
Q4-
2014
Q3-
2015
Q4-
2015
FY
2015
Q4-o-Q4
growth
8
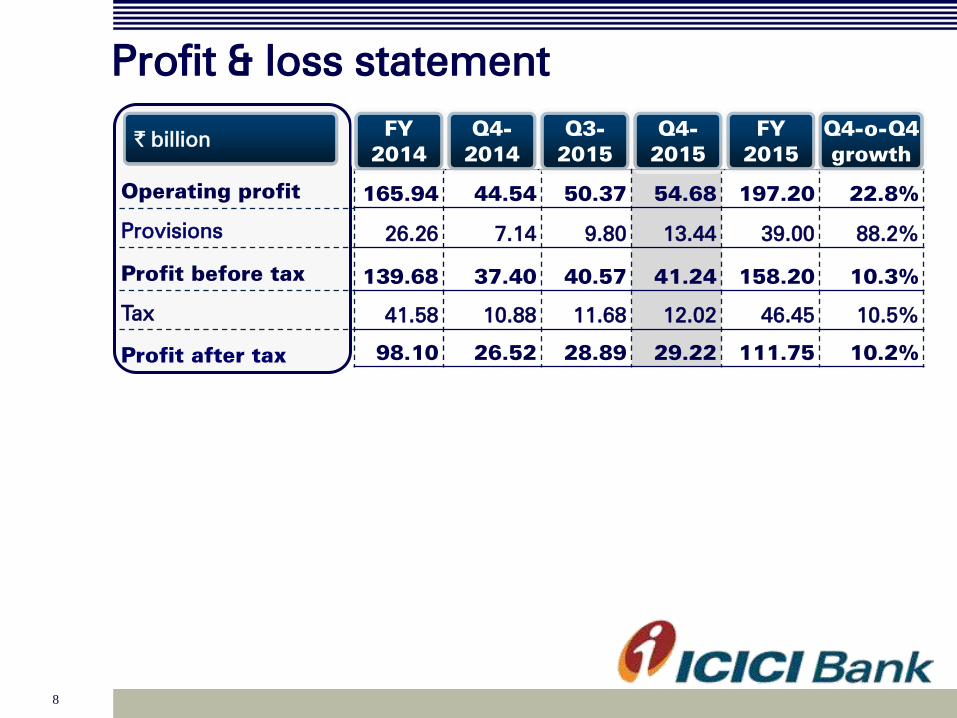
Profit & loss statement
Operating profit
Provisions
Profit before tax
Tax
Profit after tax
` billion
165.94 44.54 50.37 54.68 197.20 22.8%
26.26 7.14 9.80 13.44 39.00 88.2%
139.68 37.40 40.57 41.24 158.20 10.3%
41.58
10.88 11.68
12.02 46.45 10.5%
98.10 26.52 28.89 29.22 111.75 10.2%
FY
2014
Q4-
2014
Q3-
2015
Q4-
2015
FY
2015
Q4-o-Q4
growth

9
Key ratios
Yield on total interest earning
assets1
Cost of funds1
Net interest margin1
Movement in yield, costs &
margins (Percent)
Return on average networth1
Return on average assets1
Weighted average EPS1,2
Book value (`)2
Fee to income
Cost to income
Average CASA ratio
Percent
8.92 8.96 8.94 9.08 8.96
6.21 6.20 6.17 6.16 6.17
3.33 3.35 3.46 3.57 3.48
FY
2014
Q4-
2014
Q3-
2015
Q4-
2015
FY
2015
13.7 14.6 14.3 14.6 14.3
1.76 1.86 1.90 1.92 1.86
17.0 18.6 19.8 20.5 19.3
127 127 141 139 139
28.9 27.0 26.7 24.9 26.5
38.2 39.2 36.3 36.2 36.8
39.4 39.1 39.3 39.9 39.5
FY
2014
Q4-
2014
Q3-
2015
Q4-
2015
FY
2015
1. Annualised for all interim periods
2. One equity share of ₹ 10 has been sub-divided into five
equity shares of ₹ 2 each. Accordingly, book value & EPS
have been restated for all the previous periods
10
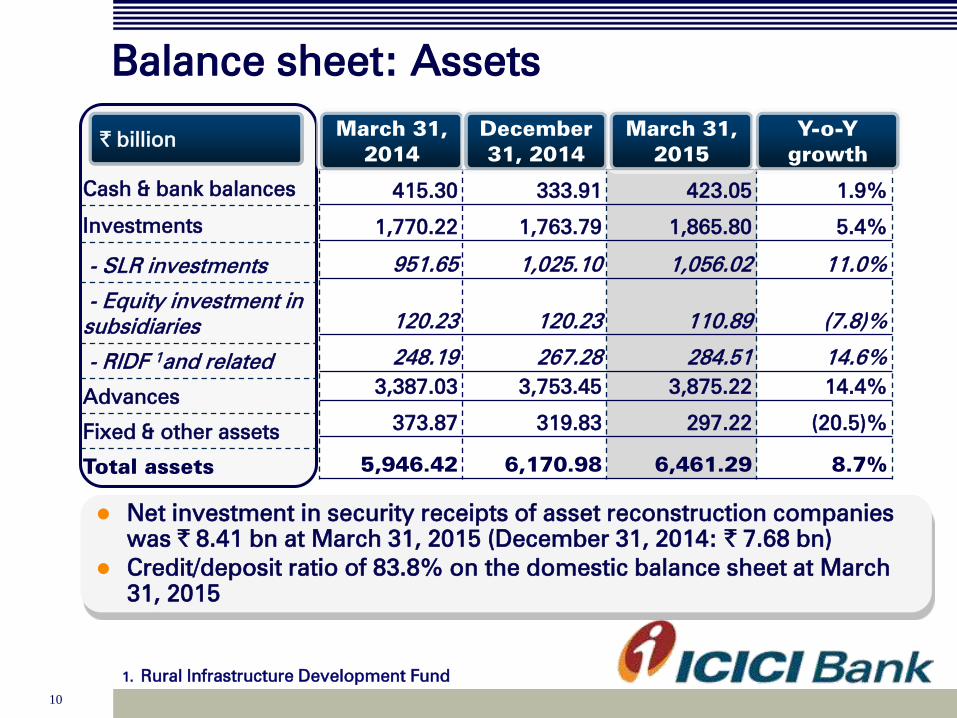
Balance sheet: Assets
Cash & bank balances
Investments
- SLR investments
- Equity investment in
subsidiaries
- RIDF 1and related
Advances
Fixed & other assets
Total assets
` billion
415.30 333.91 423.05 1.9%
1,770.22 1,763.79 1,865.80 5.4%
951.65 1,025.10 1,056.02 11.0%
120.23 120.23 110.89 (7.8)%
248.19 267.28 284.51 14.6%
3,387.03 3,753.45 3,875.22 14.4%
373.87 319.83 297.22 (20.5)%
5,946.42 6,170.98 6,461.29 8.7%
March 31,
2014
December
31, 2014
March 31,
2015
Y-o-Y
growth
Net investment in security receipts of asset reconstruction companies
was ` 8.41 bn at March 31, 2015 (December 31, 2014: ` 7.68 bn)
Credit/deposit ratio of 83.8% on the domestic balance sheet at March
31, 2015
1. Rural Infrastructure Development Fund
11
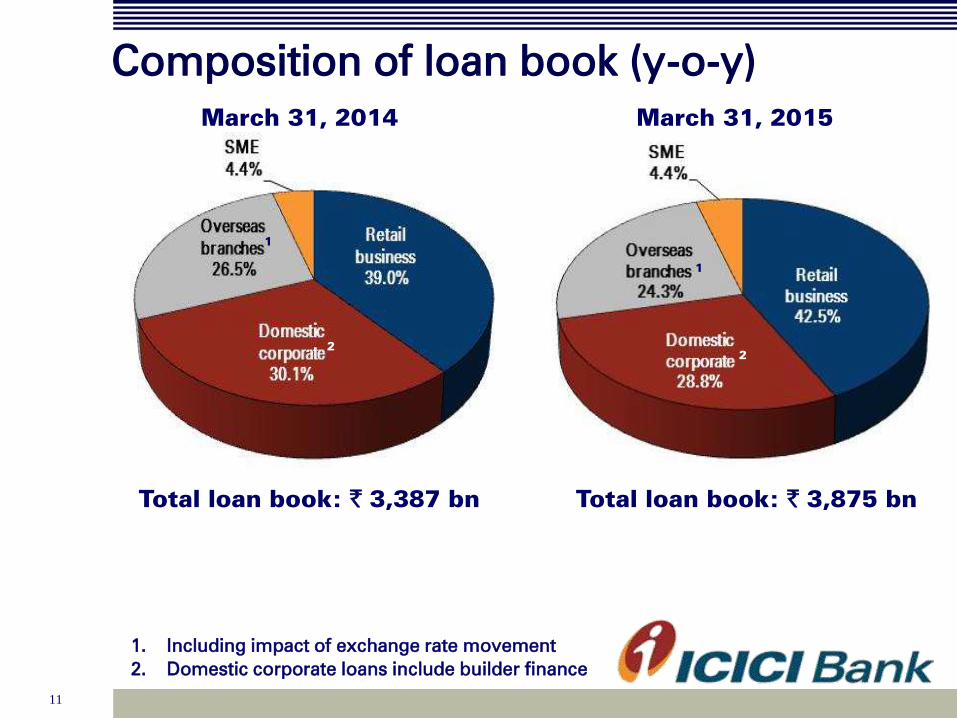
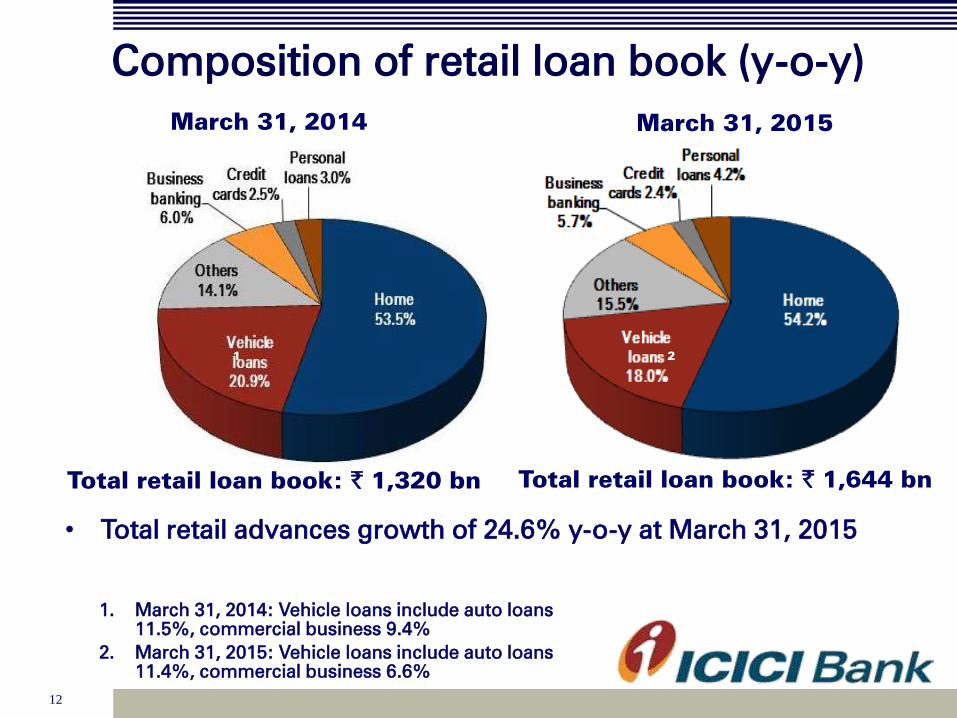
Composition of loan book (y-o-y)
March 31, 2015
Total loan book: ` 3,875 bn Total loan book: ` 3,387 bn
March 31, 2014
1. Including impact of exchange rate movement
2. Domestic corporate loans include builder finance
2
1
2
1
12
Composition of retail loan book (y-o-y)
• Total retail advances growth of 24.6% y-o-y at March 31, 2015
1. March 31, 2014: Vehicle loans include auto loans
11.5%, commercial business 9.4%
2. March 31, 2015: Vehicle loans include auto loans
11.4%, commercial business 6.6%
1
Total retail loan book: ` 1,644 bn Total retail loan book: ` 1,320 bn
2
March 31, 2014 March 31, 2015
13
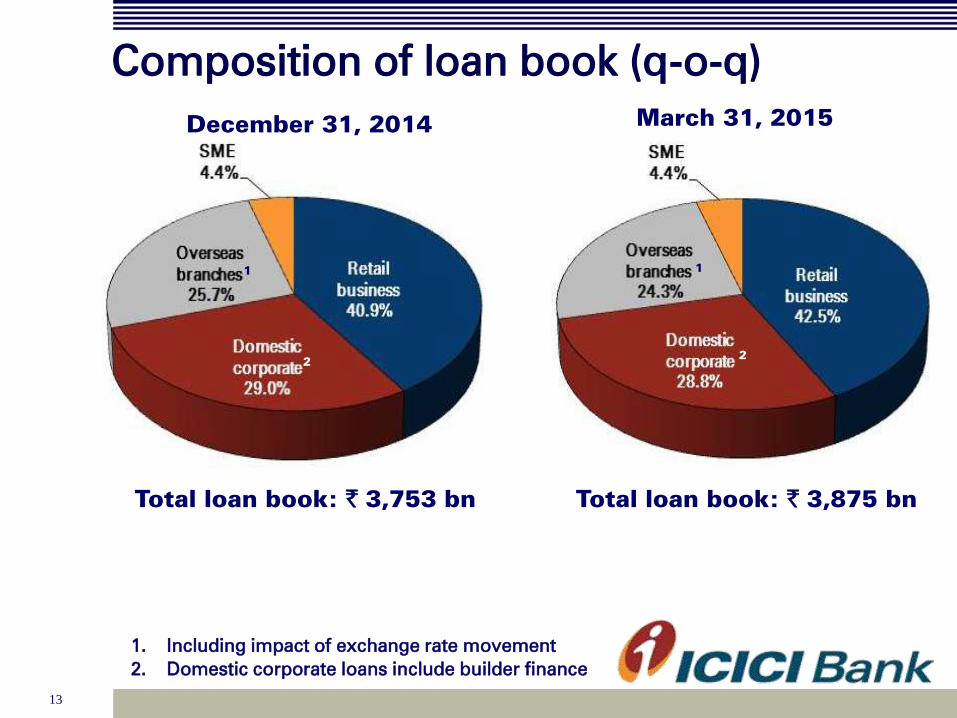
Composition of loan book (q-o-q)
Total loan book: ` 3,753 bn
December 31, 2014
1. Including impact of exchange rate movement
2. Domestic corporate loans include builder finance
2
1
March 31, 2015
Total loan book: ` 3,875 bn
2
1

14
Composition of retail loan book (q-o-q)
Total retail loan book: ` 1,535 bn
December 31, 2014
1. December 31, 2014: Vehicle loans include auto loans
11.6%, commercial business 7.1%
2. March 31, 2015: Vehicle loans include auto loans
11.4%, commercial business 6.6%
1
Total retail loan book: ` 1,644 bn
2
March 31, 2015
15
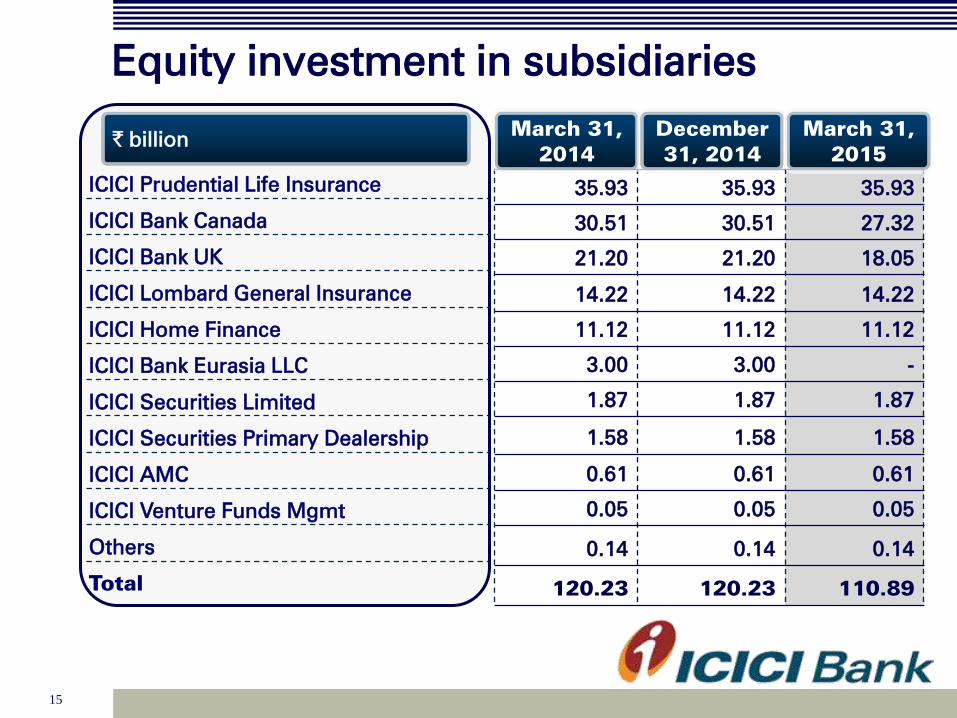
Equity investment in subsidiaries
ICICI Prudential Life Insurance
ICICI Bank Canada
ICICI Bank UK
ICICI Lombard General Insurance
ICICI Home Finance
ICICI Bank Eurasia LLC
ICICI Securities Limited
ICICI Securities Primary Dealership
ICICI AMC
ICICI Venture Funds Mgmt
Others
Total
` billion
35.93 35.93 35.93
30.51 30.51 27.32
21.20 21.20 18.05
14.22 14.22 14.22
11.12 11.12 11.12
3.00 3.00 -
1.87 1.87 1.87
1.58 1.58 1.58
0.61 0.61 0.61
0.05 0.05 0.05
0.14 0.14 0.14
120.23 120.23 110.89
March 31,
2014
December
31, 2014
March 31,
2015
16
Balance sheet: Liabilities
Net worth
- Equity capital
- Reserves1
Deposits
- Savings
- Current
Borrowings2,3
Other liabilities
Total liabilities
` billion
732.14 818.21 804.29 9.9%
11.55 11.59 11.60 0.4%
720.59 806.62 792.70 10.0%
3,319.14 3,553.40 3,615.63 8.9%
991.33 1,105.33 1,148.60 15.9%
432.45 459.16 495.20 14.5%
1,547.59 1,529.94 1,724.17 11.4%
347.55 269.43 317.20 (8.7)%
5,946.42 6,170.98 6,461.29 8.7%
March 31,
2014
December
31, 2014
March 31,
2015
Y-o-Y
growth
1. In 2008, RBI issued guidelines on debt restructuring, which also covered the treatment of funded interest
in cases of debt restructuring, that is, instances where interest for a certain period is funded by a Funded
Interest Term Loan (FITL) which is then repaid based on a contracted maturity schedule. In line with these
guidelines, the Bank has been providing fully for any interest income which is funded through a FITL for
cases restructured subsequent to the issuance of the guideline. However, RBI has now required similar
treatment of outstanding FITL pertaining to cases restructured prior to the 2008 guidelines which have not
yet been repaid. In view of the above, and since this item relates to prior years, the Bank has with the
approval of the RBI debited its reserves by ` 9.29 billion to fully provide outstanding FITLs pertaining to
restructurings prior to the issuance of the guideline in the quarter ended March 31, 2015 as against over
three quarters permitted by RBI. These FITLs relate to pre-2008 restructurings where the borrowers have
since been upgraded, and this impact would get reversed as FITLs are repaid as per their contractual
maturities.
2. Borrowings include preference shares amounting to ` 3.50 bn
3. Including impact of exchange rate movement
17
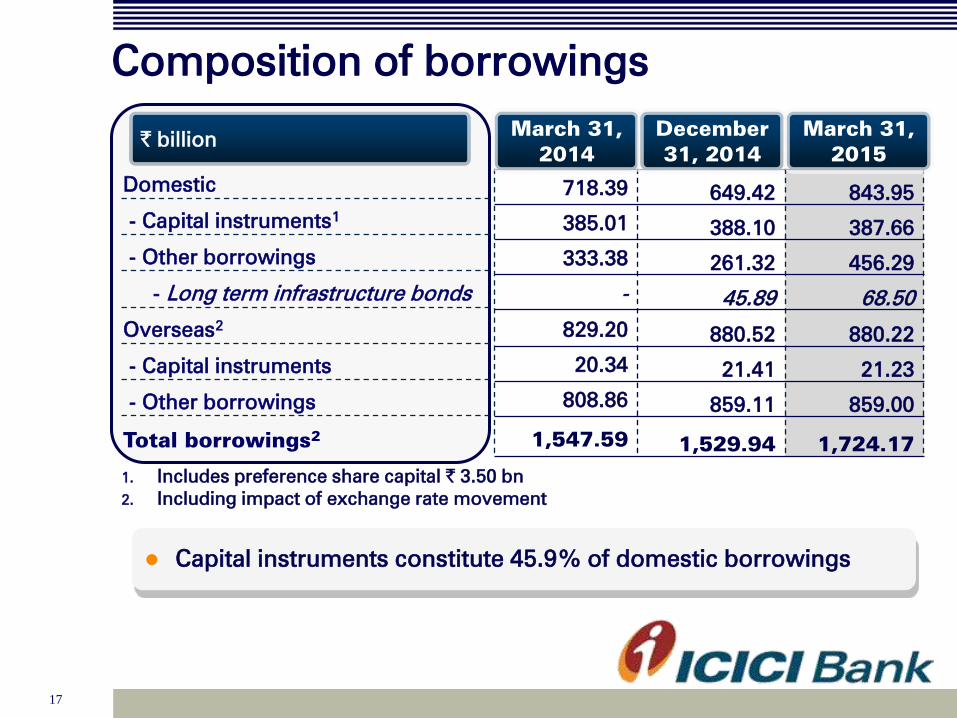
Composition of borrowings
Domestic
- Capital instruments1
- Other borrowings
- Long term infrastructure bonds
Overseas2
- Capital instruments
- Other borrowings
Total borrowings2
` billion
718.39 649.42 843.95
385.01 388.10 387.66
333.38 261.32 456.29
- 45.89 68.50
829.20 880.52 880.22
20.34 21.41 21.23
808.86 859.11 859.00
1,547.59 1,529.94 1,724.17
March 31,
2014
December
31, 2014
March 31,
2015
1. Includes preference share capital ` 3.50 bn
2. Including impact of exchange rate movement
Capital instruments constitute 45.9% of domestic borrowings
18
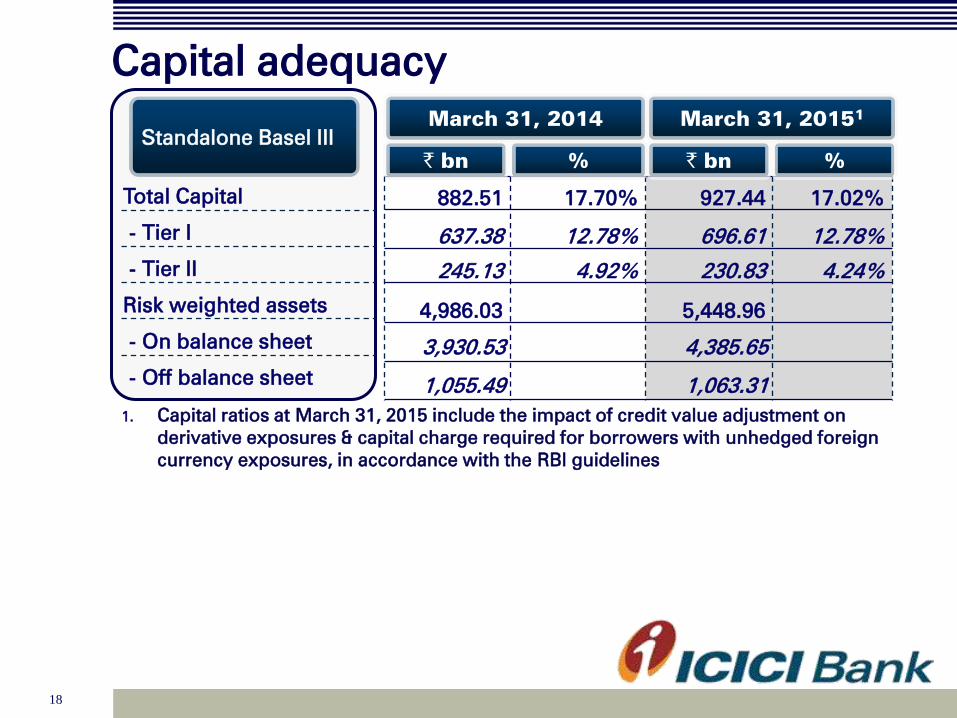
Capital adequacy
Total Capital
- Tier I
- Tier II
Risk weighted assets
- On balance sheet
- Off balance sheet
Standalone Basel III
882.51 17.70% 927.44 17.02%
637.38 12.78% 696.61 12.78%
245.13 4.92% 230.83 4.24%
4,986.03 5,448.96
3,930.53 4,385.65
1,055.49 1,063.31
March 31, 2014
March 31, 20151
1. Capital ratios at March 31, 2015 include the impact of credit value adjustment on
derivative exposures & capital charge required for borrowers with unhedged foreign
currency exposures, in accordance with the RBI guidelines
` bn % ` bn %
19
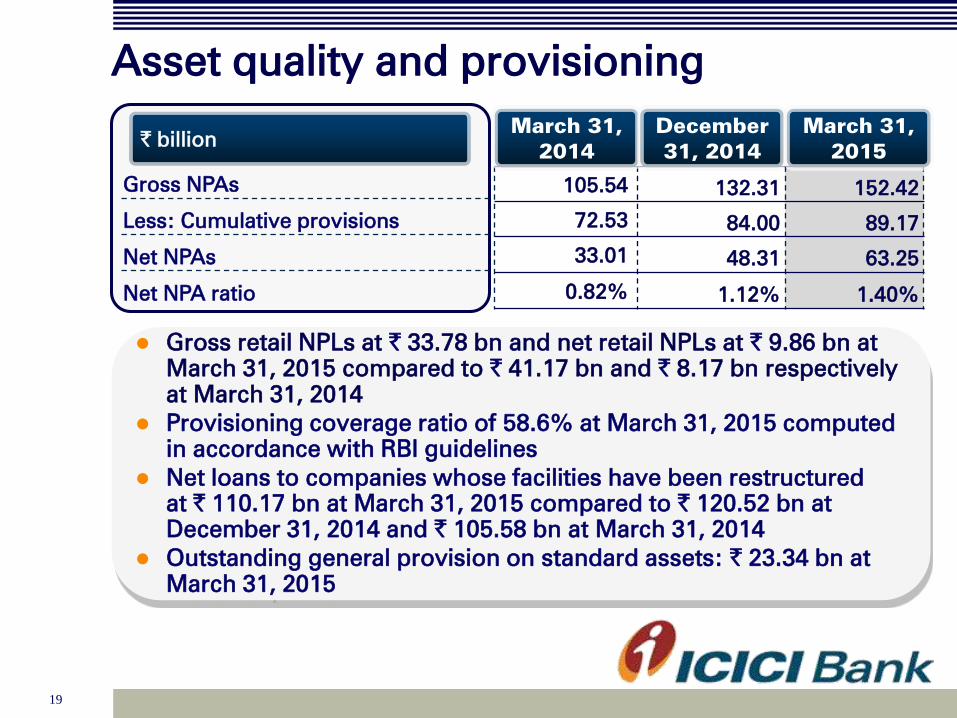
Asset quality and provisioning
Gross retail NPLs at ` 33.78 bn and net retail NPLs at ` 9.86 bn at
March 31, 2015 compared to ` 41.17 bn and ` 8.17 bn respectively
at March 31, 2014
Provisioning coverage ratio of 58.6% at March 31, 2015 computed
in accordance with RBI guidelines
Net loans to companies whose facilities have been restructured
at ` 110.17 bn at March 31, 2015 compared to ` 120.52 bn at
December 31, 2014 and ` 105.58 bn at March 31, 2014
Outstanding general provision on standard assets: ` 23.34 bn at
March 31, 2015
Gross NPAs
Less: Cumulative provisions
Net NPAs
Net NPA ratio
` billion
105.54 132.31 152.42
72.53 84.00 89.17
33.01 48.31 63.25
0.82% 1.12% 1.40%
March 31,
2014
December
31, 2014
March 31,
2015

20
Movement of NPA
Opening gross NPA
Add: Gross additions
- of which:
slippages from
restructured assets
Less: Gross deletions
Net additions
Less: Write-offs & sale
Closing balance of gross NPAs
Gross NPA ratio1
` billion
104.48 96.47 116.95 132.31 105.54
12.41 45.40 22.79 32.60 80.78
0.13 7.27 7.76 22.46 45.29
4.16 12.58 5.07 6.54 16.36
8.25 32.82 17.72 26.06 64.42
7.19 23.75 2.36 5.95 17.54
105.54 105.54 132.31 152.42 152.42
2.56% 2.56% 3.00% 3.29% 3.29%
Q4-
2014
Q3-
2015
Q4-
2015
1. Based on customer assets
The aggregate net NPAs and net restructured loans increased by
` 34.82 billion from ` 138.59 billion at March 31, 2014 to ` 173.41
billion at March 31, 2015
FY2014 FY2015
21
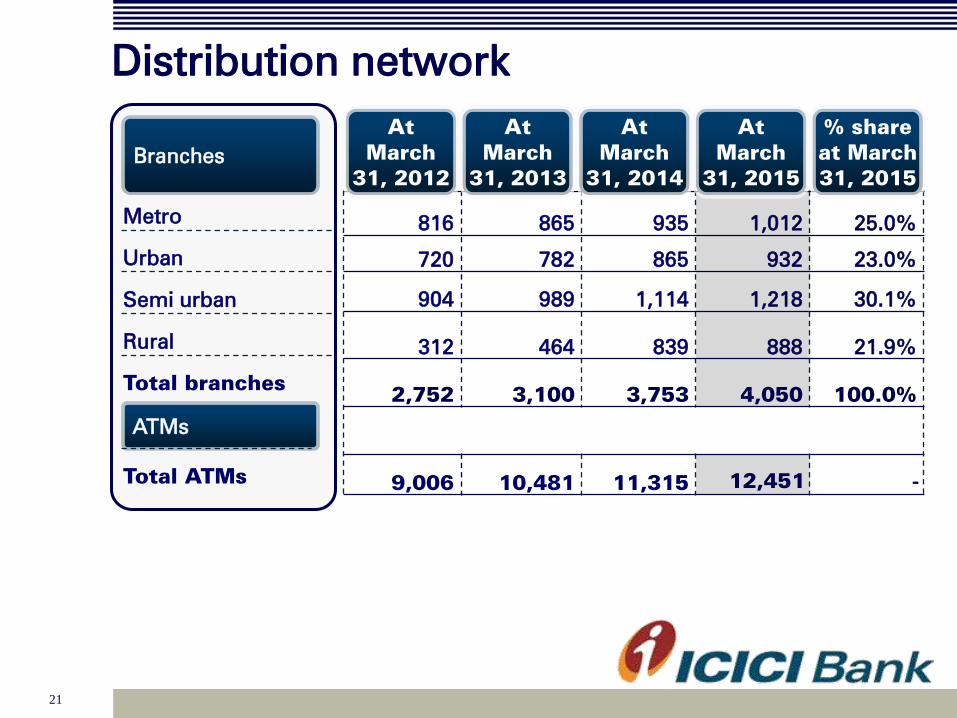
Distribution network
Metro
Urban
Semi urban
Rural
Total branches
Branches
816 865 935 1,012 25.0%
720 782 865 932 23.0%
904 989 1,114 1,218 30.1%
312 464 839 888 21.9%
2,752 3,100 3,753 4,050 100.0%
9,006 10,481 11,315 12,451 -
At
March
31, 2012
At
March
31, 2013
At
March
31, 2015
ATMs
Total ATMs
At
March
31, 2014
% share
at March
31, 2015

22
Consolidated results
23
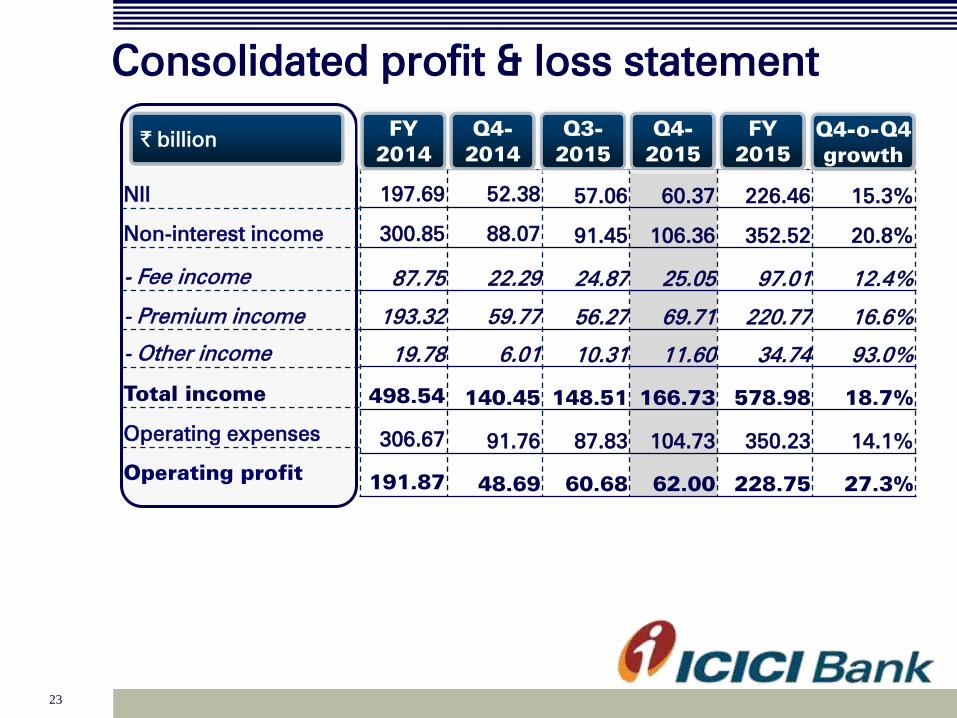
Consolidated profit & loss statement
NII
Non-interest income
- Fee income
- Premium income
- Other income
Total income
Operating expenses
Operating profit
` billion
197.69 52.38 57.06 60.37 226.46 15.3%
300.85 88.07 91.45 106.36 352.52 20.8%
87.75 22.29 24.87 25.05 97.01 12.4%
193.32 59.77 56.27 69.71 220.77 16.6%
19.78 6.01 10.31 11.60 34.74 93.0%
498.54 140.45 148.51 166.73 578.98 18.7%
306.67 91.76 87.83 104.73 350.23 14.1%
191.87 48.69 60.68 62.00 228.75 27.3%
FY
2014
Q4-
2014
Q3-
2015
Q4-
2015
FY
2015
Q4-o-Q4
growth

24
Consolidated profit & loss statement
Operating profit
Provisions
Profit before tax
Tax
Minority interest
Profit after tax
` billion
191.87 48.69 60.68 62.00 228.75 27.3%
29.00 8.12 12.35 15.71 45.36 93.5%
162.87 40.57 48.33 46.29 183.39 14.1%
46.10 11.84 13.66 13.77 53.97 16.3%
6.36 1.49 2.02 1.67 6.95 12.1%
110.41 27.24 32.65 30.85 122.47 13.3%
FY
2014
Q4-
2014
Q3-
2015
Q4-
2015
FY
2015
Q4-o-Q4
growth
25
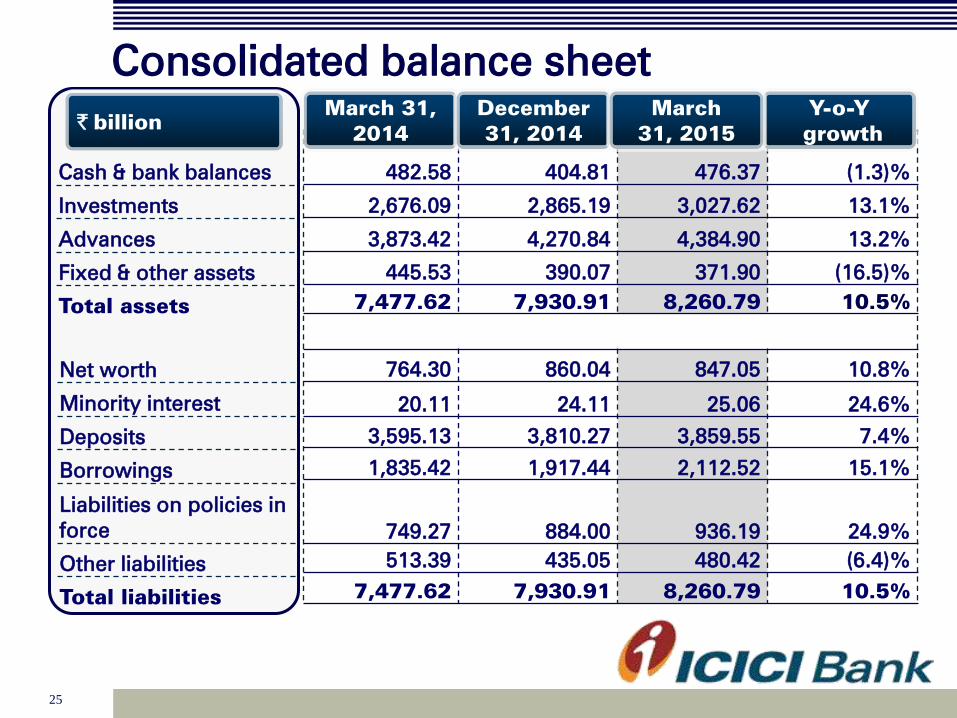
Consolidated balance sheet
Cash & bank balances
Investments
Advances
Fixed & other assets
Total assets
` billion
482.58 404.81 476.37 (1.3)%
2,676.09 2,865.19 3,027.62 13.1%
3,873.42 4,270.84 4,384.90 13.2%
445.53 390.07 371.90 (16.5)%
7,477.62 7,930.91 8,260.79 10.5%
764.30 860.04 847.05 10.8%
20.11 24.11 25.06 24.6%
3,595.13 3,810.27 3,859.55 7.4%
1,835.42 1,917.44 2,112.52 15.1%
749.27 884.00 936.19 24.9%
513.39 435.05 480.42 (6.4)%
7,477.62 7,930.91 8,260.79 10.5%
March 31,
2014
December
31, 2014
Y-o-Y
growth
March
31, 2015
Net worth
Minority interest
Deposits
Borrowings
Liabilities on policies in
force
Other liabilities
Total liabilities
26
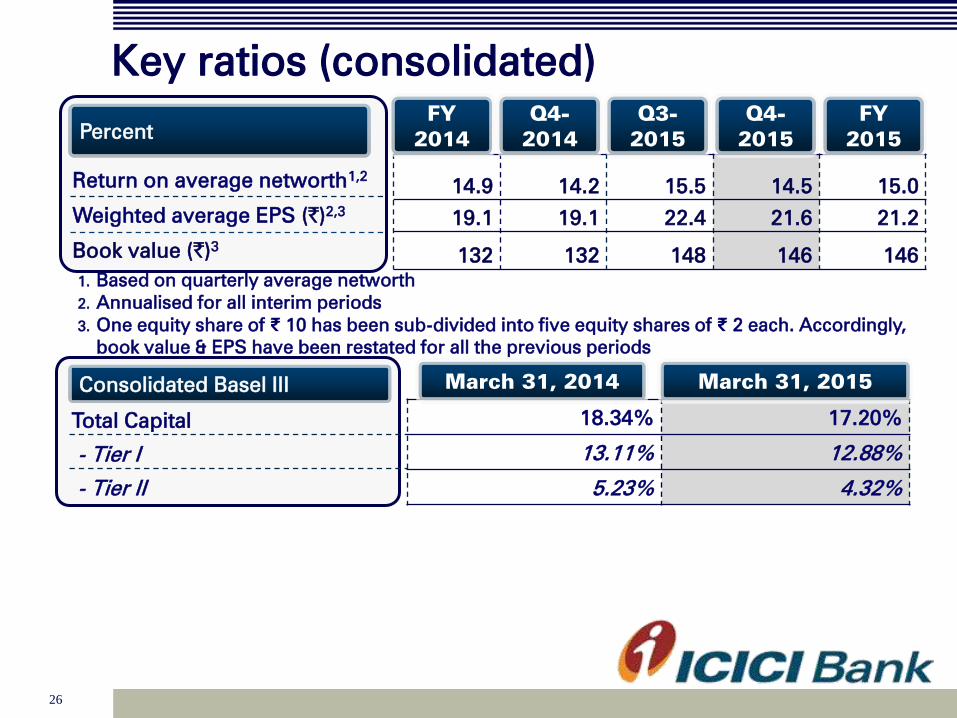
Key ratios (consolidated)
Return on average networth1,2
Weighted average EPS (`)2,3
Book value (`)3
Percent
14.9 14.2 15.5 14.5 15.0
19.1 19.1 22.4 21.6 21.2
132 132 148 146 146
FY
2014
Q4-
2014
Q3-
2015
Q4-
2015
FY
2015
1. Based on quarterly average networth
2. Annualised for all interim periods
3. One equity share of ₹ 10 has been sub-divided into five equity shares of ₹ 2 each. Accordingly,
book value & EPS have been restated for all the previous periods
Total Capital
- Tier I
- Tier II
Consolidated Basel III
18.34% 17.20%
13.11% 12.88%
5.23% 4.32%
March 31, 2014
March 31, 2015

27
Overseas subsidiaries
28
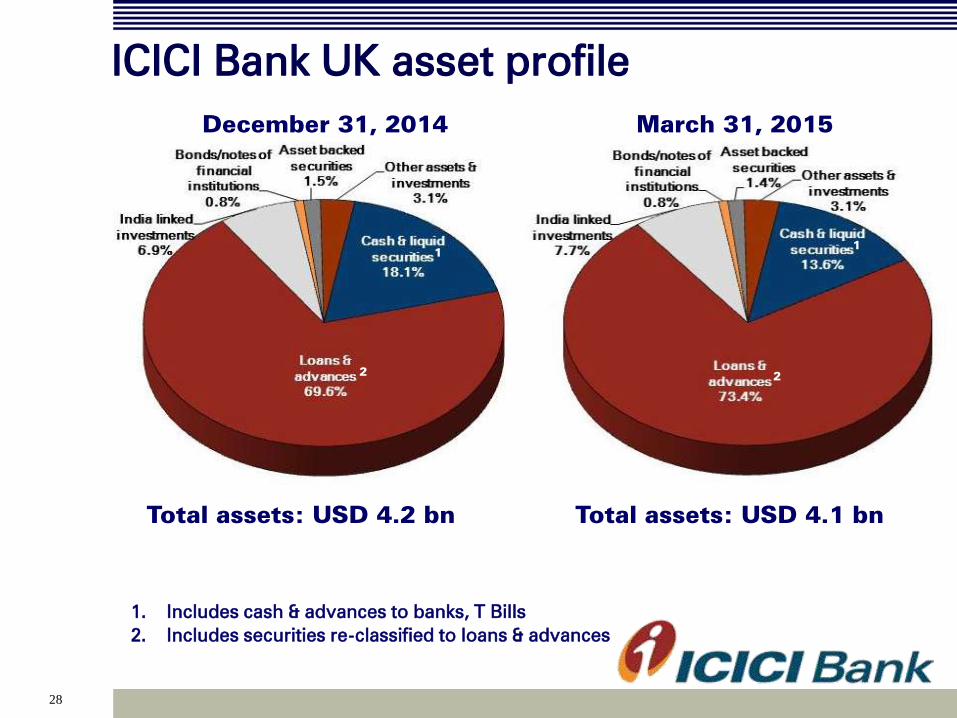
ICICI Bank UK asset profile
March 31, 2015
Total assets: USD 4.1 bn Total assets: USD 4.2 bn
December 31, 2014
1. Includes cash & advances to banks, T Bills
2. Includes securities re-classified to loans & advances
1
2 2
1
2
1

29
ICICI Bank UK liability profile
March 31, 2015
Total liabilities: USD 4.1 bn Total liabilities: USD 4.2 bn
December 31, 2014
Profit after tax of USD 18.3 mn in FY2015 compared to USD 25.2 mn in FY2014
Capital adequacy ratio at 19.2%
Proportion of retail term deposits in total deposits at 44% at March 31, 2015

30
ICICI Bank Canada asset profile
March 31, 2015
Total assets: CAD 5.9 bn Total assets: CAD 5.6 bn
December 31, 2014
1. Includes cash & advances to banks and government securities
2. Based on IFRS, securitised portfolio of CAD 2,316 mn and CAD 2,567 mn considered as
part of Insured mortgage portfolio at December 31, 2014 and March 31, 2015 respectively
1
2
2
1

31
ICICI Bank Canada liability profile
March 31, 2015
Total liabilities: CAD 5.9 bn Total liabilities: CAD 5.6 bn
December 31, 2014
Profit after tax of CAD 33.7 mn in FY2015 compared to CAD 48.3 mn in FY2014
Capital adequacy ratio at 28.5%
1. As per IFRS, proceeds of CAD 2,331 mn and CAD
2,575 mn from sale of securitised portfolio
considered as part of borrowings at December
31, 2014 and March 31, 2015 respectively
1 1
32
Domestic subsidiaries

33
ICICI Home Finance
March 31, 2015
Total assets: ` 82.99 bn Total assets: ` 80.80 bn
December 31, 2014
Profit after tax of ` 1.98 bn in FY2015 compared to ` 2.23 bn in FY2014
Capital adequacy ratio of 27.0% at March 31, 2015
Net NPA ratio: 0.7%
At March 31, 2015: Net worth ` 14.92 bn; Deposits ` 2.61 bn and Borrowings &
other liabilities ` 65.46 bn
34
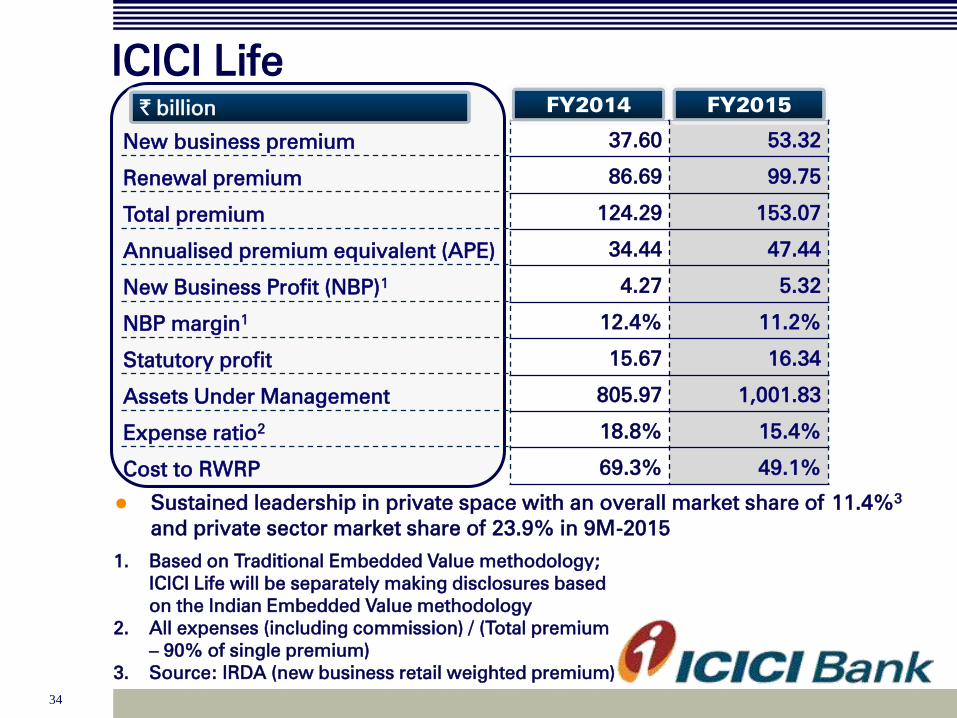
ICICI Life
New business premium
Renewal premium
Total premium
Annualised premium equivalent (APE)
New Business Profit (NBP)1
NBP margin1
Statutory profit
Assets Under Management
Expense ratio2
Cost to RWRP
` billion
37.60 53.32
86.69 99.75
124.29 153.07
34.44 47.44
4.27 5.32
12.4% 11.2%
15.67 16.34
805.97 1,001.83
18.8% 15.4%
69.3% 49.1%
FY2014 FY2015
Sustained leadership in private space with an overall market share of 11.4%3
and private sector market share of 23.9% in 9M-2015
1. Based on Traditional Embedded Value methodology;
ICICI Life will be separately making disclosures based
on the Indian Embedded Value methodology
2. All expenses (including commission) / (Total premium
– 90% of single premium)
3. Source: IRDA (new business retail weighted premium)

35
ICICI General
Gross premium1
Profit before tax
PAT
` billion
71.34 69.14
5.20 6.91
5.11 5.36
FY2014 FY2015
1. Excluding remittances from motor declined pool and including premium on
reinsurance accepted

36
Other subsidiaries
ICICI Prudential Asset Management
ICICI Securities Primary Dealership
ICICI Securities (Consolidated)
ICICI Venture
Profit after tax (` billion)
1.83 2.47
1.32 2.17
0.91 2.94
0.33 0.01
FY2014 FY2015
ICICI AMC: 35.0% year-on-year increase in profit after tax to `
2.47 billion in FY2015
Sustained market position as 2nd largest AMC in India
Profit after tax for ICICI Securities increased from ` 0.25
billion in Q4-2014 to ` 0.89 billion in Q4-2015
37
Thank you