Embed Size (px)
Citation preview
Finding and Communica-ng the Story – Lesson 3 of 6 – Quan-ta-ve Informa-on Ray Poynter, 2016
Finding and Communica-ng the Story
Lesson 3 of 6
Working with Quan-ta-ve Informa-on
Ray Poynter
May 2016
Finding and Communica-ng the Story – Lesson 3 of 6 – Quan-ta-ve Informa-on Ray Poynter, 2016
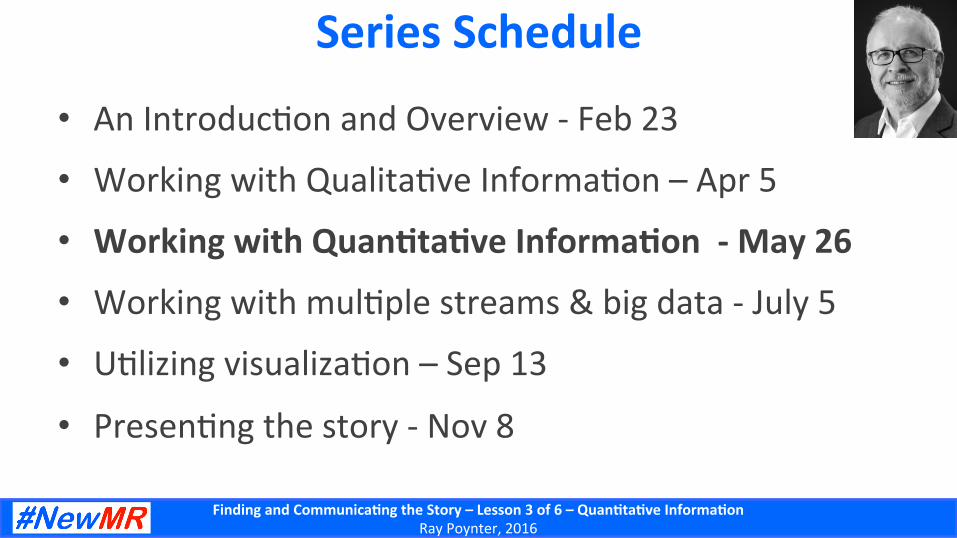
Series Schedule
• An Introduc5on and Overview -‐ Feb 23 • Working with Qualita5ve Informa5on – Apr 5
• Working with Quan-ta-ve Informa-on -‐ May 26
• Working with mul5ple streams & big data -‐ July 5
• U5lizing visualiza5on – Sep 13 • Presen5ng the story -‐ Nov 8
Finding and Communica-ng the Story – Lesson 3 of 6 – Quan-ta-ve Informa-on Ray Poynter, 2016
Agenda
• Brief recap • Prepara5on • Main story
• 5Cs and finding insight • Communica5ng quan5ta5ve messages
Finding and Communica-ng the Story – Lesson 3 of 6 – Quan-ta-ve Informa-on Ray Poynter, 2016
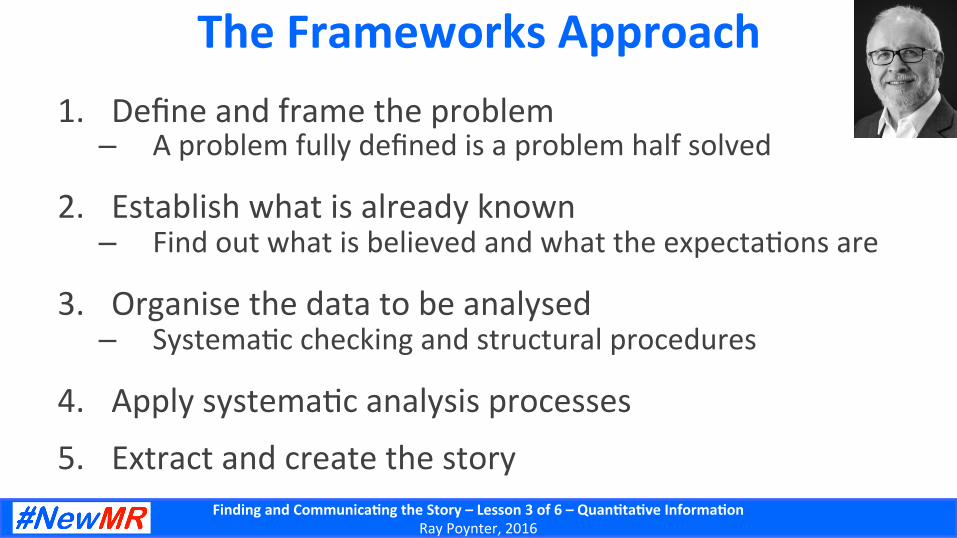
The Frameworks Approach 1. Define and frame the problem
– A problem fully defined is a problem half solved
2. Establish what is already known – Find out what is believed and what the expecta5ons are
3. Organise the data to be analysed – Systema5c checking and structural procedures
4. Apply systema5c analysis processes
5. Extract and create the story
Finding and Communica-ng the Story – Lesson 3 of 6 – Quan-ta-ve Informa-on Ray Poynter, 2016
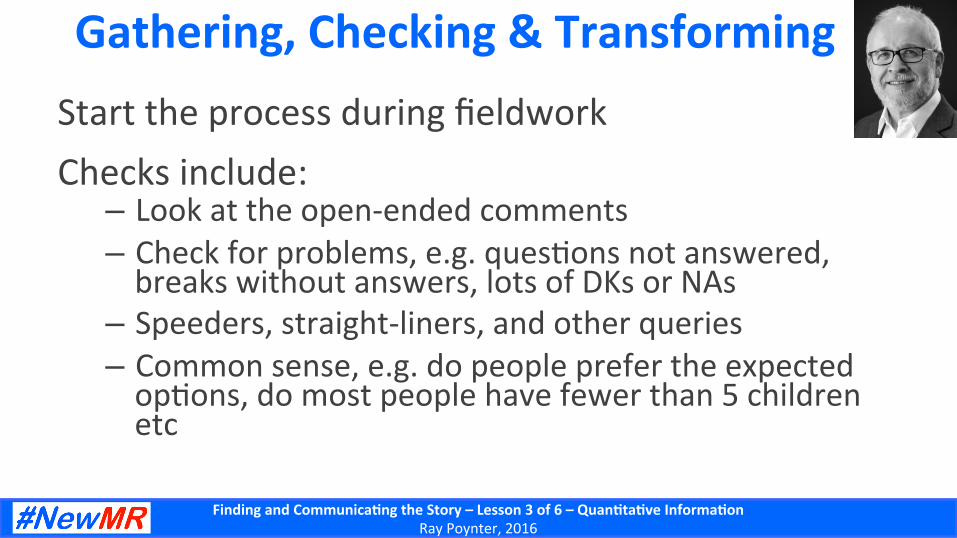
Gathering, Checking & Transforming Start the process during fieldwork Checks include:
– Look at the open-‐ended comments – Check for problems, e.g. ques5ons not answered, breaks without answers, lots of DKs or NAs
– Speeders, straight-‐liners, and other queries – Common sense, e.g. do people prefer the expected op5ons, do most people have fewer than 5 children etc
Finding and Communica-ng the Story – Lesson 3 of 6 – Quan-ta-ve Informa-on Ray Poynter, 2016
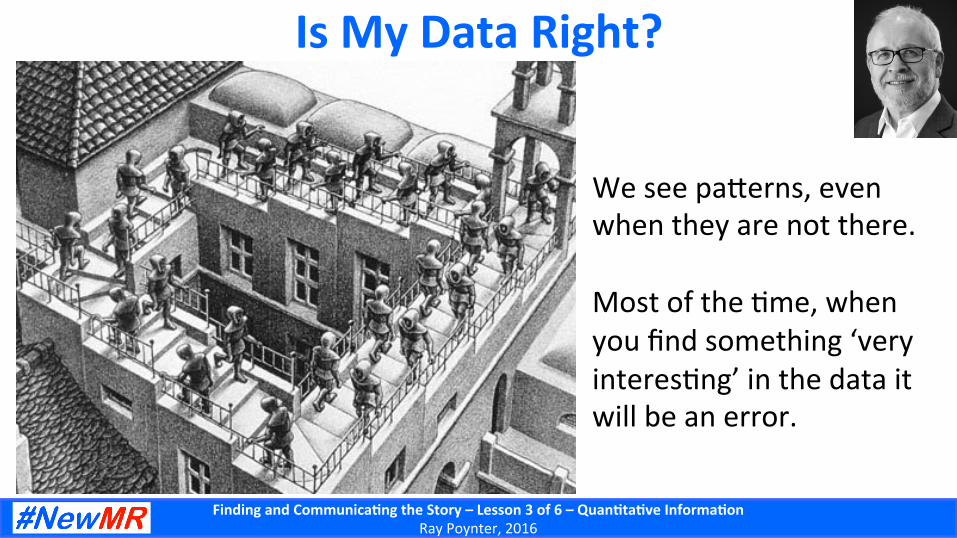
Is My Data Right?
We see pa^erns, even when they are not there. Most of the 5me, when you find something ‘very interes5ng’ in the data it will be an error.

Finding and Communica-ng the Story – Lesson 3 of 6 – Quan-ta-ve Informa-on Ray Poynter, 2016
Spurious Correla-ons
h^p://www.tylervigen.com/
Finding and Communica-ng the Story – Lesson 3 of 6 – Quan-ta-ve Informa-on Ray Poynter, 2016
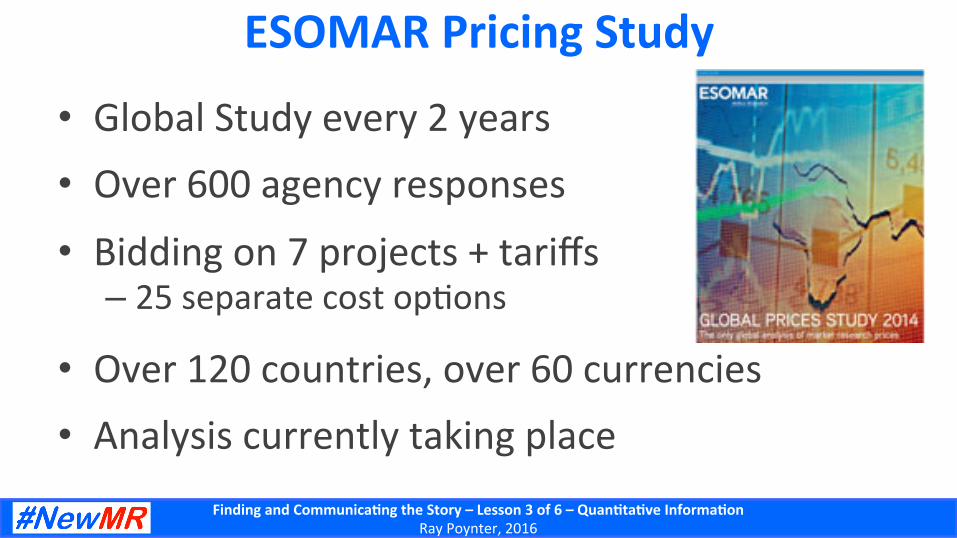
ESOMAR Pricing Study
• Global Study every 2 years • Over 600 agency responses • Bidding on 7 projects + tariffs
– 25 separate cost op5ons
• Over 120 countries, over 60 currencies • Analysis currently taking place
Finding and Communica-ng the Story – Lesson 3 of 6 – Quan-ta-ve Informa-on Ray Poynter, 2016
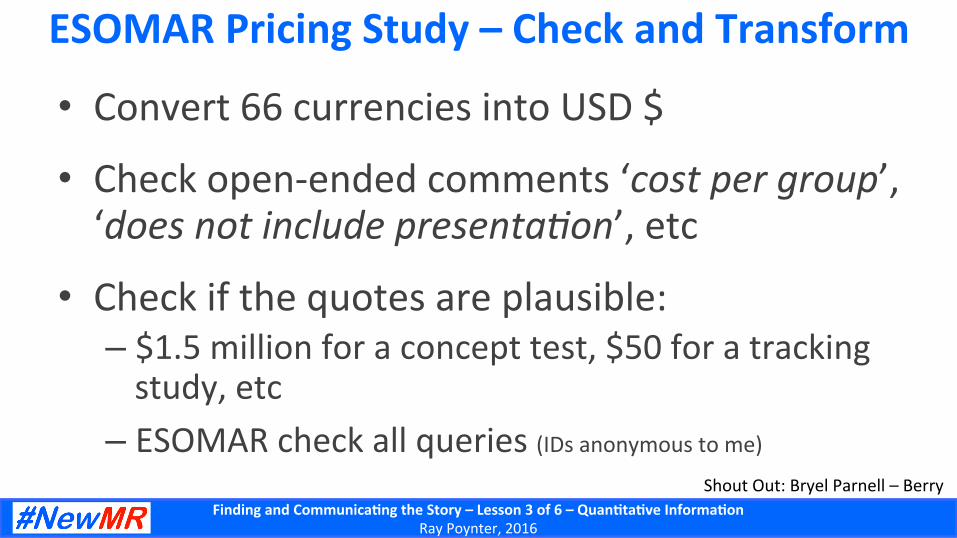
ESOMAR Pricing Study – Check and Transform
• Convert 66 currencies into USD $ • Check open-‐ended comments ‘cost per group’, ‘does not include presenta0on’, etc
• Check if the quotes are plausible: – $1.5 million for a concept test, $50 for a tracking study, etc
– ESOMAR check all queries (IDs anonymous to me)
Shout Out: Bryel Parnell – Berry
Finding and Communica-ng the Story – Lesson 3 of 6 – Quan-ta-ve Informa-on Ray Poynter, 2016
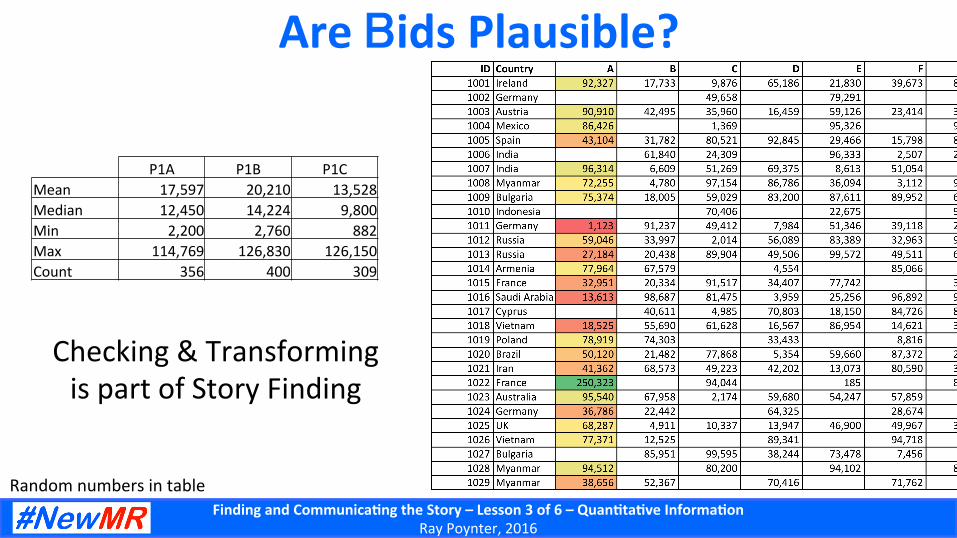
Are Bids Plausible?
P1A P1B P1C Mean 17,597 20,210 13,528 Median 12,450 14,224 9,800 Min 2,200 2,760 882 Max 114,769 126,830 126,150 Count 356 400 309
Random numbers in table
Checking & Transforming is part of Story Finding
Finding and Communica-ng the Story – Lesson 3 of 6 – Quan-ta-ve Informa-on Ray Poynter, 2016
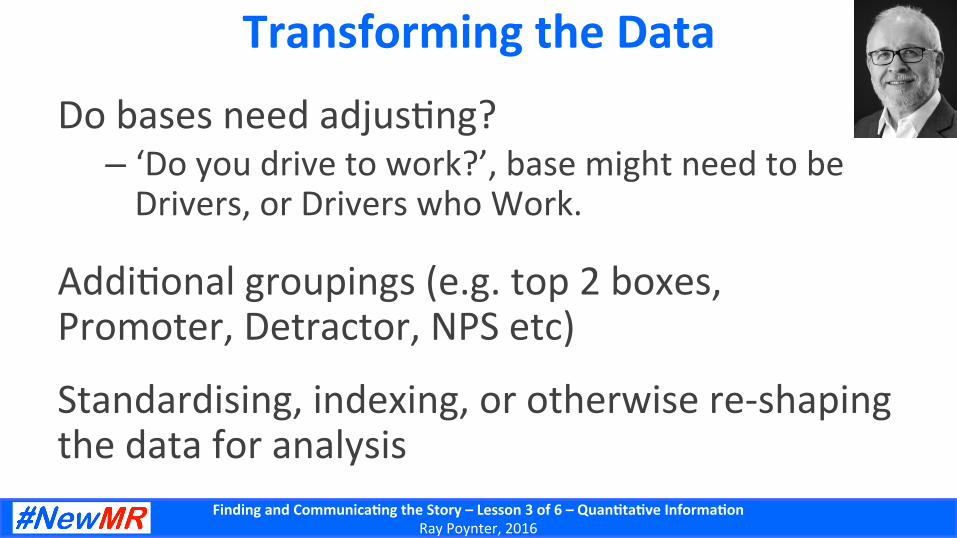
Transforming the Data
Do bases need adjus5ng? – ‘Do you drive to work?’, base might need to be Drivers, or Drivers who Work.
Addi5onal groupings (e.g. top 2 boxes, Promoter, Detractor, NPS etc)
Standardising, indexing, or otherwise re-‐shaping the data for analysis
Finding and Communica-ng the Story – Lesson 3 of 6 – Quan-ta-ve Informa-on Ray Poynter, 2016
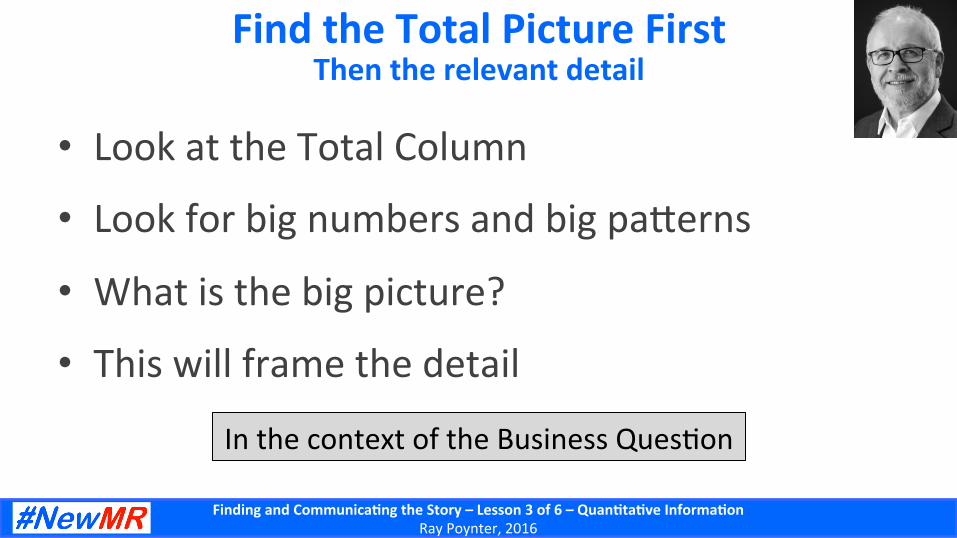
Find the Total Picture First Then the relevant detail
• Look at the Total Column
• Look for big numbers and big pa^erns
• What is the big picture?
• This will frame the detail
In the context of the Business Ques5on
Finding and Communica-ng the Story – Lesson 3 of 6 – Quan-ta-ve Informa-on Ray Poynter, 2016
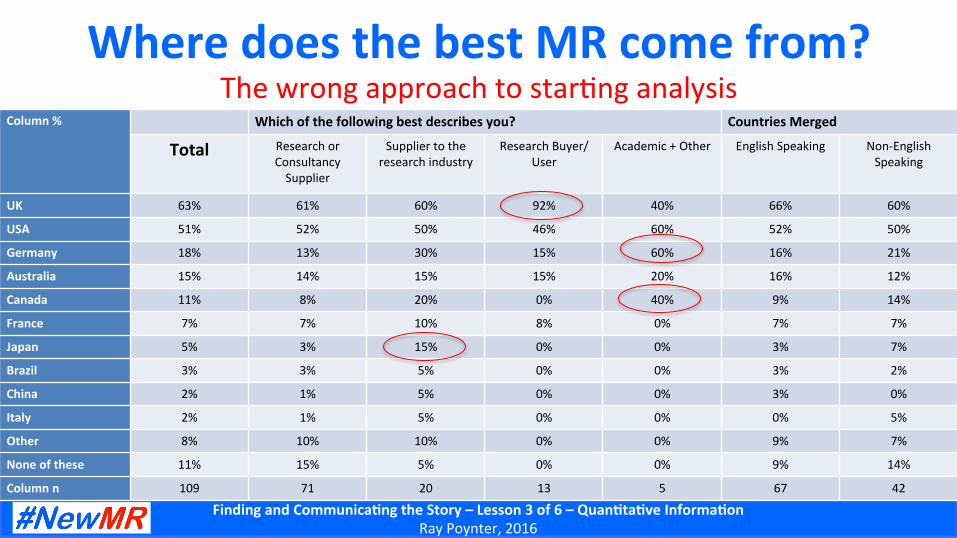
Where does the best MR come from? Column % Which of the following best describes you? Countries Merged
Total Research or Consultancy Supplier
Supplier to the research industry
Research Buyer/User
Academic + Other English Speaking Non-‐English Speaking
UK 63% 61% 60% 92% 40% 66% 60%
USA 51% 52% 50% 46% 60% 52% 50%
Germany 18% 13% 30% 15% 60% 16% 21%
Australia 15% 14% 15% 15% 20% 16% 12%
Canada 11% 8% 20% 0% 40% 9% 14%
France 7% 7% 10% 8% 0% 7% 7%
Japan 5% 3% 15% 0% 0% 3% 7%
Brazil 3% 3% 5% 0% 0% 3% 2%
China 2% 1% 5% 0% 0% 3% 0%
Italy 2% 1% 5% 0% 0% 0% 5%
Other 8% 10% 10% 0% 0% 9% 7%
None of these 11% 15% 5% 0% 0% 9% 14%
Column n 109 71 20 13 5 67 42
The wrong approach to star5ng analysis
Finding and Communica-ng the Story – Lesson 3 of 6 – Quan-ta-ve Informa-on Ray Poynter, 2016
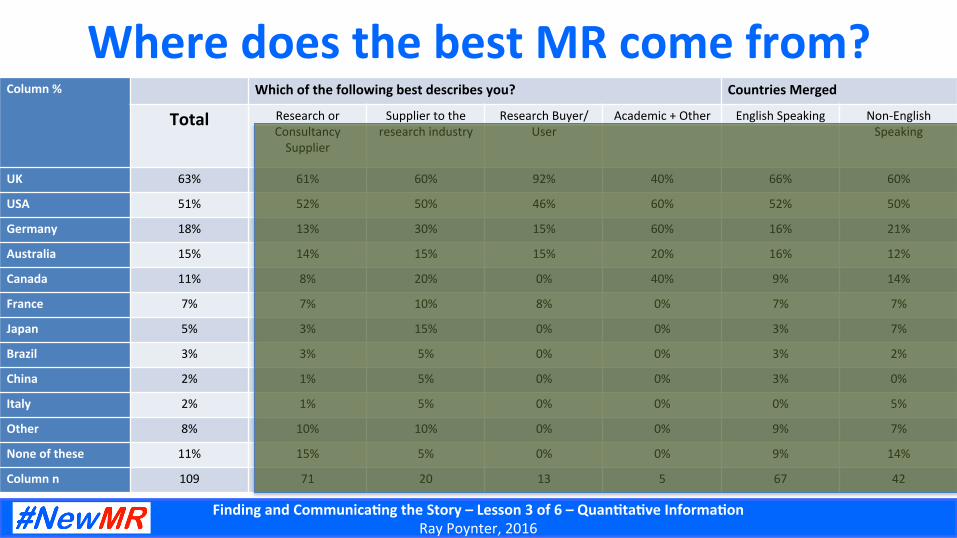
Where does the best MR come from? Column % Which of the following best describes you? Countries Merged
Total Research or Consultancy Supplier
Supplier to the research industry
Research Buyer/User
Academic + Other English Speaking Non-‐English Speaking
UK 63% 61% 60% 92% 40% 66% 60%
USA 51% 52% 50% 46% 60% 52% 50%
Germany 18% 13% 30% 15% 60% 16% 21%
Australia 15% 14% 15% 15% 20% 16% 12%
Canada 11% 8% 20% 0% 40% 9% 14%
France 7% 7% 10% 8% 0% 7% 7%
Japan 5% 3% 15% 0% 0% 3% 7%
Brazil 3% 3% 5% 0% 0% 3% 2%
China 2% 1% 5% 0% 0% 3% 0%
Italy 2% 1% 5% 0% 0% 0% 5%
Other 8% 10% 10% 0% 0% 9% 7%
None of these 11% 15% 5% 0% 0% 9% 14%
Column n 109 71 20 13 5 67 42
Finding and Communica-ng the Story – Lesson 3 of 6 – Quan-ta-ve Informa-on Ray Poynter, 2016
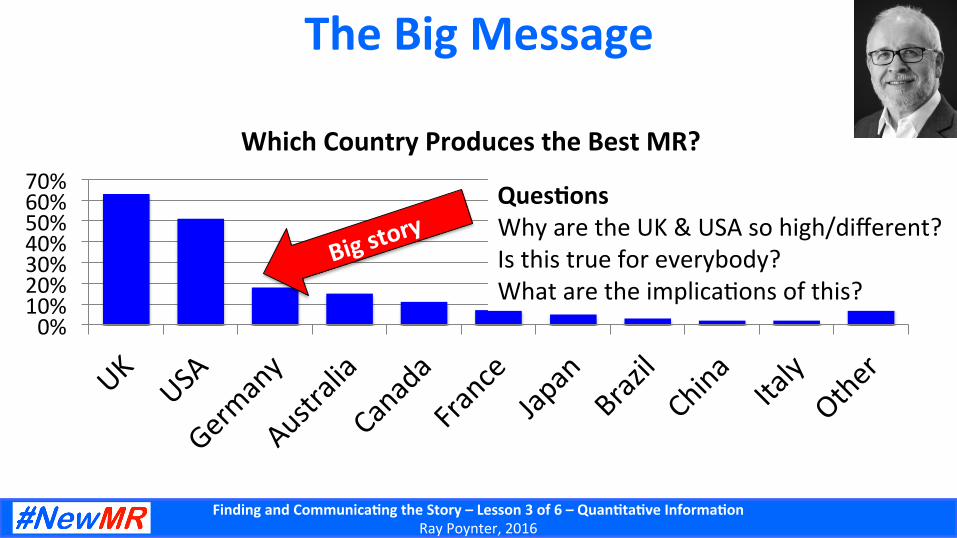
0% 10% 20% 30% 40% 50% 60% 70%
Which Country Produces the Best MR?
The Big Message
Big story
Ques-ons Why are the UK & USA so high/different? Is this true for everybody? What are the implica5ons of this?
Finding and Communica-ng the Story – Lesson 3 of 6 – Quan-ta-ve Informa-on Ray Poynter, 2016
Use the Business Ques-on as a Lens
The same data will deliver different stories, based on different business ques5ons
This is one of the reasons that industry reports have a less focused story
– They have many readers, with different needs and ques5ons
The business ques5on defines what is in, what is out, and where the magnifica5on should be
Finding and Communica-ng the Story – Lesson 3 of 6 – Quan-ta-ve Informa-on Ray Poynter, 2016
Find the Relevant Detail
Once you have the total story: – Are there people who have a different story (different from the main story)?
– Who are these people? – What is their story? – Why are they different? – What are the business implica5ons of this difference (these differences)?
Finding and Communica-ng the Story – Lesson 3 of 6 – Quan-ta-ve Informa-on Ray Poynter, 2016
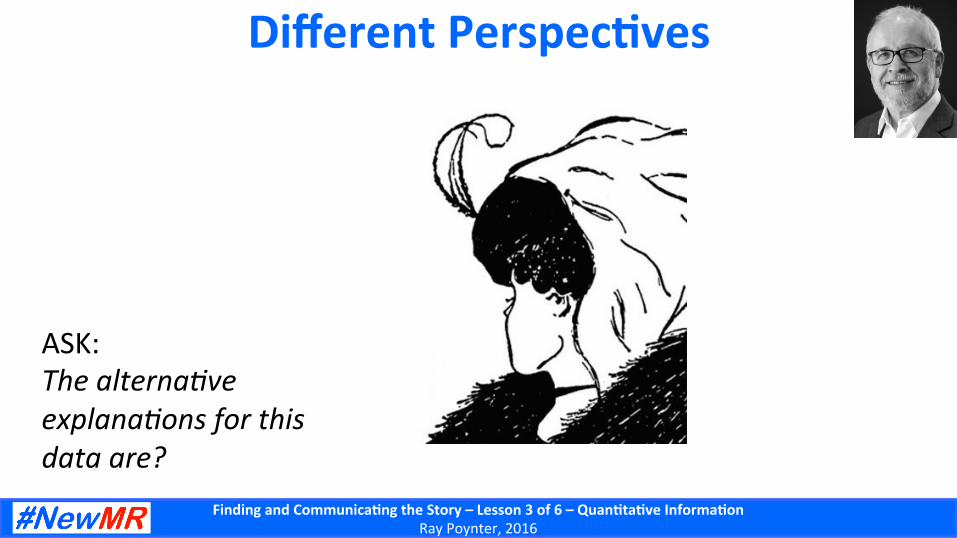
Different Perspec-ves
ASK: The alterna0ve explana0ons for this data are?
Finding and Communica-ng the Story – Lesson 3 of 6 – Quan-ta-ve Informa-on Ray Poynter, 2016
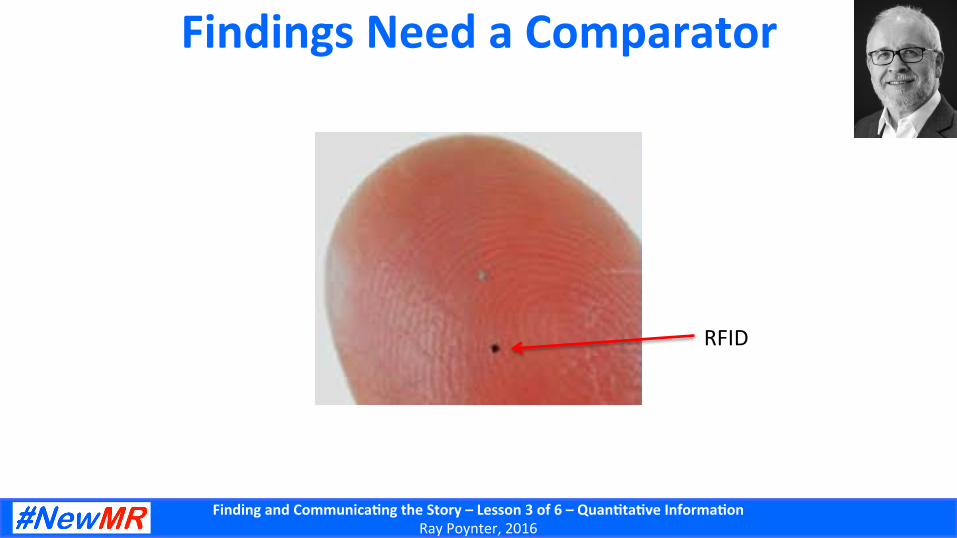
Findings Need a Comparator
RFID
Finding and Communica-ng the Story – Lesson 3 of 6 – Quan-ta-ve Informa-on Ray Poynter, 2016
Finding and communica-ng the story in health data
Finding and Communica-ng the Story – Lesson 3 of 6 – Quan-ta-ve Informa-on Ray Poynter, 2016
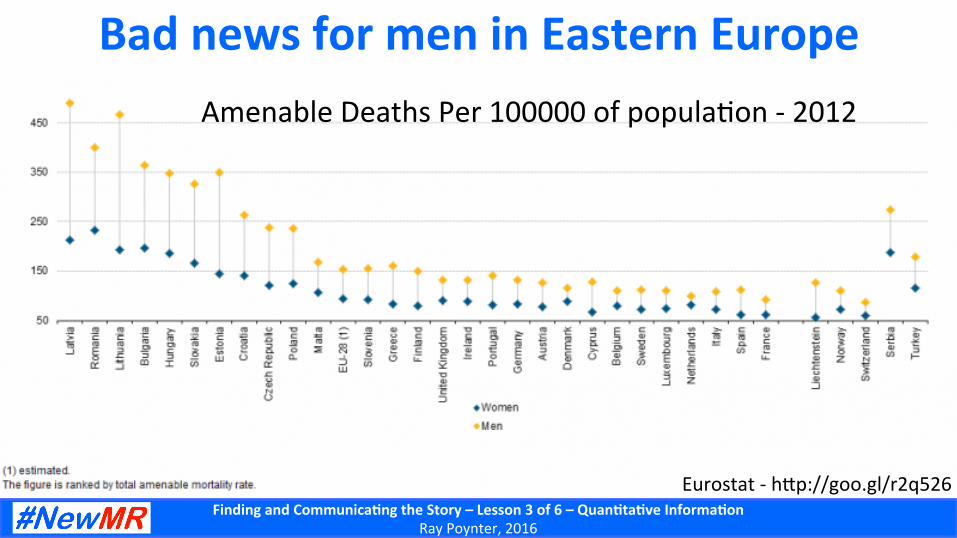
Bad news for men in Eastern Europe
Eurostat -‐ h^p://goo.gl/r2q526
Amenable Deaths Per 100000 of popula5on -‐ 2012
Finding and Communica-ng the Story – Lesson 3 of 6 – Quan-ta-ve Informa-on Ray Poynter, 2016
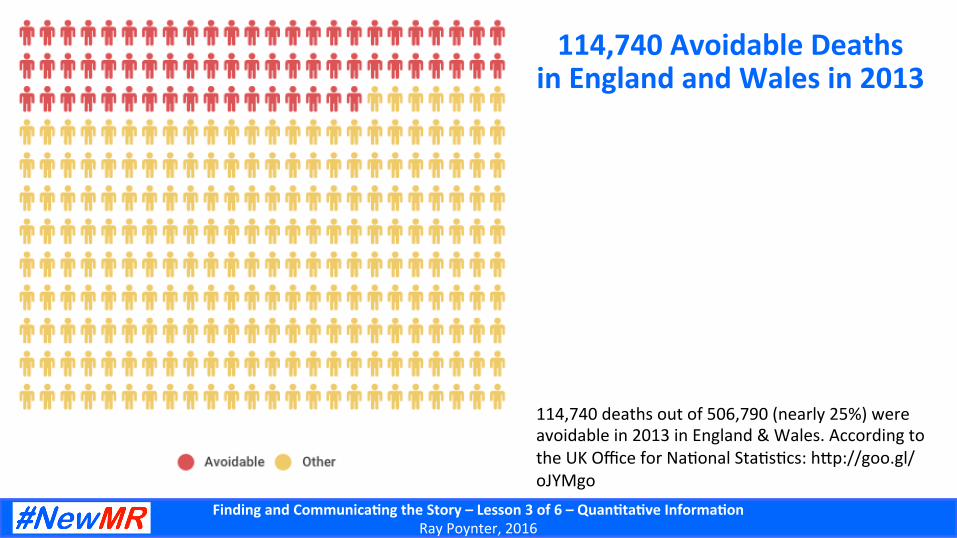
114,740 Avoidable Deaths in England and Wales in 2013
114,740 deaths out of 506,790 (nearly 25%) were avoidable in 2013 in England & Wales. According to the UK Office for Na5onal Sta5s5cs: h^p://goo.gl/oJYMgo
Finding and Communica-ng the Story – Lesson 3 of 6 – Quan-ta-ve Informa-on Ray Poynter, 2016
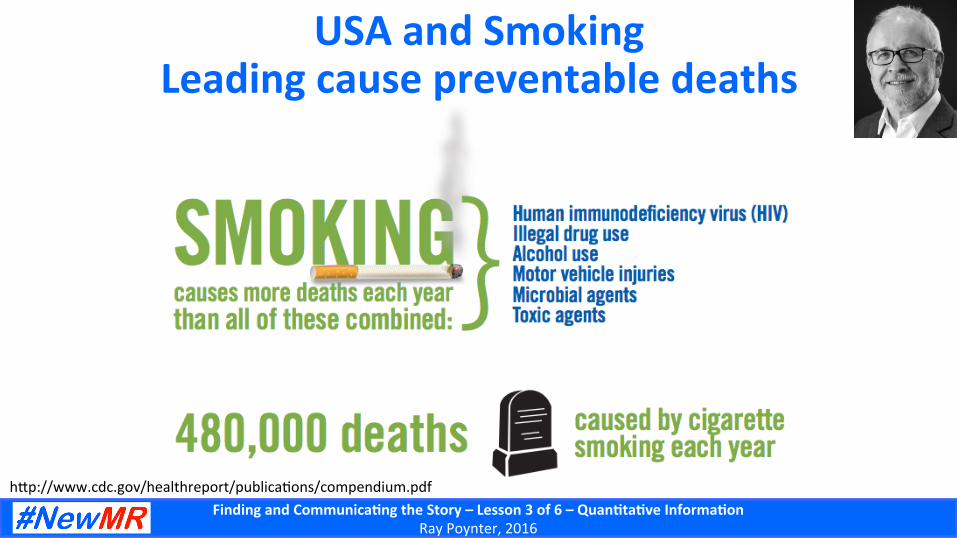
USA and Smoking Leading cause preventable deaths
h^p://www.cdc.gov/healthreport/publica5ons/compendium.pdf
Finding and Communica-ng the Story – Lesson 3 of 6 – Quan-ta-ve Informa-on Ray Poynter, 2016
The Tenuous Link Between Finding the Story and Telling the Story
In finding the story we have mul5ple data sources
We have differing degrees of confidence in those sources – A conjoint study with consul5ng surgeons might be our best source for finding the story
The best way to convey the story does not have to rest on the ‘best’ data
– A vox pop video with a pa5ent might be a poor way to find the story, but it can be a great way to tell the story
Finding and Communica-ng the Story – Lesson 3 of 6 – Quan-ta-ve Informa-on Ray Poynter, 2016
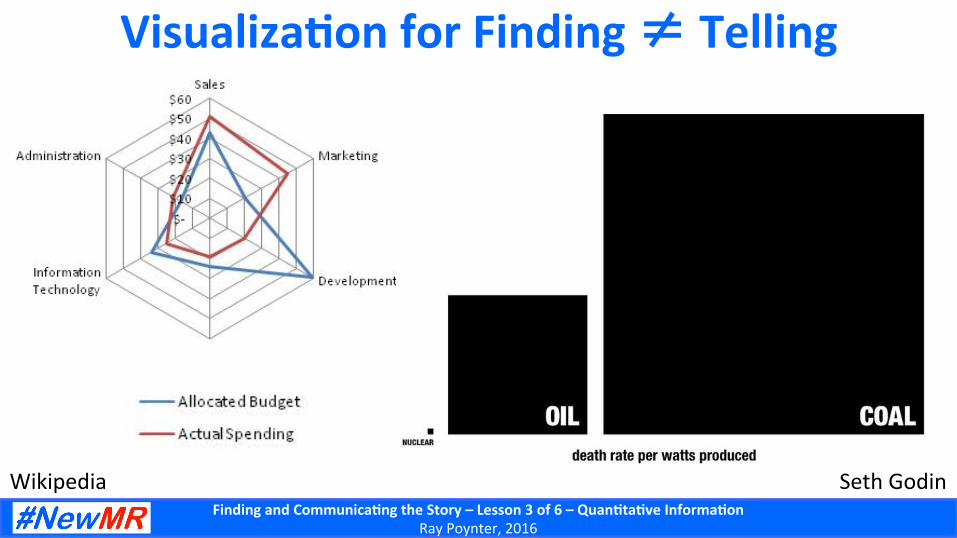
Visualiza-on for Finding ≠ Telling
Seth Godin Wikipedia

Finding and Communica-ng the Story – Lesson 3 of 6 – Quan-ta-ve Informa-on Ray Poynter, 2016
5 Cs of Insight
• Connec5ons • Coincidences • Curiosi5es • Contradic5ons • Crea5ve jump
} Build on the current picture
Rethink an assump5on
Discard an assump5on
HT, John Storey, Abbo^ EPD
Finding and Communica-ng the Story – Lesson 3 of 6 – Quan-ta-ve Informa-on Ray Poynter, 2016
Connec-ons • Charles Darwin and Evolu5on • Aware of how farmers bred different sizes and shapes of cows, horses, pigs etc – selec5ve breeding
• Visited Galapagos and saw varie5es of sizes/shapes • Read Malthus’ essay on popula5on growth and compe55on for resources
• Made the connec5on to realise that compe55on for resources was the hand behind the selec5ve breeding
Finding and Communica-ng the Story – Lesson 3 of 6 – Quan-ta-ve Informa-on Ray Poynter, 2016
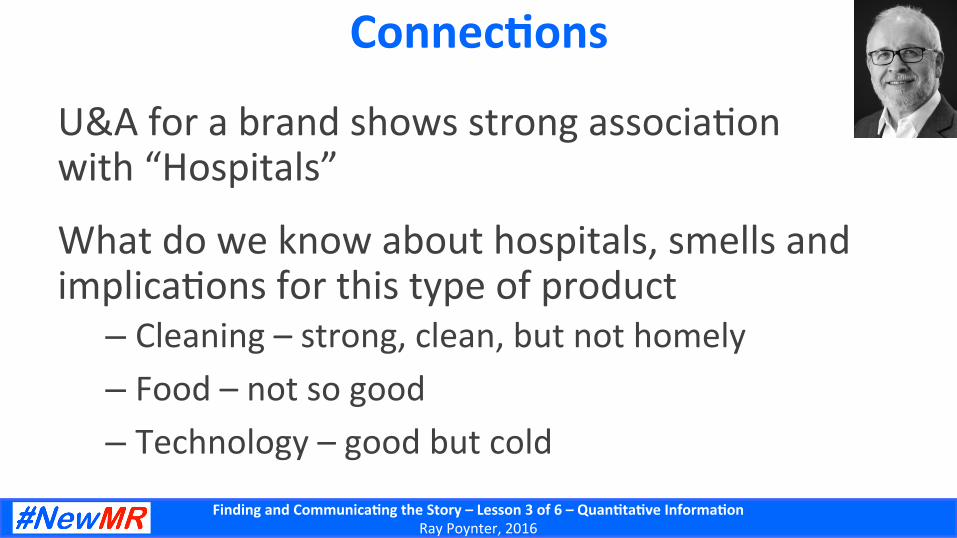
Connec-ons
U&A for a brand shows strong associa5on with “Hospitals”
What do we know about hospitals, smells and implica5ons for this type of product
– Cleaning – strong, clean, but not homely – Food – not so good – Technology – good but cold
Finding and Communica-ng the Story – Lesson 3 of 6 – Quan-ta-ve Informa-on Ray Poynter, 2016
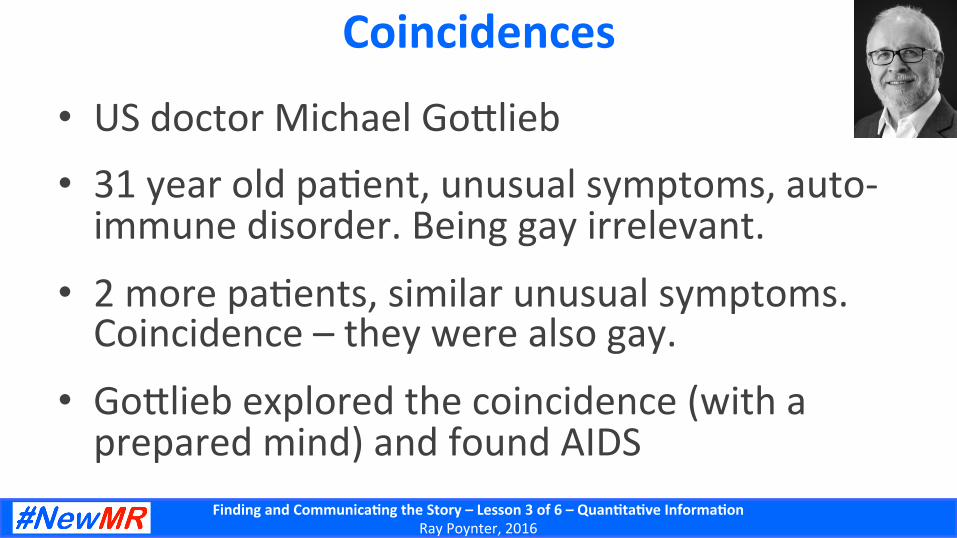
Coincidences
• US doctor Michael Go^lieb • 31 year old pa5ent, unusual symptoms, auto-‐immune disorder. Being gay irrelevant.
• 2 more pa5ents, similar unusual symptoms. Coincidence – they were also gay.
• Go^lieb explored the coincidence (with a prepared mind) and found AIDS
Finding and Communica-ng the Story – Lesson 3 of 6 – Quan-ta-ve Informa-on Ray Poynter, 2016
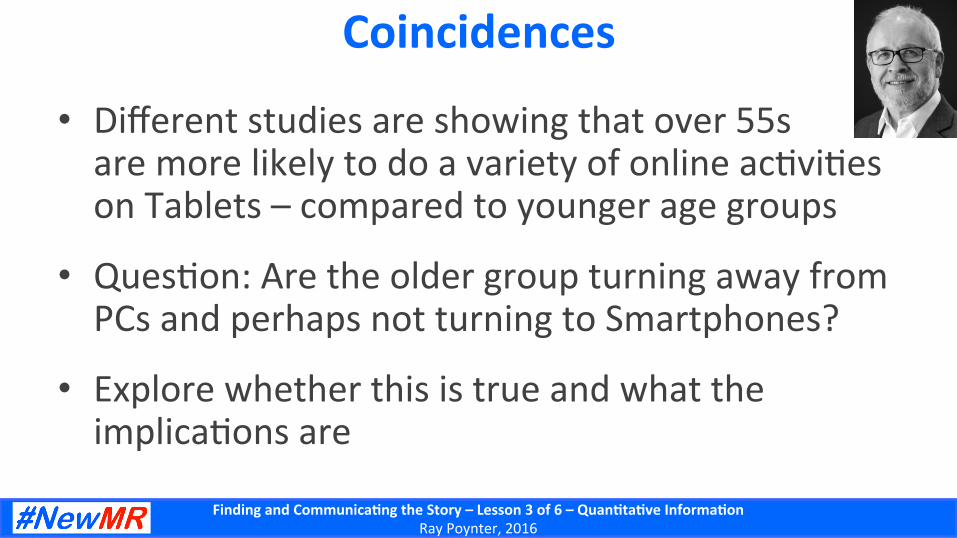
Coincidences
• Different studies are showing that over 55s are more likely to do a variety of online ac5vi5es on Tablets – compared to younger age groups
• Ques5on: Are the older group turning away from PCs and perhaps not turning to Smartphones?
• Explore whether this is true and what the implica5ons are
Finding and Communica-ng the Story – Lesson 3 of 6 – Quan-ta-ve Informa-on Ray Poynter, 2016
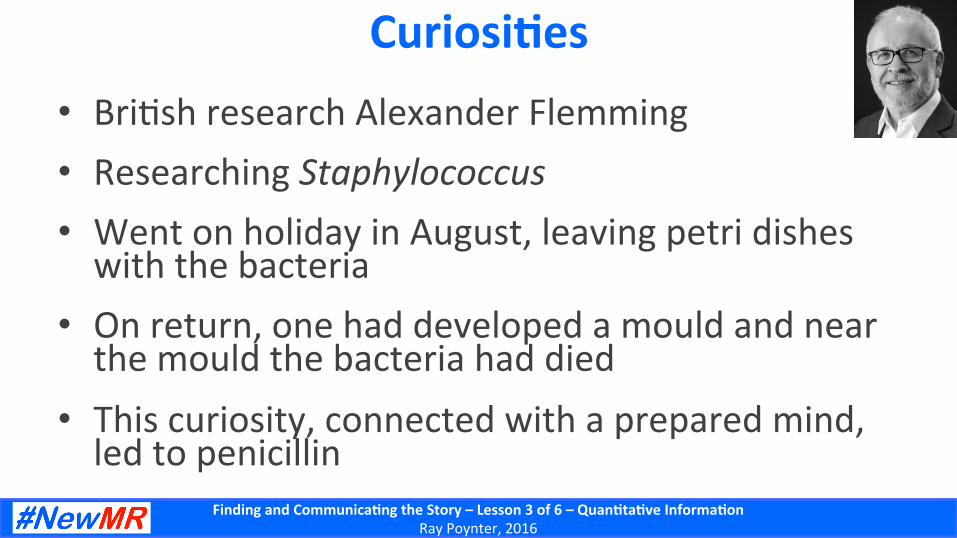
Curiosi-es • Bri5sh research Alexander Flemming • Researching Staphylococcus • Went on holiday in August, leaving petri dishes with the bacteria
• On return, one had developed a mould and near the mould the bacteria had died
• This curiosity, connected with a prepared mind, led to penicillin
Finding and Communica-ng the Story – Lesson 3 of 6 – Quan-ta-ve Informa-on Ray Poynter, 2016
Curiosi-es • Researching a new brand of strong, dark chocolate
• Parents of small children over-‐index on liking it. In open-‐ends, one par5cipant men5ons buying it because her children don’t like it
• Hmm, is this an insight, let’s dig deeper
Finding and Communica-ng the Story – Lesson 3 of 6 – Quan-ta-ve Informa-on Ray Poynter, 2016
Contradic-ons • 19th Century London, John Snow is inves5ga5ng cholera
• Predominant theory = cholera is airborne • But! He looks at corpses. The lungs look good, but their diges5ve system looked damaged CONTRADICTION
• He looked for inges5on routes and discovered cholera was spread via drinking water
Finding and Communica-ng the Story – Lesson 3 of 6 – Quan-ta-ve Informa-on Ray Poynter, 2016
Contradic-ons
• Client has a product which is liked by children, but is not successful – they believe parents are not buying it
• Research brief, find out how to persuade more parents to buy it for their children
• But, looking in trash cans finds lots of uneaten product – CONTRADICTION many children do not actually like it
Finding and Communica-ng the Story – Lesson 3 of 6 – Quan-ta-ve Informa-on Ray Poynter, 2016
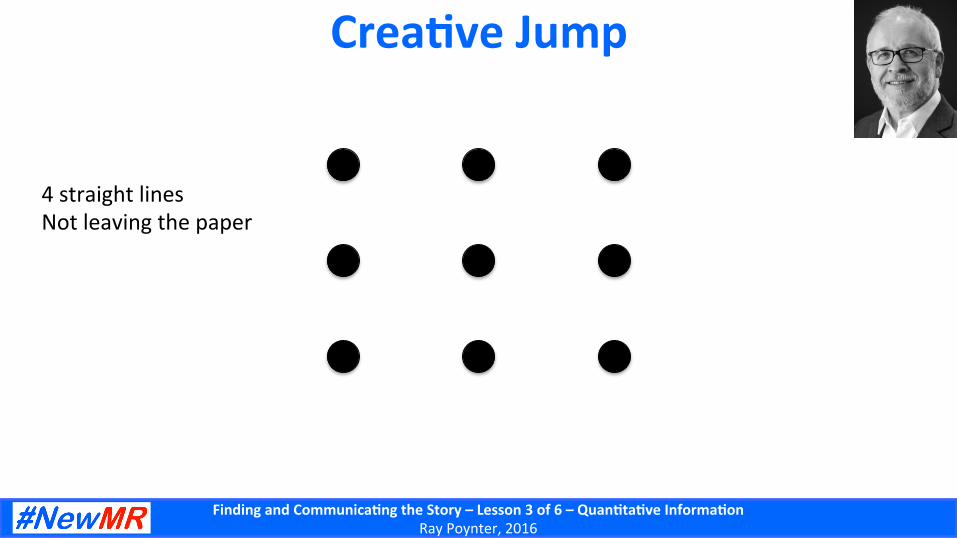
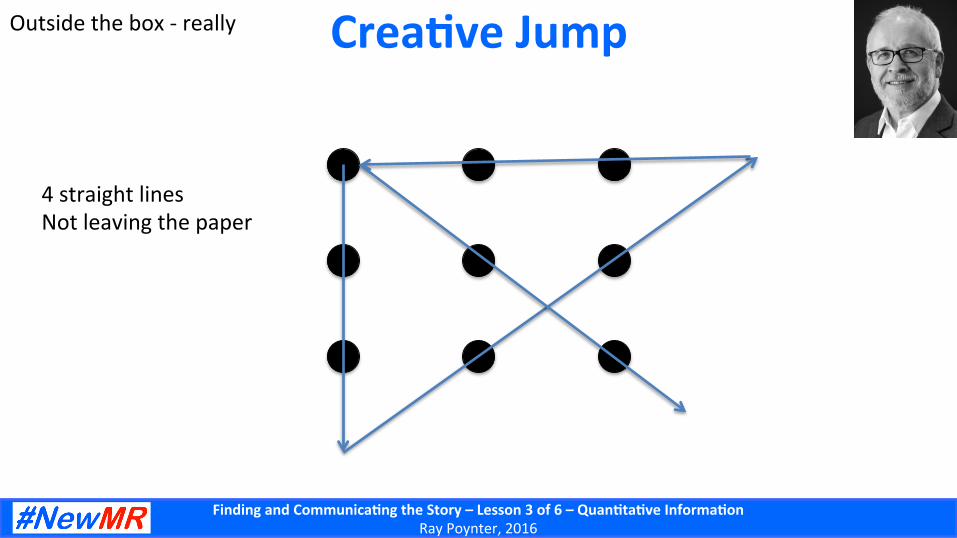
Crea-ve Jump
4 straight lines Not leaving the paper
Finding and Communica-ng the Story – Lesson 3 of 6 – Quan-ta-ve Informa-on Ray Poynter, 2016
Crea-ve Jump
4 straight lines Not leaving the paper
Outside the box -‐ really
Finding and Communica-ng the Story – Lesson 3 of 6 – Quan-ta-ve Informa-on Ray Poynter, 2016
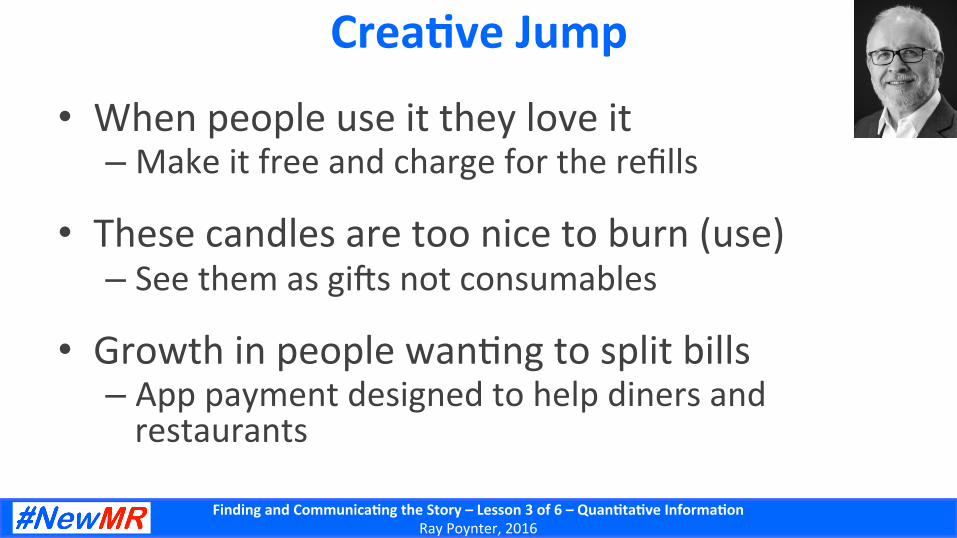
Crea-ve Jump
• When people use it they love it – Make it free and charge for the refills
• These candles are too nice to burn (use) – See them as giws not consumables
• Growth in people wan5ng to split bills – App payment designed to help diners and restaurants
Finding and Communica-ng the Story – Lesson 3 of 6 – Quan-ta-ve Informa-on Ray Poynter, 2016
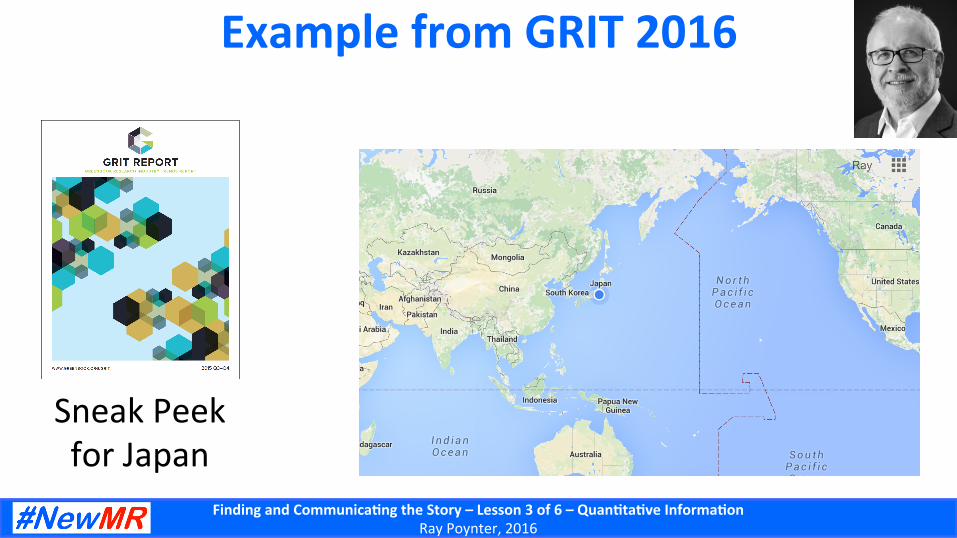
Example from GRIT 2016
Sneak Peek for Japan
Finding and Communica-ng the Story – Lesson 3 of 6 – Quan-ta-ve Informa-on Ray Poynter, 2016
A Business Ques-on?
Based on the 2016 GRIT Study What advice would I offer the Japanese Research industry?
Finding and Communica-ng the Story – Lesson 3 of 6 – Quan-ta-ve Informa-on Ray Poynter, 2016
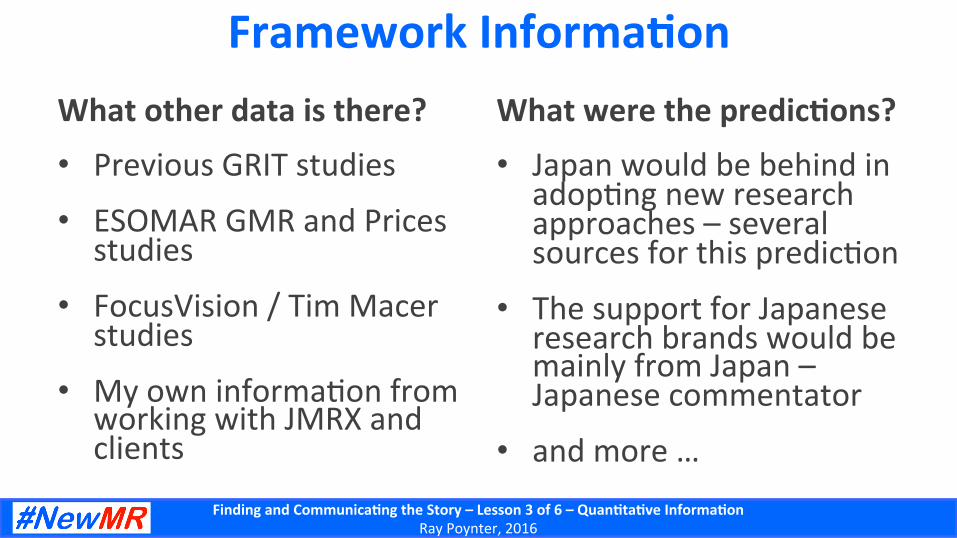
Framework Informa-on What other data is there? • Previous GRIT studies • ESOMAR GMR and Prices
studies
• FocusVision / Tim Macer studies
• My own informa5on from working with JMRX and clients
What were the predic-ons? • Japan would be behind in
adop5ng new research approaches – several sources for this predic5on
• The support for Japanese research brands would be mainly from Japan – Japanese commentator
• and more …
Finding and Communica-ng the Story – Lesson 3 of 6 – Quan-ta-ve Informa-on Ray Poynter, 2016
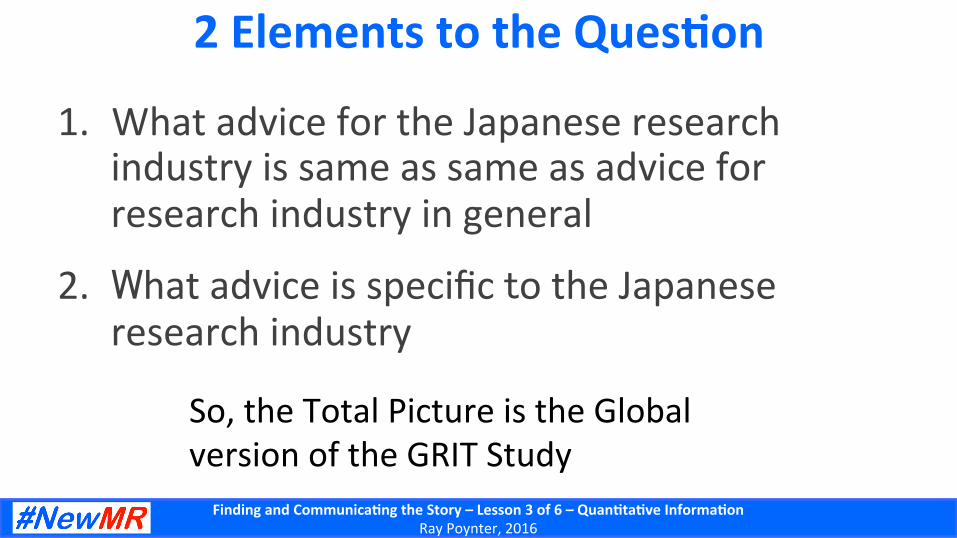
2 Elements to the Ques-on
1. What advice for the Japanese research industry is same as same as advice for research industry in general
2. What advice is specific to the Japanese research industry
So, the Total Picture is the Global version of the GRIT Study

Finding and Communica-ng the Story – Lesson 3 of 6 – Quan-ta-ve Informa-on Ray Poynter, 2016
Most Innova-ve Supplier 2016 Global 1 Brainjuicer 2 Ipsos 3 InSites Consulting 4 Nielsen 5 GFK 6 TNS 7 Vision Critical 8 LRW 9 Millward Brown 10 Google 22 Intage/インテージ 24 Macromill/マクロミル
Japan # Company Global # 1 Intage/インテージ 22 2 Macromill/マクロミル 24 3 Brainjuicer 1 4 Nielsen 4 5 Kantar 16 6 GMO Research 50+ 7 Vision Critical 7 8 Google 10 9 Ipsos 2 10 InSites Consulting 3
Base: Global 2144, Japan 108
Finding and Communica-ng the Story – Lesson 3 of 6 – Quan-ta-ve Informa-on Ray Poynter, 2016
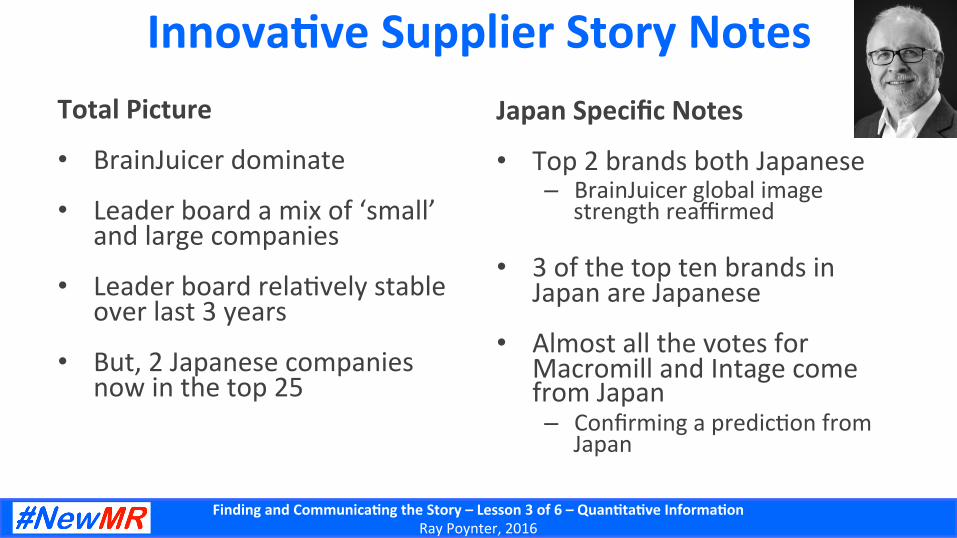
Innova-ve Supplier Story Notes Total Picture
• BrainJuicer dominate
• Leader board a mix of ‘small’ and large companies
• Leader board rela5vely stable over last 3 years
• But, 2 Japanese companies now in the top 25
Japan Specific Notes
• Top 2 brands both Japanese – BrainJuicer global image
strength reaffirmed
• 3 of the top ten brands in Japan are Japanese
• Almost all the votes for Macromill and Intage come from Japan – Confirming a predic5on from
Japan
Finding and Communica-ng the Story – Lesson 3 of 6 – Quan-ta-ve Informa-on Ray Poynter, 2016
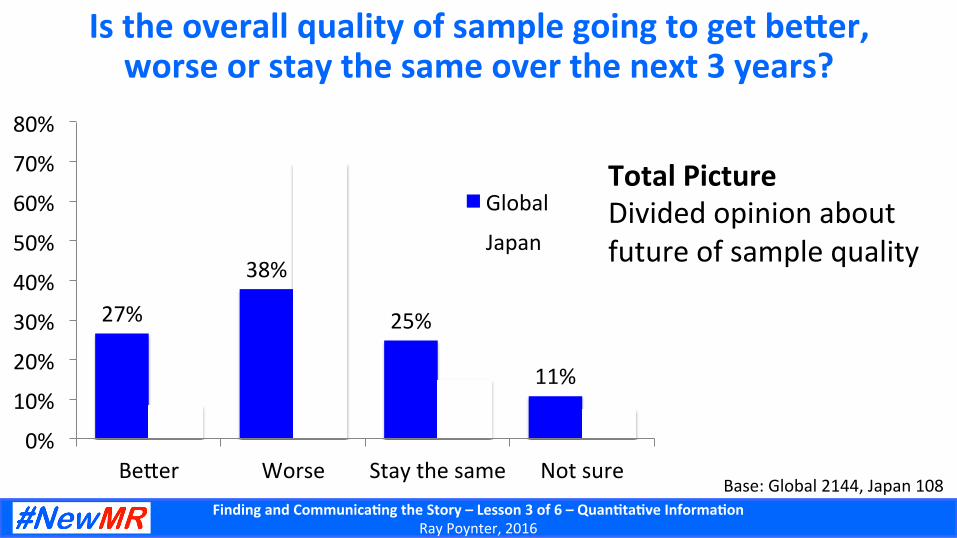
Is the overall quality of sample going to get beber, worse or stay the same over the next 3 years?
27%
38%
25%
11%
0%
10%
20%
30%
40%
50%
60%
70%
80%
Be^er Worse Stay the same Not sure
Global
Japan
Base: Global 2144, Japan 108
Total Picture Divided opinion about future of sample quality
Finding and Communica-ng the Story – Lesson 3 of 6 – Quan-ta-ve Informa-on Ray Poynter, 2016
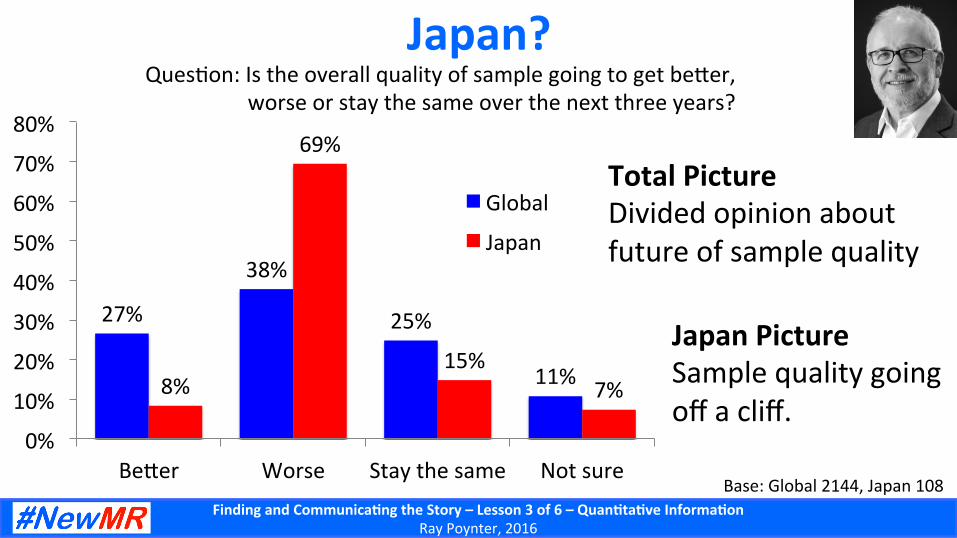
Japan?
27%
38%
25%
11% 8%
69%
15% 7%
0%
10%
20%
30%
40%
50%
60%
70%
80%
Be^er Worse Stay the same Not sure
Global
Japan
Ques5on: Is the overall quality of sample going to get be^er, worse or stay the same over the next three years?
Base: Global 2144, Japan 108
Total Picture Divided opinion about future of sample quality
Japan Picture Sample quality going off a cliff.
Finding and Communica-ng the Story – Lesson 3 of 6 – Quan-ta-ve Informa-on Ray Poynter, 2016
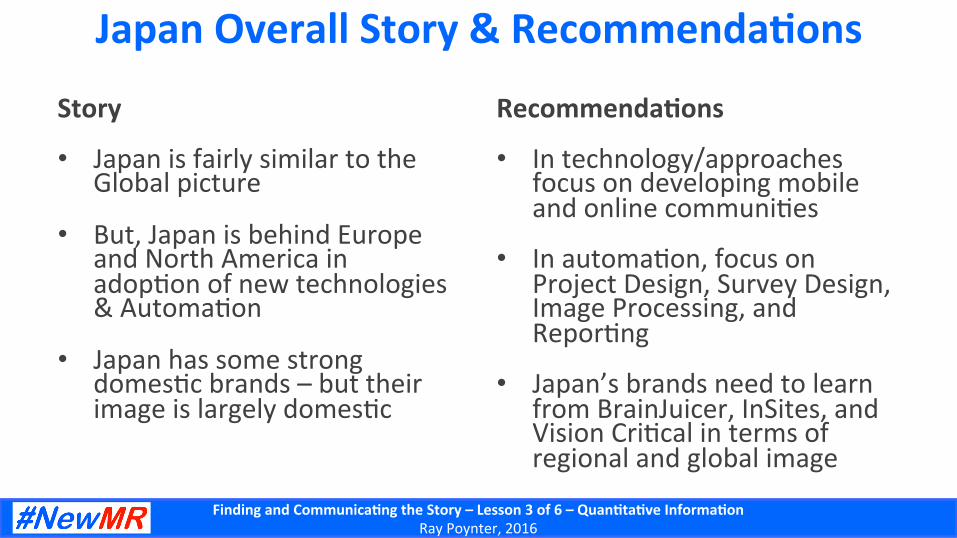
Japan Overall Story & Recommenda-ons
Story
• Japan is fairly similar to the Global picture
• But, Japan is behind Europe and North America in adop5on of new technologies & Automa5on
• Japan has some strong domes5c brands – but their image is largely domes5c
Recommenda-ons
• In technology/approaches focus on developing mobile and online communi5es
• In automa5on, focus on Project Design, Survey Design, Image Processing, and Repor5ng
• Japan’s brands need to learn from BrainJuicer, InSites, and Vision Cri5cal in terms of regional and global image
Finding and Communica-ng the Story – Lesson 3 of 6 – Quan-ta-ve Informa-on Ray Poynter, 2016
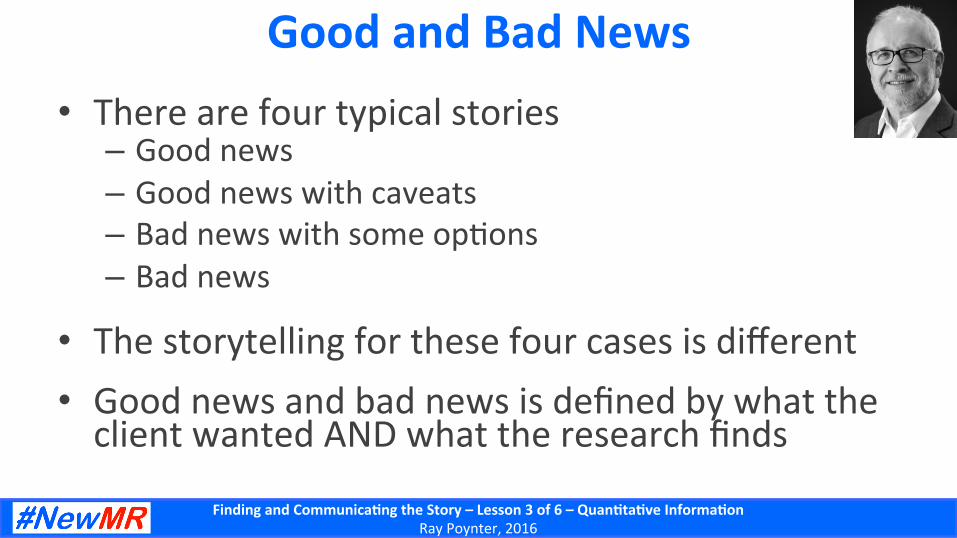
Good and Bad News • There are four typical stories
– Good news – Good news with caveats – Bad news with some op5ons – Bad news
• The storytelling for these four cases is different • Good news and bad news is defined by what the client wanted AND what the research finds
Finding and Communica-ng the Story – Lesson 3 of 6 – Quan-ta-ve Informa-on Ray Poynter, 2016
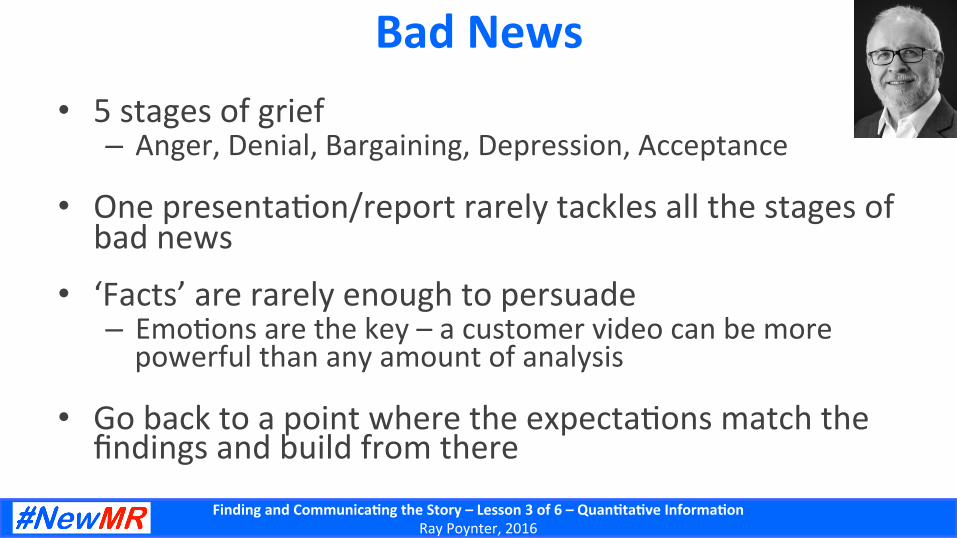
Bad News • 5 stages of grief
– Anger, Denial, Bargaining, Depression, Acceptance
• One presenta5on/report rarely tackles all the stages of bad news
• ‘Facts’ are rarely enough to persuade – Emo5ons are the key – a customer video can be more powerful than any amount of analysis
• Go back to a point where the expecta5ons match the findings and build from there
Finding and Communica-ng the Story – Lesson 3 of 6 – Quan-ta-ve Informa-on Ray Poynter, 2016
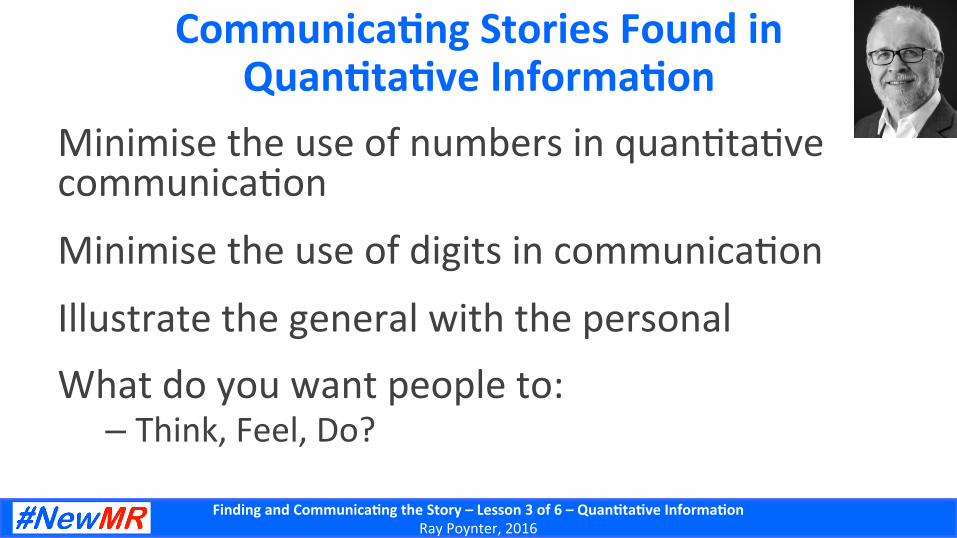
Communica-ng Stories Found in Quan-ta-ve Informa-on
Minimise the use of numbers in quan5ta5ve communica5on
Minimise the use of digits in communica5on
Illustrate the general with the personal What do you want people to:
– Think, Feel, Do?
Finding and Communica-ng the Story – Lesson 3 of 6 – Quan-ta-ve Informa-on Ray Poynter, 2016
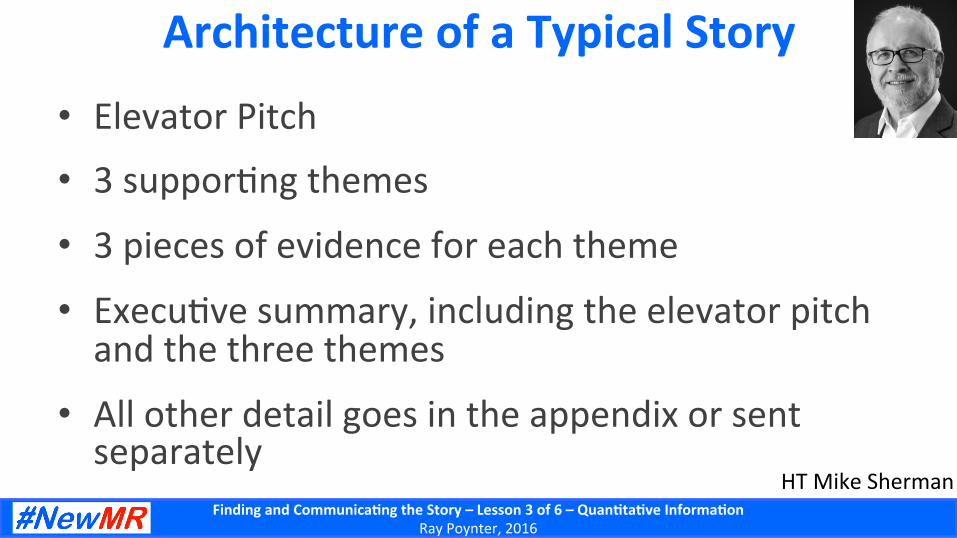
Architecture of a Typical Story
• Elevator Pitch • 3 suppor5ng themes
• 3 pieces of evidence for each theme
• Execu5ve summary, including the elevator pitch and the three themes
• All other detail goes in the appendix or sent separately
HT Mike Sherman
Finding and Communica-ng the Story – Lesson 3 of 6 – Quan-ta-ve Informa-on Ray Poynter, 2016
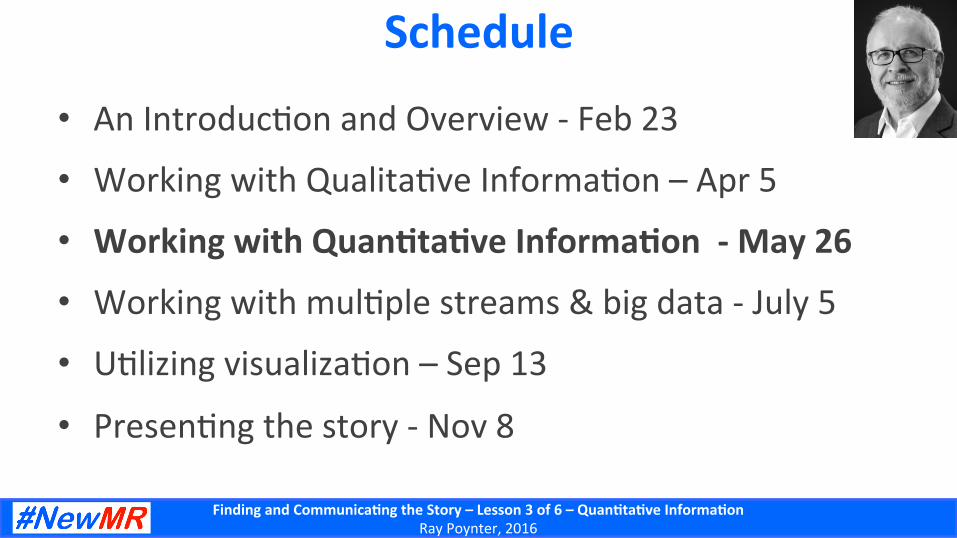
Schedule
• An Introduc5on and Overview -‐ Feb 23 • Working with Qualita5ve Informa5on – Apr 5
• Working with Quan-ta-ve Informa-on -‐ May 26
• Working with mul5ple streams & big data -‐ July 5
• U5lizing visualiza5on – Sep 13 • Presen5ng the story -‐ Nov 8
Finding and Communica-ng the Story – Lesson 3 of 6 – Quan-ta-ve Informa-on Ray Poynter, 2016
Thank You!
Follow me on Twiber @RayPoynter
Or sign-‐up to receive our weekly mailing at hbp://NewMR.org
Finding and Communica-ng the Story – Lesson 3 of 6 – Quan-ta-ve Informa-on Ray Poynter, 2016
Q & A
Ray Poynter The Future Place