Embed Size (px)
Citation preview

1
Implementing highly effective
teacher policy and practice
2015 International Summit
of the Teaching Profession
Andreas Schleicher
Banff, 30 March 2015
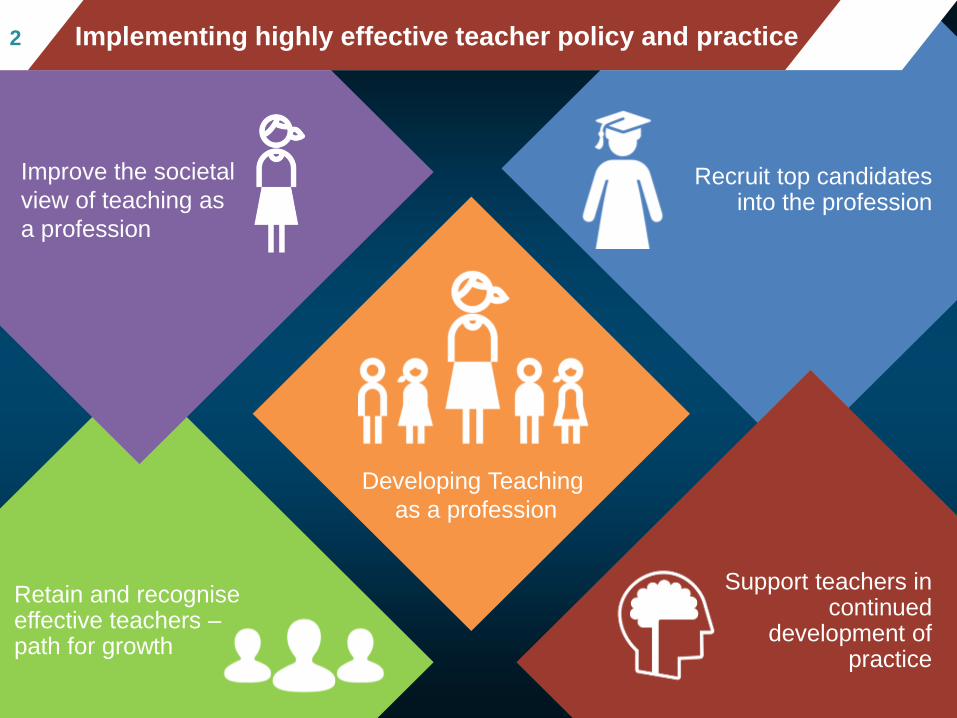
Developing Teaching
as a profession
Recruit top candidates into the profession
Support teachers in continued
development of practice
Retain and recognise effective teachers –path for growth
Improve the societal
view of teaching as
a profession
Mean mathematics performance, by school location, after acc
ounting for socio-economic status22 Implementing highly effective teacher policy and practice

Valuing teachers and strengthening their
sense of effectiveness

Mean mathematics performance, by school location,
after accounting for socio-economic statusFig II.3.344 Teachers' perceptions of the value of teaching
Percentage of lower secondary teachers who "agree" or "strongly agree" that teaching profession is a valued profession
in society
0
10
20
30
40
50
60
70
80
90
100
Mala
ysia
Sin
gapore
Kore
a
Abu D
habi (U
AE)
Finla
nd
Mexi
co
Alb
erta (Canada)
Flanders
(Belg
ium
)
Neth
erlands
Aust
ralia
Engla
nd (UK)
Rom
ania
Isra
el
United S
tate
s
Chile
Ave
rage
Norw
ay
Japan
Latv
ia
Serb
ia
Bulg
aria
Denm
ark
Pola
nd
Icela
nd
Est
onia
Bra
zil
Italy
Cze
ch R
epublic
Portugal
Cro
atia
Spain
Sw
eden
France
Slo
vak R
epublic
Perc
enta
ge o
f te
ach
ers
Mean mathematics performance, by school location,
after accounting for socio-economic statusFig II.3.355
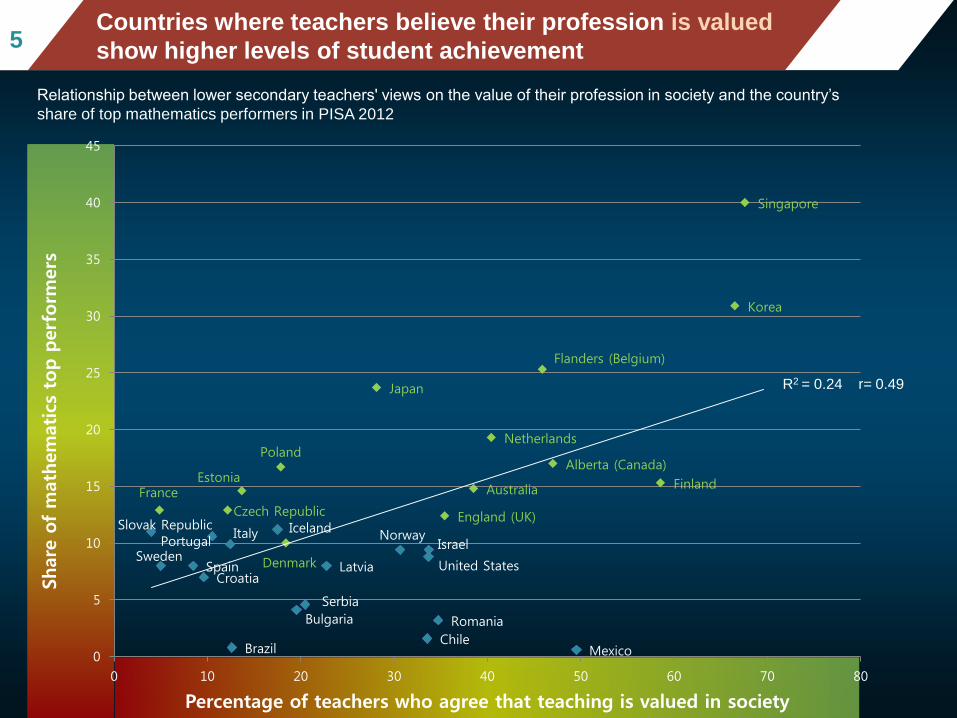
Countries where teachers believe their profession is valued
show higher levels of student achievement
Relationship between lower secondary teachers' views on the value of their profession in society and the country’s
share of top mathematics performers in PISA 2012
Australia
Brazil
Bulgaria
Chile
Croatia
Czech Republic
Denmark
EstoniaFinland
France
IcelandIsrael
Italy
Japan
Korea
Latvia
Mexico
Netherlands
Norway
Poland
Portugal
Romania
Serbia
Singapore
Slovak Republic
SpainSweden
Alberta (Canada)
England (UK)
Flanders (Belgium)
United States
0
5
10
15
20
25
30
35
40
45
0 10 20 30 40 50 60 70 80
Share
of
math
em
atics
top p
erf
orm
ers
Percentage of teachers who agree that teaching is valued in society
R2 = 0.24 r= 0.49
Mean mathematics performance, by school location,
after accounting for socio-economic statusFig II.3.366
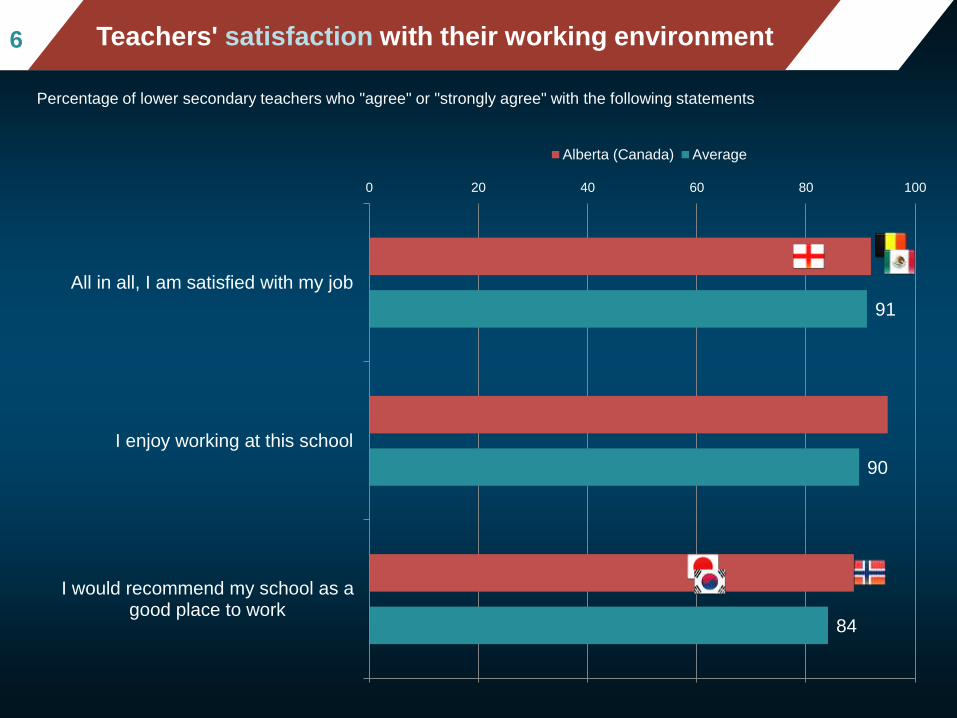
Percentage of lower secondary teachers who "agree" or "strongly agree" with the following statements
84
90
91
0 20 40 60 80 100
I would recommend my school as agood place to work
I enjoy working at this school
All in all, I am satisfied with my job
Alberta (Canada) Average
Teachers' satisfaction with their working environment
Mean mathematics performance, by school location, after acc
ounting for socio-economic statusFig II.3.388
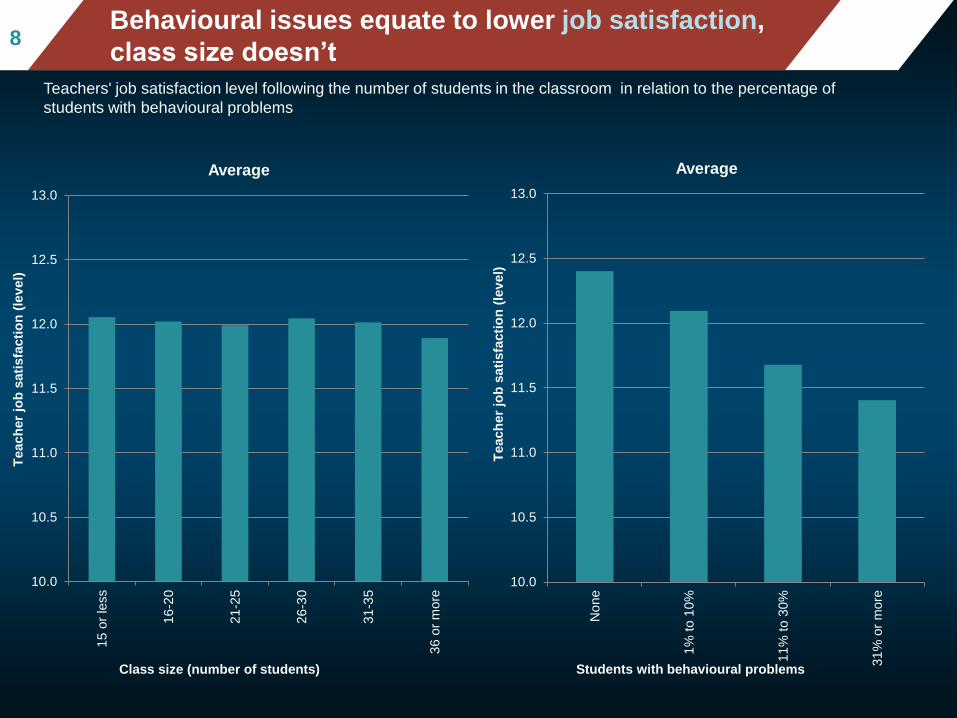
Behavioural issues equate to lower job satisfaction,
class size doesn’t
Teachers' job satisfaction level following the number of students in the classroom in relation to the percentage of
students with behavioural problems
10.0
10.5
11.0
11.5
12.0
12.5
13.0
15
or
less
16
-20
21
-25
26
-30
31
-35
36
or
more
Teach
er
job
sati
sfa
cti
on
(le
vel)
Class size (number of students)
Average
10.0
10.5
11.0
11.5
12.0
12.5
13.0
No
ne
1%
to 1
0%
11
% to 3
0%
31
% o
r m
ore
Teach
er
job
sati
sfa
cti
on
(le
vel)
Students with behavioural problems
Average
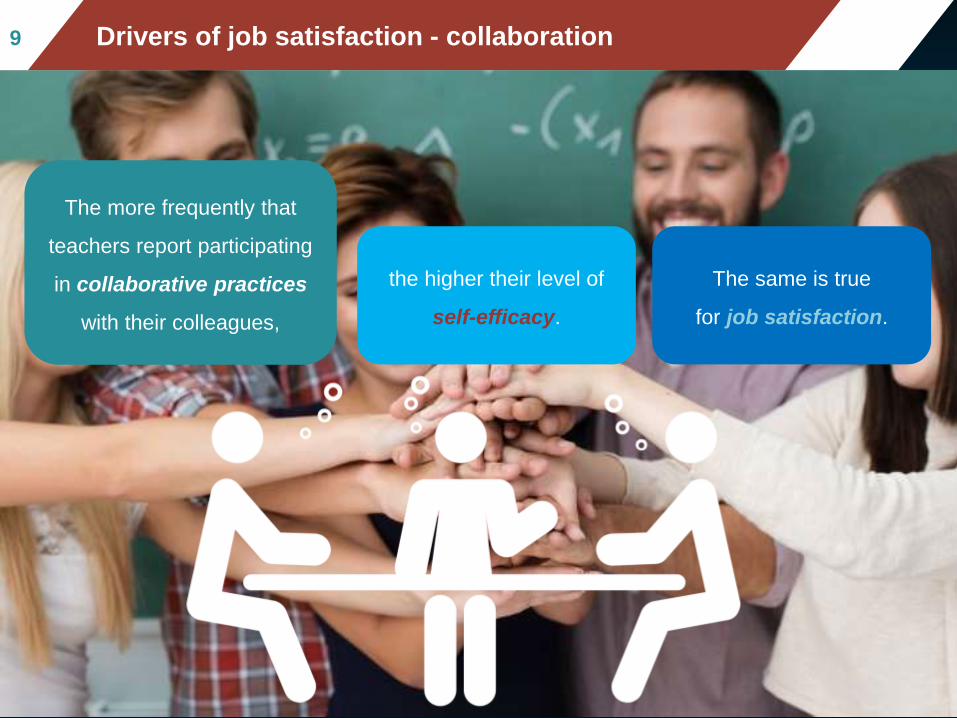
The more frequently that
teachers report participating
in collaborative practices
with their colleagues,
the higher their level of
self-efficacy.
The same is true
for job satisfaction.
Mean mathematics performance, by school location, after acc
ounting for socio-economic statusFig II.3.399 Drivers of job satisfaction - collaboration
Mean mathematics performance, by school location,
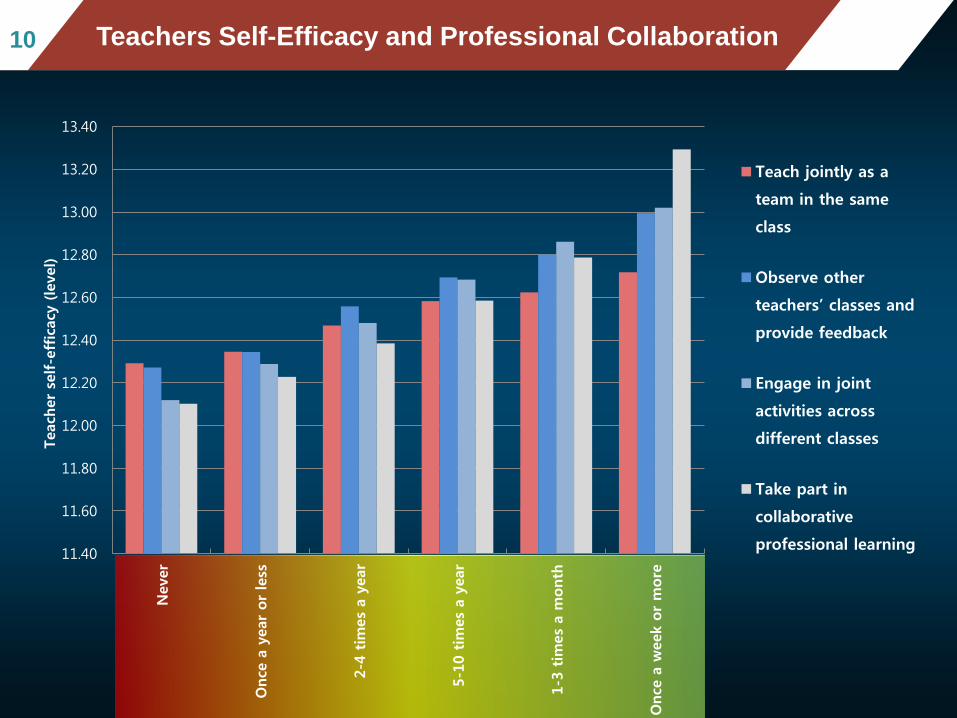
after accounting for socio-economic statusFig II.3.31010 Teachers Self-Efficacy and Professional Collaboration
11.40
11.60
11.80
12.00
12.20
12.40
12.60
12.80
13.00
13.20
13.40
Never
Once
a y
ear
or
less
2-4
tim
es
a y
ear
5-1
0 t
imes
a y
ear
1-3
tim
es
a m
onth
Once
a w
eek o
r m
ore
Teach
er
self-e
ffic
acy
(le
vel)
Teach jointly as a
team in the same
class
Observe other
teachers’ classes and
provide feedback
Engage in joint
activities across
different classes
Take part in
collaborative
professional learning
0
10
20
30
40
50
60
70
80
90
100D
iscu
ss indiv
idual
students
Share
reso
urc
es
Team
confe
rence
s
Colla
bora
te for co
mm
on
standard
s
Team
teach
ing
Colla
bora
tive
PD
Join
t act
ivitie
s
Cla
ssro
om
obse
rvations
Perc
enta
ge o
f te
ach
ers
Average Alberta (Canada)
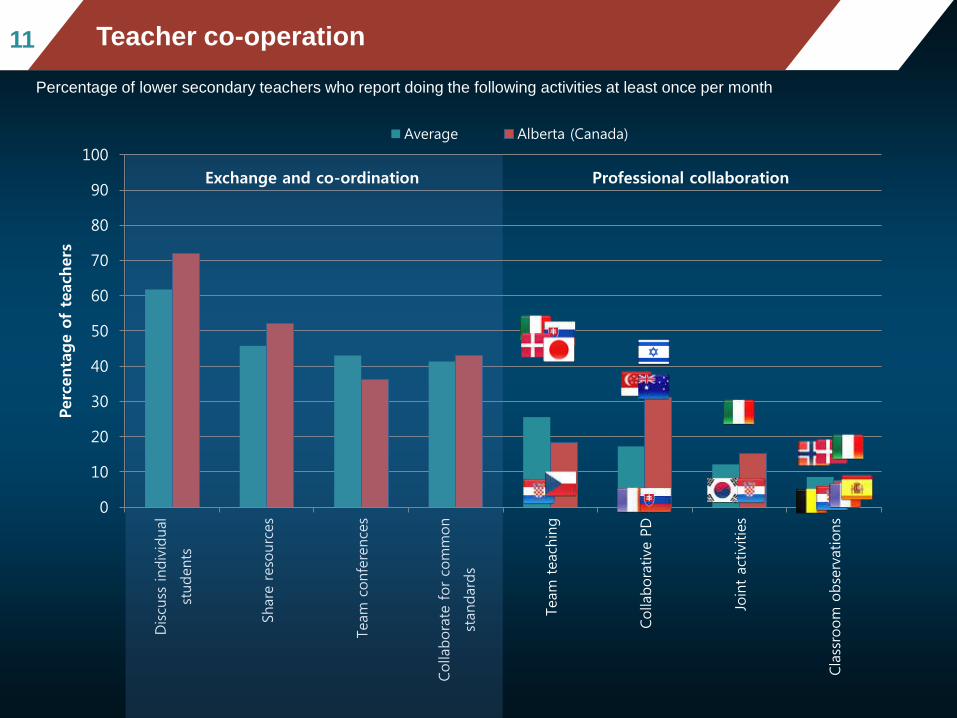
Professional collaboration
Percentage of lower secondary teachers who report doing the following activities at least once per month
Teacher co-operation11
Exchange and co-ordination
Professional Personal Pedagogical
Percentage of lower secondary teachers who report a "moderate" or "large" positive change in the following
issues after they received feedback on their work
0
10
20
30
40
50
60
70
80
90
100
Co
nfiden
ce
as a
teache
r
Mo
tivation
Job s
atisfa
ction
Know
led
ge a
nd u
nd
ers
tand
ing
of
main
subje
ct field
(s)
Tea
ch
ing
pra
ctice
s
Stu
de
nt a
ssessm
ents
to im
pro
ve s
tud
ent
learn
ing
Cla
ssro
om
mana
gem
en
t pra
ctice
s
Me
tho
ds for
teachin
g s
tuden
ts w
ith
specia
lne
eds
Public
recog
nitio
n
Job r
esp
onsib
ilities
Ro
le in s
cho
ol develo
pm
ent
initia
tive
s
Am
ou
nt o
f pro
fessio
na
l d
evelo
pm
ent
Lik
elih
ood o
f care
er
advancem
ent
Sala
ry a
nd/o
r fin
ancia
l bon
us
Average Alberta (Canada)
Mean mathematics performance, by school location,
after accounting for socio-economic statusFig II.3.31212 Feedback and change in behavior
Mean mathematics performance, by school location, after acc
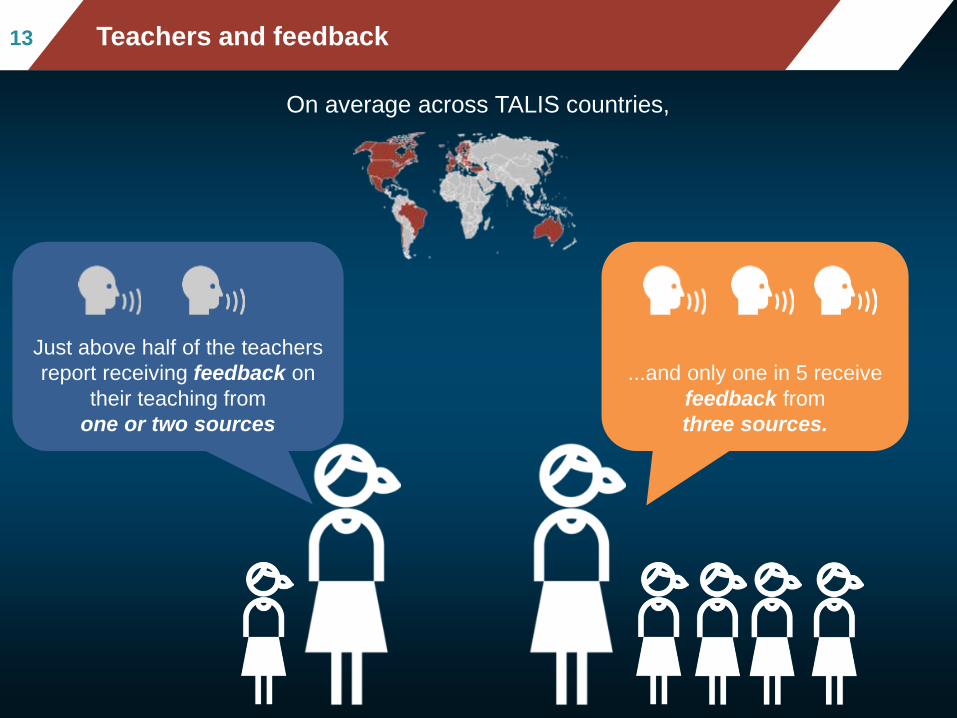
ounting for socio-economic statusFig II.3.31313 Teachers and feedback
On average across TALIS countries,
...and only one in 5 receive
feedback from
three sources.
Just above half of the teachers
report receiving feedback on
their teaching from
one or two sources

Mean mathematics performance, by school location,
after accounting for socio-economic statusFig II.3.31414
Teachers feedback :
direct classroom observations
0
10
20
30
40
50
60
70
80
90
100
Bulg
aria
Pola
nd
Un
ite
d S
tate
s
Ro
man
ia
Alb
ert
a (
Can
ada
)
Cro
atia
Czech R
epu
blic
Abu D
hab
i (U
AE
)
Fla
nde
rs (
Belg
ium
)
Serb
ia
Slo
vak R
epub
lic
Japa
n
Isra
el
Ave
rage
Sin
gapo
re
La
tvia
Bra
zil
Me
xic
o
Ma
laysia
Sw
ede
n
Esto
nia
Engla
nd
(U
K)
No
rwa
y
Fin
land
Port
ug
al
De
nm
ark
Kore
a
Ch
ile
Ita
ly
Ne
therl
and
s
Fra
nce
Spain
Icela
nd
Austr
alia
Perc
en
tag
e o
f te
ach
ers
Principals School Management Other teachers
Mean mathematics performance, by school location,
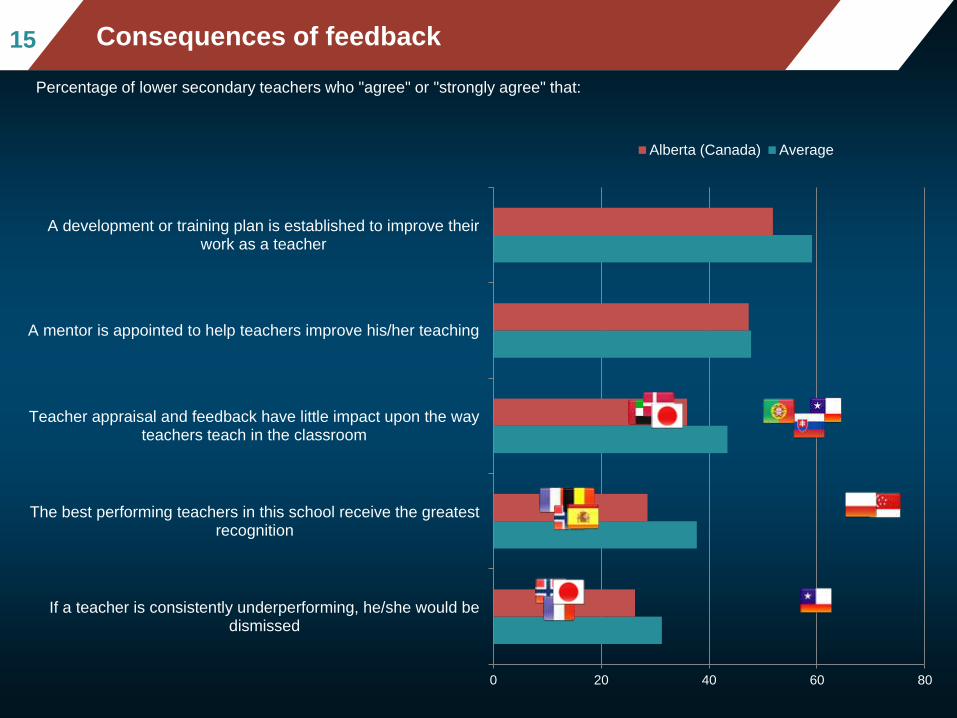
after accounting for socio-economic statusFig II.3.31515 Consequences of feedback
Percentage of lower secondary teachers who "agree" or "strongly agree" that:
0 20 40 60 80
If a teacher is consistently underperforming, he/she would bedismissed
The best performing teachers in this school receive the greatestrecognition
Teacher appraisal and feedback have little impact upon the wayteachers teach in the classroom
A mentor is appointed to help teachers improve his/her teaching
A development or training plan is established to improve theirwork as a teacher
Alberta (Canada) Average
Mean mathematics performance, by school location,
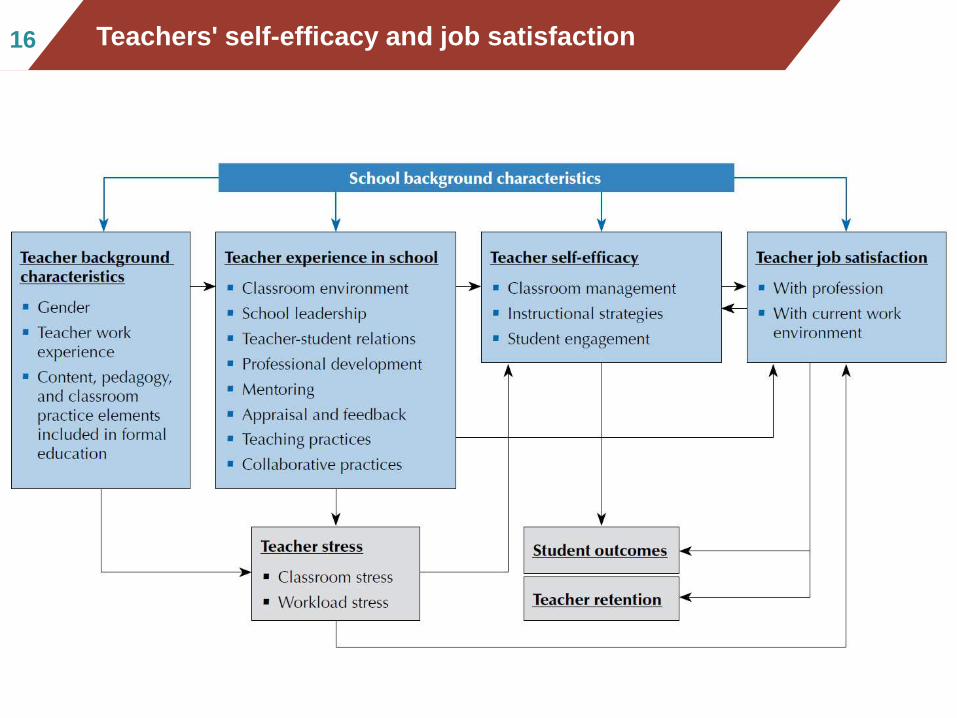
after accounting for socio-economic statusFig II.3.31616 Teachers' self-efficacy and job satisfaction

Developing and promoting
effective leadership among principals, teachers,
and administrators

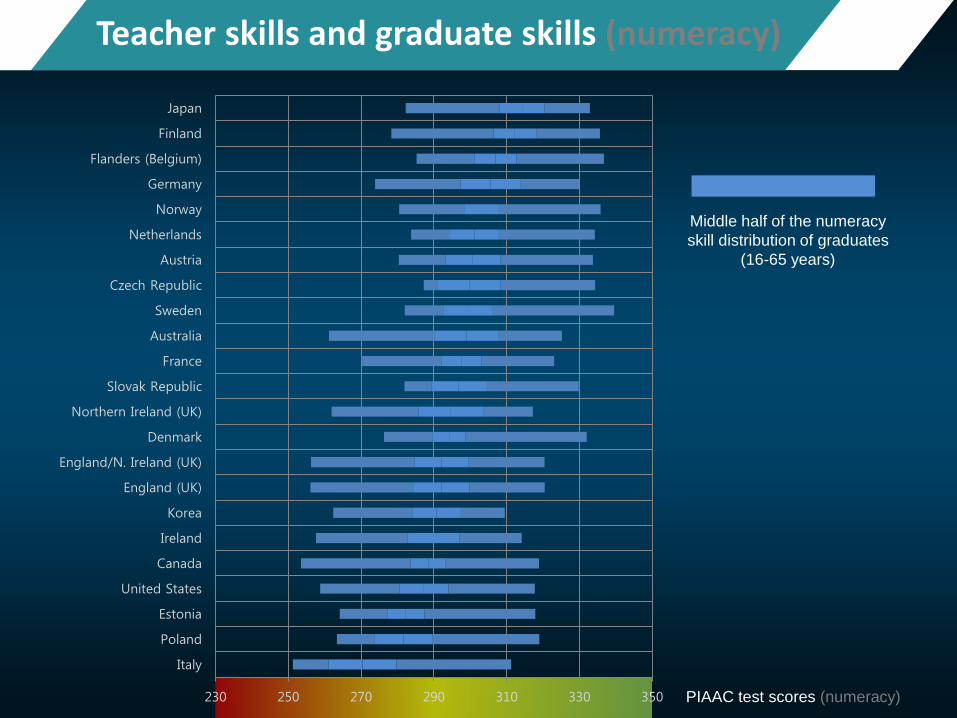
Teacher skills and graduate skills (numeracy)
230 250 270 290 310 330 350
Italy
Poland
Estonia
United States
Canada
Ireland
Korea
England (UK)
England/N. Ireland (UK)
Denmark
Northern Ireland (UK)
Slovak Republic
France
Australia
Sweden
Czech Republic
Austria
Netherlands
Norway
Germany
Flanders (Belgium)
Finland
Japan
Middle half of the numeracy
skill distribution of graduates
(16-65 years)
PIAAC test scores (numeracy)
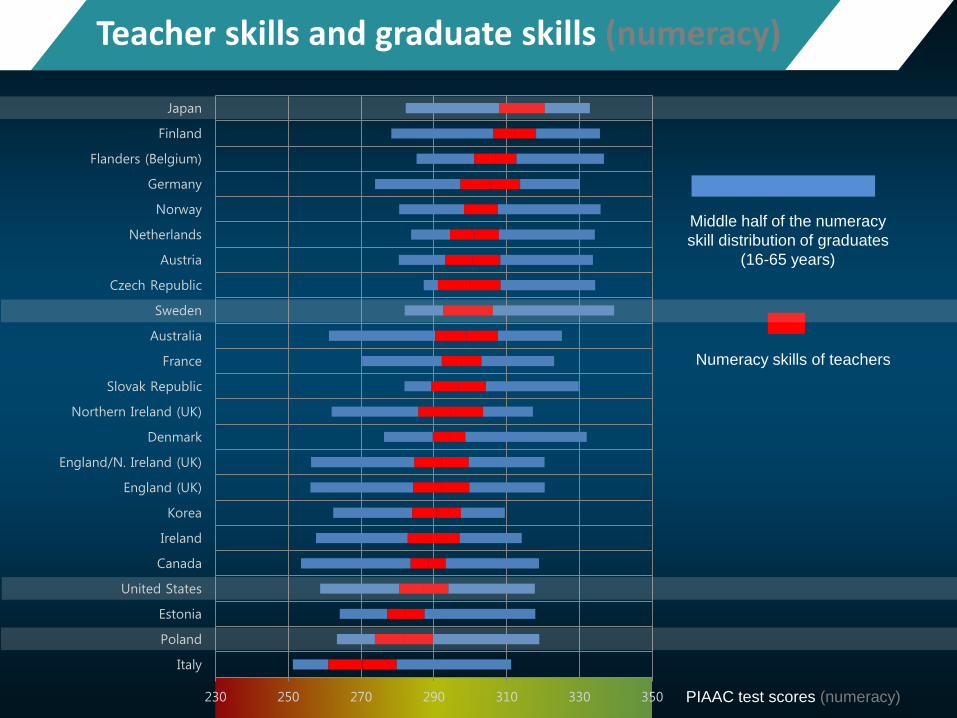
Teacher skills and graduate skills (numeracy)
230 250 270 290 310 330 350
Italy
Poland
Estonia
United States
Canada
Ireland
Korea
England (UK)
England/N. Ireland (UK)
Denmark
Northern Ireland (UK)
Slovak Republic
France
Australia
Sweden
Czech Republic
Austria
Netherlands
Norway
Germany
Flanders (Belgium)
Finland
Japan
Middle half of the numeracy
skill distribution of graduates
(16-65 years)
Numeracy skills of teachers
PIAAC test scores (numeracy)
41%
22%
15%
11%
7%4%
39%
23%
21%
12%
4%1%
Alberta (Canada)
Admin/leadership
Curriculum/teaching
Students
Parents/guardians
Community
Other
Average proportion of time lower secondary principals report spending on the following activities throughout the school year
Principals’ working time21
Average

Mean mathematics performance, by school location,
after accounting for socio-economic statusFig II.3.32222 Principals’ Leadership
0%
10%
20%
30%
40%
50%
60%
70%
80%
90%
100%
Take action to
ensure that
teachers feel
responsible for
their students'
learning
outcomes
Take action to
ensure that
teachers take
responsibility for
improving their
teaching skills
Collaborate with
teachers to solve
classroom
discipline
problems
Provide parents
or guardians
with information
on the school
and student
performance
Take action to
support co-
operation
among teachers
to develop new
teaching
practices
Collaborate with
principals from
other schools
Check for
mistakes and
errors in school
administrative
procedures and
reports
Observe
instruction in the
classroom
Resolve
problems with
the lesson
timetable in the
school
Never or rarely
Sometimes
Often
Very often
Mean mathematics performance, by school location,
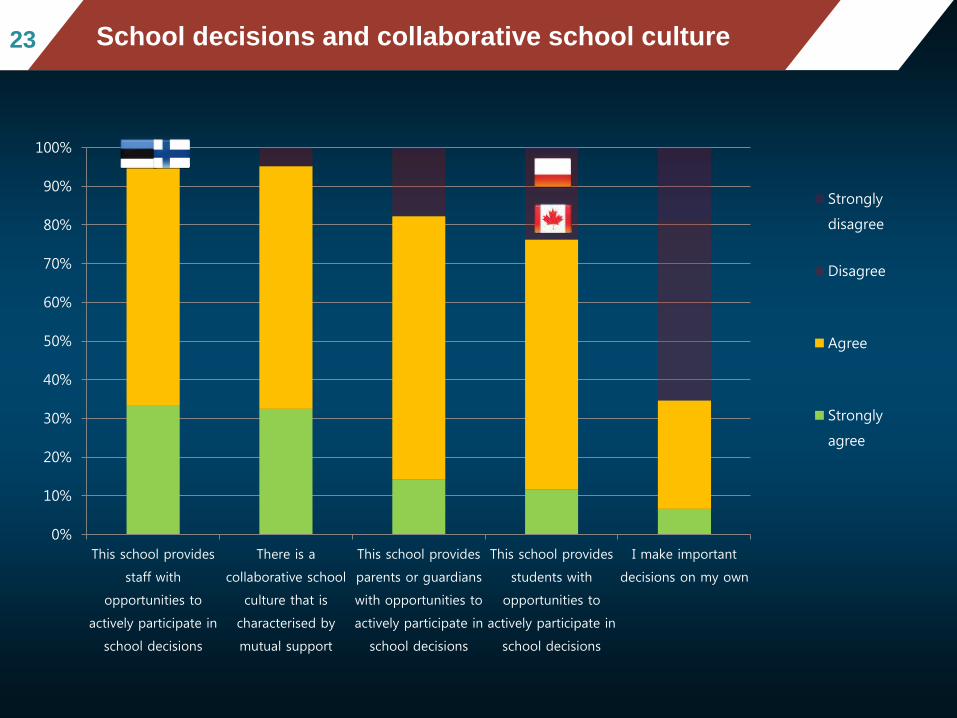
after accounting for socio-economic statusFig II.3.32323 School decisions and collaborative school culture
0%
10%
20%
30%
40%
50%
60%
70%
80%
90%
100%
This school provides
staff with
opportunities to
actively participate in
school decisions
There is a
collaborative school
culture that is
characterised by
mutual support
This school provides
parents or guardians
with opportunities to
actively participate in
school decisions
This school provides
students with
opportunities to
actively participate in
school decisions
I make important
decisions on my own
Strongly
disagree
Disagree
Agree
Strongly
agree
Mean mathematics performance, by school location,
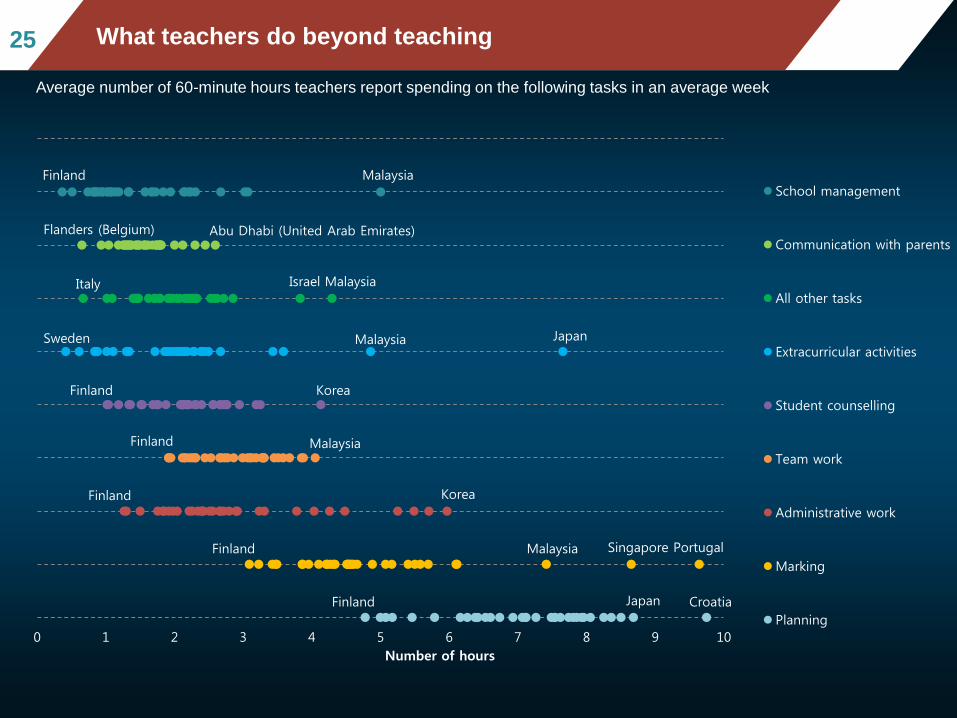
after accounting for socio-economic statusFig II.3.32525 What teachers do beyond teaching
Average number of 60-minute hours teachers report spending on the following tasks in an average week
Finland Malaysia
Abu Dhabi (United Arab Emirates)Flanders (Belgium)
IsraelItaly Malaysia
JapanMalaysiaSweden
Finland Korea
Finland Malaysia
Finland Korea
Finland Malaysia PortugalSingapore
CroatiaFinland Japan
0 1 2 3 4 5 6 7 8 9 10
Number of hours
School management
Communication with parents
All other tasks
Extracurricular activities
Student counselling
Team work
Administrative work
Marking
Planning
Mean mathematics performance, by school location, after acc
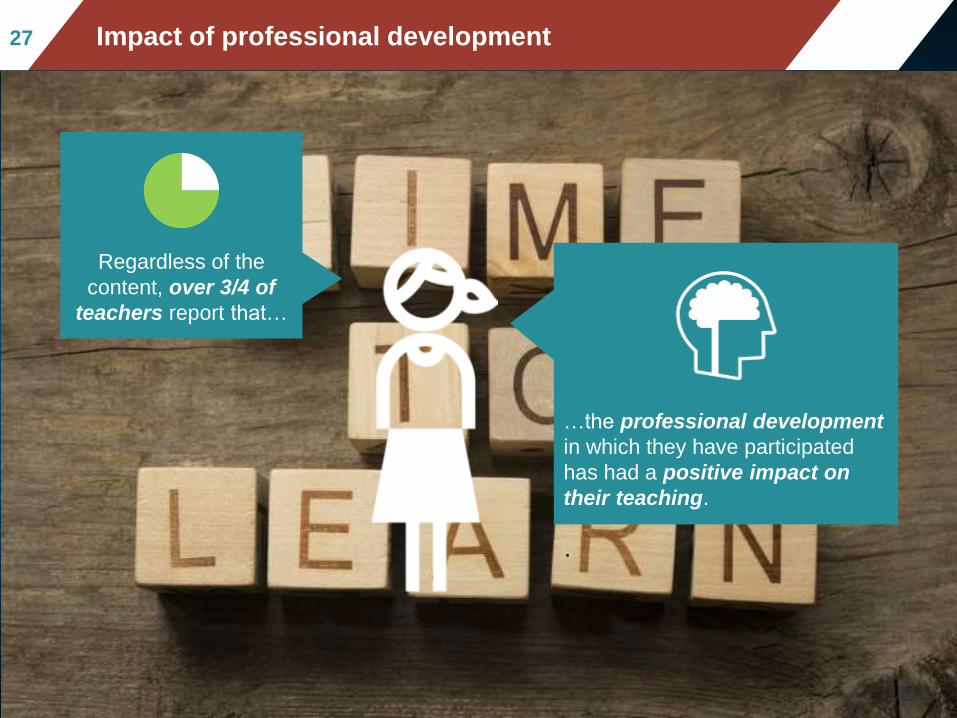
ounting for socio-economic statusFig II.3.32727 Impact of professional development
…the professional development
in which they have participated
has had a positive impact on
their teaching.
·
Regardless of the
content, over 3/4 of
teachers report that…
Mean mathematics performance, by school location, after acc
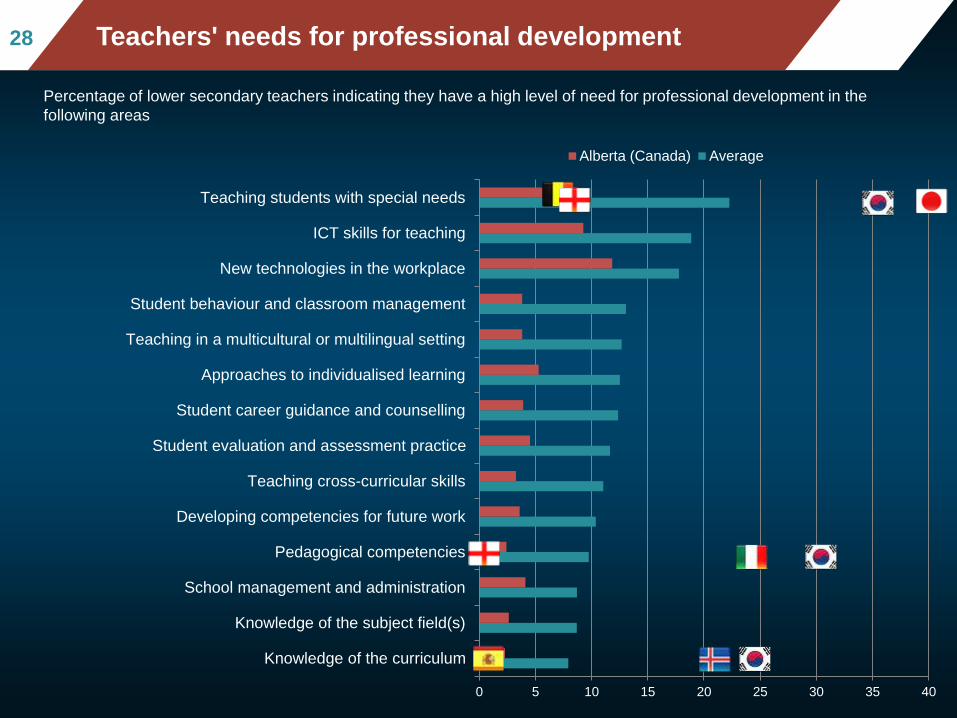
ounting for socio-economic statusFig II.3.32828 Teachers' needs for professional development
Percentage of lower secondary teachers indicating they have a high level of need for professional development in the
following areas
0 5 10 15 20 25 30 35 40
Knowledge of the curriculum
Knowledge of the subject field(s)
School management and administration
Pedagogical competencies
Developing competencies for future work
Teaching cross-curricular skills
Student evaluation and assessment practice
Student career guidance and counselling
Approaches to individualised learning
Teaching in a multicultural or multilingual setting
Student behaviour and classroom management
New technologies in the workplace
ICT skills for teaching
Teaching students with special needs
Alberta (Canada) Average
Australia
Brazil
Chile
Estonia
Spain
France
Iceland
Israel
Italy
Japan
Korea
Bulgaria
Malaysia
Mexico
NetherlandsNorway
Poland
Portugal
RomaniaSerbia
Singapore
Slovak Republic
Latvia
United States
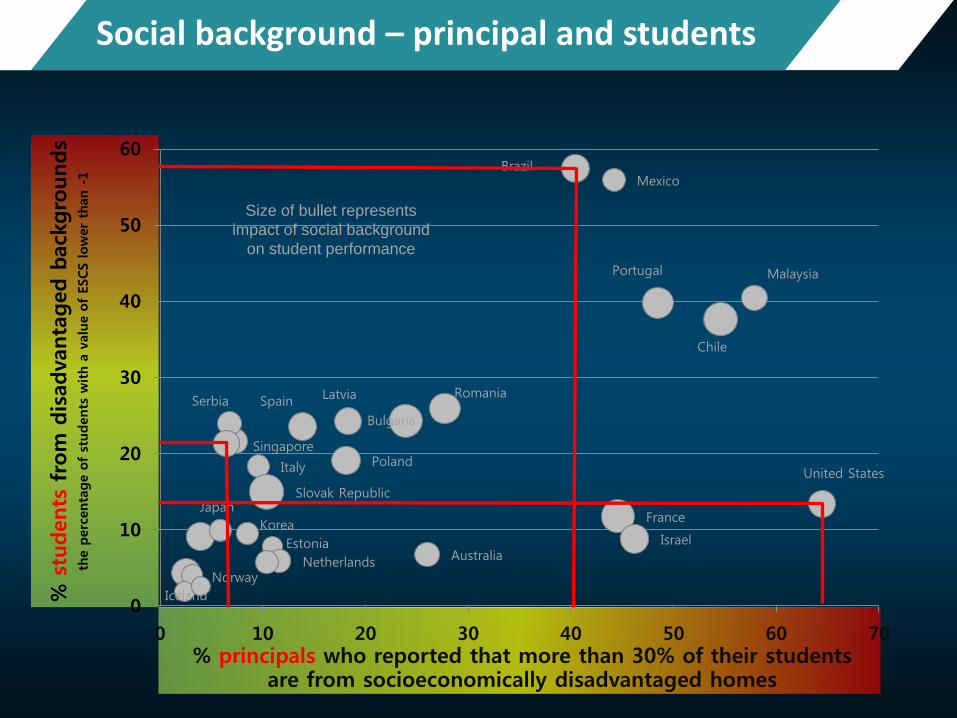
0
10
20
30
40
50
60
0 10 20 30 40 50 60 70
% s
tudents
from
dis
advanta
ged b
ack
gro
unds
the p
erc
enta
ge o
f st
udents
with a
valu
e o
f ESCS low
er
than -
1
% principals who reported that more than 30% of their studentsare from socioeconomically disadvantaged homes
Social background – principal and students
Size of bullet represents
impact of social background
on student performance
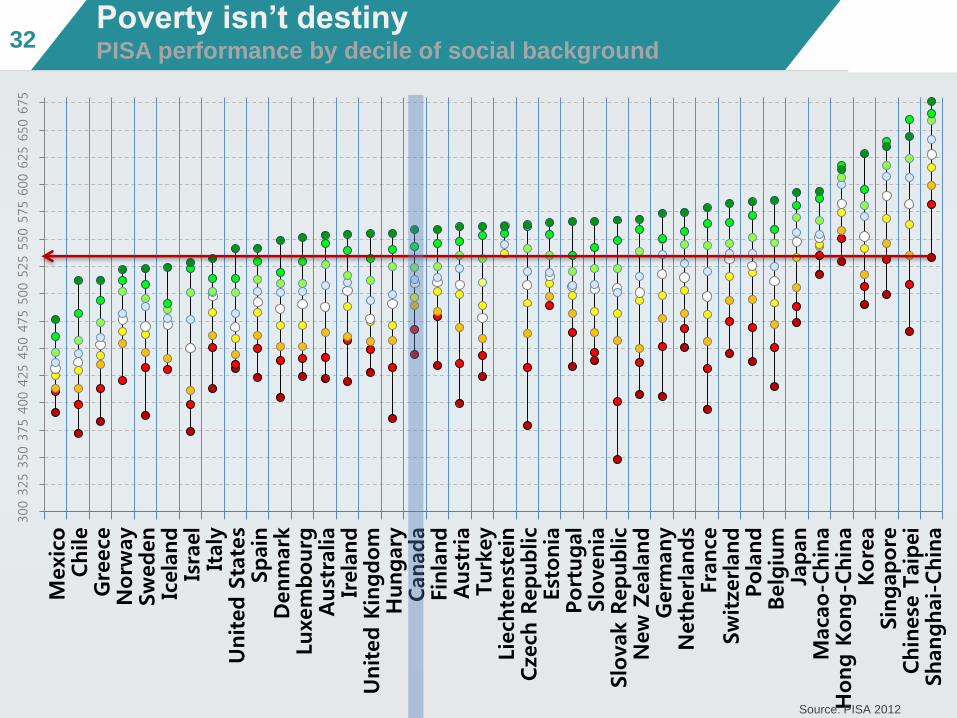
3232Poverty isn’t destinyPISA performance by decile of social background
300
325
350
375
400
425
450
475
500
525
550
575
600
625
650
675
Mexic
oChile
Gre
ece
Norw
ay
Sw
eden
Icela
nd
Isra
el
Italy
United S
tate
sSpain
Denm
ark
Luxem
bourg
Aust
ralia
Irela
nd
United K
ingdom
Hungary
Canada
Fin
land
Aust
ria
Turk
ey
Lie
chte
nst
ein
Cze
ch R
epublic
Est
onia
Port
ugal
Slo
venia
Slo
vak R
epublic
New
Zeala
nd
Germ
any
Neth
erlands
Fra
nce
Sw
itze
rland
Pola
nd
Belg
ium
Japan
Maca
o-C
hin
aH
ong K
ong-C
hin
aKore
aSin
gapore
Chin
ese
Taip
ei
Shanghai-Chin
a
Source: PISA 2012

Encouraging innovation in the 21st-century
classroom
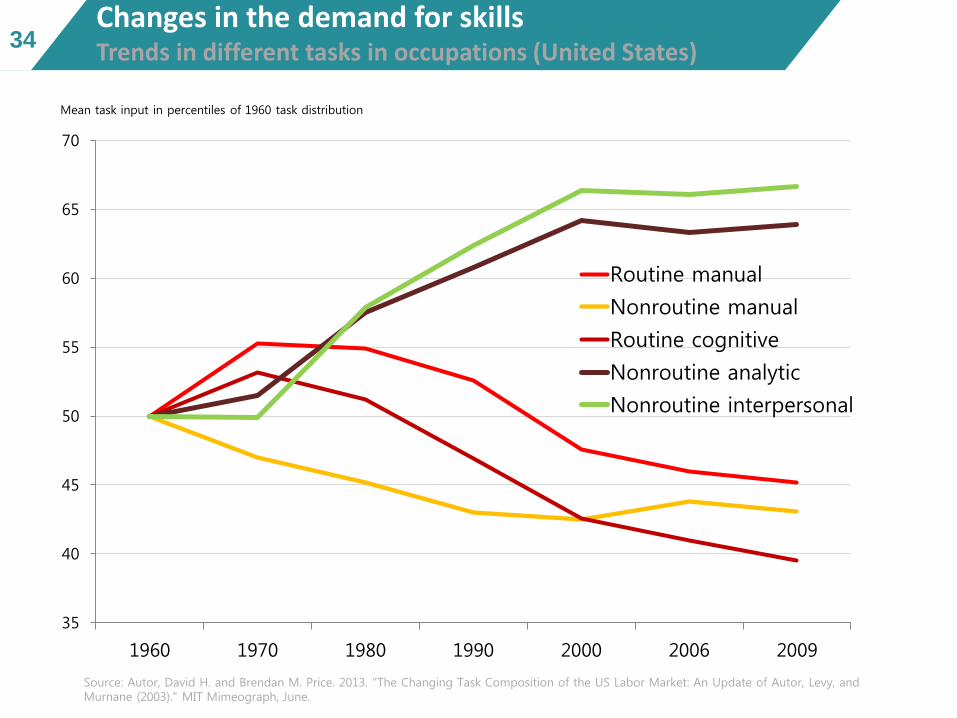
34Changes in the demand for skillsTrends in different tasks in occupations (United States)
35
40
45
50
55
60
65
70
1960 1970 1980 1990 2000 2006 2009
Routine manual
Nonroutine manual
Routine cognitive
Nonroutine analytic
Nonroutine interpersonal
Mean task input in percentiles of 1960 task distribution
Source: Autor, David H. and Brendan M. Price. 2013. "The Changing Task Composition of the US Labor Market: An Update of Autor, Levy, and Murnane (2003)." MIT Mimeograph, June.

Mean mathematics performance, by school location,
after accounting for socio-economic statusFig II.3.33535 Most teachers value 21st century pedagogies…
Percentage of lower secondary teachers who "agree" or "strongly agree" that:
0 10 20 30 40 50 60 70 80 90 100
Students learn best by finding solutions to problems on theirown
Thinking and reasoning processes are more important thanspecific curriculum content
Students should be allowed to think of solutions to practicalproblems themselves before the teacher shows them how they
are solved
My role as a teacher is to facilitate students' own inquiry
Alberta (Canada) Average
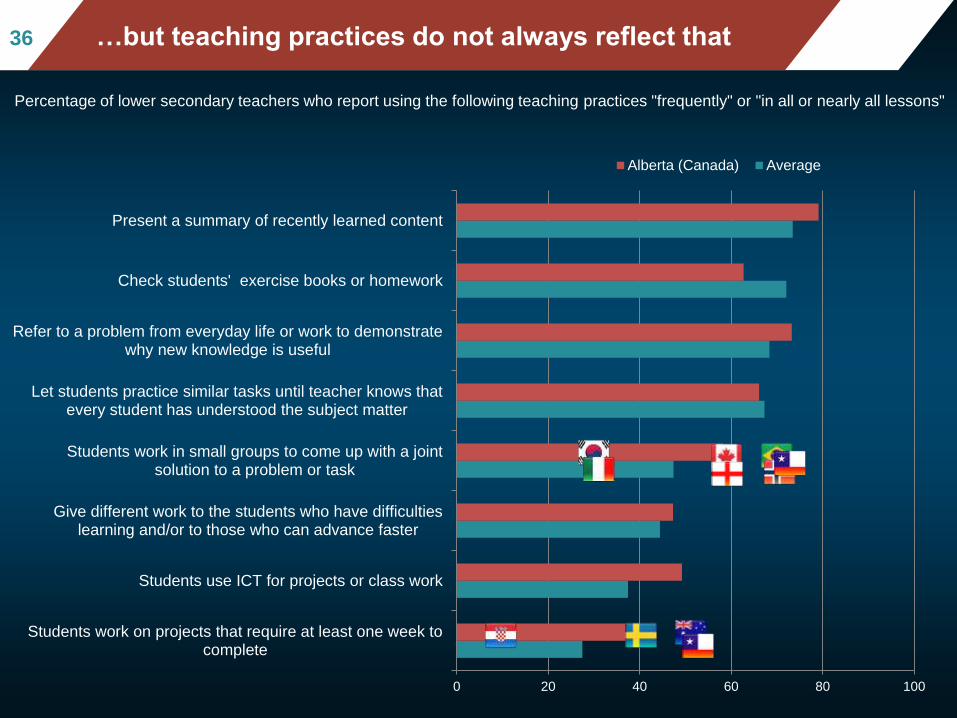
0 20 40 60 80 100
Students work on projects that require at least one week tocomplete
Students use ICT for projects or class work
Give different work to the students who have difficultieslearning and/or to those who can advance faster
Students work in small groups to come up with a jointsolution to a problem or task
Let students practice similar tasks until teacher knows thatevery student has understood the subject matter
Refer to a problem from everyday life or work to demonstratewhy new knowledge is useful
Check students' exercise books or homework
Present a summary of recently learned content
Alberta (Canada) Average
Mean mathematics performance, by school location, after acc
ounting for socio-economic statusFig II.3.33636 …but teaching practices do not always reflect that
Percentage of lower secondary teachers who report using the following teaching practices "frequently" or "in all or nearly all lessons"
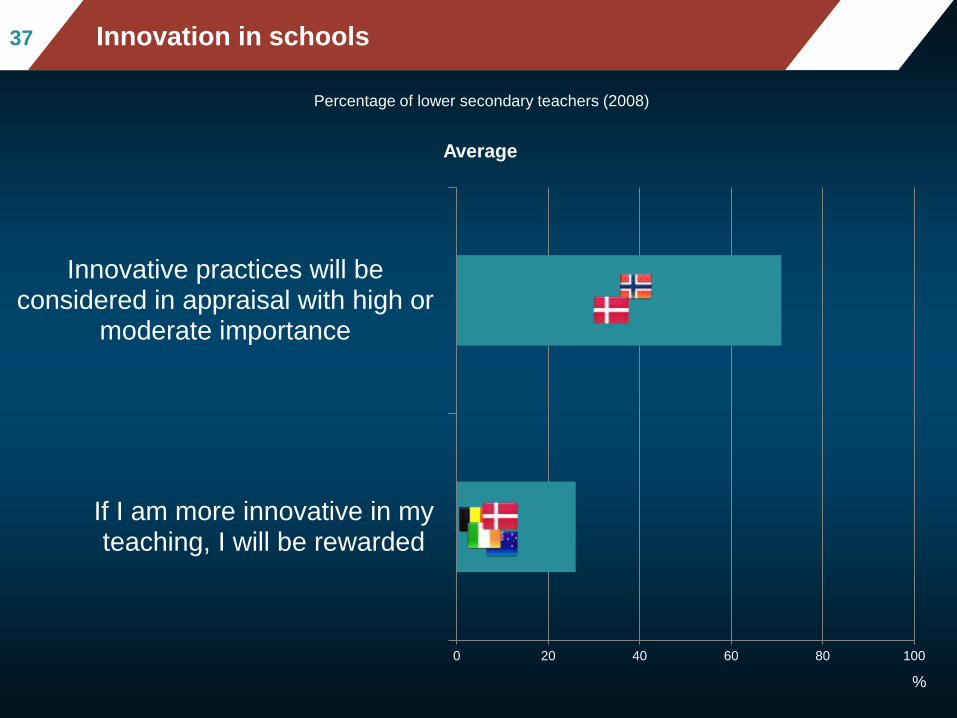
0 20 40 60 80 100
If I am more innovative in myteaching, I will be rewarded
Innovative practices will beconsidered in appraisal with high or
moderate importance
Average
Mean mathematics performance, by school location, after acc
ounting for socio-economic statusFig II.3.33737 Innovation in schools
Percentage of lower secondary teachers (2008)
%

38 Innovating to create 21st-century learning environments
Four
dimensions
Regrouping
educators
Regrouping
learners
Rescheduling
learning
Widening
pedagogic
repertoires
• To gain the benefits of collaborative planning, work, and shared professional development strategies
• To open up pedagogical options • To give extra attention to groups of
learners • To give learners a sense of belonging
& engagement• To mix students of different ages• To mix different abilities and strengths• To widen pedagogical options,
including peer teaching• To allow for deeper learning• To create flexibility for more
individual choices• To accelerate learning• To use out-of-school learning in
effective & innovative ways
• Inquiry, authentic learning, collaboration, and formative assessment
• A prominent place for student voice & agency
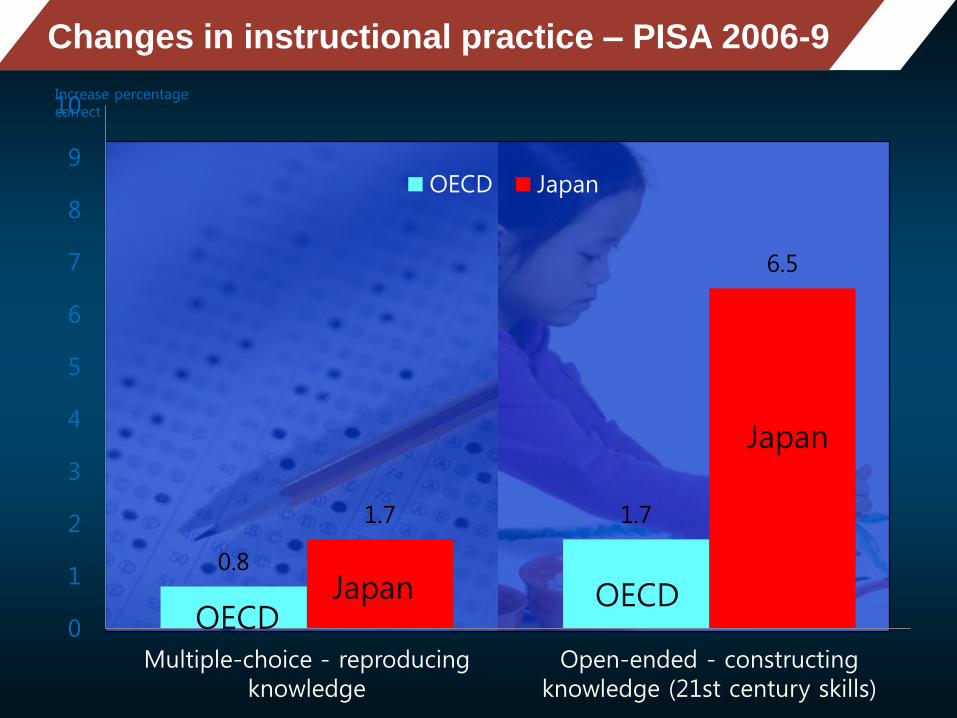
Increase percentage correct
0.8
1.71.7
6.5
0
1
2
3
4
5
6
7
8
9
10
Multiple-choice - reproducing knowledge
Open-ended - constructing knowledge (21st century skills)
OECD Japan
OECDOECDJapan
Japan
43 Changes in instructional practice – PISA 2006-9
44
44 Thank you
Find out more about our work at www.oecd.org
– All publications
– The complete micro-level database
Email: [email protected]
Twitter: SchleicherEDU
and remember:
Without data, you are just another person with an opinion