Embed Size (px)
Citation preview

Made by: Mahendar Kumar(Papu)
Siam University, MBA Department, Bangkok
Independent Study Guide

What is Research? Research is a systematic inquiry that investigates hypotheses,
suggests new interpretations of data or texts, and poses new questions for future research to explore.
Research is the way to find the answer of the problem that is at hand through systematic procedure.
Research consists of:
Asking a question that nobody has asked before.
Doing the necessary work to find the answer.
Communicating the knowledge you have acquired to a larger audience.

Research Problem Research problem is usually a question that nobody has
answered before or a knowledge gap that is not filled by any other researcher before.
Example:
Why the internet server breaks down in Siam university every year in July?
Research Title:
Breaking down of internet server in Siam university every year in July
This research problem will be used throughout this guide

Research Variables There are two basic variables used in every research in order to
Carry out the research and find the answer of the research problem
Or fill the knowledge gap.
1. Independent Variable
2. Dependent Variable
Independent Variable:
Independent variable as the name suggests is not dependent
Therefore it is used in the research in order to find its effect on
the dependent variable.

Example: Independent Variable Continue with the same problem. Problem of breaking down of internet server in Siam
university in July every year? Now we need to find variables that can be used to analyze,
research upon in order to find the solution of this research problem. Independent variables have direct or indirect connection with the research problem.
Independent Variables could be: Increased number of internet users Registration time period Excessive use of BYOD(Bring your own device) BYOD= Laptop, Mobile, Ipad etc

Dependent Variable Dependent variable is actually a research problem or a
research question that is used to do the research.
Example:
Problem of breaking down of internet server in Siam university in July every year is the dependent variable because its dependent on the independent variables.
Dependent variable is fixed in nature in contrast with the independent variable because changes in the independent variable causes direct or indirect effect on the dependent variable.

Conceptual Framework
Registration Time Period Independent Variable 2
Excessive use of BYOD Independent Variable 3
Breaking down of internet server of Siam university in July every year-
Dependent Variable
Increased number of internet users
Independent Variable 1

Hypothesis Quantitative research mostly reply upon two kinds of hypothesis.
1. Null Hypothesis- No Relationship Hypothesis
2. Alternate Hypothesis- Relationship Hypothesis
Example:
H0( Null)= There is no relationship between excessive internet users
And breaking down of internet server in July every year in
Siam university.
H1(Alternate)= There is a relationship between excessive internet
Users and breaking down of internet server in July every year in
Siam University.
Note: This last example needs six hypothesis two for each
independent variable.

Chapter 1: Independent Study 1. Introduction
2. Statement of Research Problem
3. Significance of the problem
4. Independent Variables
5. Hypothesis
6. Scope of the problem
7. Objectives of the study
8. Limitations of the study
9. Important terms

Chapter 2: Independent Study
Background of the study
Literature Review:
Dependent Variable explanation
Contribution of independent variable 1 in dependent variable
Contribution of independent variable 2 in dependent variable
Contribution of independent variable 3 in dependent variable
Conceptual Framework
Example:
Dependent Variable- Breaking down of internet server in Siam
university in July every year explanation.
Independent Variable- Contribution of increased number of users in
breaking down of internet server in Siam university in July every
year.

Chapter 3: Research Methodology Research methodology is a systematic way to solve a
problem. It is a science of studying how research is to be carried out. Essentially, the procedures by which researchers go about their work of describing, explaining and predicting
phenomena are called research methodology.
It is also defined as the study of methods by which knowledge is gained. Its aim is to give the work plan of research.
Example: Research Methodology is the research design how to start and end the research by following certain principles and rules.

Type of Research
1. Quantitative Research
2. Qualitative Research
Quantitative Research:
Quantitative research is described by the terms ‘empiricism’ (Leach, 1990) and ‘positivism’ (Duffy, 1985). It derives from the
scientific method used in the physical sciences (Cormack, 1991).
This research approach is an objective, formal systematic process
in which numerical data findings. It describes, tests, and examines
cause and effect relationships (Burns & Grove, 1987), using a
deductive process of knowledge attainment (Duffy, 1985).
Quantitative research is mostly called hypothesis testing research by
quantitative analysis method ( e.g. correlation and regression analysis)

Qualitative Research Qualitative research is the research that involves deep
understanding of an phenomena at hand. Qualitative research is aimed
At gaining a deep understanding of a specific organization or event,
Rather a than surface description of a large sample of a population. It
aims to provide an explicit rendering of the structure, order, and broad
Patterns found among a group of participants. It is also called
ethnomethodology or field research. The strength of qualitative
research is its ability to provide complex textual descriptions of how
people experience a given research issue. If generally speaking
qualitative research generate findings or gives the results in an abstract
way rather than numerical foam.

Research Design: Example

Sampling Design Sampling is the process by which inference is made to the
whole by examining a part. The purpose of sampling is to provide various types of statistical information of a qualitative or quantitative nature about the whole by examining a few selected units. The sampling method is the scientific procedure of selecting those sampling units which would provide the required estimates with associated margins of uncertainty, arising from examining only a part and not the whole.
Two Sampling Types
1. Probabilistic Sampling
2. Non- Probabilistic Sampling

Probabilistic Sampling

Non- Probabilistic Sampling

Sampling Procedure

Data Collection Tool There are several data collection tools but for the simplicity, only
two are described here.
1. Questionnaires
2. Interviews
Questionnaires:
Questionnaires are used to collect information from the sample size
about the independent and dependent variables by asking them
relevant questions. Self-administered surveys or questionnaires have
Special strengths and weaknesses. They are useful in describing the
characteristics of a large population and make large samples feasible.
In one sense, these surveys are flexible, making it possible to ask
many questions on a given topic(Babbie, 1992).
Note: A survey must pass a reliability test of getting 0.8 otherwise,
survey reliability would be a matter of a question.

Interviews The interviews are best way to collect information where
sample size is not too large and access to interviewee is possible without or minimum interference. The structured interview is an alternative method of collecting survey data. Rather than asking respondents to fill out surveys, interviewers ask questions orally and record respondents’ answers. This type of survey generally decreases the number of do not know and no answer responses, compared with self -administered surveys. Interviewers also provide a guard against confusing items. If a respondent has misunderstood a question, the interviewer can clarify, thereby obtaining relevant responses (Babbie, 1992).
Chapter 4: Data Analysis
Data analysis is a systematic search for meaning. It is a way to process qualitative or quantitative data so that what has been learned can be communicated to others. Analysis means organizing and interrogating data in ways that allow researchers to see patterns, identify themes, discover relationships, develop explanations, make interpretations, mount critiques, or generate theories. It often involves synthesis, evaluation, interpretation, categorization, hypothesizing, comparison, and pattern finding. It always involves what H. F. Wolcott calls “mind work”(Hatch 2002, 148). The difference between qualitative and quantitative data analysis is that the data to be analyzed in qualitative are text, rather than numbers as in Quantitative research.

Data Analysis: Quantitative
Quantitative data analysis is also called statistical analysis
because it analyses numbers that can describe patterns, relationships
and tendencies of different variables. A statistic , in ordinary
language usage, is a numerical description of a population, usually
based on a sample of that population. The statistics used in the
Research mostly are frequency distributions, graphs, measures of
central tendency and variation, and reliability tests.
Other statistics are used primarily to describe the association among
variables and thus, to enhance the causal validity of our conclusions.
Data Analysis Techniques:
1. Pearson Correlation Coefficient
2. Spearman Correlation Coefficient
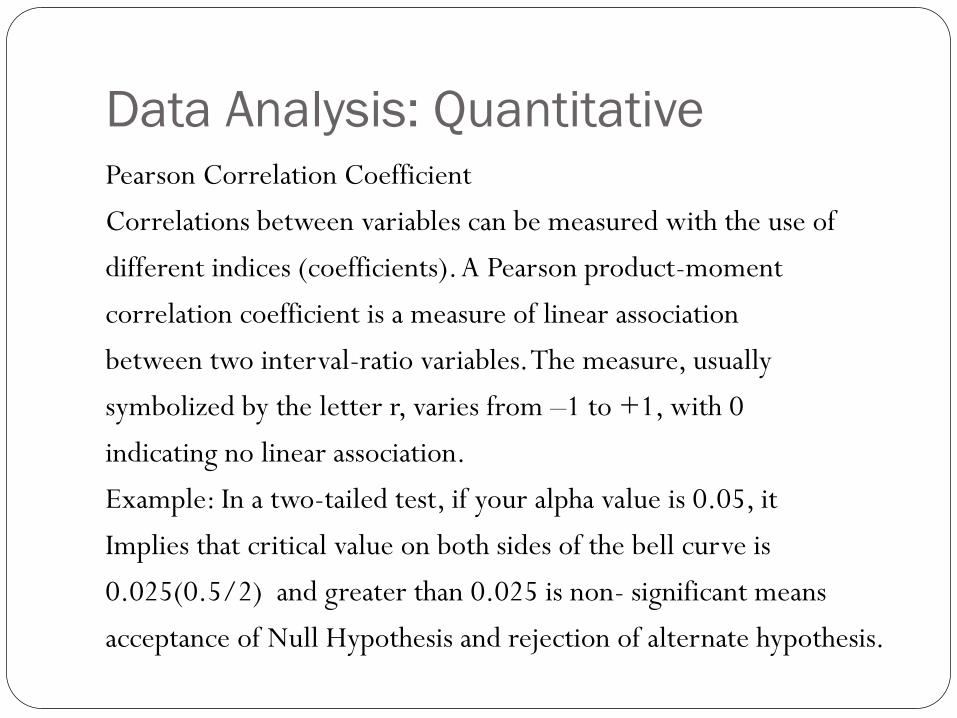
Data Analysis: Quantitative Pearson Correlation Coefficient
Correlations between variables can be measured with the use of
different indices (coefficients). A Pearson product-moment
correlation coefficient is a measure of linear association
between two interval-ratio variables. The measure, usually
symbolized by the letter r, varies from –1 to +1, with 0
indicating no linear association.
Example: In a two-tailed test, if your alpha value is 0.05, it
Implies that critical value on both sides of the bell curve is
0.025(0.5/2) and greater than 0.025 is non- significant means
acceptance of Null Hypothesis and rejection of alternate hypothesis.

Data Analysis: Spearman Correlation
Spearman Rank Correlation Coefficient is a non-parametric measure of correlation, using ranks to calculate the correlation. Spearman Rank Correlation Coefficient uses ranks to calculate correlation.
Whenever we are interested to know if two variables are related to each other, we use a statistical technique known as correlation. If the change in one variable brings about a change in the other variable, they are said to be correlated.
A nonparametric (distribution-free) rank statistic proposed by Spearman in 1904 as a measure of the strength of the associations between two variables (Lehmann and D'Abrera 1998).

Data Analysis: Spearman Correlation
Spearman’s correlation coefficient is a statistical measure of the strength of a monotonic relationship between paired data.
And its interpretation is similar to that of Pearsons, e.g. the closer is to the stronger the monotonic relationship. Correlation is an effect size and so we can verbally describe the strength of the correlation using the following guide for the absolute value of :
.00-.190- Very Week .20-.39- Weak .40-.59- Moderate .60-.79- Strong .80-1.0- Very Strong The calculation of Spearman’s correlation coefficient and subsequent
significance testing of it requires the following data assumptions to hold:
interval or ratio level or ordinal. monotonically related.

Data Analysis: Qualitative
Data analysis is a systematic search for meaning. It is a way to process qualitative data so that what has been learned can be communicated to others. Analysis means organizing and interrogating data in ways that allow researchers to see patterns, identify themes, discover relationships, develop explanations, make interpretations, mount critiques, or generate theories. It often involves synthesis, evaluation, interpretation, categorization, hypothesizing, comparison, and pattern finding.
The analysis of qualitative research involves aiming to uncover and / or understand the big picture - by using the data to describe the phenomenon and what this means. Both qualitative and quantitative analysis involves labeling and coding all of the data in order that similarities and differences can be recognized.

Data Analysis: Qualitative

Chapter 5: Conclusion The conclusion simply inform the reader of the research
what have you achieved through this research, have you reconfirmed your assumption/hypothesis or you have found the answers of research questions or you got some new knowledge through this research.
The conclusion should be based on what you have already mentioned or described in your research.
The conclusion of a research thesis reaffirms the thesis statement, discusses the issues, and reaches a final judgment. The conclusion is not a summary; it is a belief based on your reasoning and on the evidence you have accumulated. This is the place to share with readers the conclusions you have reached because of your research.

References
1. http://urp.ucsd.edu/for-students/what-is-research.html
2. http://arxiv.org/pdf/physics/0601009.pdf
3. http://utcc2.utcc.ac.th/localuser/amsar/PDF/Documents49/quantitative_and_qualitative_methodologies.pdf
4. http://www.ccs.neu.edu/course/is4800sp12/resources/qualmethods.pdf
5. http://www.sagepub.com/upm-data/40803_5.pdf
6. http://www.slideshare.net/jeweliiuc/sampling-13638951
7. https://www.nationalgangcenter.gov/Content/Documents/Assessment-Guide/Assessment-Guide-Chapter-9.pdf
8. http://www.organizationalresearch.com/publicationsandresources/a_handbook_of_data_collection_tools.pdf
9. http://www.sagepub.com/upm-data/43454_10.pdf
10. http://learningstore.uwex.edu/assets/pdfs/g3658-6.pdf
11. http://www.statstutor.ac.uk/resources/uploaded/spearmans.pdf
12. https://explorable.com/spearman-rank-correlation-coefficient
13. http://www.eeraonline.org/journal/files/2004/JRE_2004_08_Kawulich.pdf
14. http://libweb.surrey.ac.uk/library/skills/Introduction%20to%20Research%20and%20Managing%20Information%20Leicester/page_75.htm
15. http://www.sagepub.com/upm-data/43454_10.pdf
16. http://www.devstud.org.uk/downloads/4be165997d2ae_Writing_the_Conclusion_Chapter,_the_Good,_the_Bad_and_the_Missing,_Joe_Assan%5B1%5D.pdf

Thanks for reading this presentation and
I hope it will help you to make a better
Independent Study(IS) in future.
Author:
Mahendar Kumar(Papu)
Email: [email protected]