Embed Size (px)
Citation preview

1
The importance of housing, accessibility, and transport characteristic ratings on stated neighborhood preference
Steven R. Gehrke | Kristina M. Currans (Presenter) | Kelly J. Clifton, Ph.D.
Civil & Environmental Engineering, Portland State University
Friday Transportation Seminar (TRB Presentations)
Portland State University: January 8th, 2016

2
Introduction
Research Project:• Understanding Residential Location Choices for Climate Change and Transportation
Decision Making
• Improve sensitivity towards preferences, values, and attitudes within our statewide and regional models
• Transportation Research Board, Session 786: Integrated Modeling of Urban Systems: Expanding the Scope of Integration Beyond Land Use and Transportation
This Study:• How does the rated importance of housing, transportation, and accessibility
characteristics influence stated neighborhood preference?

3
Study Objectives
Develop, administer, and analyze an original stated preference experiment that collects:
• Rated importance for housing, accessibility, and transportation characteristics;
• Stated neighborhood preference; and
• Household and individual socio-demographic attributes
Neighborhood Preference
Importance Constructs
Socio-demographicAttributes
Importance of Characteristics

4
Methods
1. Research Design• Neighborhood Transportation Survey (online, choice-based conjoint experiment)
• Portland metropolitan region (usable sample n = 554)
2. Measures of Interest• Stated neighborhood preference
• Importance ratings of characteristics in residential location decision making process
3. Statistical Analysis• Exploratory factor analysis
• Confirmatory factor analysis
• Structural equation modeling

5
Methods
1. Research Design• Neighborhood Transportation Survey (online, choice-based conjoint experiment)
• Portland metropolitan region (usable sample n = 554)
2. Measures of Interest• Stated neighborhood preference
• Importance ratings of characteristics in residential location decision making process
3. Statistical Analysis• Exploratory factor analysis
• Confirmatory factor analysis
• Structural equation modeling

6
Research Design
Survey instrument components:
a) Household and Individual Characteristics
b) Stated Neighborhood Preference
c) Rate Characteristics by Importance
d) Choice-based Conjoint Experiment• Data are not used in this study
Wave Study Area Households (N) Response Rate (%)
1 Portland Metro 8,000 6.3%
2 Downtown Portland 1,982 8.1%
3 Non-Portland, Oregon NA NA

7
Methods
1. Research Design• Neighborhood Transportation Survey (online, choice-based conjoint experiment)
• Portland metropolitan region (usable sample n = 554)
2. Measures of Interest• Stated neighborhood preference
• Importance ratings of characteristics in residential location decision making process
3. Statistical Analysis• Exploratory factor analysis
• Confirmatory factor analysis
• Structural equation modeling
8
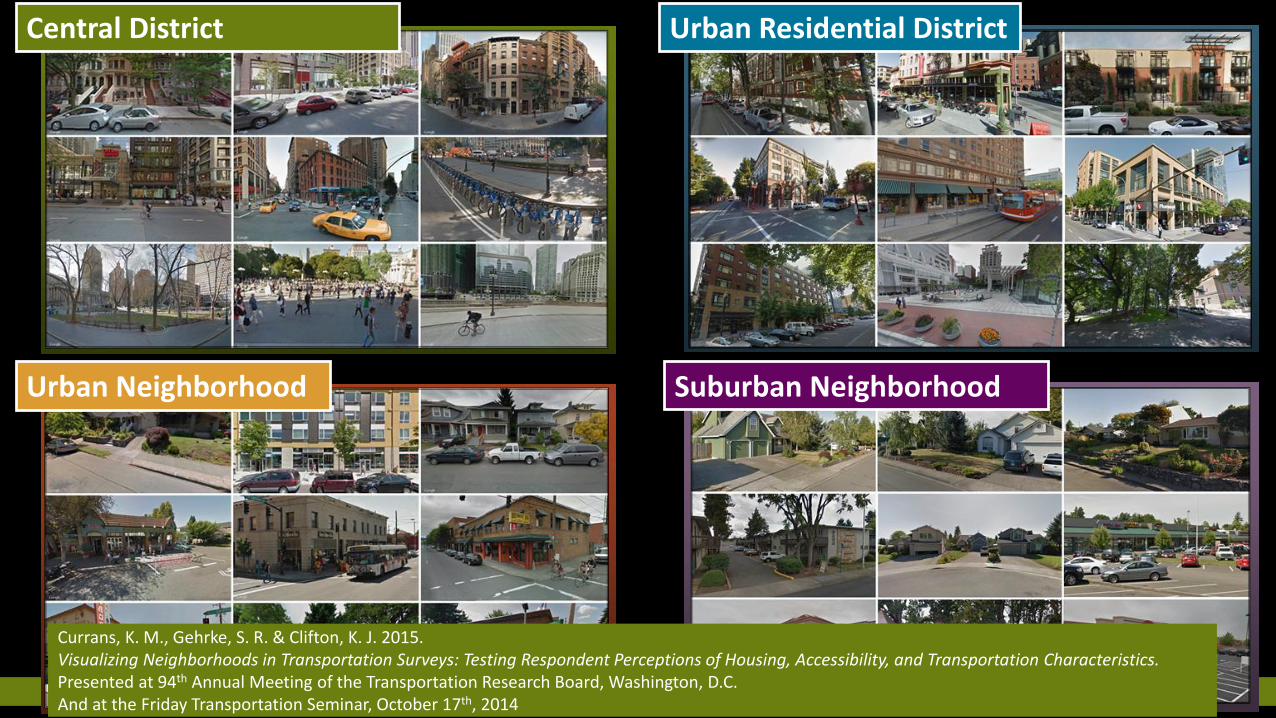
Central District
Urban Neighborhood
Urban Residential District
Suburban Neighborhood
Currans, K. M., Gehrke, S. R. & Clifton, K. J. 2015.Visualizing Neighborhoods in Transportation Surveys: Testing Respondent Perceptions of Housing, Accessibility, and Transportation Characteristics.Presented at 94th Annual Meeting of the Transportation Research Board, Washington, D.C.And at the Friday Transportation Seminar, October 17th, 2014

9
CentralDistrict
Urban Residential
District
Urban Neighborhood
SuburbanNeighborhood
HousingMultifamily units in high-rises
Multifamily units in mid-rises
Multifamily units in low-rises & Single-family units
Single-family units
Rent or Own Predominately rentersMix of renters and owners
Mostly owners Predominantly owners
ParkingOff-street parking (paid, secure)
Off-street parking (paid, secure)
On-street parking (free, unsecure) & Off-street parking(free, secure)
On-street parking(free, unsecure) & Off- street parking(free, secure)
Transportation Accessibility
High multimodal access to regional and local centers
Reasonable multimodal access to regional and local centers
Limited access to regional centers & modest public transit network
Sparse public transit
Destination Accessibility
Retail, services, & entertainment within a maximum of 1/8 mile
Retail, services, & entertainment within a maximum of 1/4 mile
Retail, services, & entertainment within a maximum of 1 mile
Retail & service along arterials within 2 to 3 miles
9% 18% 40% 34%

10
Characteristics of housing, accessibility, and transportation “that you may consider when deciding where to live”
Level of importance (% of Respondents, N = 529 to 542)
Very Somewhat Not at all
(must have) (would like to have) (not a factor)Owning a house/condo
Large living space
Detached single-family home
Private yard
Privacy from my neighbors
Living at ‘center of it all’
Access to parks and recreational areas
Access to highways/freeways
Variety of transportation options
Walking to bus/rail stops
Off-street parking at local destinations
Dedicated parking at your residence
Walking to nearby places
Biking to nearby places

11
Methods
1. Research Design• Neighborhood Transportation Survey (online, choice-based conjoint experiment)
• Portland metropolitan region (usable sample n = 554)
2. Measures of Interest• Stated neighborhood preference
• Importance ratings of characteristics in residential location decision making process
3. Statistical Analysis• Exploratory factor analysis
• Confirmatory factor analysis
• Structural equation modeling

12
Statistical Analysis
Exploratory Factor Analysis (EFA)
Structural Equation Modeling (SEM)
Part I:Constructs Neighborhood Types
Structural Equation Modeling (SEM)
Part II:SES Constructs Urban Neighborhood
Confirmatory Factor Analysis (CFA)

13
Statistical Analysis
Exploratory Factor Analysis (EFA)
Structural Equation Modeling (SEM)
Part I:Constructs Neighborhood Types
Structural Equation Modeling (SEM)
Part II:SES Constructs Urban Neighborhood
Confirmatory Factor Analysis (CFA)

14
Statistical Analysis
Exploratory Factor Analysis (EFA)
Structural Equation Modeling (SEM)
Part I:Constructs Neighborhood Types
Structural Equation Modeling (SEM)
Part II:SES Constructs Urban Neighborhood
Confirmatory Factor Analysis (CFA)

15
0.81
-0.73
SF DwellingImportance
Non-auto Access
Importance
Model Summary:
χ^2 (df): 67.48 (13)p-value: 0.000
CFI: 0.987TLI: 0.980RMSEA: 0.088
* Reverse Coded
Confirmatory Factor Analysis (β)
Center-of-it-All *
Private Yard
Variety of Transport Options
Walk to Transit
Dedicated Parking at Home *
Walking to nearby places
Single-Family Dwelling
0.95
0.85
0.71
0.87
0.85
0.83
0.54

16
Statistical Analysis
Exploratory Factor Analysis (EFA)
Structural Equation Modeling (SEM)
Part I:Constructs Neighborhood Types
Structural Equation Modeling (SEM)
Part II:SES Constructs Urban Neighborhood
Confirmatory Factor Analysis (CFA)

17
0.81
-0.72
Model Summary:
χ^2 (df): 125.15 (33)p-value: 0.000
CFI: 0.983TLI: 0.972RMSEA: 0.071
* Reverse Coded
CENTRALDISTRICT
URBANRESIDENTIAL
DISTRICT
SUBURBANN’HOOD
Center-of-it-All *
Private Yard
Variety of Transport Options
Walk to Transit
Dedicated Parking at Home *
SF DwellingImportance
Walking to nearby places
Single-Family Dwelling
0.94
0.87
0.74
0.90
0.84
0.81
0.56
URBANN’HOOD
-0.79
-0.84
0.66
0.56
0.75
-0.37Non-auto
Access Importance
Stated Neighborhood Preference (β)

18
Statistical Analysis
Exploratory Factor Analysis (EFA)
Structural Equation Modeling (SEM)
Part I:Constructs Neighborhood Types
Structural Equation Modeling (SEM)
Part II:SES Constructs Urban Neighborhood
Confirmatory Factor Analysis (CFA)

19
-0.66
Model Summary:
χ^2 (df): 109.37 (76)p-value: 0.01
CFI: 0.96TLI: 0.95RMSEA: 0.03
Paths intolatent factors
P < 0.05 Paths shown
0.70
0.68
URBANN’HOOD
HH Size:1 member
HH Size:3 members
HH Size:4 + members
HH Income:$0 - $24,999
HH Income:$25,000 - $49,999
HH Income:$100,000 +
Age:18 - 24 years
Age:35 - 44 years
Age65 + years
SF DwellingImportance
Non-auto Access
Importance
- 0.18
0.19
0.34
- 0.17
- 0.14
- 0.14
- 0.12- 0.22
- 0.13
- 0.250.17
0.14
0.23
0.15
Urban Neighborhood Preference (β)

20
Traced paths of unstandardized coefficients to:
URBANNEIGHBORHOOD
HHSIZE
1 -3.55
2
3 0.20
4+ 0.37
INCOME
<25K 0.24
25-50K -0.43
50-100K
>100K -0.11
AGE
18-34 0.44
35-44 0.44
45-64
65+ -0.12
-1.11
-0.26Non-Auto Access
Single-Family Dwelling

21
Traced paths of unstandardized coefficients to:
Single-Family DwellingImportance
Non-Auto AccessImportance
HHSIZE
1 -1.32
2
3 2.62
4+ 5.20
INCOME
<25K -5.36
25-50K -1.04
50-100K
>100K -0.97
AGE
18-34 -3.65
35-44 -2.13
45-64
65+ -2.53
HHSIZE
1 2.81
2
3 -4.00
4+ -7.39
INCOME
<25K 8.19
25-50K 0.68
50-100K
>100K 2.09
AGE
18-34 4.55
35-44 2.27
45-64
65+ 3.56

22
Discussion
• Analysis suggests socio-demographic characteristics are not necessarily proxy measures for tastes and values in stated neighborhood preferences
• Market segments influencing stated neighborhood preferences and rated importance of characteristics more complex than socio-demographics
• Need for value, preference, and attitudinal data is growing
• Must continue to support collection of this information in travel surveys

23
Study Limitations
• Individual responses likely fail to reflect a joint decision-making process involving all household members
• Unconstrained neighborhood preference
• Sample size restricts interaction effects
• Evaluate for the need to segment characteristics rated• Example: Single-family dwelling into “living in a SF dwelling to own for an
investment” and “living in a SF dwelling for the space”

24
Future Directions
• Latent class analysis and testing ordinal outcomes to further explore market segments
• Analysis of choice-based conjoint experiment
• Constrained vs. unconstrained neighborhood preference• Role of economic factors
• How do importance ratings influence preferences in other metro regions?
• How does the influences of importance ratings change over time?

25
Questions ?
Kristina M. Currans [email protected]
Steven R. Gehrke [email protected]
Kelly J. Clifton, Ph.D. [email protected]