Embed Size (px)
Citation preview
Usefulness of Learning Analytics Tool
Anne Tervakari, Kirsi Kuosa, Juho Koro, Jukka Paukkeri, and Meri Kailanto Tampere University of Technology Department of Mathematics
MetaMath & MathGeAr Workshop on Remedial Mathematics for STEM students 14 September 2016, Tampere, Finland
Content of the presentation
• Motivation for the research
• The research case • Main results • Summary and
conclusion
14/09/16 2
3
Motivation for the research
• Rich log data regarding students’ actions and participation recorded in LMS can provide useful and valuable information that can be utilized for facilitating online learning and teaching. • Problem 1: Large amounts of the data can be difficult for people
to analyse, interpret, and understand. • Problem 2: The majority of the LMSs do not have appropriate
tools to support the utilization of log data. • A solution: An interactive learning analytics tools with
information visualizations that support analysis of the log data of TUT Circle (Drupal-based learning environment) and Moodle.
4
Aims of the research conducted
l To examine the usefulness of the interactive learning analytics tools from the teachers’ and students’ points of view, a research study was organised in 2013 -14.
l The aims of the research study were to discover the following: l What kinds of visualizations (based on the log data)
were considered useful and why? l Whether students use the visualizations for educational
purposes during the course?
5
Data collection and analysis
The data was collected from various sources: l Focus group: 27 teachers and academic coordinators
participating in the workshop of Peda Forum Conference in autumn 2013 were asked about the advantages and challenges related to the educational use of visualizations based on the user data.
l Diary study: Two teachers were keeping track of activities and events related to use of learning analytic tools in their online courses during the years 2011 – 2014 in the form of a diary
l Web survey: 64 students in the course of hypermedia responded to the survey in spring 2013 in order to rate the usefulness of the visualizations provided
l Mix Panel: a web analytics platform for verifying the real use of the visualizations provided
6
1. An interactive visualization dashboard
6
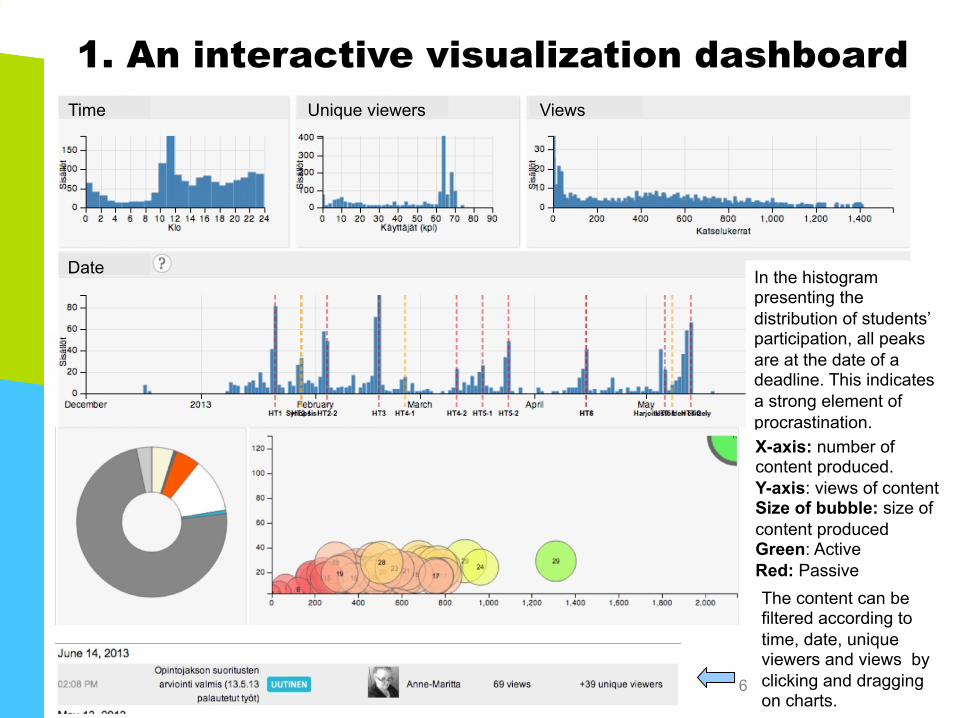
Time Unique viewers
Date
Views
The content can be filtered according to time, date, unique viewers and views by clicking and dragging on charts.
In the histogram presenting the distribution of students’ participation, all peaks are at the date of a deadline. This indicates a strong element of procrastination. X-axis: number of content produced. Y-axis: views of content Size of bubble: size of content produced Green: Active Red: Passive
7
1. An interactive visualization dashboard
According to the teachers: l Helps to monitor activity, participation and learning processes of
each individual student in real time during the online course, which support teachers
l to establish whether the students’ learning is proceeding as intended, and make strategic adjustments to online course if needed
l to identify the most passive students who might be at risk of dropping out
l to provide personal and additional guidance when needed to motivate and encourage the students
l to recognise undesirable behaviour patterns (e.g. procrastination) among the students that might require pedagogical intervention
l to assess the students’ learning performance.
8
1. An interactive visualization dashboard
According to the students: l Usefulness
l Useful (37 %): The visualizations help to verify that own activity is at an acceptable level.
l Useless (37 %): Information presented is uninteresting, and there is no meaningful use for the visualization.
l Motivation l Motivate to study (16 %): Possibility to compare own activity with
other students’ activity motivate to improve their own activity. l Not motivate to study (84 %): Information represented is
insignificant and has no effect on the activity or participation; only confirms that you are as active as the others.
l The visualization was the most used and viewed by the students (Mixpanel).
9
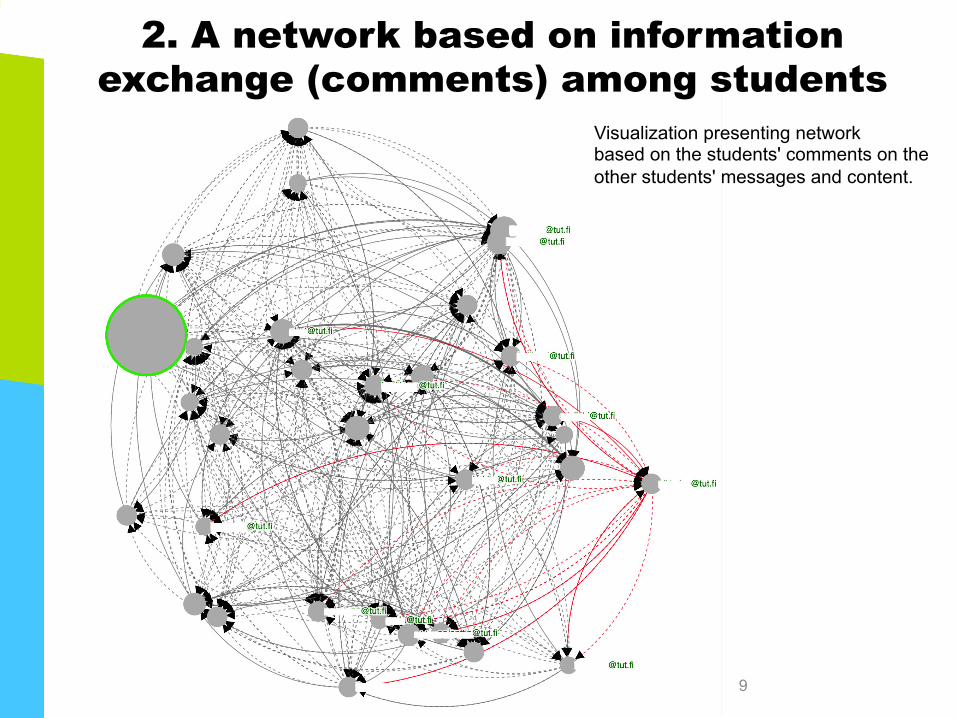
Visualization presenting network based on the students' comments on the other students' messages and content.
2. A network based on information exchange (comments) among students
10
2. A network based on information exchange (comments) among students
According to the teachers: l The visualization helps teachers
l to monitor the evolution of the students’ interaction network l to identify the students who have a lot of direct connections
(incoming and/or outgoing) l to identify the isolated students who do not participate at all
and who might be at risk of failing or dropping out
11
2. A network based on information exchange (comments) among students
According to the students: l Usefulness:
l Useful (3 %): The visualization supports monitoring the evolution of the students’ network
l Useless (71 %): The visualization is difficult to interpret and understand, and the information represented is unimportant.
l Motivation: l Motivate to study (6%): The visualization helped the students to
evaluate whether they should make more comments. l Not motivate to study (91 %): The information about who has
commented on whose message is not relevant to learning, and do not motivate anyone.
l According to the students the visualization could be more useful for teachers.
12
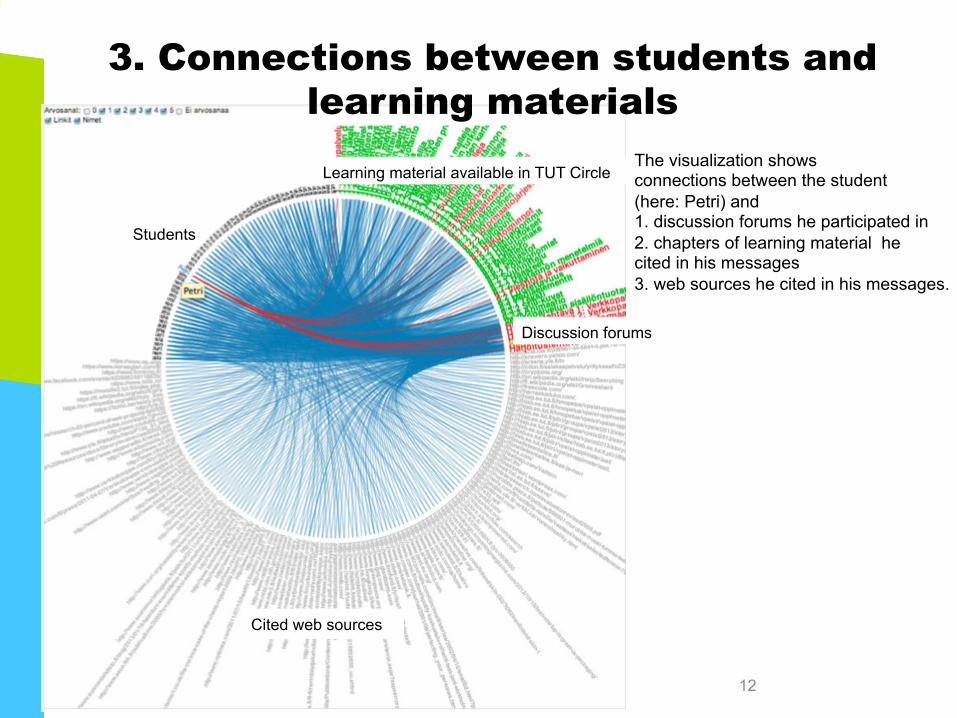
3. Connections between students and learning materials
Students
Learning material available in TUT Circle
Discussion forums
Cited web sources
The visualization shows connections between the student (here: Petri) and 1. discussion forums he participated in 2. chapters of learning material he cited in his messages 3. web sources he cited in his messages.
13
3. Connections between students and learning materials
According to the teachers l The visualization helps the teacher
l to monitor whether the students are using the learning materials or the external resources
l to find out how the students use various parts of learning material >> can indicate which parts are difficult to understand and which parts are considered the most useful
l to find new useful information to be added to the learning material.
14
3. Connections between students and learning materials
According to the students: l Usefulness:
l Useful (40 %): The visualization helps the students to find new, useful references.
l Useless (40 %): Benefits of the visualization remain unclear, the visualization was difficult to read.
l Motivation: l Motivate to study (25%): The information about references used by
the other students motivate to search for new references. Also, no one wants to be that only students who has not used any references.
l Not motivate to study (75 %): The information represented is unimportant and useless; the references and learning material used by other students are not interesting.
15
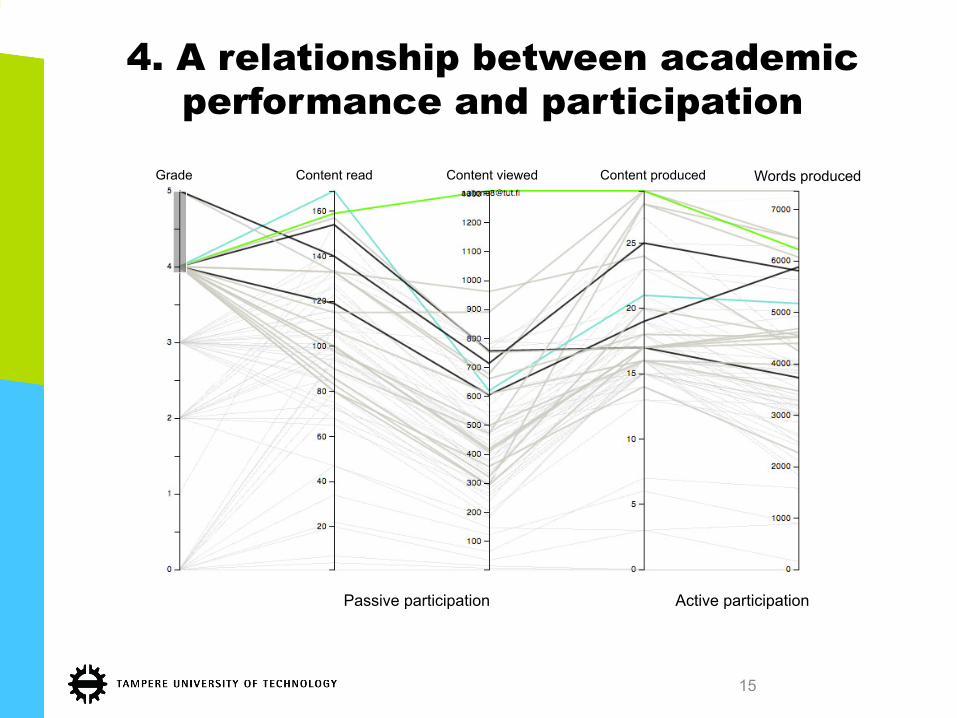
4. A relationship between academic performance and participation
Grade Content read Content viewed Content produced Words produced
Passive participation Active participation
16
4. A relationship between academic performance (grade) and participation
l The visualization helps the teacher to l see the general pattern of the students’ participation in
different grade level l identify those students, who differ from the others l ensure that the assessment is fair and equal for all students l compare grades and participation among students, which
aids the decision in cases of borderline grades.
17
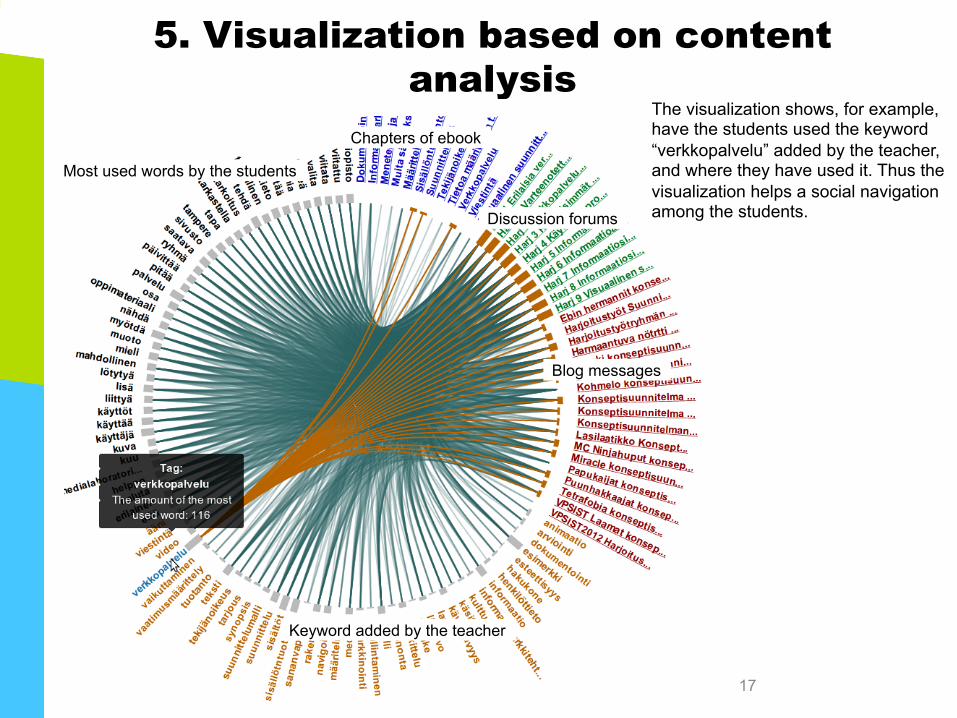
5. Visualization based on content analysis
Keyword added by the teacher
Most used words by the students
Blog messages
Discussion forums
Chapters of ebook
The visualization shows, for example, have the students used the keyword “verkkopalvelu” added by the teacher, and where they have used it. Thus the visualization helps a social navigation among the students.
18
5. Visualization based on content analysis
l For teachers: Helps to evaluate the quality of the students’
performance l If the students use the terms relevant to the subject matter in
a meaningful way in their work, it indicates that they have developed an understanding of the knowledge they need to acquire.
l For students: Possibility to find interesting information related to the keyword from learning material or from content produced by other students, which supports peer learning.
19
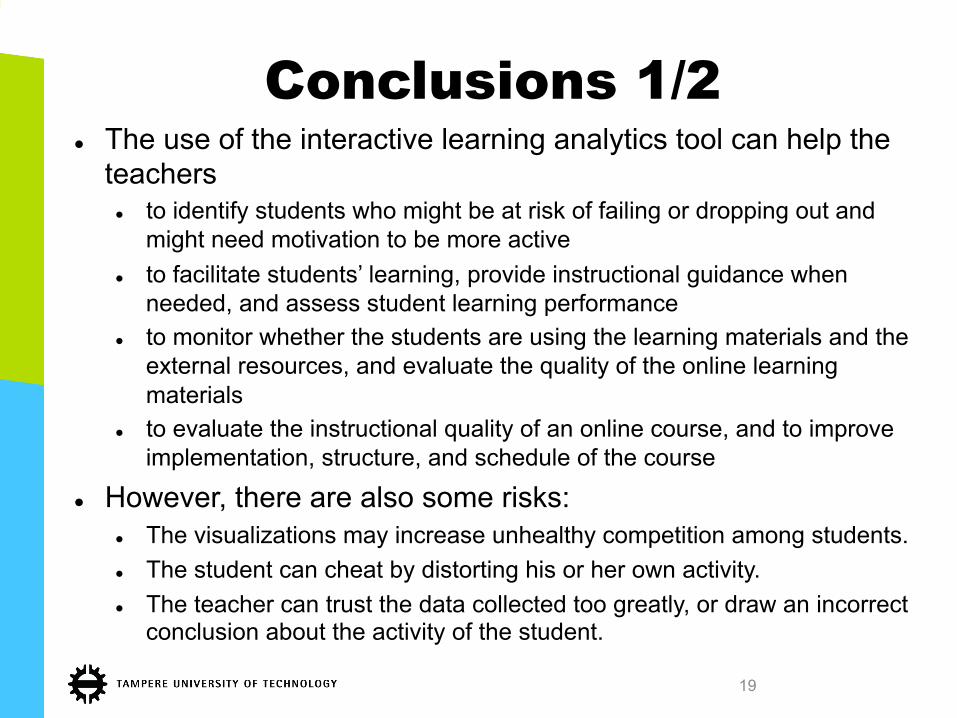
Conclusions 1/2
l The use of the interactive learning analytics tool can help the teachers l to identify students who might be at risk of failing or dropping out and
might need motivation to be more active l to facilitate students’ learning, provide instructional guidance when
needed, and assess student learning performance l to monitor whether the students are using the learning materials and the
external resources, and evaluate the quality of the online learning materials
l to evaluate the instructional quality of an online course, and to improve implementation, structure, and schedule of the course
l However, there are also some risks: l The visualizations may increase unhealthy competition among students. l The student can cheat by distorting his or her own activity. l The teacher can trust the data collected too greatly, or draw an incorrect
conclusion about the activity of the student.
20
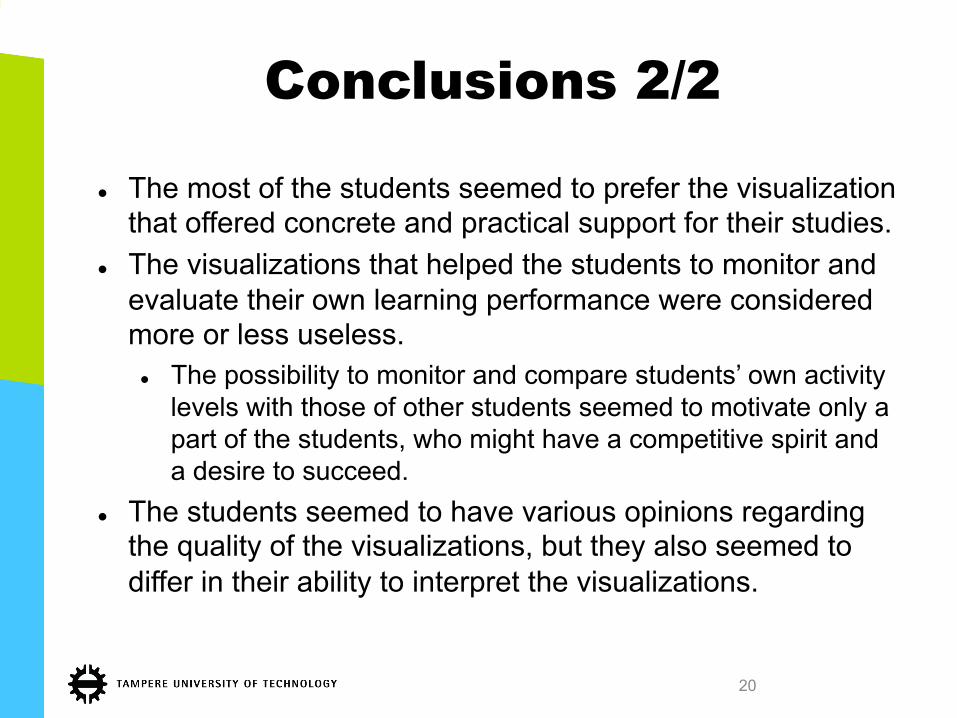
Conclusions 2/2
l The most of the students seemed to prefer the visualization
that offered concrete and practical support for their studies. l The visualizations that helped the students to monitor and
evaluate their own learning performance were considered more or less useless.
l The possibility to monitor and compare students’ own activity levels with those of other students seemed to motivate only a part of the students, who might have a competitive spirit and a desire to succeed.
l The students seemed to have various opinions regarding the quality of the visualizations, but they also seemed to differ in their ability to interpret the visualizations.
THANK YOU FOR YOUR ATTENTION! QUESTIONS?
This study was a part of the Finnish national project Campus Conexus II 2011-2014, financed by European Social Fund.
14/09/16 21
Photo: Mika Hirsimäki


![On the Relative Usefulness of Fireballssacerdot/PAPERS/lics15.pdf · 2016-07-28 · arXiv:1505.03791v1 [cs.LO] 14 May 2015 On the Relative Usefulness of Fireballs Beniamino Accattoli](https://img.pdfslide.tips/doc/110x75/5f085be17e708231d4219e2e/on-the-relative-usefulness-of-sacerdotpaperslics15pdf-2016-07-28-arxiv150503791v1.jpg)


![[Infographie] Du Web Analytics au Digital Analytics](https://img.pdfslide.tips/doc/110x75/5a65a7d27f8b9a9f2f8b48db/infographie-du-web-analytics-au-digital-analytics.jpg)