Embed Size (px)
Citation preview
Street-Food Project Kolkata
Implemented by Gana Unnayan Parshad &
Joygopalpur Gram Vikash Kendra
1. Motivation of the project
2. Methodology
3. Summary Statistics from the Baseline
Survey
Geographical Area
Demographic data
Business data
Hygiene Indicators
Street-Vendors
Represent 2% of urban population
Source of self employment for the urban poor
Source of affordable food to large part of the
urban population
In Kolkata estimates say there are 150.000
street-food vendors (NCEUS, 2007)
Project Motivation
However, street vendors suffer a welfare loss
because they work in the informal sector:
They are subject to arbitrary evictions
They are potential victims of abuses from
authorities
They cannot demand any right
Formalization may help vendors!
The national government is working toformalize street-vendors expecting that…“Vendors will suddenly change their behaviours”
The main hypothesis of the study is thatstreet-food vendors lack the necessaryawareness and capability to make alone sucha change in behaviour
Project offers an innovative training to helpvendors in this process: specifically, toimprove their awareness and capability
Awareness about:
National hawkers act for protection and
livelihood
Maintaining minimum Hygienic standards
Health hazards
Capability about:
How to deal with hygienic standards and health
hazards
How to improve their business
Project offers a training designed for street-food
vendors in urban India
Three workshops & follow-up visits at each kiosk
Study took place in April,15-June,16
How can we test the impact of the training?
How can we explain the change in behavior?
Impact Evaluation: Randomized Control Trial
2. Methodology
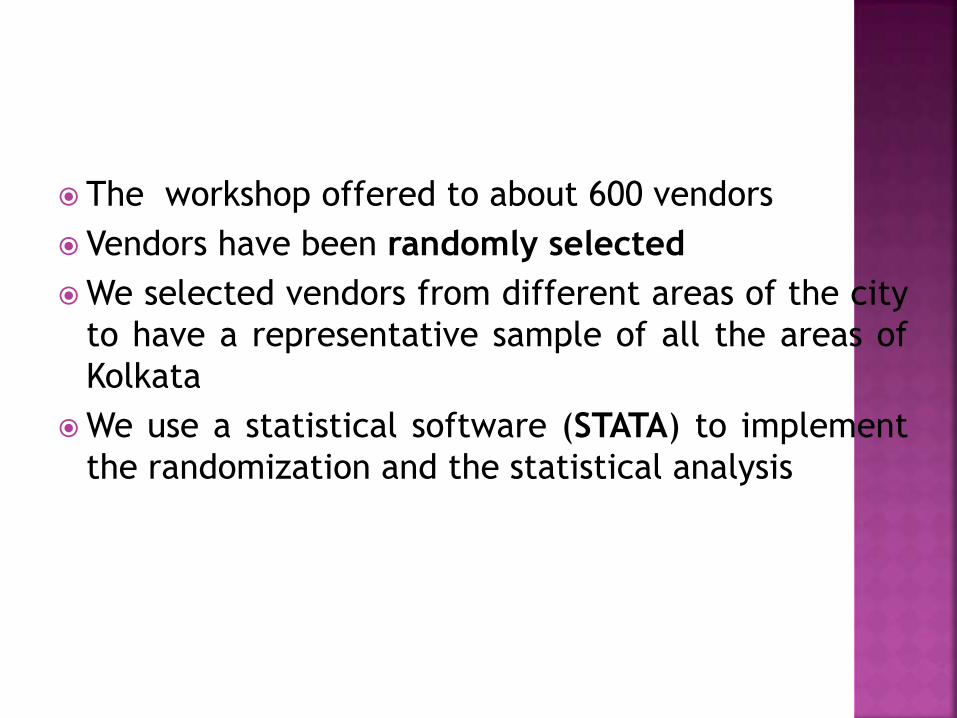
The workshop offered to about 600 vendors
Vendors have been randomly selected
We selected vendors from different areas of the city
to have a representative sample of all the areas of
Kolkata
We use a statistical software (STATA) to implement
the randomization and the statistical analysis
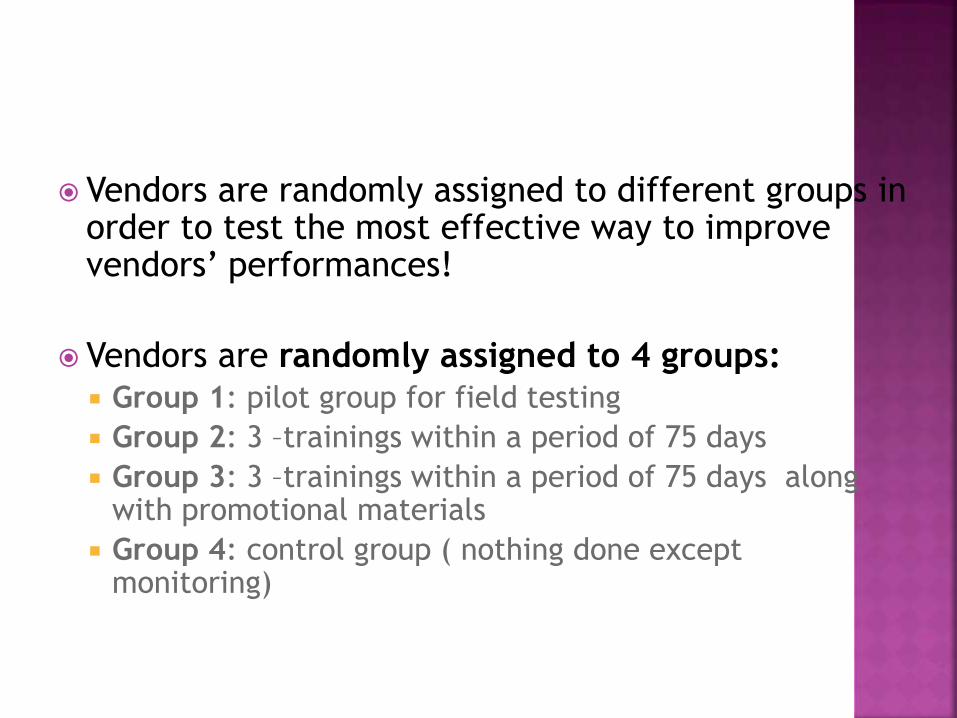
Vendors are randomly assigned to different groups in order to test the most effective way to improve vendors’ performances!
Vendors are randomly assigned to 4 groups: Group 1: pilot group for field testing
Group 2: 3 –trainings within a period of 75 days
Group 3: 3 –trainings within a period of 75 days along with promotional materials
Group 4: control group ( nothing done except monitoring)
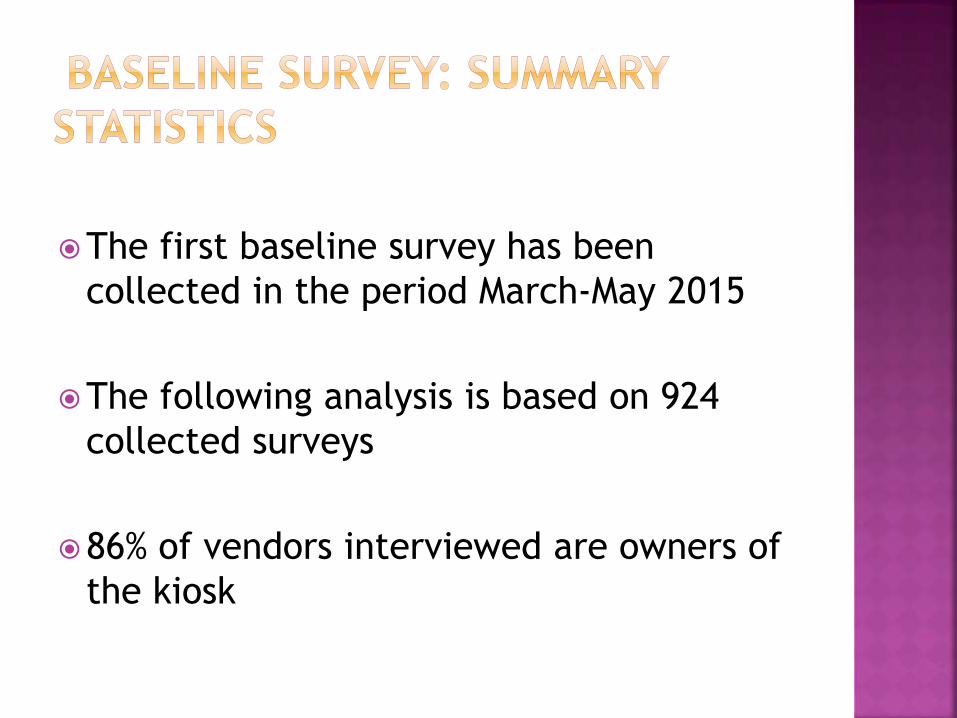
The first baseline survey has been
collected in the period March-May 2015
The following analysis is based on 924
collected surveys
86% of vendors interviewed are owners of
the kiosk

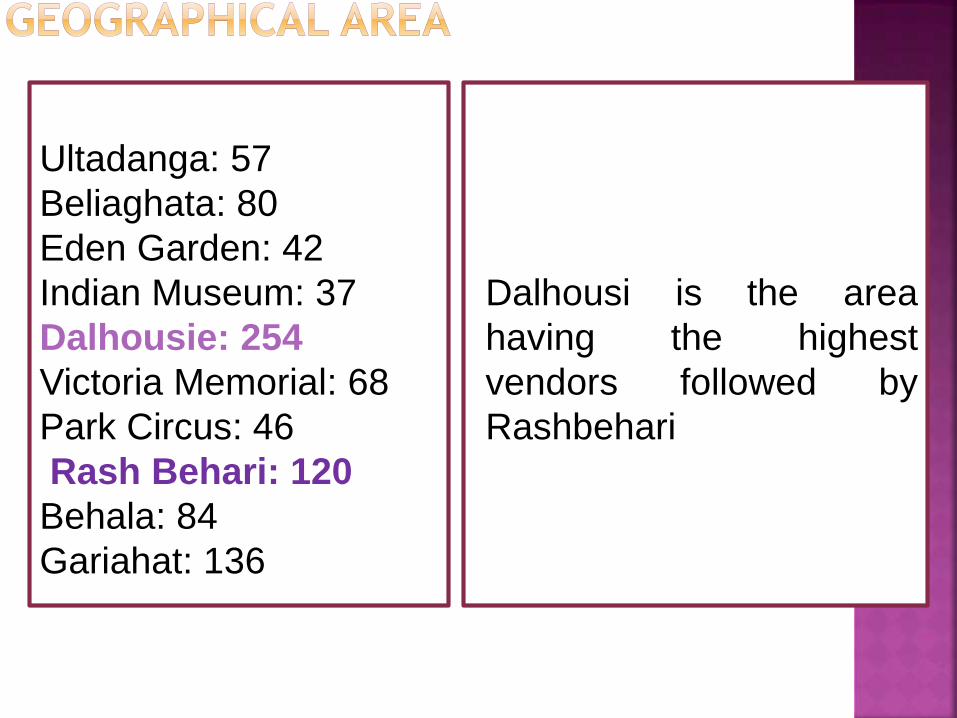
Ultadanga: 57
Beliaghata: 80
Eden Garden: 42
Indian Museum: 37
Dalhousie: 254
Victoria Memorial: 68
Park Circus: 46
Rash Behari: 120
Behala: 84
Gariahat: 136
Dalhousi is the area
having the highest
vendors followed by
Rashbehari

87%
13%
0%
20%
40%
60%
80%
100%
Men Women
Gender
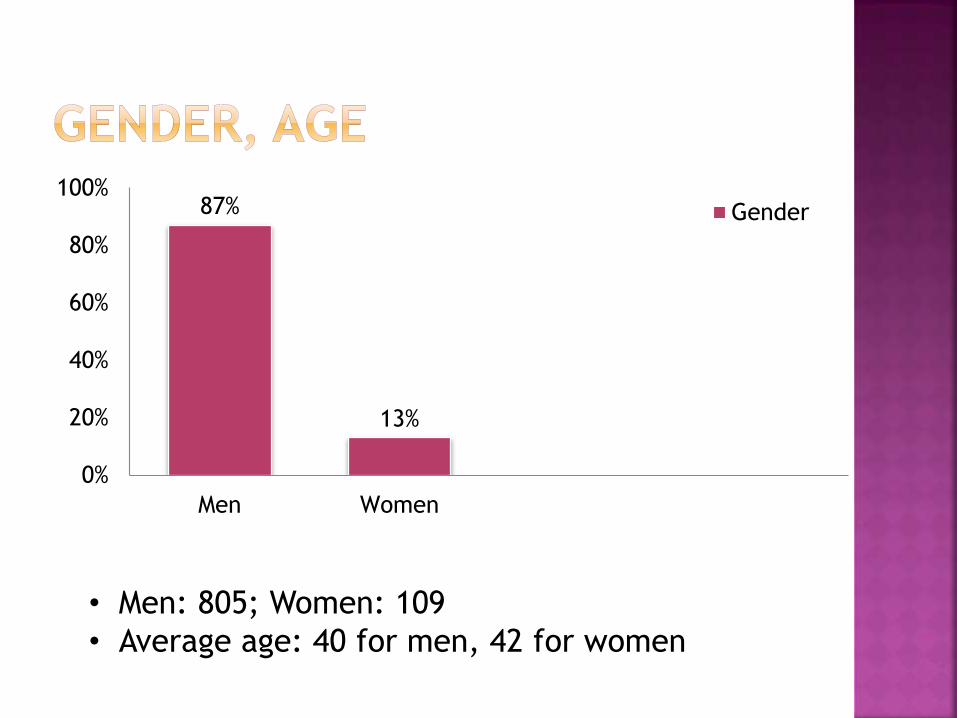
• Men: 805; Women: 109
• Average age: 40 for men, 42 for women
29%27%
23%
12%
5%3%
0%
10%
20%
30%
40%
no school primary upper primary secondary high secondary university
Education
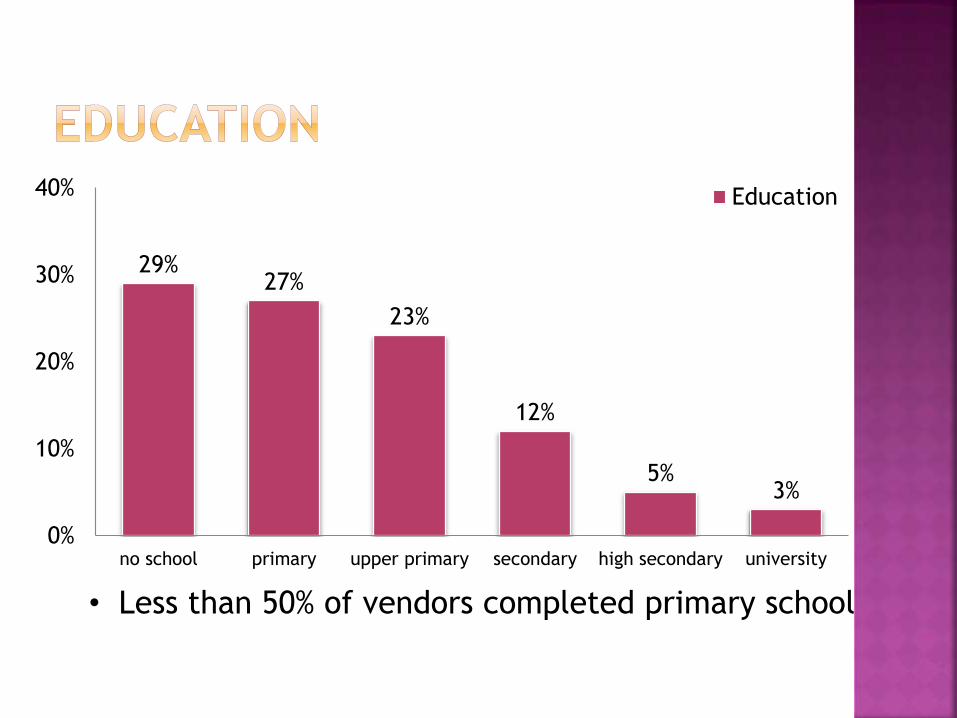
• Less than 50% of vendors completed primary school
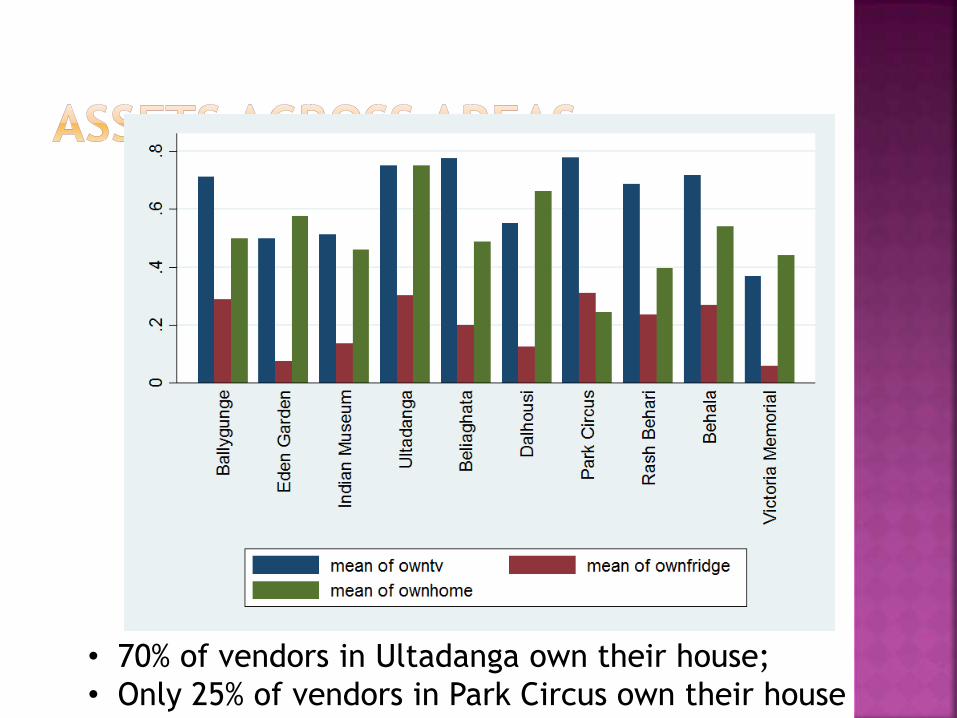
• 70% of vendors in Ultadanga own their house;
• Only 25% of vendors in Park Circus own their house
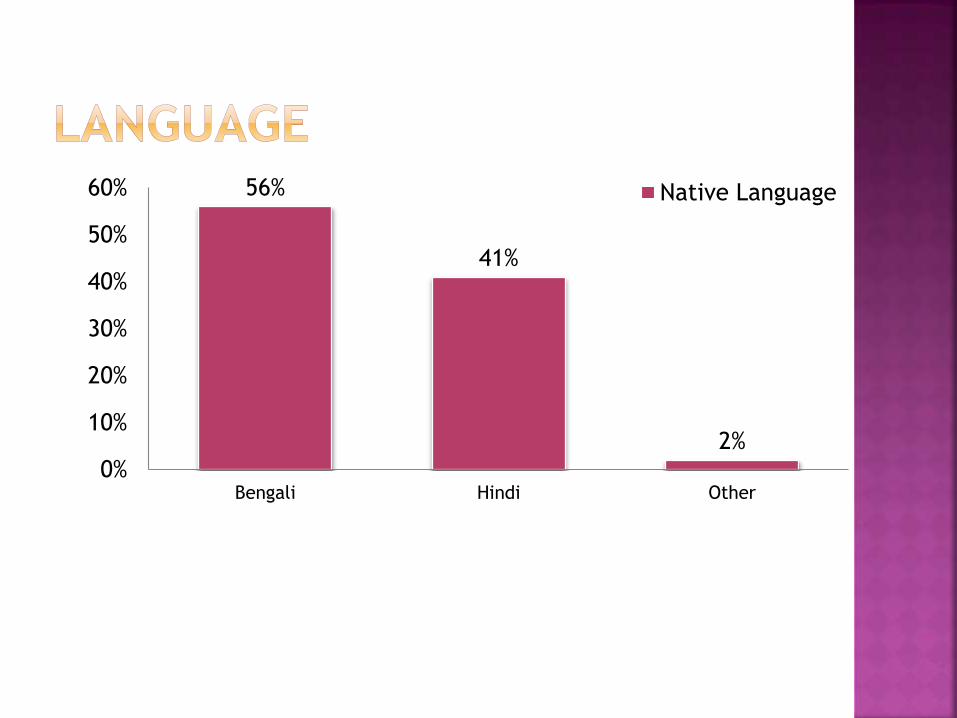
56%
41%
2%
0%
10%
20%
30%
40%
50%
60%
Bengali Hindi Other
Native Language
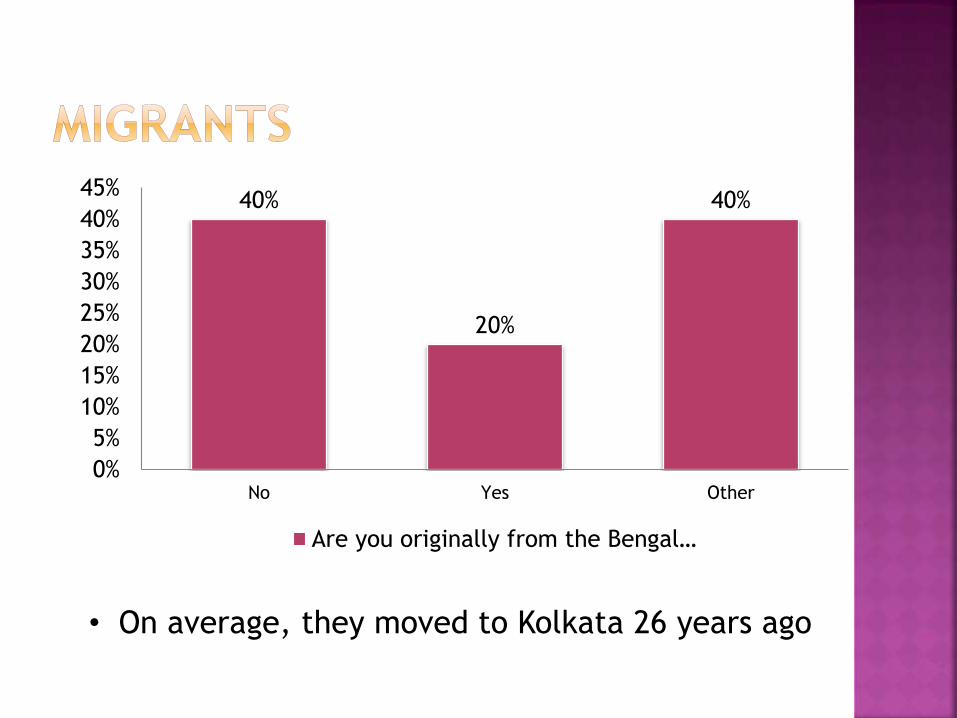
40%
20%
40%
0%
5%
10%
15%
20%
25%
30%
35%
40%
45%
No Yes Other
Are you originally from the Bengal…
• On average, they moved to Kolkata 26 years ago
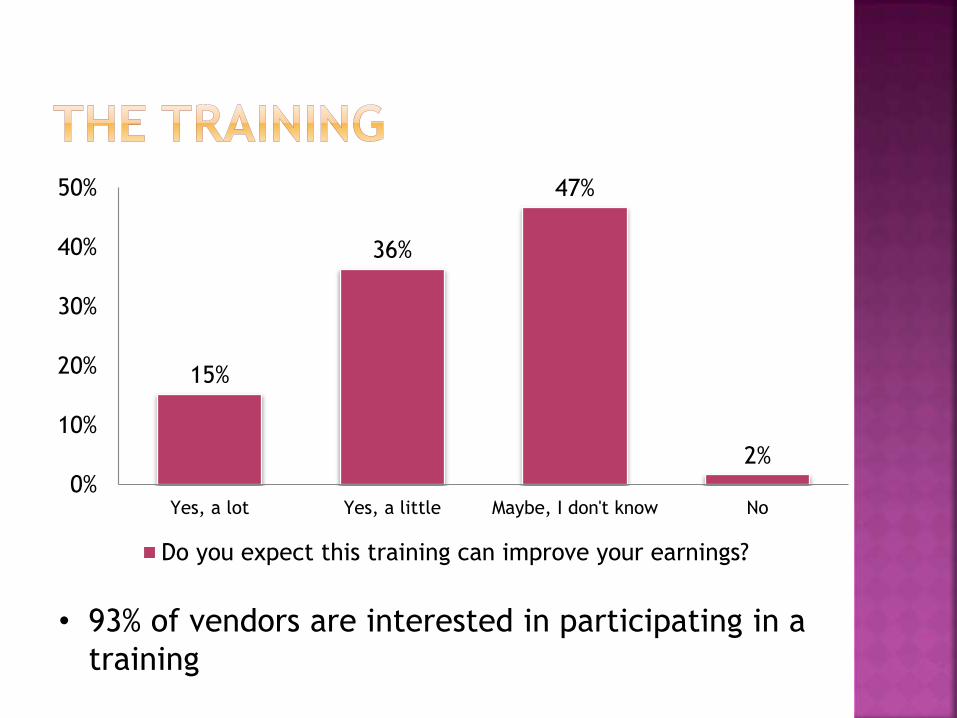
15%
36%
47%
2%
0%
10%
20%
30%
40%
50%
Yes, a lot Yes, a little Maybe, I don't know No
Do you expect this training can improve your earnings?
• 93% of vendors are interested in participating in a
training
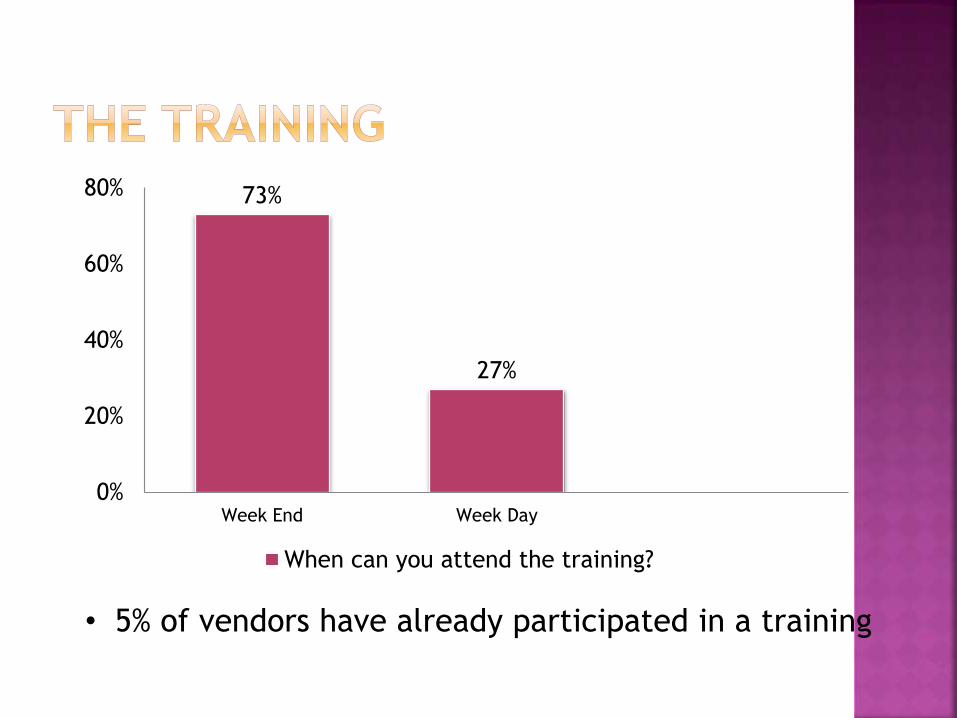
73%
27%
0%
20%
40%
60%
80%
Week End Week Day
When can you attend the training?
• 5% of vendors have already participated in a training

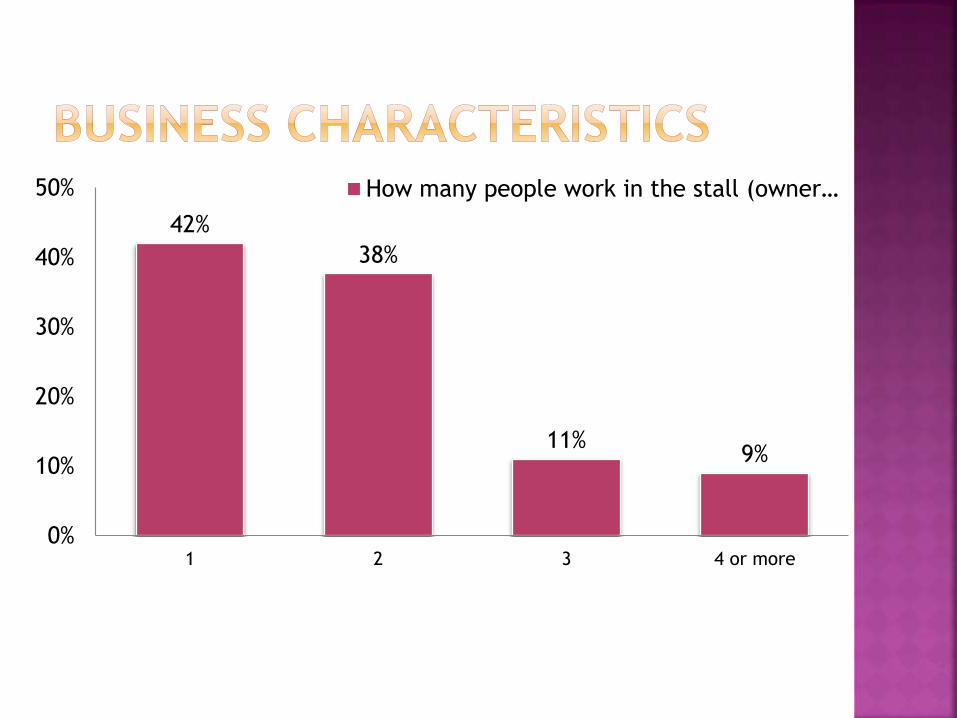
42%
38%
11%9%
0%
10%
20%
30%
40%
50%
1 2 3 4 or more
How many people work in the stall (owner…
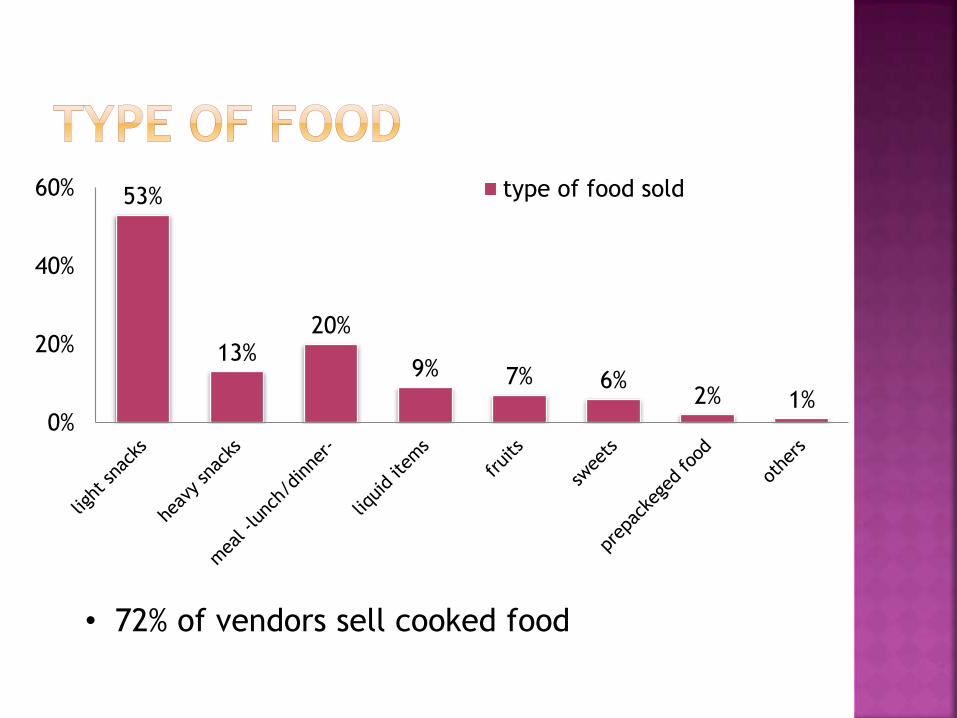
53%
13%20%
9% 7% 6%2% 1%
0%
20%
40%
60% type of food sold
• 72% of vendors sell cooked food
Average Revenue (per day): Rs. 1462
Average Expenditure (per day): Rs. 1100
Daily profits (per day): Rs. 360
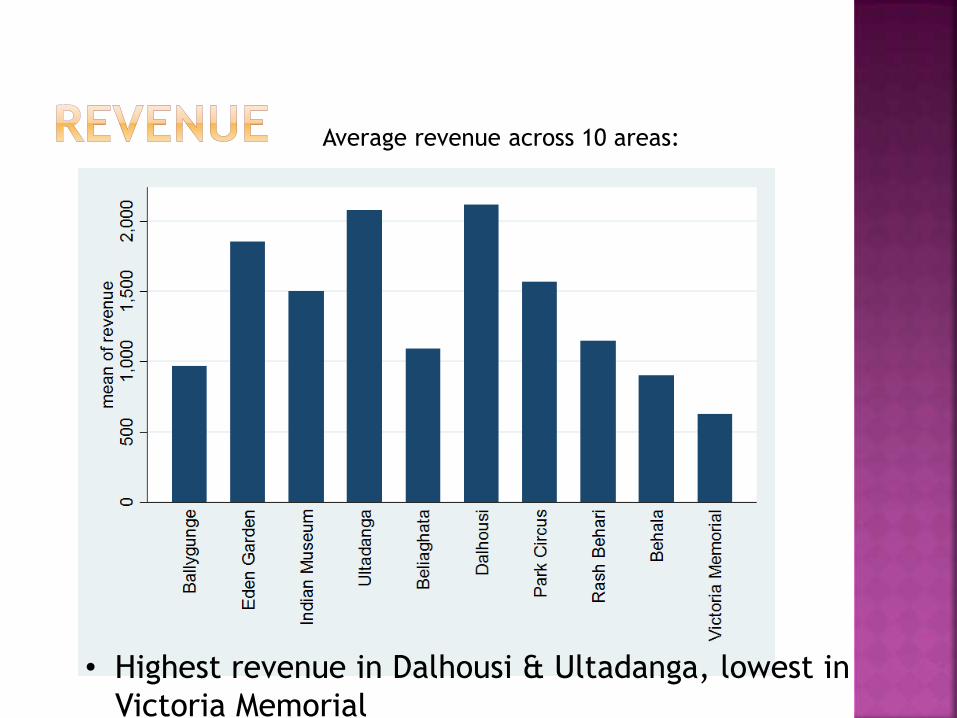
• Highest revenue in Dalhousi & Ultadanga, lowest in
Victoria Memorial
Average revenue across 10 areas:
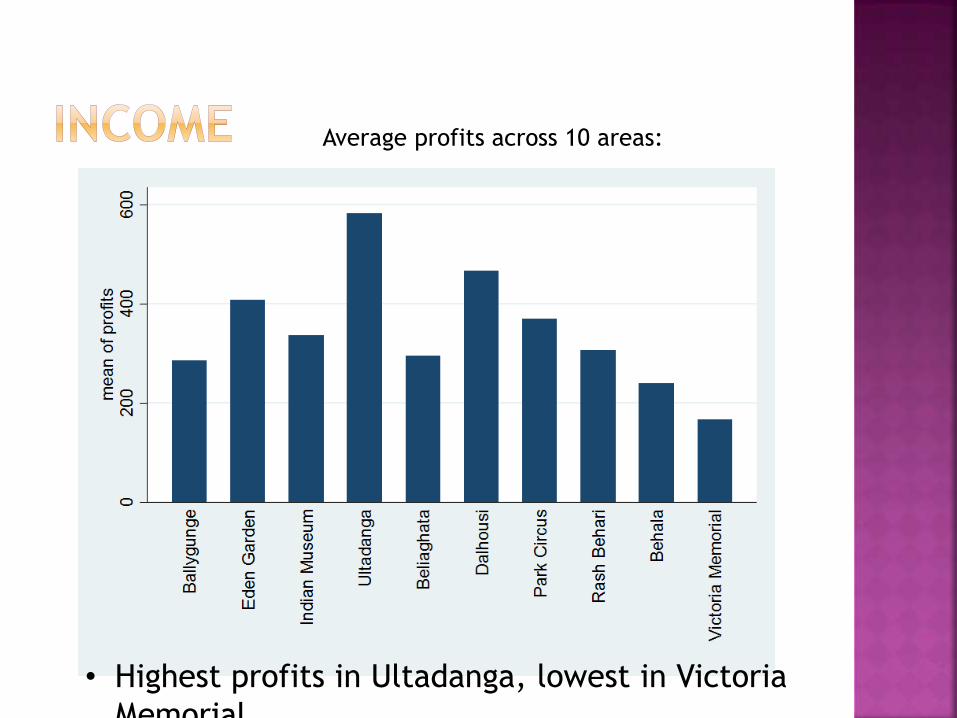
• Highest profits in Ultadanga, lowest in Victoria
Memorial
Average profits across 10 areas:
3% 3%
41%
9%3% 3% 1%
21%
2% 1%6% 8%
0%
10%
20%
30%
40%
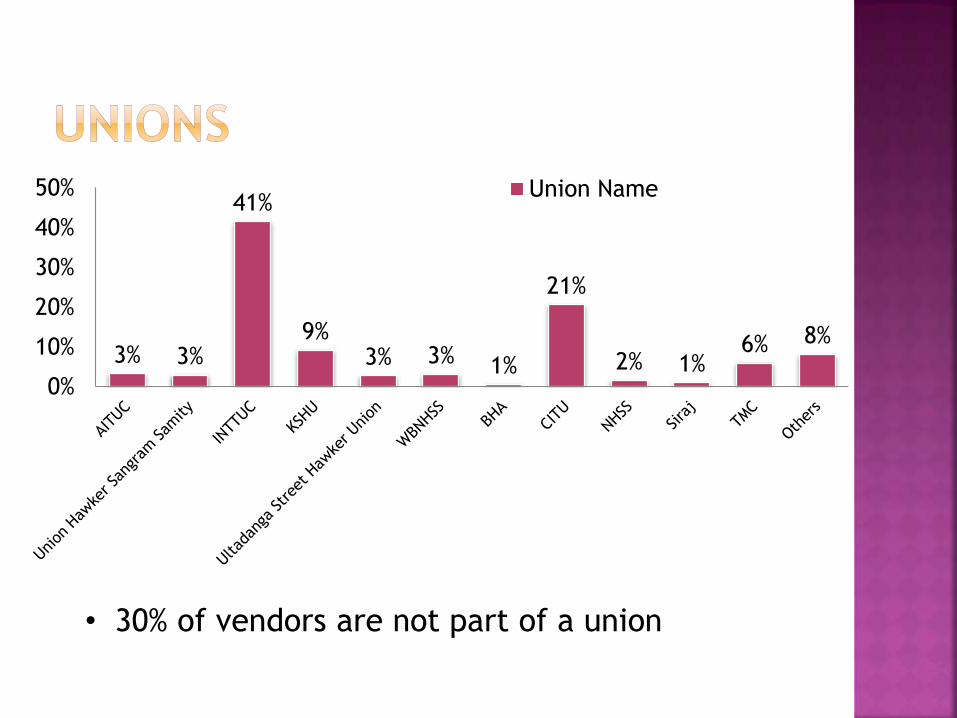
50% Union Name
• 30% of vendors are not part of a union
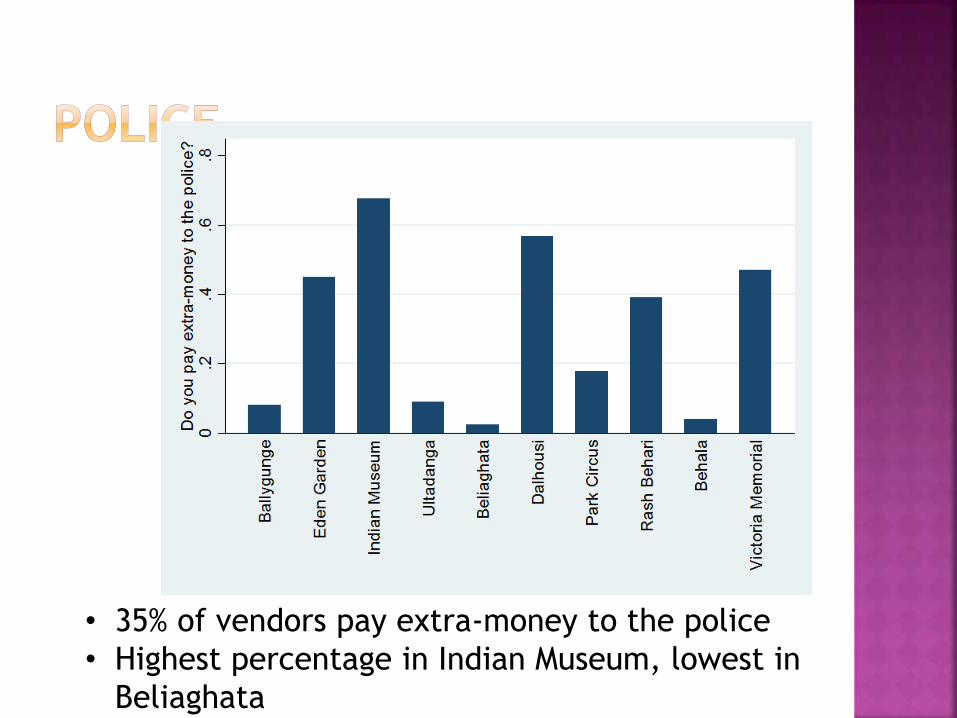
• 35% of vendors pay extra-money to the police
• Highest percentage in Indian Museum, lowest in
Beliaghata
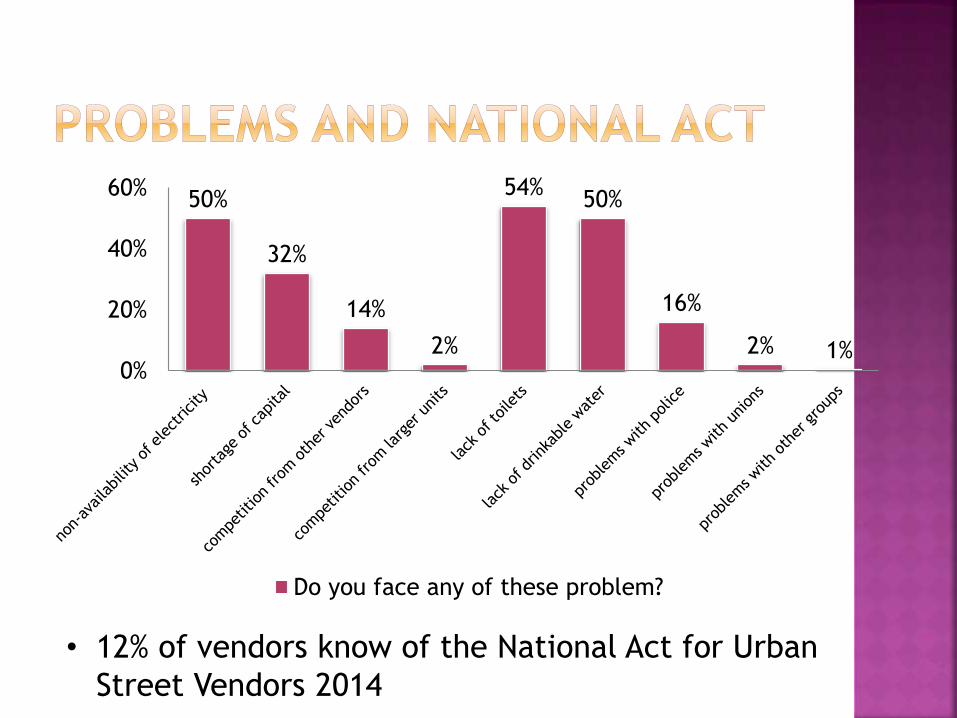
50%
32%
14%
2%
54%50%
16%
2% 1%0%
20%
40%
60%
Do you face any of these problem?
• 12% of vendors know of the National Act for Urban
Street Vendors 2014

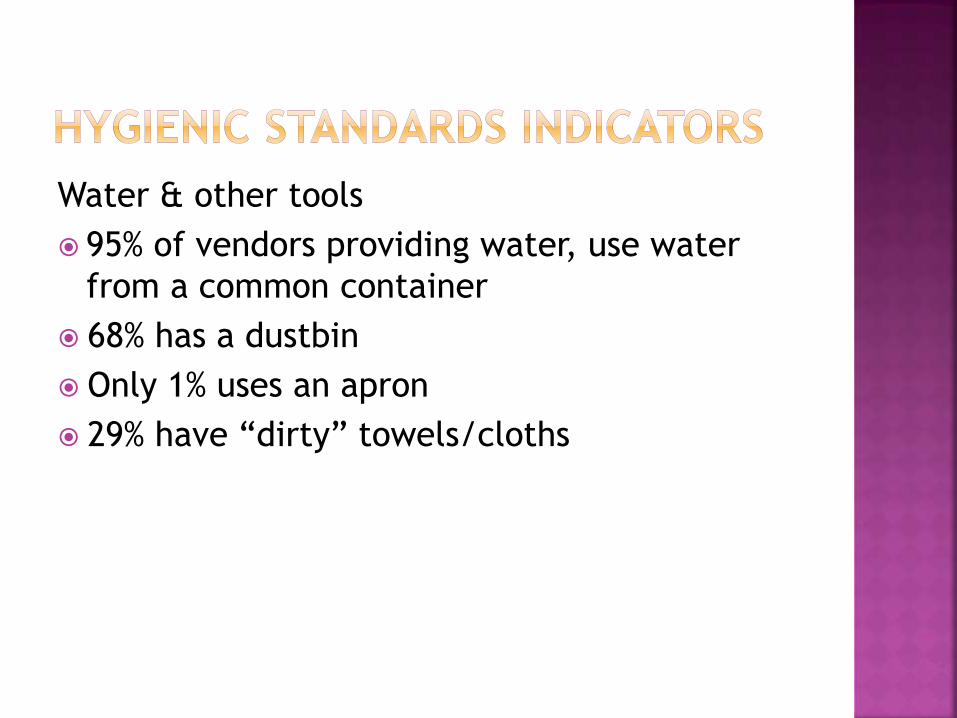
Water & other tools
95% of vendors providing water, use water
from a common container
68% has a dustbin
Only 1% uses an apron
29% have “dirty” towels/cloths
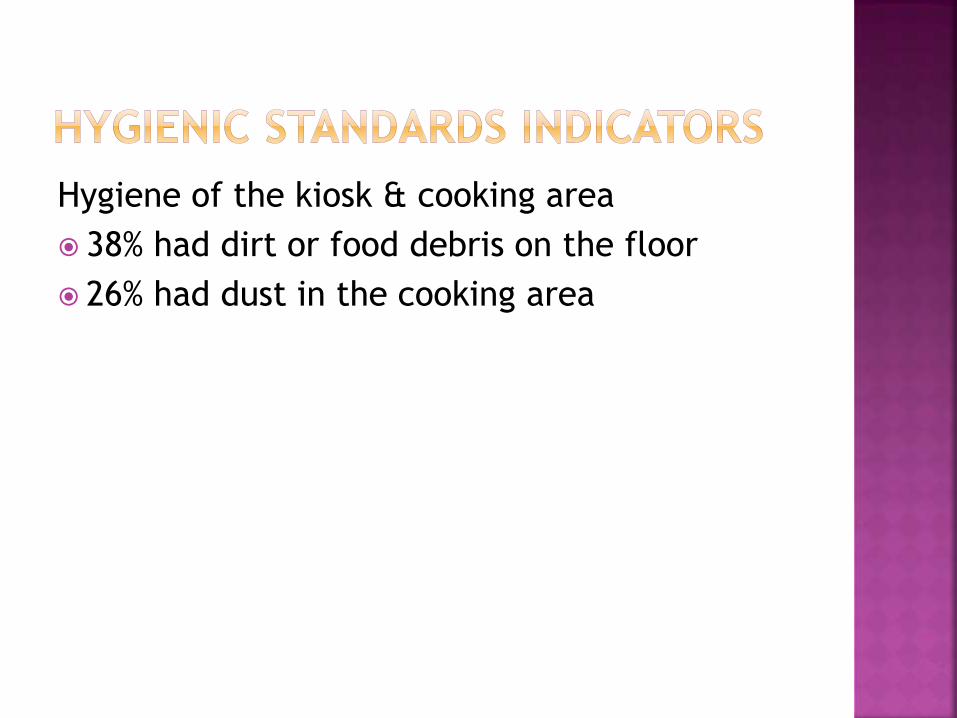
Hygiene of the kiosk & cooking area
38% had dirt or food debris on the floor
26% had dust in the cooking area
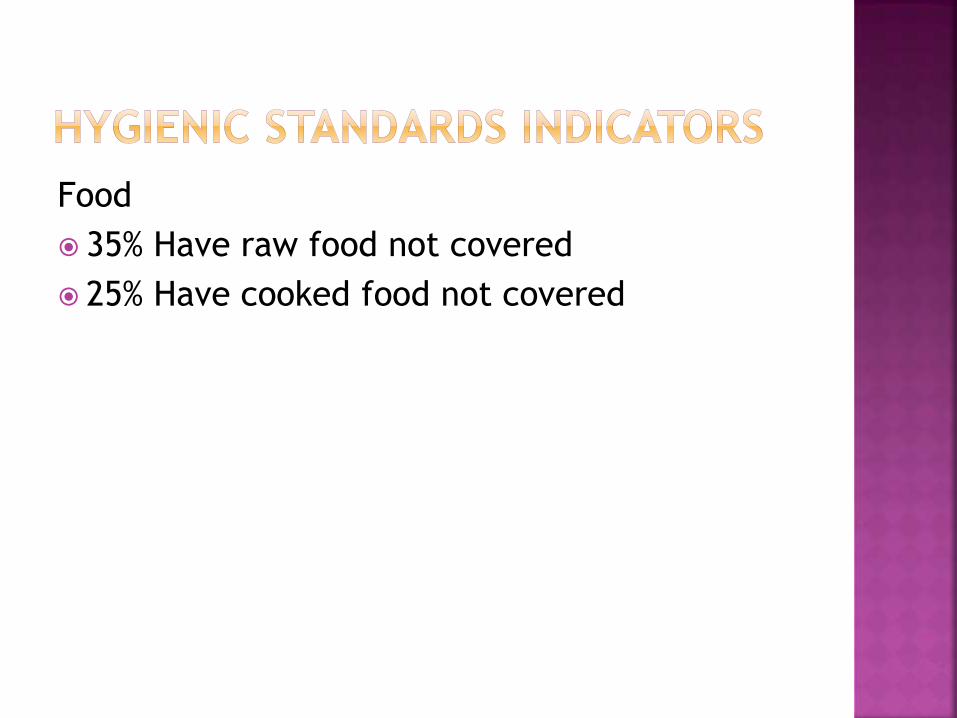
Food
35% Have raw food not covered
25% Have cooked food not covered
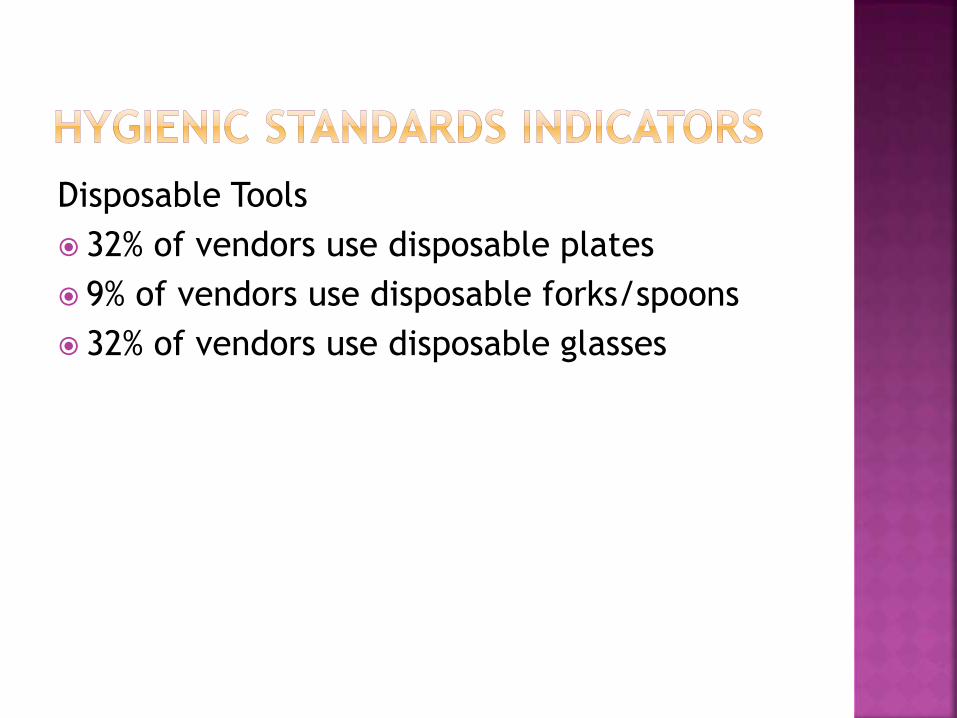
Disposable Tools
32% of vendors use disposable plates
9% of vendors use disposable forks/spoons
32% of vendors use disposable glasses
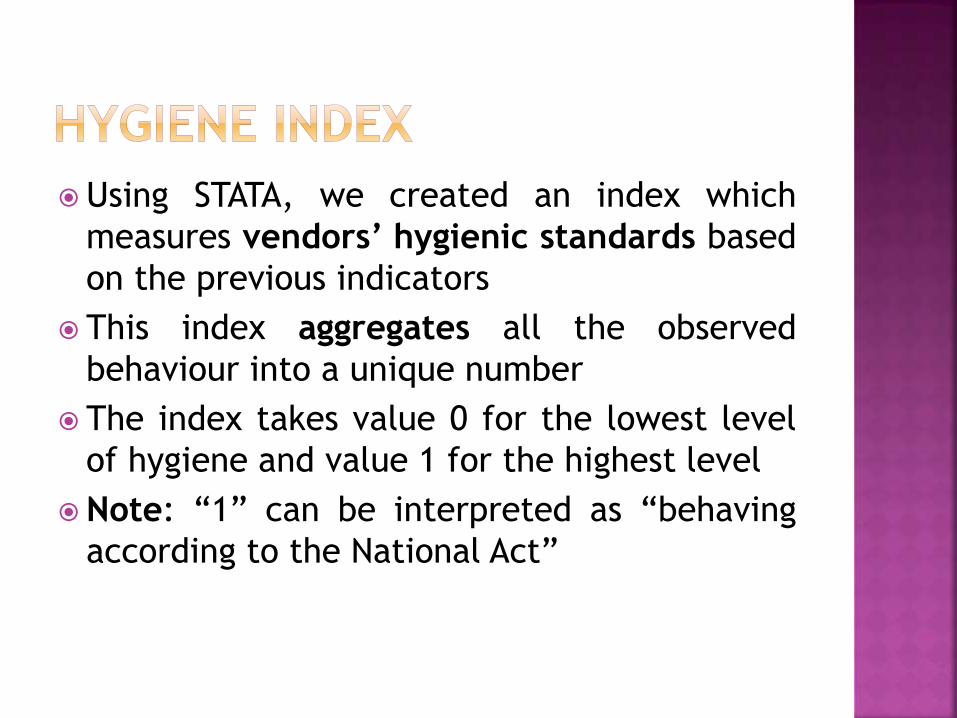
Using STATA, we created an index which
measures vendors’ hygienic standards based
on the previous indicators
This index aggregates all the observed
behaviour into a unique number
The index takes value 0 for the lowest level
of hygiene and value 1 for the highest level
Note: “1” can be interpreted as “behaving
according to the National Act”
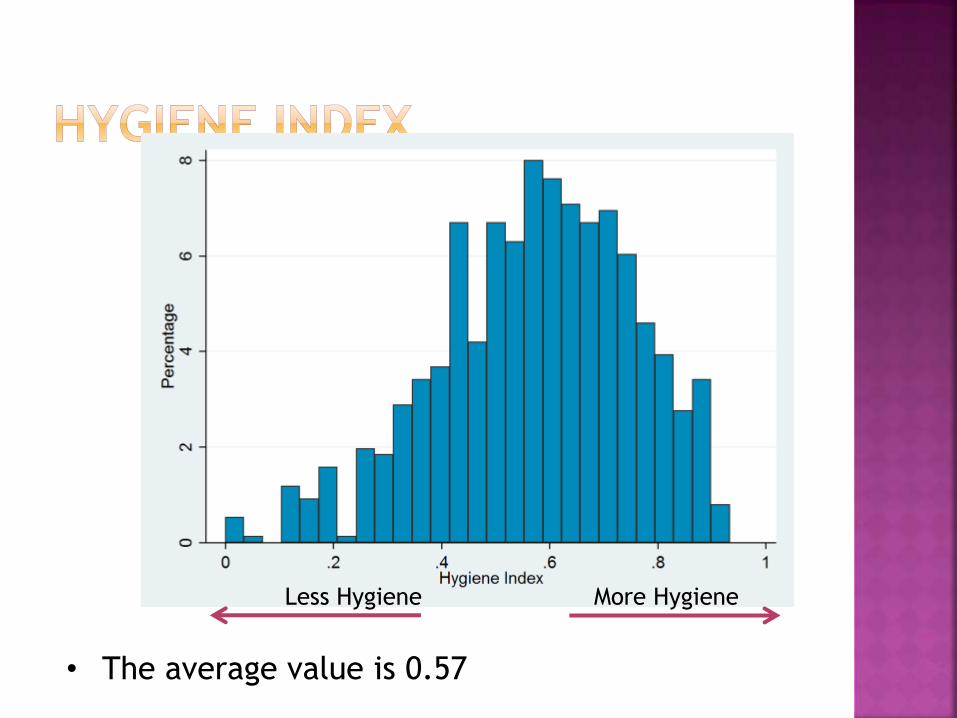
• The average value is 0.57
Less Hygiene More Hygiene
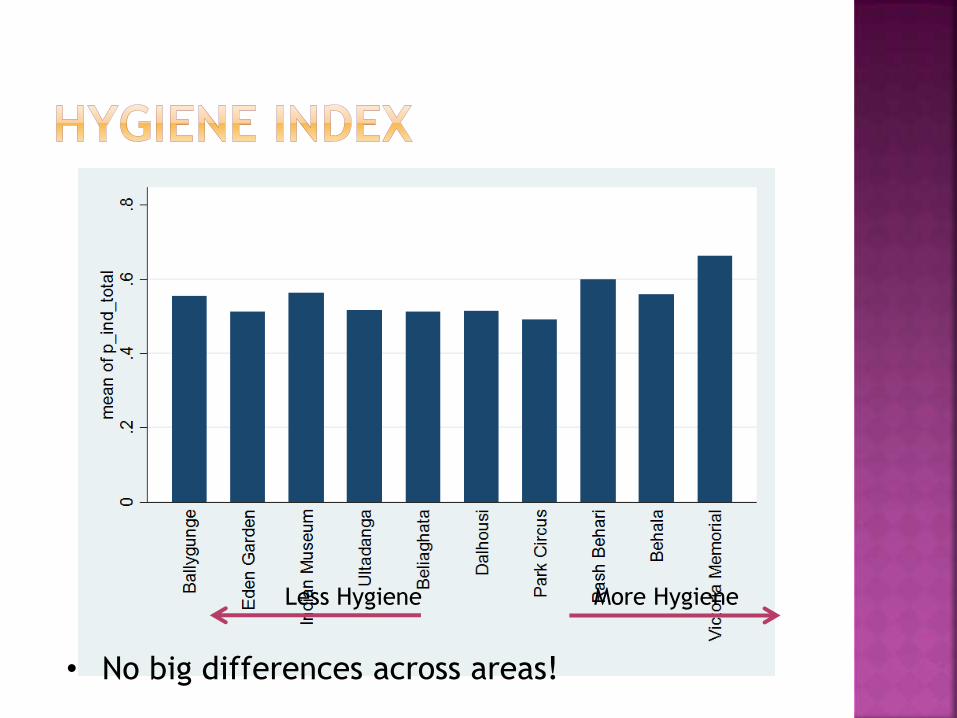
• No big differences across areas!
Less Hygiene More Hygiene