Embed Size (px)
Citation preview
ITALIAN PUBLIC TRANSPORT FUNDING
General manager ASSTRA – Emanuele Proia
Mollet del Vallès, 8th June 2016
1
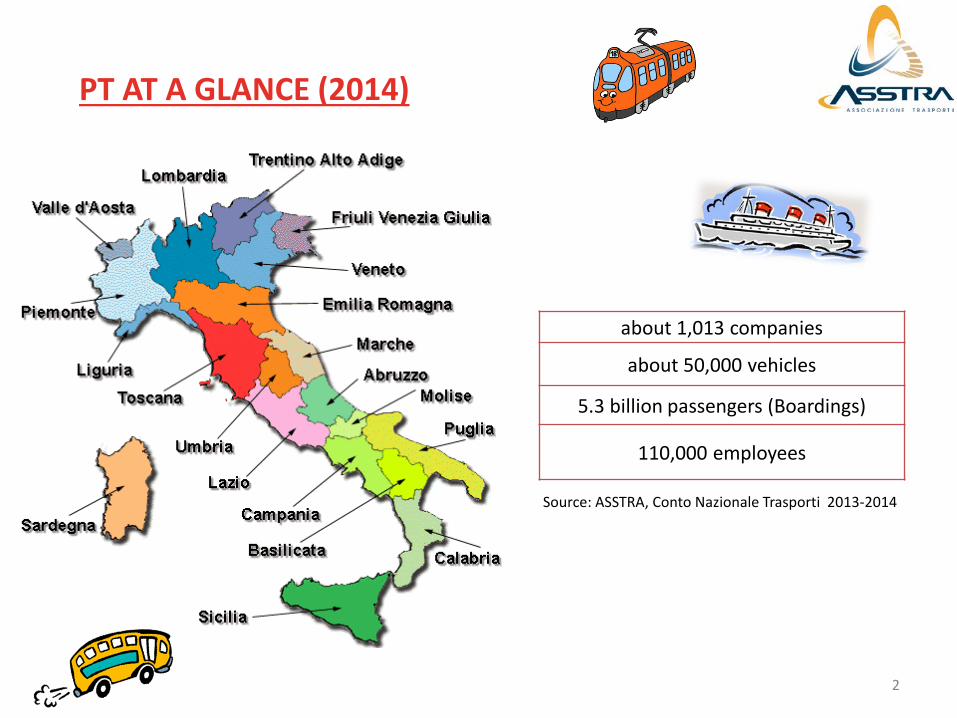
PT AT A GLANCE (2014)
about 1,013 companies
about 50,000 vehicles
5.3 billion passengers (Boardings)
110,000 employees
Source: ASSTRA, Conto Nazionale Trasporti 2013-2014
2
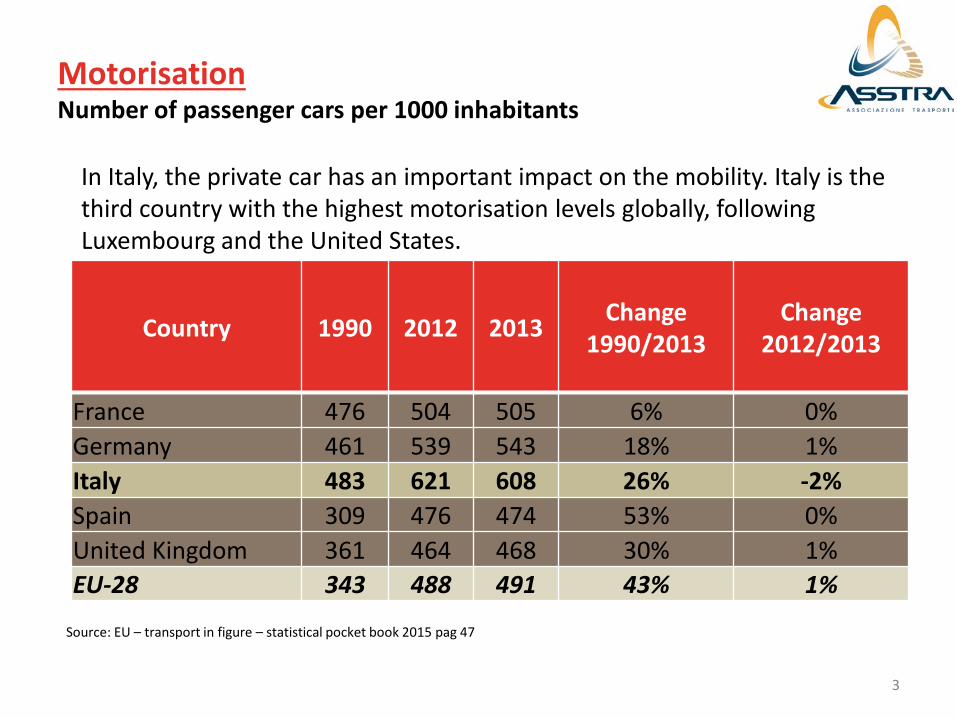
Motorisation Number of passenger cars per 1000 inhabitants
Country 1990 2012 2013 Change 1990/2013
Change 2012/2013
France 476 504 505 6% 0% Germany 461 539 543 18% 1% Italy 483 621 608 26% -2% Spain 309 476 474 53% 0% United Kingdom 361 464 468 30% 1% EU-28 343 488 491 43% 1%
Source: EU – transport in figure – statistical pocket book 2015 pag 47
In Italy, the private car has an important impact on the mobility. Italy is the third country with the highest motorisation levels globally, following Luxembourg and the United States.
3

Modal split of Passenger Transport (pkm as %; 2013)
83,9% 84,4% 79,7% 79,6%
84,6% 81,7%
5,4% 5,7% 13,2% 13,0%
5,6% 9,2%
1,6% 1,6% 0,9% 1,4% 1,6% 1,7% 9,1% 8,4% 6,3% 6,0% 8,2% 7,4%
Francia Germania Italia Spagna Regno Unito EU-28
Auto privata Bus Metro e tram Ferrovie
Total Public
Transport 15,6
Total Public
Transport 21,4
Total Public
Transport 21,3
Total Public
Transport 15,4
Total Public
Transport 19,3
Source: EU – transport in figure – statistical pocket book 2015 pag 47
Total Public
Transport 16,1
France Germany Spain United Kingdom
Italy
Passenger car
Metro and Tram Railway
Despite the high motorisation level Italy has, together with Spain, the higher total public transport share, accounting for around 21,3%.
4
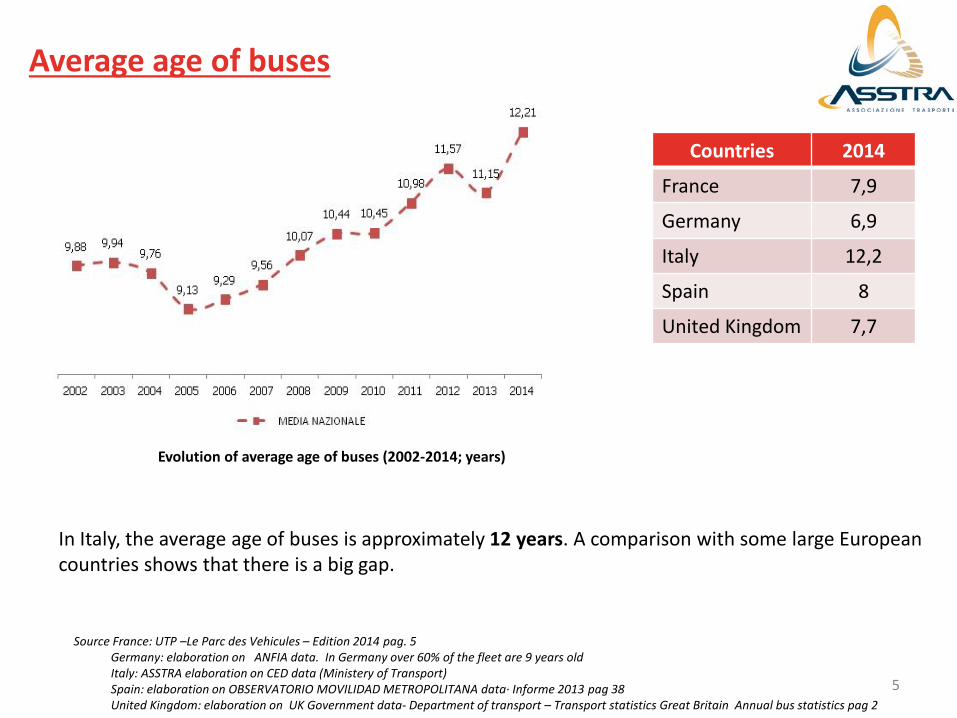
Average age of buses
Source France: UTP –Le Parc des Vehicules – Edition 2014 pag. 5 Germany: elaboration on ANFIA data. In Germany over 60% of the fleet are 9 years old Italy: ASSTRA elaboration on CED data (Ministery of Transport) Spain: elaboration on OBSERVATORIO MOVILIDAD METROPOLITANA data· Informe 2013 pag 38 United Kingdom: elaboration on UK Government data- Department of transport – Transport statistics Great Britain Annual bus statistics pag 2
Evolution of average age of buses (2002-2014; years)
In Italy, the average age of buses is approximately 12 years. A comparison with some large European countries shows that there is a big gap.
Countries 2014
France 7,9
Germany 6,9
Italy 12,2
Spain 8
United Kingdom 7,7
5
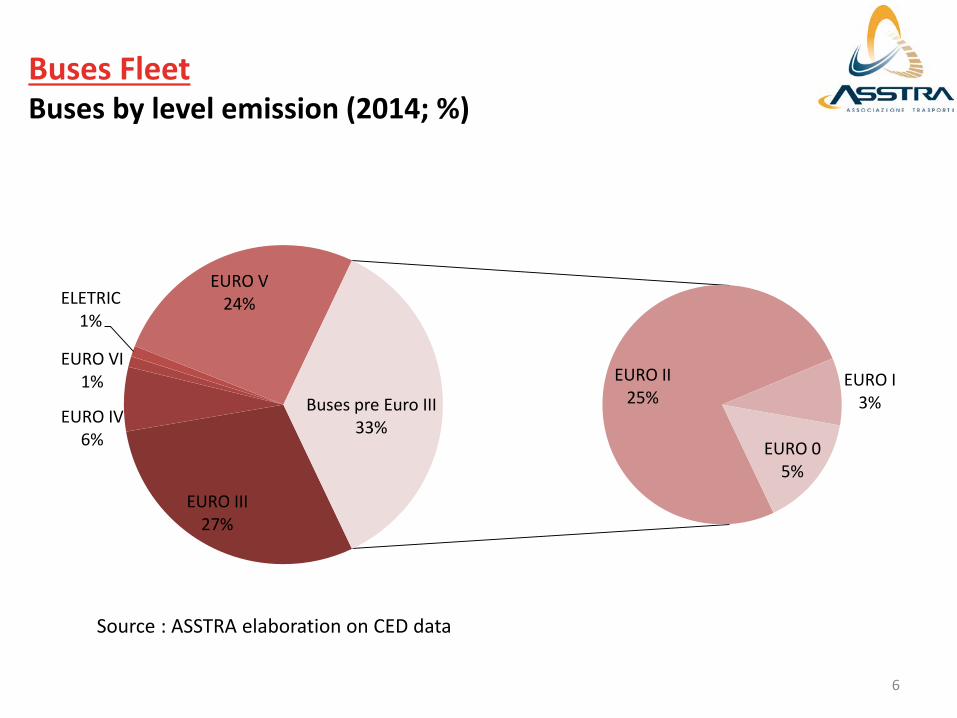
Buses Fleet Buses by level emission (2014; %)
EURO III 27%
EURO IV 6%
EURO VI 1%
ELETRIC 1%
EURO V 24%
EURO II 25%
EURO I 3%
EURO 0 5%
Buses pre Euro III 33%
Source : ASSTRA elaboration on CED data
6
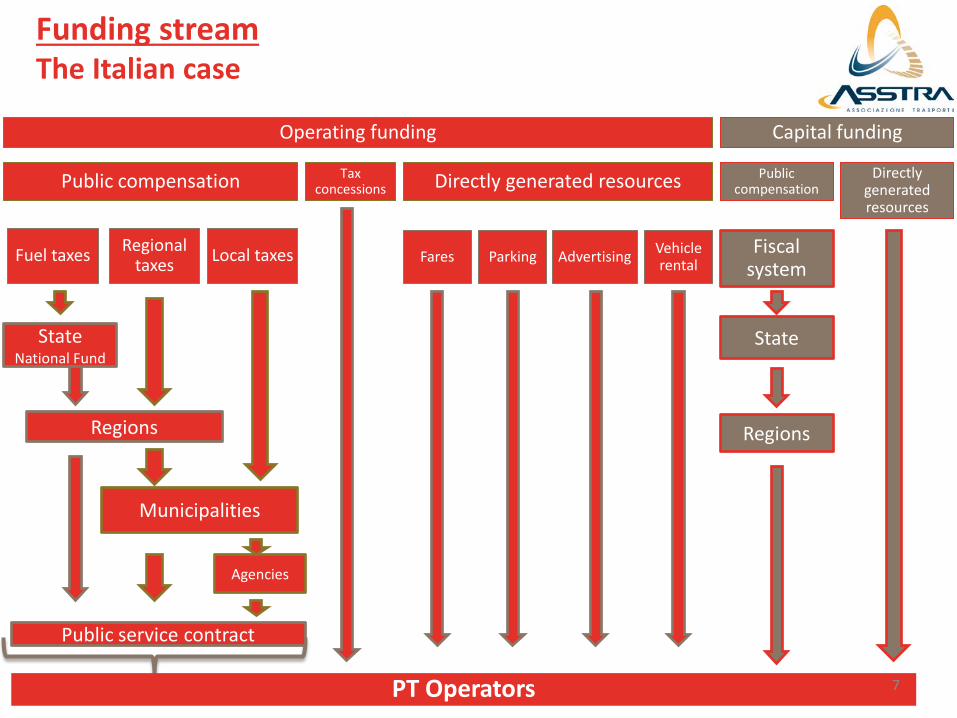
Funding stream The Italian case
State National Fund
Public compensation
Fuel taxes
Regions
PT Operators
Regional taxes
Municipalities
Directly generated resources
Public service contract
Advertising Parking Local taxes Fares Vehicle rental
Agencies
Capital funding
Fiscal system
State
Regions
Directly generated resources
Operating funding
Public compensation
Tax concessions
7
Others
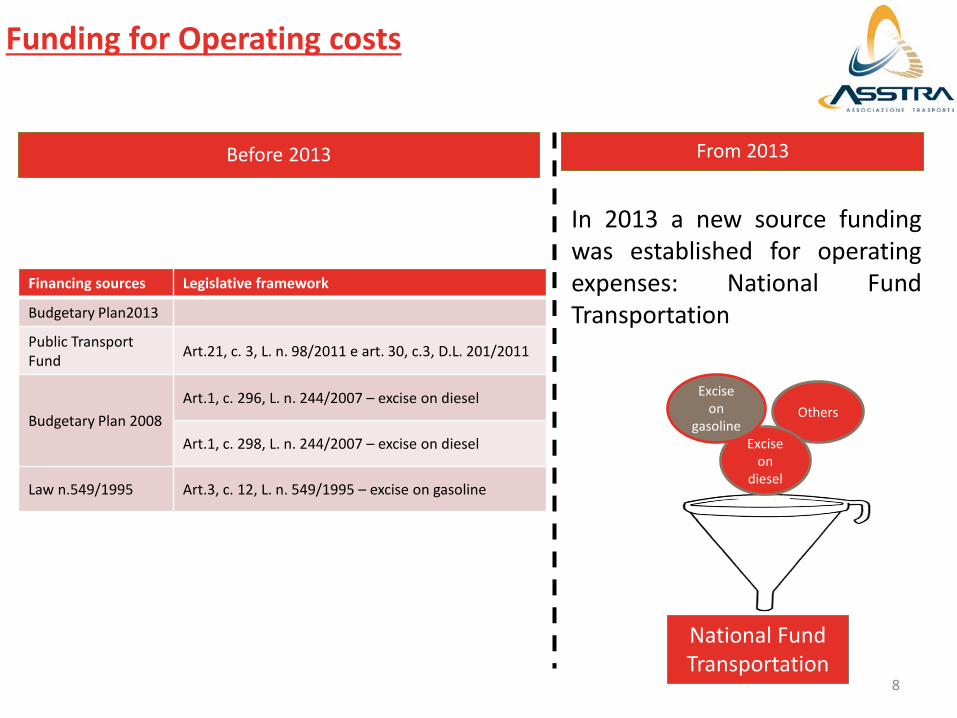
Funding for Operating costs
In 2013 a new source funding was established for operating expenses: National Fund Transportation
Excise on
diesel
Excise on
gasoline
National Fund Transportation
Financing sources Legislative framework
Budgetary Plan2013
Public Transport Fund Art.21, c. 3, L. n. 98/2011 e art. 30, c.3, D.L. 201/2011
Budgetary Plan 2008 Art.1, c. 296, L. n. 244/2007 – excise on diesel
Art.1, c. 298, L. n. 244/2007 – excise on diesel
Law n.549/1995 Art.3, c. 12, L. n. 549/1995 – excise on gasoline
Before 2013 From 2013
8
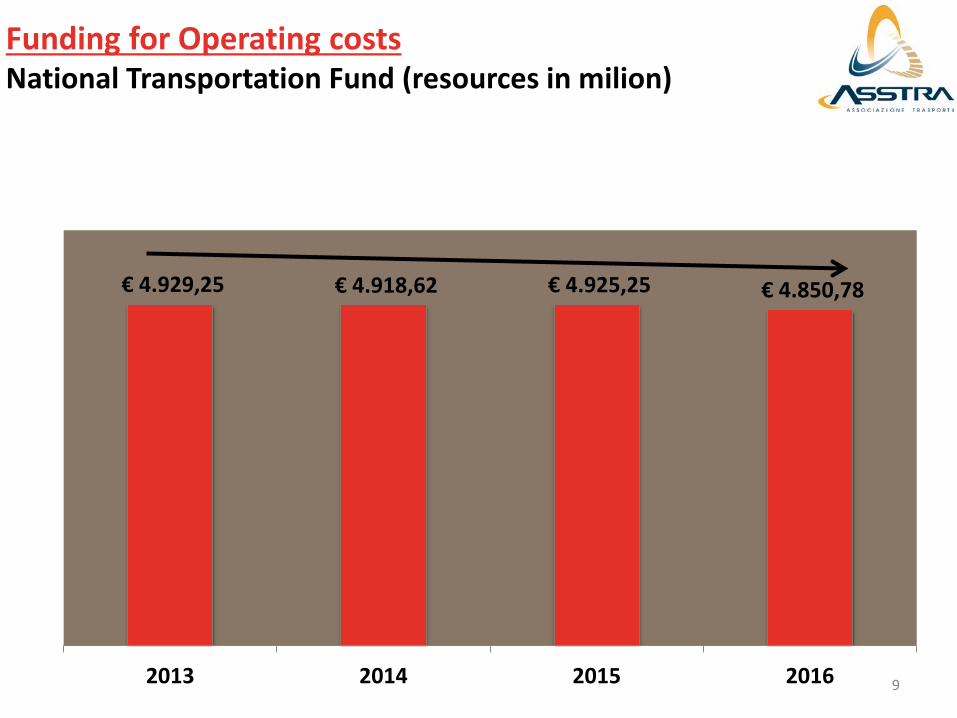
Funding for Operating costs National Transportation Fund (resources in milion)
€ 4.929,25 € 4.918,62 € 4.925,25 € 4.850,78
2013 2014 2015 2016 9
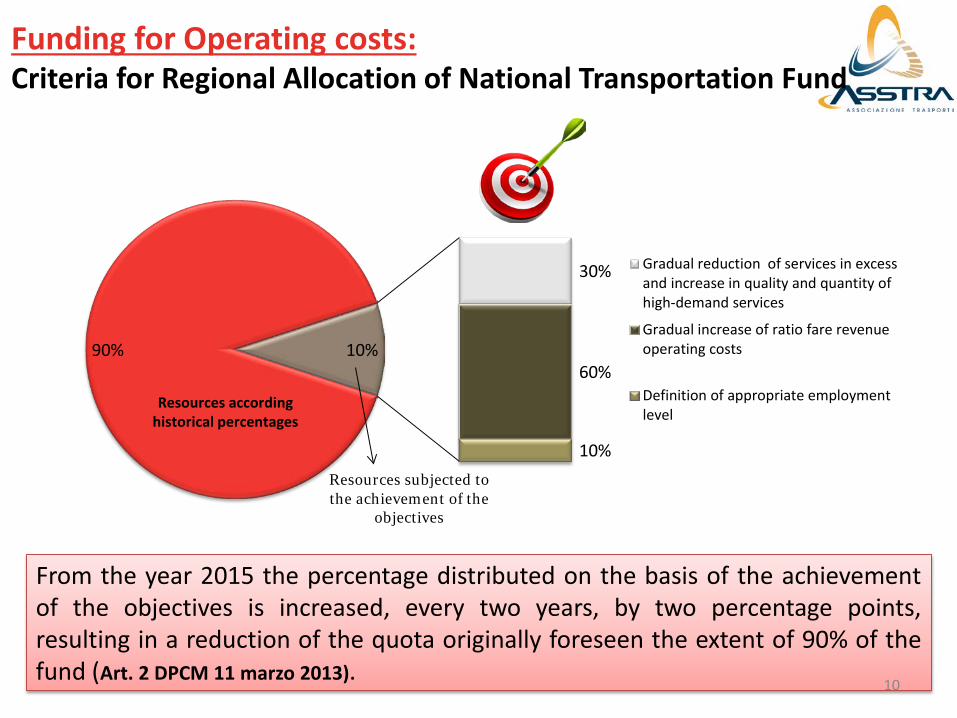
Funding for Operating costs: Criteria for Regional Allocation of National Transportation Fund
90%
30%
60%
10%
10%
Gradual reduction of services in excessand increase in quality and quantity ofhigh-demand services
Gradual increase of ratio fare revenueoperating costs
Definition of appropriate employmentlevel
Resources according historical percentages
Resources subjected to the achievement of the
objectives
From the year 2015 the percentage distributed on the basis of the achievement of the objectives is increased, every two years, by two percentage points, resulting in a reduction of the quota originally foreseen the extent of 90% of the fund (Art. 2 DPCM 11 marzo 2013).
10
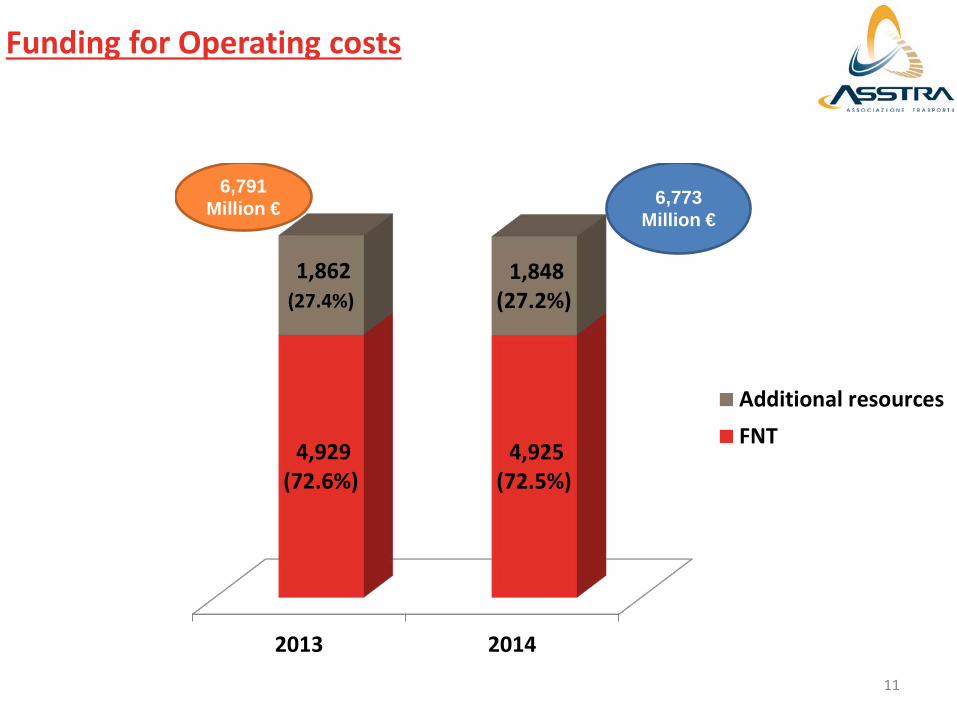
2013 2014
4,929 (72.6%)
4,925 (72.5%)
1,862 (27.4%)
1,848 (27.2%)
Additional resourcesFNT
6,773 Million €
6,791 Million €
Funding for Operating costs
11
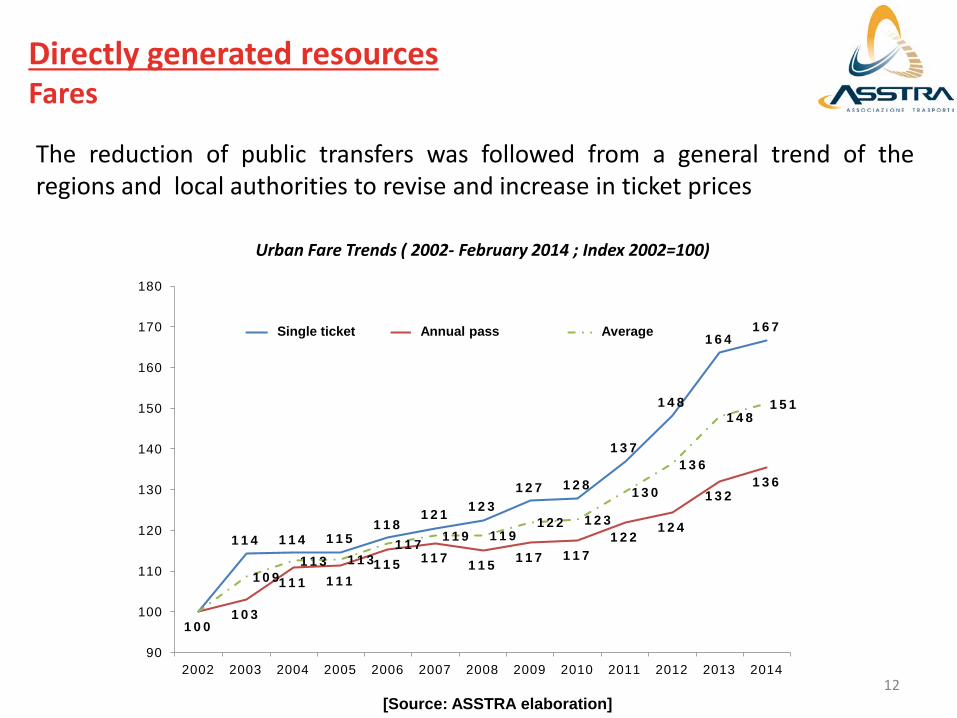
Directly generated resources Fares
114 114 115118
121 123127 128
137
148
164167
100103
111 111115 117 115 117 117
122124
132136
109113 113
117 119 119122 123
130
136
148151
90
100
110
120
130
140
150
160
170
180
2002 2003 2004 2005 2006 2007 2008 2009 2010 2011 2012 2013 2014
Biglietto a tempo Abbonamento mensile Tariffa media
Urban Fare Trends ( 2002- February 2014 ; Index 2002=100)
The reduction of public transfers was followed from a general trend of the regions and local authorities to revise and increase in ticket prices
Single ticket Annual pass Average
[Source: ASSTRA elaboration] 12
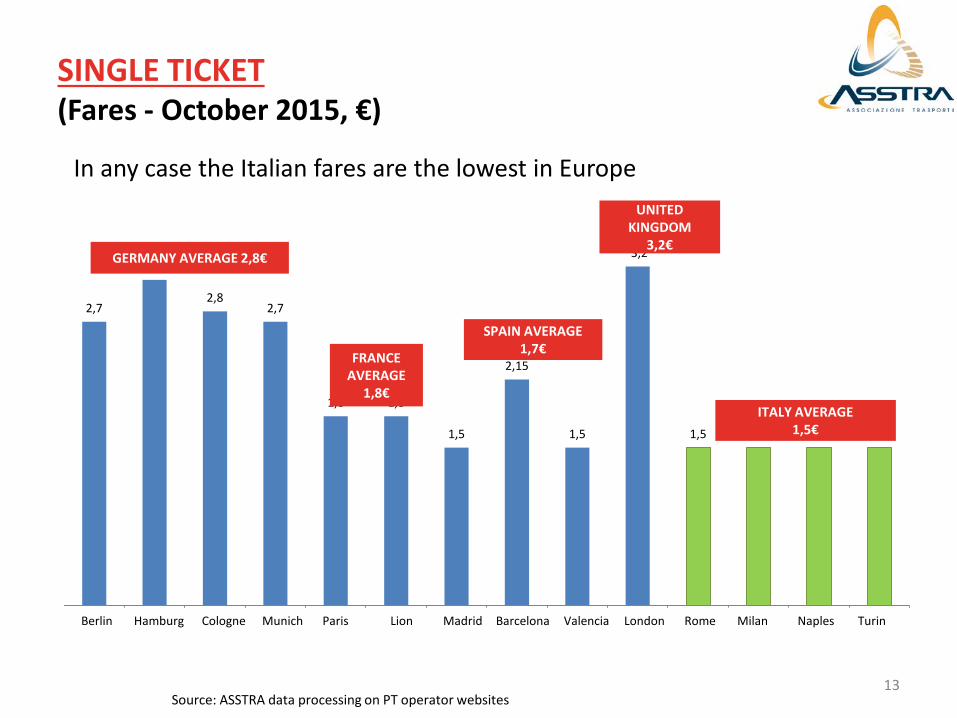
SINGLE TICKET (Fares - October 2015, €)
2,7
3,1
2,8 2,7
1,8 1,8
1,5
2,15
1,5
3,2
1,5 1,5 1,5 1,5
Berlino Amburgo Colonia Monaco Parigi Lione Madrid Barcellona Valencia Londra Roma Milano Napoli Torino
GERMANY AVERAGE 2,8€
FRANCE AVERAGE
1,8€
SPAIN AVERAGE 1,7€
ITALY AVERAGE 1,5€
UNITED KINGDOM
3,2€
Berlin Hamburg Cologne Munich Paris Lion Madrid Barcelona Valencia London Rome Milan Naples Turin
Source: ASSTRA data processing on PT operator websites
In any case the Italian fares are the lowest in Europe
13

MONTHLY PASS (Fares - October 2015, €)
Source: ASSTRA data processing on PT operator websites
79,5 84
90,2
51,6
70 60,4
54,60 52,75 45,00
173,0
35 35 42 38
Berlino Amburgo Colonia Monaco Parigi Lione Madrid Barcellona Valencia Londra Roma Milano Napoli Torino
GERMANY AVERAGE 76,9€ FRANCE AVERAGE
68,3€ SPAIN AVERAGE
52,7€
UNITED KINGDOM 173,0€
ITALY AVERAGE 36,6€
Berlin Hamburg Cologne Munich Paris Lion Madrid Barcelona Valencia London Rome Milan Naples Turin
14
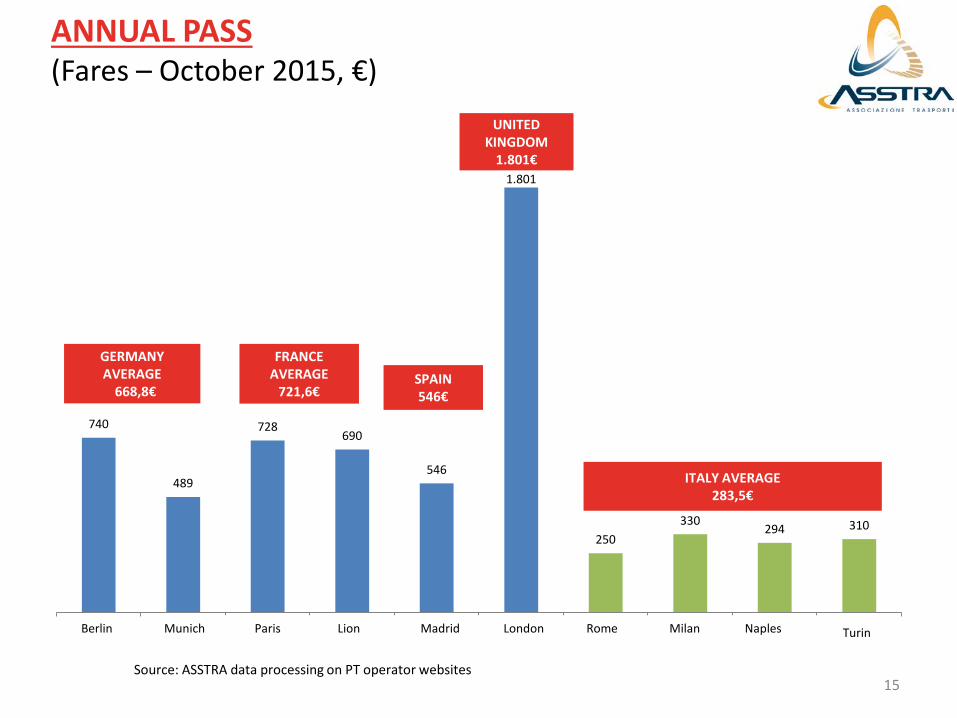
ANNUAL PASS (Fares – October 2015, €)
740
489
728 690
546
1.801
250 330
294 310
Berlino Monaco Parigi Lione Madrid Londra Roma Milano Napoli Torino
GERMANY AVERAGE 668,8€
FRANCE AVERAGE
721,6€ SPAIN 546€
UNITED KINGDOM
1.801€
ITALY AVERAGE 283,5€
Berlin Munich Paris Lion Madrid London Rome Milan Naples Turin
Source: ASSTRA data processing on PT operator websites 15

2.314
1.210
278 352 790
398
300
1997-2001 2002-2006 2007-2011 2012-2016 2017-2022
Capital investment for renew public transport fleet (1997-2022; Milion, €)
Source : ASSTRA elaboration
In the last years, in Italy, the LPT sector has witnessed an overall decline in resources for investment for renew fleet, moreover, between 2012-2016, the resources was cut of about 700 milion € and used by the regions to the achievement of fiscal targets.
16

Capital investment for Public Transport infrastructures
In the last Economic and Finance Document (2016) resources are been allocated for various metropolitan and tranway infrastructures
•Interconnection Rebaudengo – Turin railway link •Turin underground •Milan – Monza Underground M5 •Milan Line M4 Lorenteggio Linate •Rome Underground Line C •Naples – Line 6 •Naples - Line 1 •Circumetna (Catania) •Palermo •Tramway of Florence •Light rail/Underground Bologna
TOTAL COST: 12.141 € MILLION TOTAL RESOURCES: 10.374 € MILLION % COVERAGE : 85% PERIOD WORKS: 2016-2020
17
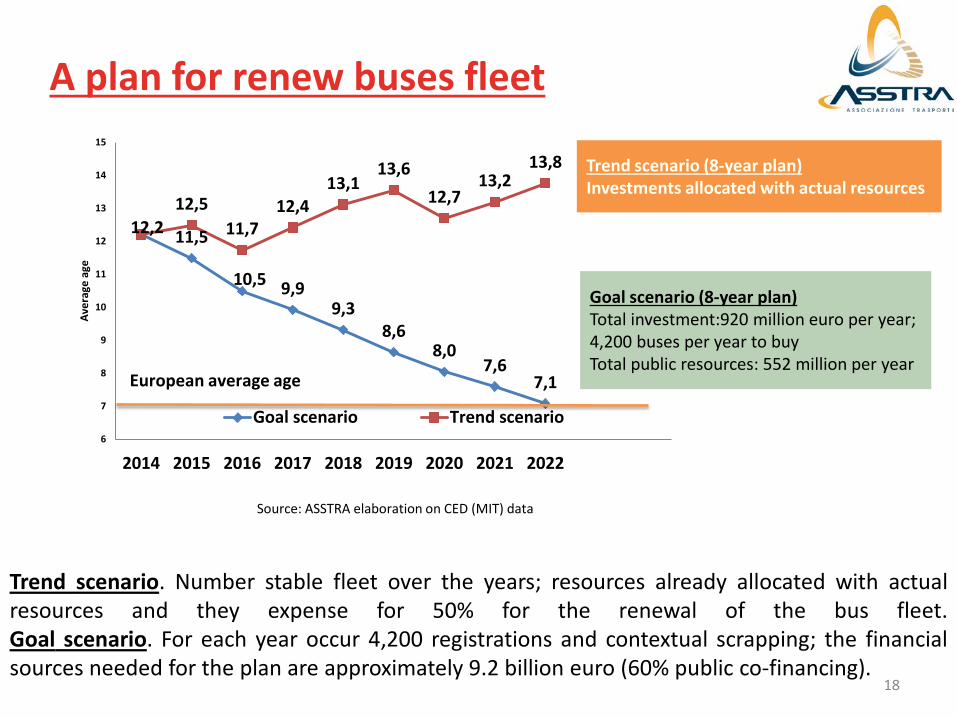
A plan for renew buses fleet
11,5
10,5 9,9 9,3
8,6 8,0
7,6 7,1
12,2 12,5
11,7 12,4
13,1 13,6
12,7 13,2
13,8
6
7
8
9
10
11
12
13
14
15
2014 2015 2016 2017 2018 2019 2020 2021 2022
Aver
age
age
Goal scenario Trend scenario
European average age
Source: ASSTRA elaboration on CED (MIT) data
Trend scenario. Number stable fleet over the years; resources already allocated with actual resources and they expense for 50% for the renewal of the bus fleet. Goal scenario. For each year occur 4,200 registrations and contextual scrapping; the financial sources needed for the plan are approximately 9.2 billion euro (60% public co-financing).
Goal scenario (8-year plan) Total investment:920 million euro per year; 4,200 buses per year to buy Total public resources: 552 million per year
Trend scenario (8-year plan) Investments allocated with actual resources
18
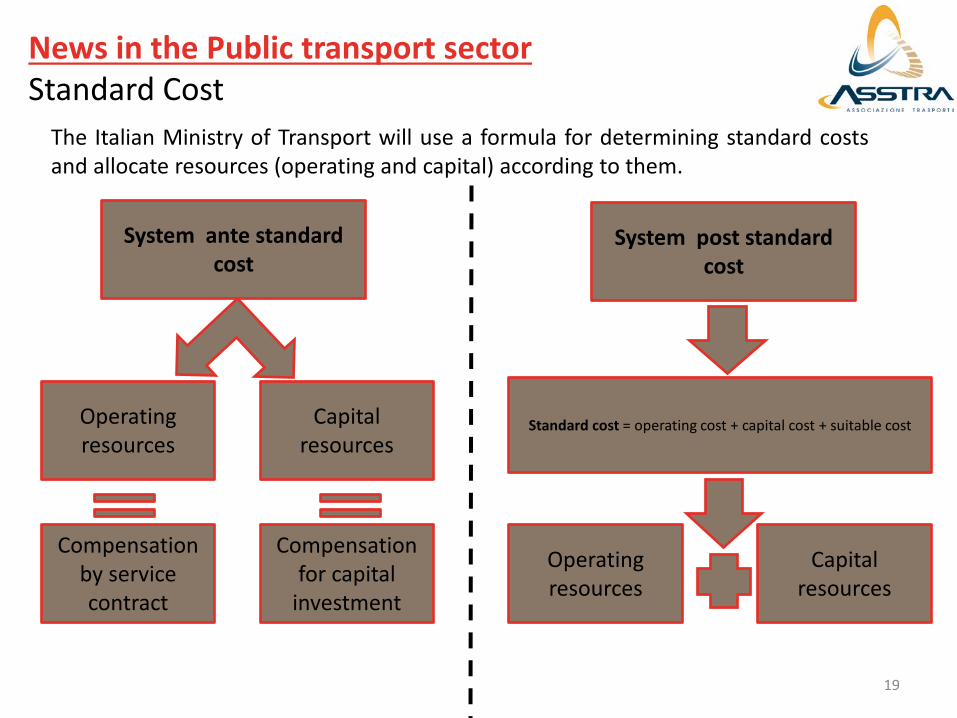
News in the Public transport sector Standard Cost
System ante standard cost
Operating resources
Capital resources
Compensation by service contract
Compensation for capital
investment
System post standard cost
Operating resources
Capital resources
Standard cost = operating cost + capital cost + suitable cost
The Italian Ministry of Transport will use a formula for determining standard costs and allocate resources (operating and capital) according to them.
19
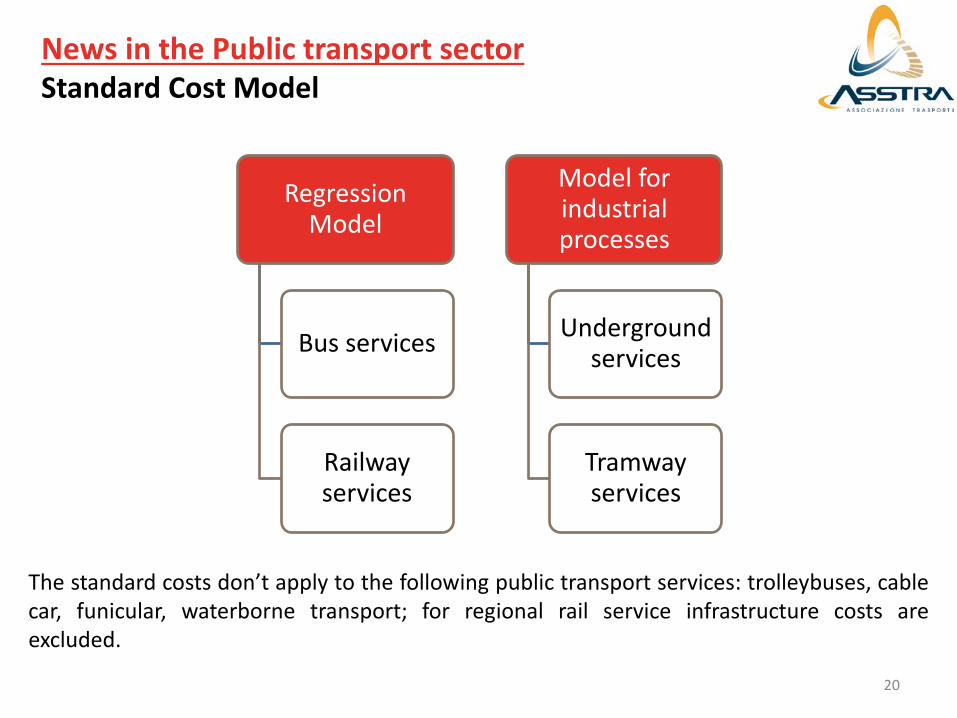
News in the Public transport sector Standard Cost Model
Regression Model
Bus services
Railway services
Model for industrial processes
Underground services
Tramway services
The standard costs don’t apply to the following public transport services: trolleybuses, cable car, funicular, waterborne transport; for regional rail service infrastructure costs are excluded.
20
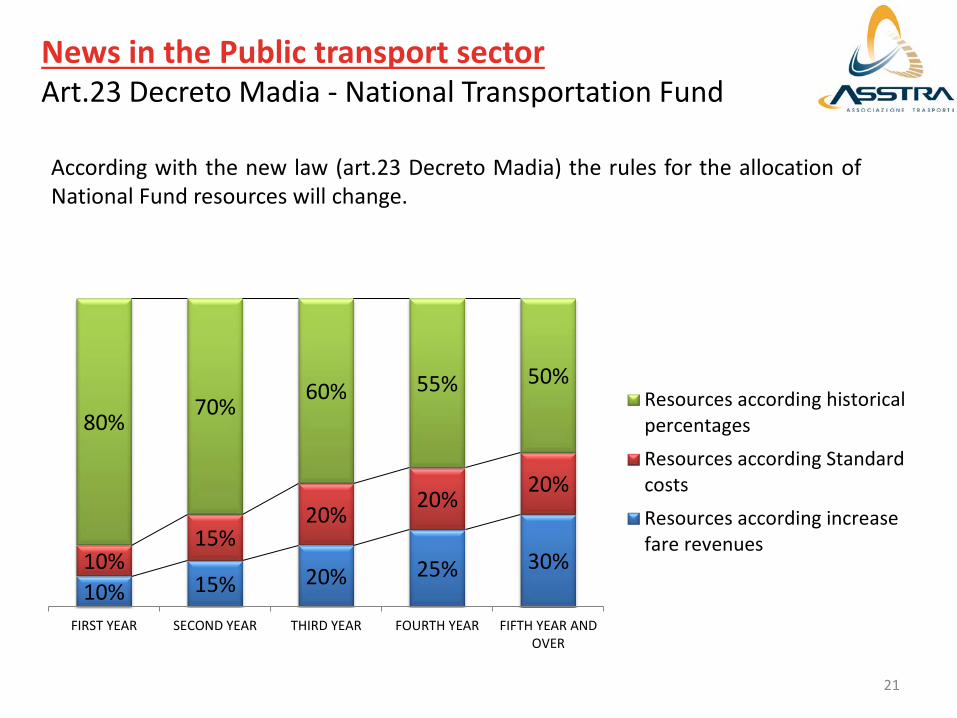
News in the Public transport sector Art.23 Decreto Madia - National Transportation Fund
10% 15% 20% 25% 30% 10% 15%
20% 20%
20%
80% 70%
60% 55% 50%
FIRST YEAR SECOND YEAR THIRD YEAR FOURTH YEAR FIFTH YEAR ANDOVER
Resources according historicalpercentagesResources according StandardcostsResources according increasefare revenues
According with the new law (art.23 Decreto Madia) the rules for the allocation of National Fund resources will change.
21
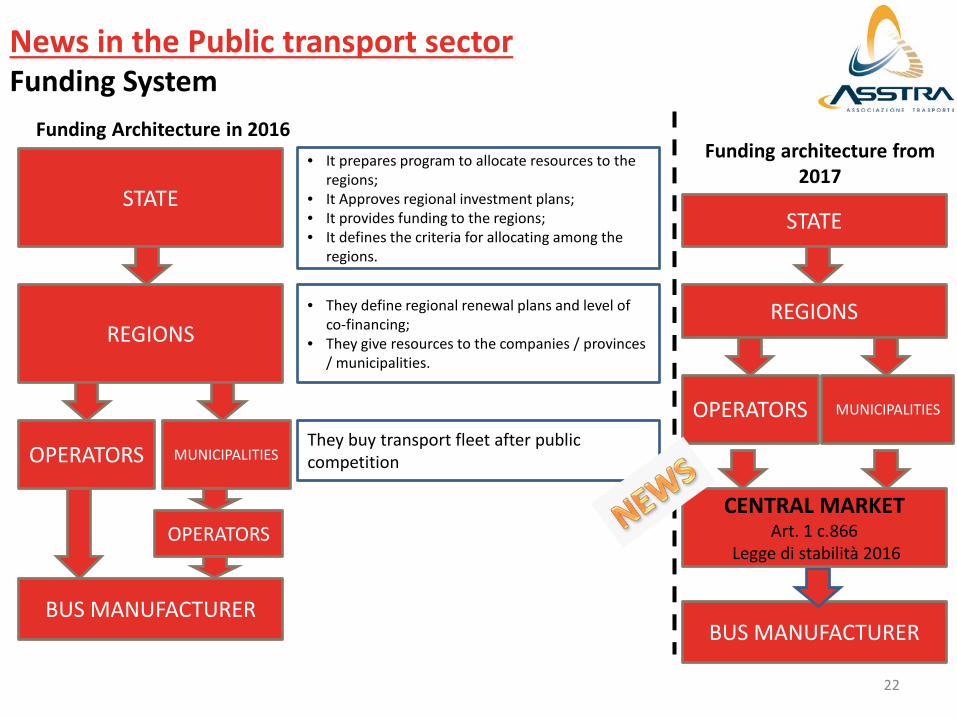
News in the Public transport sector Funding System
Funding Architecture in 2016
STATE
REGIONS
• It prepares program to allocate resources to the regions;
• It Approves regional investment plans; • It provides funding to the regions; • It defines the criteria for allocating among the
regions.
OPERATORS
BUS MANUFACTURER
• They define regional renewal plans and level of co-financing;
• They give resources to the companies / provinces / municipalities.
They buy transport fleet after public competition
STATE
REGIONS
BUS MANUFACTURER
CENTRAL MARKET Art. 1 c.866
Legge di stabilità 2016
Funding architecture from 2017
MUNICIPALITIES
OPERATORS
OPERATORS MUNICIPALITIES
22