Embed Size (px)
Citation preview

Recommenders, Topics, and Text
Susan Athey and Guido Imbens, Stanford UniversityNBER Methods Lectures, 2015

Introduction
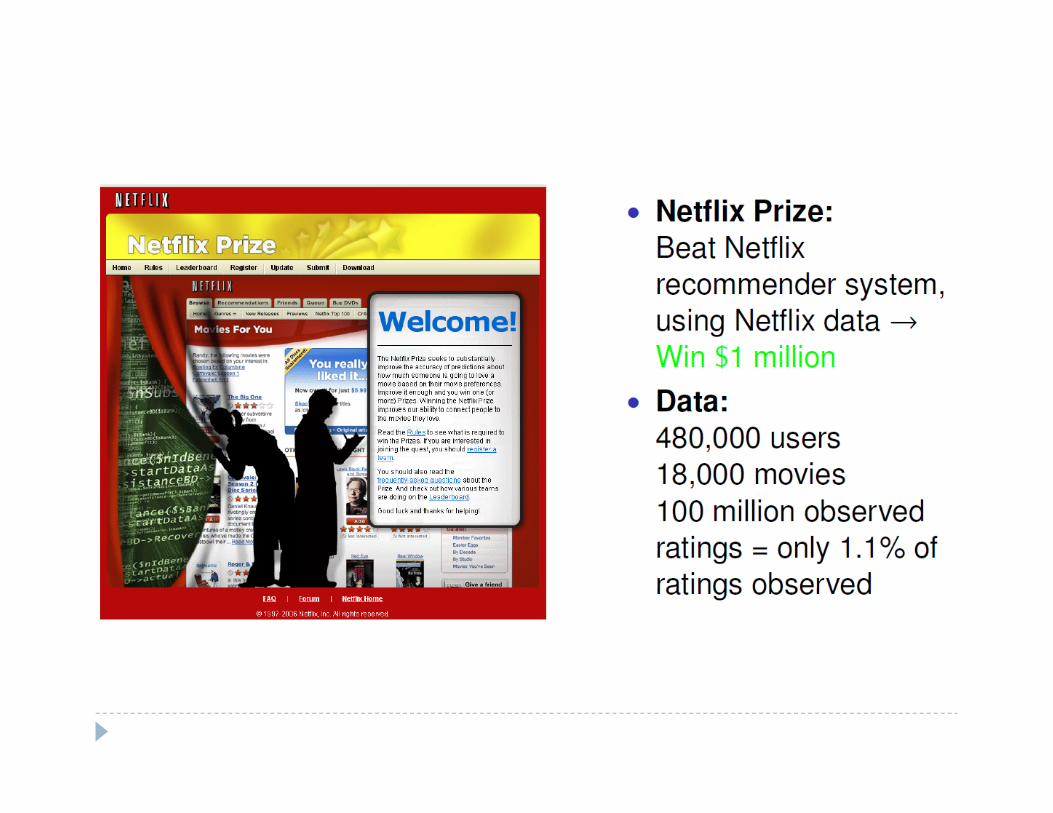
Recommendation Systems Predict whether a user will like an item (or how much: here binary choice for simplicity) Scenarios: what is observed?
Lots of users and lots of items Observable item characteristics Matrix of users x choices with 1’s (or ratings) for items consumer likes/chose in past
Economics Literature Obvious connection to discrete choice modeling Multiple choices per user Small literature incorporating multiple choices: voting records, Neilsen TV viewing, school choice, small
supermarket bundles
ML Literature Massive literature with lots of disconnected subliteratures: too many to cite Netflix challenge results (and almost all contests): average of hundreds of models Big strength: incorporating multiple sparse choice data at scale Focus on prediction, not interpretability or counterfactual prediction, but some approaches deliver
interpretability and parameters that look like primitives
For economic applications: ML methods have a lot of promise for large scale choice modeling, but more work to tailor them to
economist’s needs/tastes. One strand of literature builds models with latent variables that connect closely to structural economic models.
Strands of Recommendation Literature“Unsupervised”: Item Similarity Suppose observe item
characteristics Recommend similar items to
what the user likes Use unsupervised learning
techniques to reduce dimensionality (see earlier lectures)
“Supervised”: Collaborative Filtering Suppose observe choice
data but limited item characteristics
Find other users with similar tastes
Recommend items liked by similar users
E.g. Matrix decomposition
Hierarchical/Graphical Models
Bringing in User Choice Data It can be useful to model item cluster/topics SEPARATELY
from user data if: You want to make predictions when the context changes Website may change what types of articles it displays together;
journal may do special issues or article groupings
It can be useful to model topics together with user data if: You want to make the best possible recommendations in a
stable context
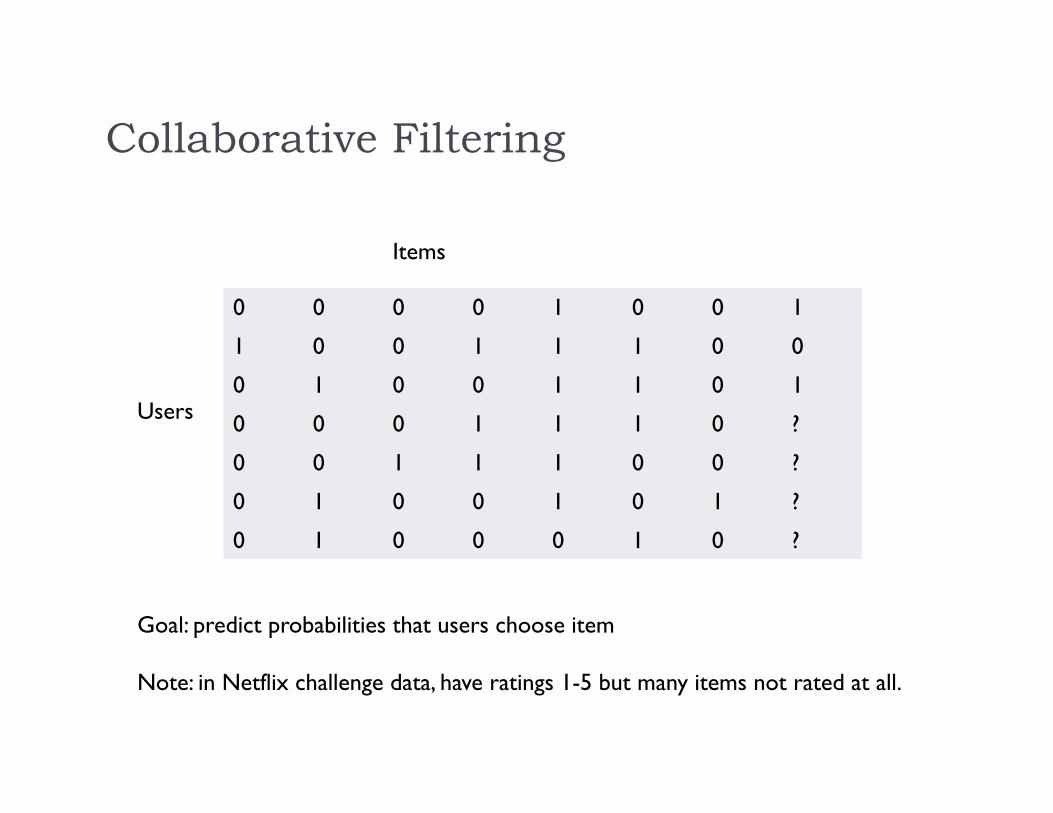
Collaborative Filtering
0 0 0 0 1 0 0 1
1 0 0 1 1 1 0 0
0 1 0 0 1 1 0 1
0 0 0 1 1 1 0 ?
0 0 1 1 1 0 0 ?
0 1 0 0 1 0 1 ?
0 1 0 0 0 1 0 ?
Items
Users
Goal: predict probabilities that users choose item
Note: in Netflix challenge data, have ratings 1-5 but many items not rated at all.
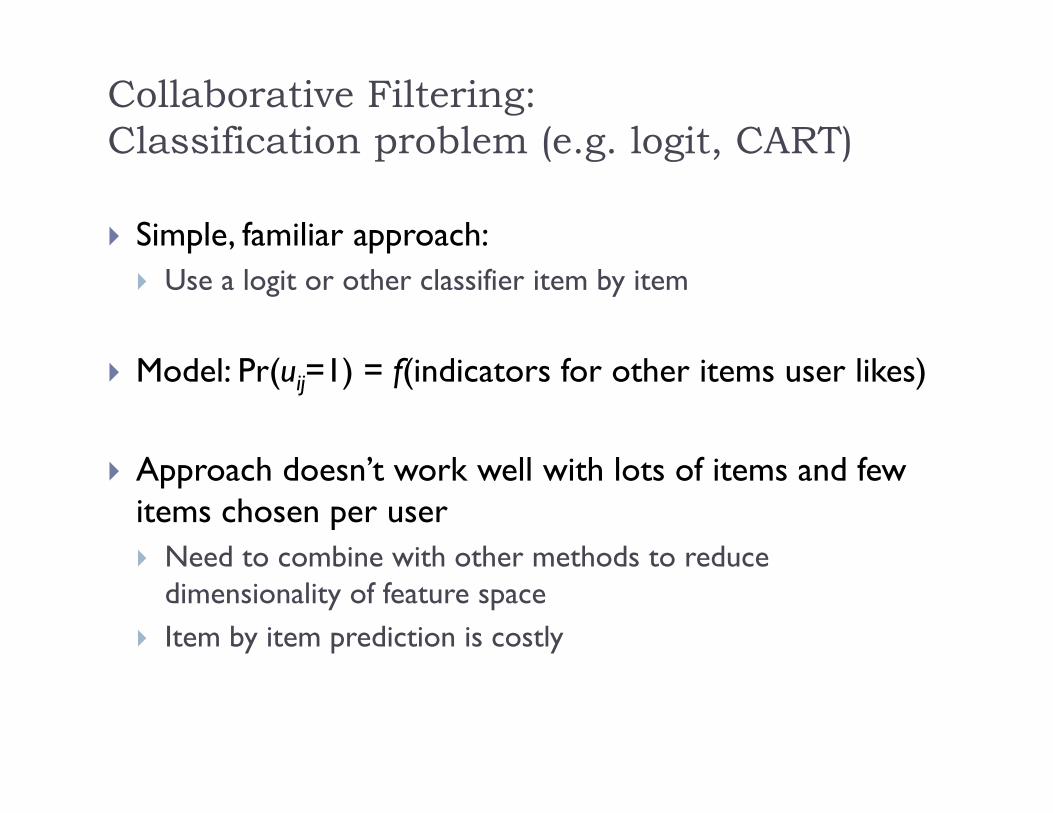
Collaborative Filtering:Classification problem (e.g. logit, CART)
Simple, familiar approach: Use a logit or other classifier item by item
Model: Pr(uij=1) = f(indicators for other items user likes)
Approach doesn’t work well with lots of items and few items chosen per user Need to combine with other methods to reduce
dimensionality of feature space Item by item prediction is costly
K-nearest neighbor (KNN) Prediction
To predict Pr(uij=1): Compute similarity between item j and all other items Find the k closest by similarity metric Calculate weighted average of user choices of the neighbor items
Similarity: Measured in terms of user preference vectors Cosine similarity: the angle between the vectors
Very popular method! Easy and fast.
Cons With sparse matrix, may predict a lot of zeros May not work very well with simple weights More complex versions “learn”=estimate weights, but if you want to estimate a
model, other models may work better
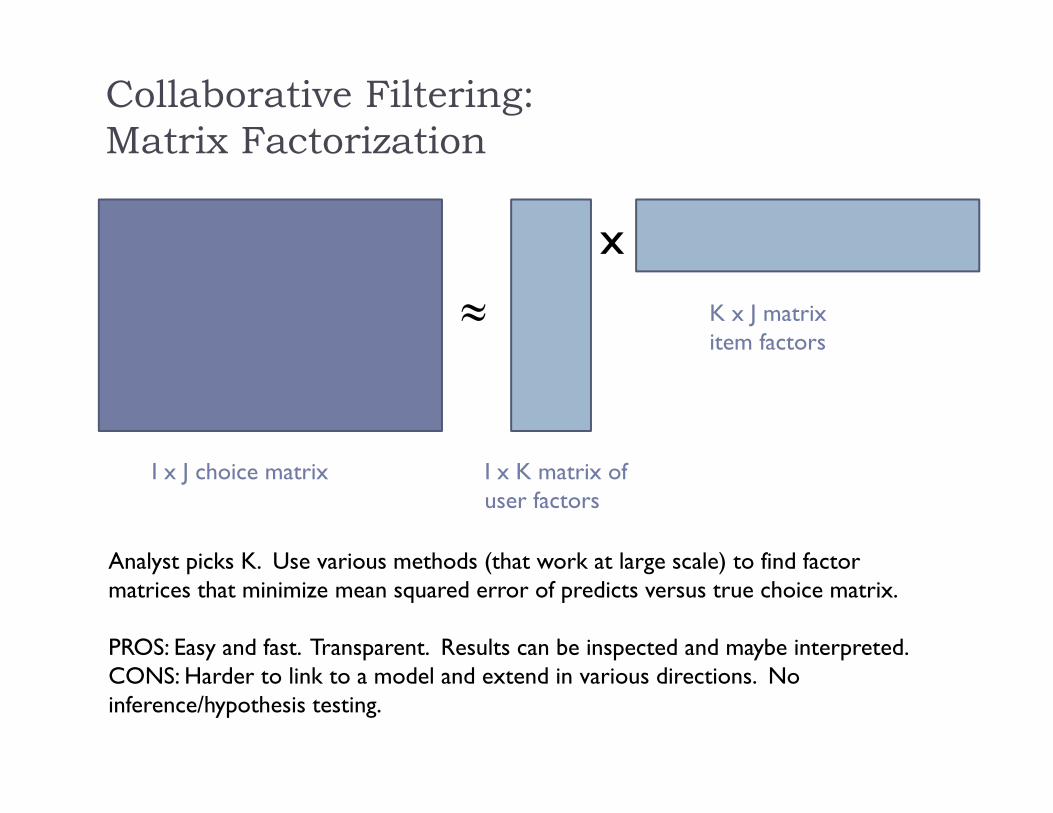
Collaborative Filtering:Matrix Factorization
x
I x J choice matrix I x K matrix of user factors
K x J matrixitem factors
Analyst picks K. Use various methods (that work at large scale) to find factor matrices that minimize mean squared error of predicts versus true choice matrix.
PROS: Easy and fast. Transparent. Results can be inspected and maybe interpreted.CONS: Harder to link to a model and extend in various directions. No inference/hypothesis testing.
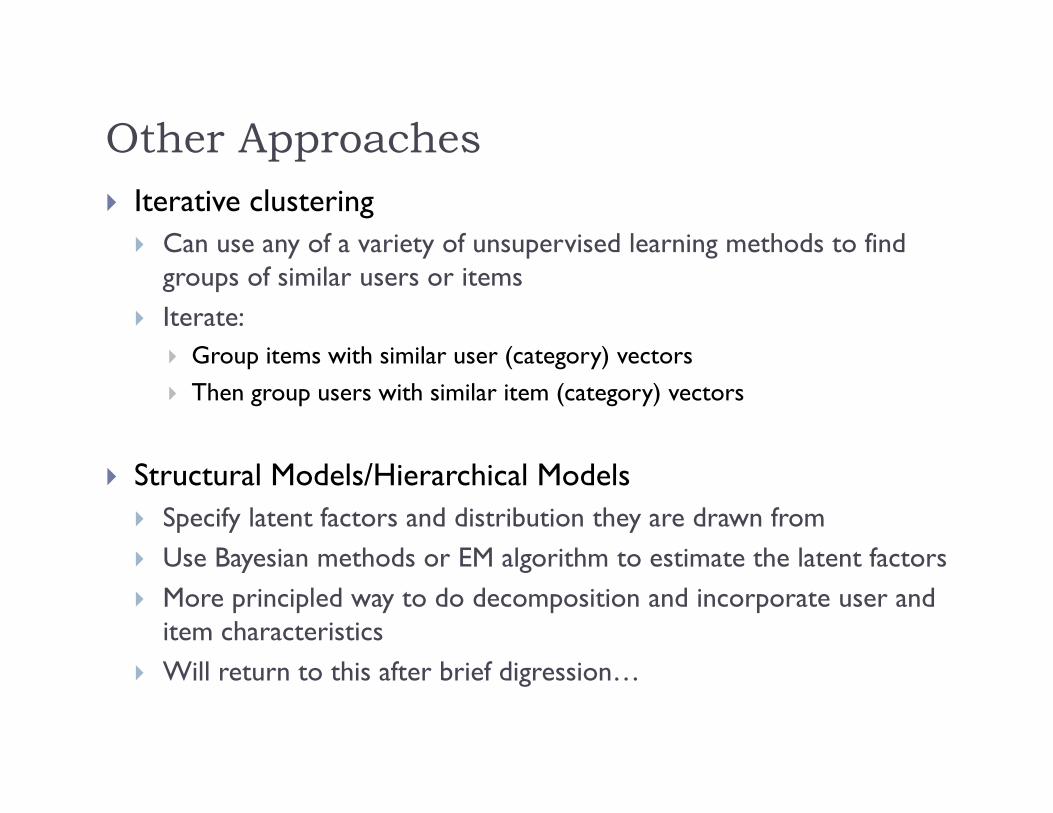
Other Approaches Iterative clustering Can use any of a variety of unsupervised learning methods to find
groups of similar users or items Iterate:
Group items with similar user (category) vectors Then group users with similar item (category) vectors
Structural Models/Hierarchical Models Specify latent factors and distribution they are drawn from Use Bayesian methods or EM algorithm to estimate the latent factors More principled way to do decomposition and incorporate user and
item characteristics Will return to this after brief digression…

Recommendations and Topic Modeling for Documents and Text
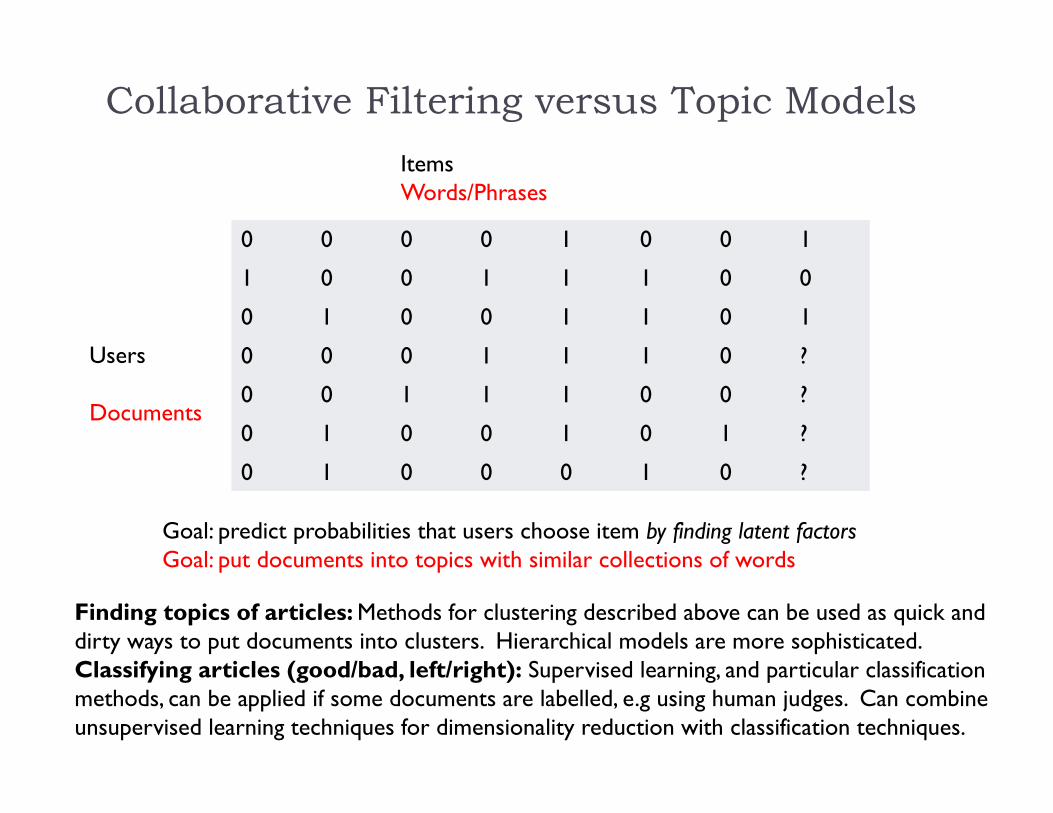
Collaborative Filtering versus Topic Models
0 0 0 0 1 0 0 1
1 0 0 1 1 1 0 0
0 1 0 0 1 1 0 1
0 0 0 1 1 1 0 ?
0 0 1 1 1 0 0 ?
0 1 0 0 1 0 1 ?
0 1 0 0 0 1 0 ?
ItemsWords/Phrases
Users
Documents
Goal: predict probabilities that users choose item by finding latent factorsGoal: put documents into topics with similar collections of words
Finding topics of articles: Methods for clustering described above can be used as quick and dirty ways to put documents into clusters. Hierarchical models are more sophisticated.Classifying articles (good/bad, left/right): Supervised learning, and particular classification methods, can be applied if some documents are labelled, e.g using human judges. Can combine unsupervised learning techniques for dimensionality reduction with classification techniques.
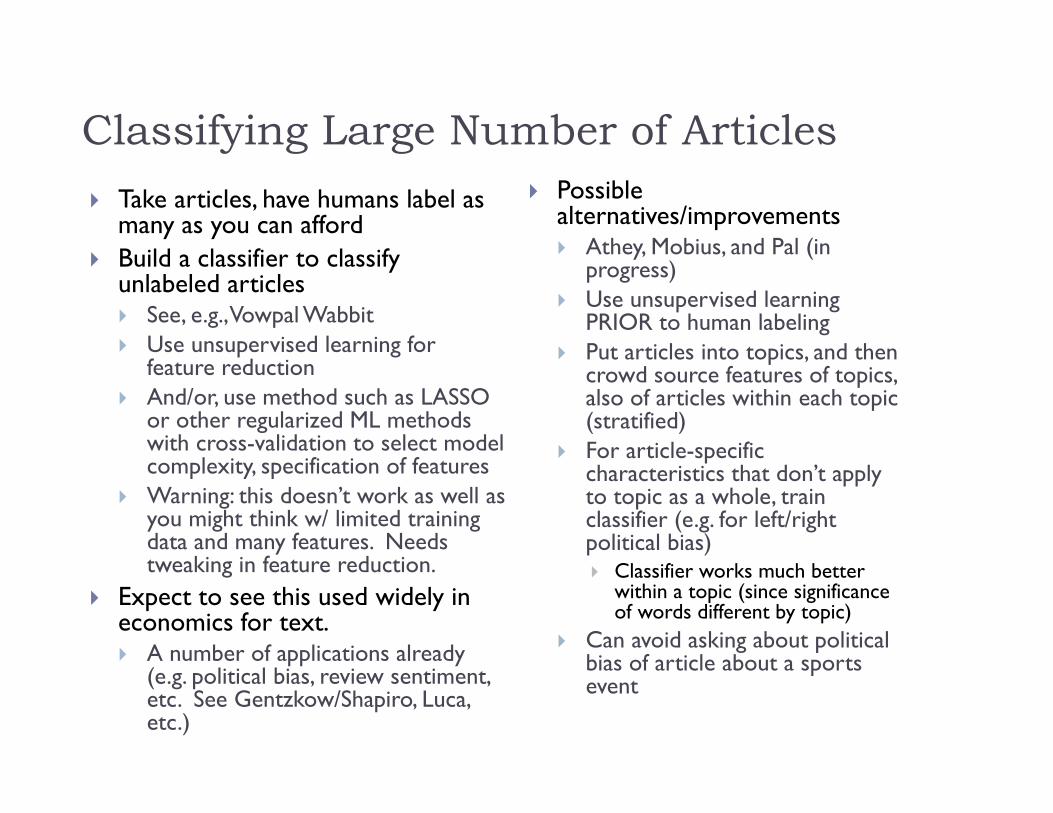
Classifying Large Number of Articles Take articles, have humans label as
many as you can afford Build a classifier to classify
unlabeled articles See, e.g., Vowpal Wabbit Use unsupervised learning for
feature reduction And/or, use method such as LASSO
or other regularized ML methods with cross-validation to select model complexity, specification of features
Warning: this doesn’t work as well as you might think w/ limited training data and many features. Needs tweaking in feature reduction.
Expect to see this used widely in economics for text. A number of applications already
(e.g. political bias, review sentiment, etc. See Gentzkow/Shapiro, Luca, etc.)
Possible alternatives/improvements Athey, Mobius, and Pal (in
progress) Use unsupervised learning
PRIOR to human labeling Put articles into topics, and then
crowd source features of topics, also of articles within each topic (stratified)
For article-specific characteristics that don’t apply to topic as a whole, train classifier (e.g. for left/right political bias) Classifier works much better
within a topic (since significance of words different by topic)
Can avoid asking about political bias of article about a sports event
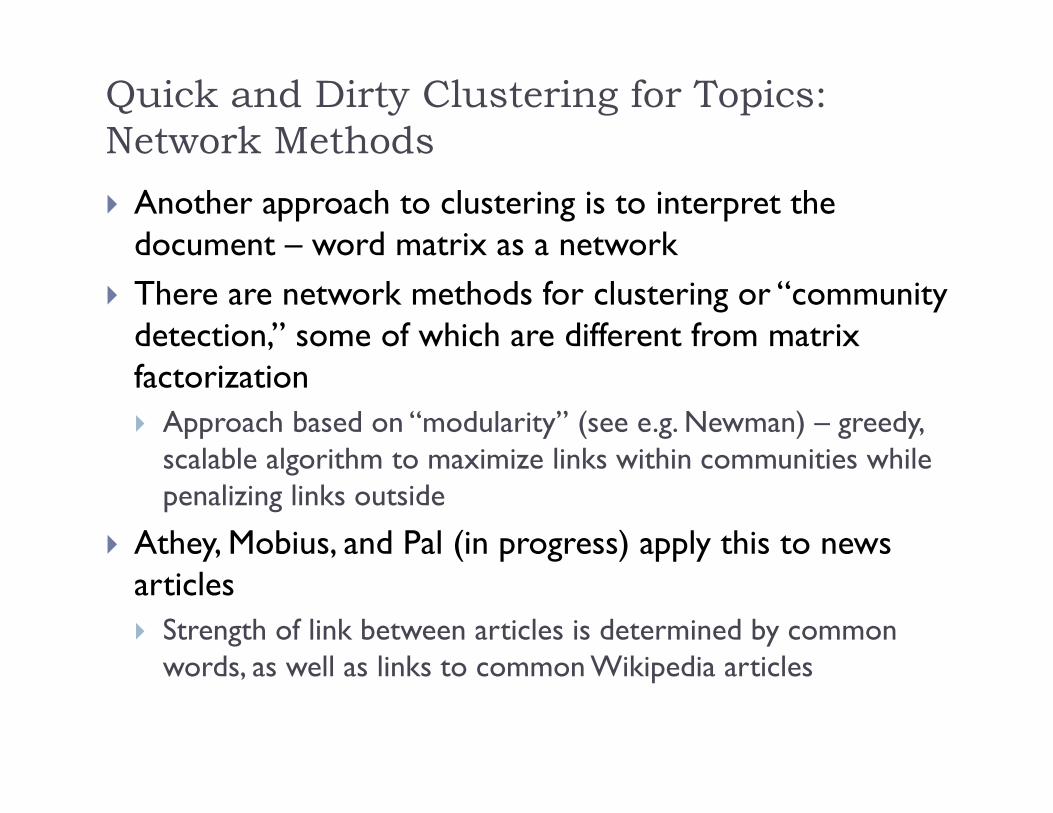
Quick and Dirty Clustering for Topics:Network Methods Another approach to clustering is to interpret the
document – word matrix as a network There are network methods for clustering or “community
detection,” some of which are different from matrix factorization Approach based on “modularity” (see e.g. Newman) – greedy,
scalable algorithm to maximize links within communities while penalizing links outside
Athey, Mobius, and Pal (in progress) apply this to news articles Strength of link between articles is determined by common
words, as well as links to common Wikipedia articles
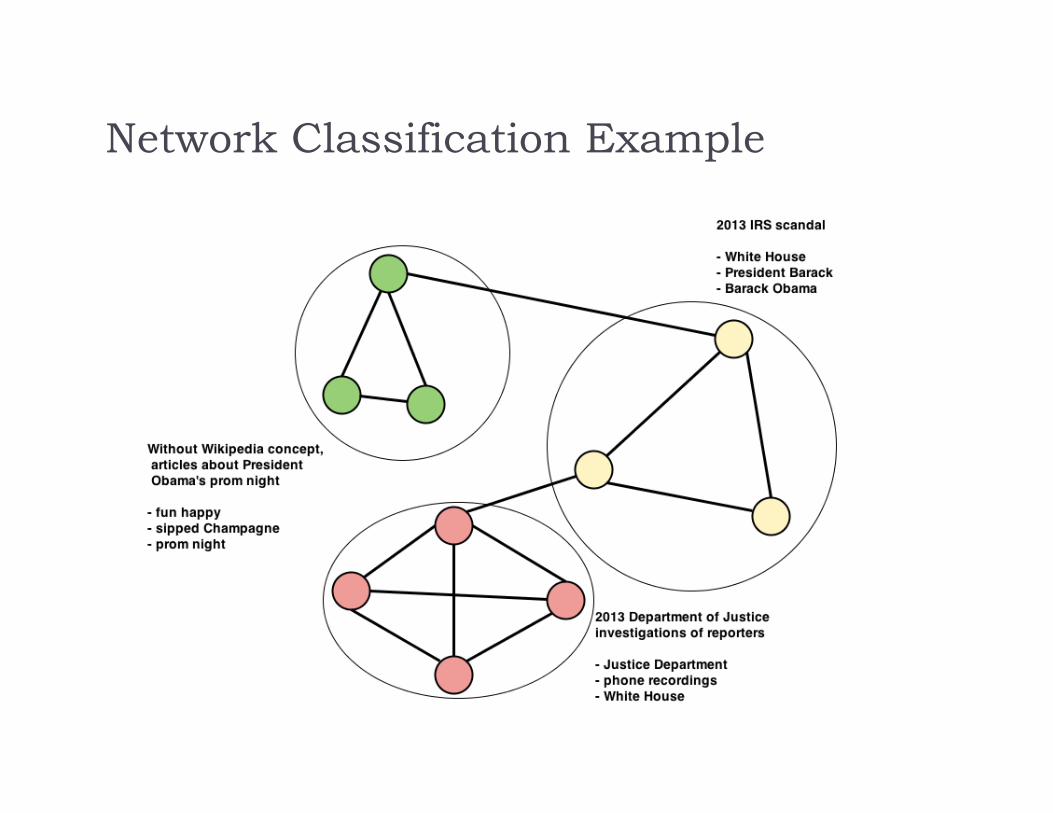
Network Classification Example
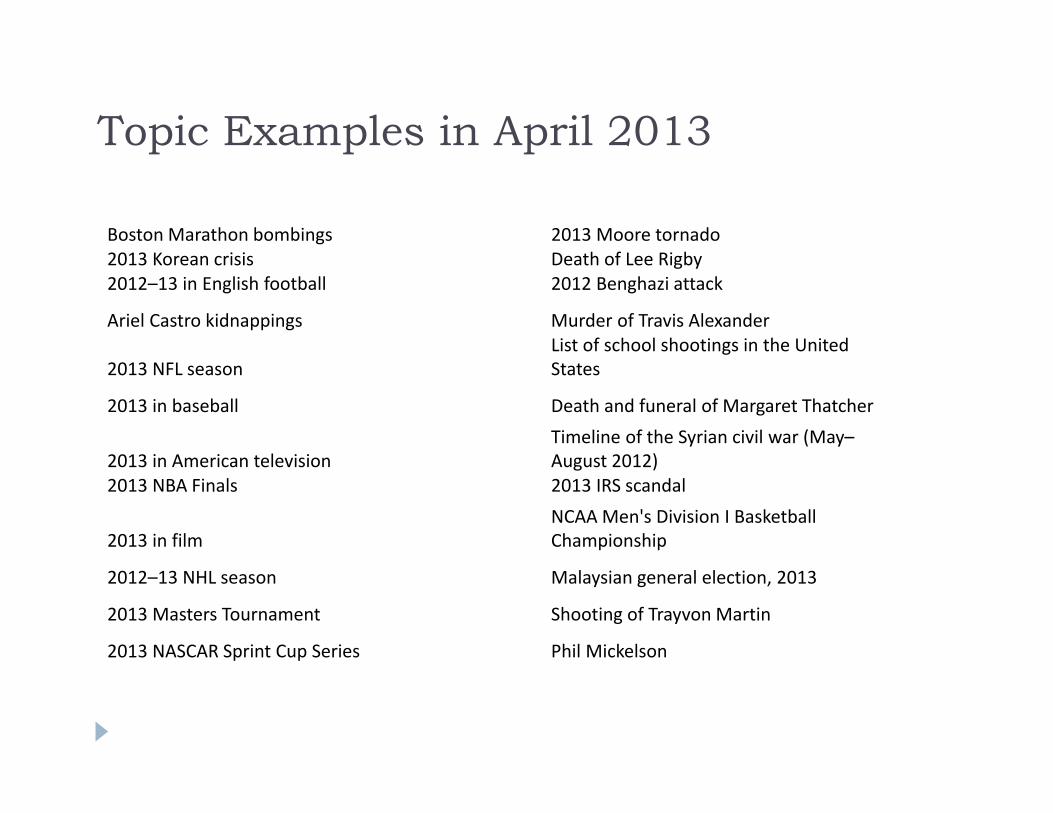
Topic Examples in April 2013
Boston Marathon bombings 2013 Moore tornado2013 Korean crisis Death of Lee Rigby2012–13 in English football 2012 Benghazi attack
Ariel Castro kidnappings Murder of Travis Alexander
2013 NFL seasonList of school shootings in the United States
2013 in baseball Death and funeral of Margaret Thatcher
2013 in American televisionTimeline of the Syrian civil war (May–August 2012)
2013 NBA Finals 2013 IRS scandal
2013 in filmNCAA Men's Division I Basketball Championship
2012–13 NHL season Malaysian general election, 2013
2013 Masters Tournament Shooting of Trayvon Martin
2013 NASCAR Sprint Cup Series Phil Mickelson

Hierarchical Models(Closer to Structural Models)
Many of these slides based on a tutorial by David Blei;See David Blei’s web page at Columbia for more details
http://www.cs.columbia.edu/~blei/
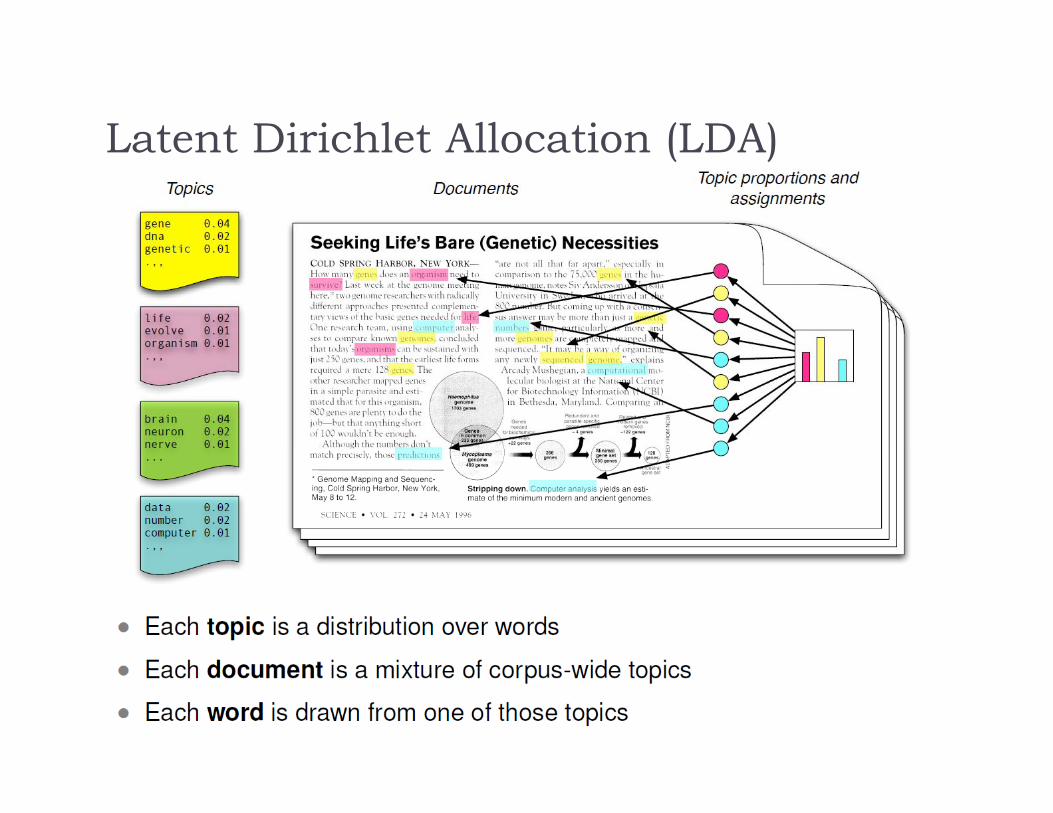
Latent Dirichlet Allocation (LDA)
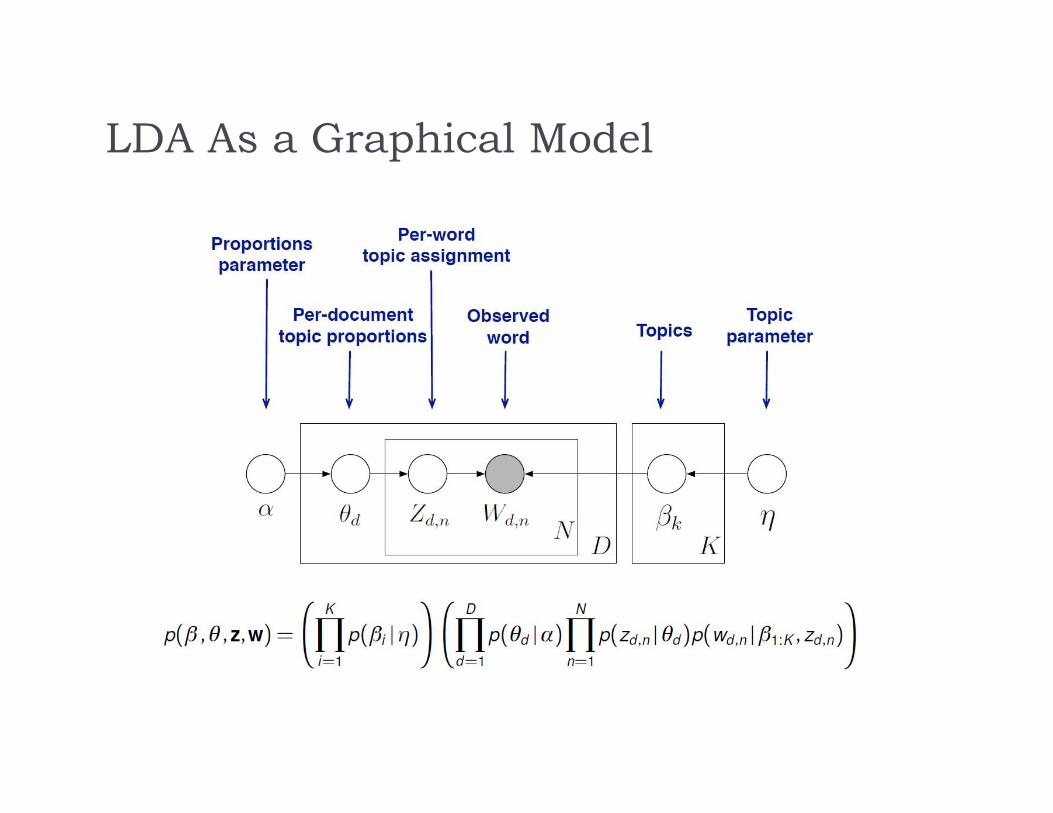
LDA As a Graphical Model
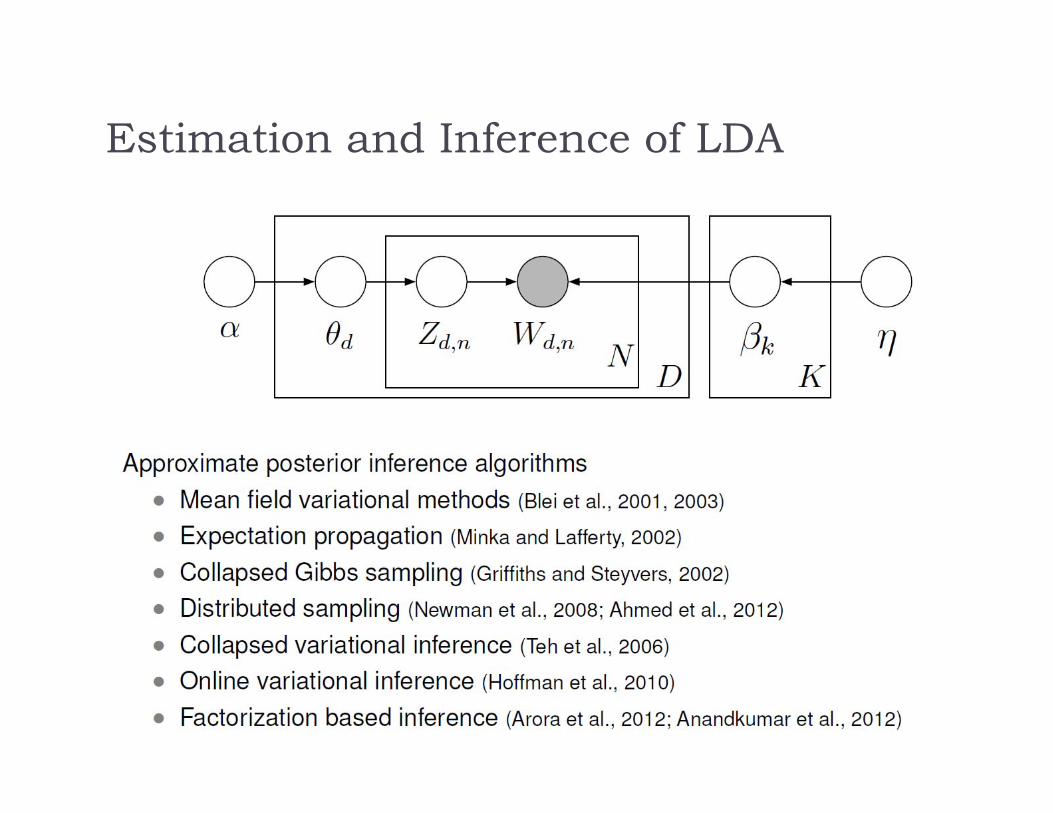
Estimation and Inference of LDA
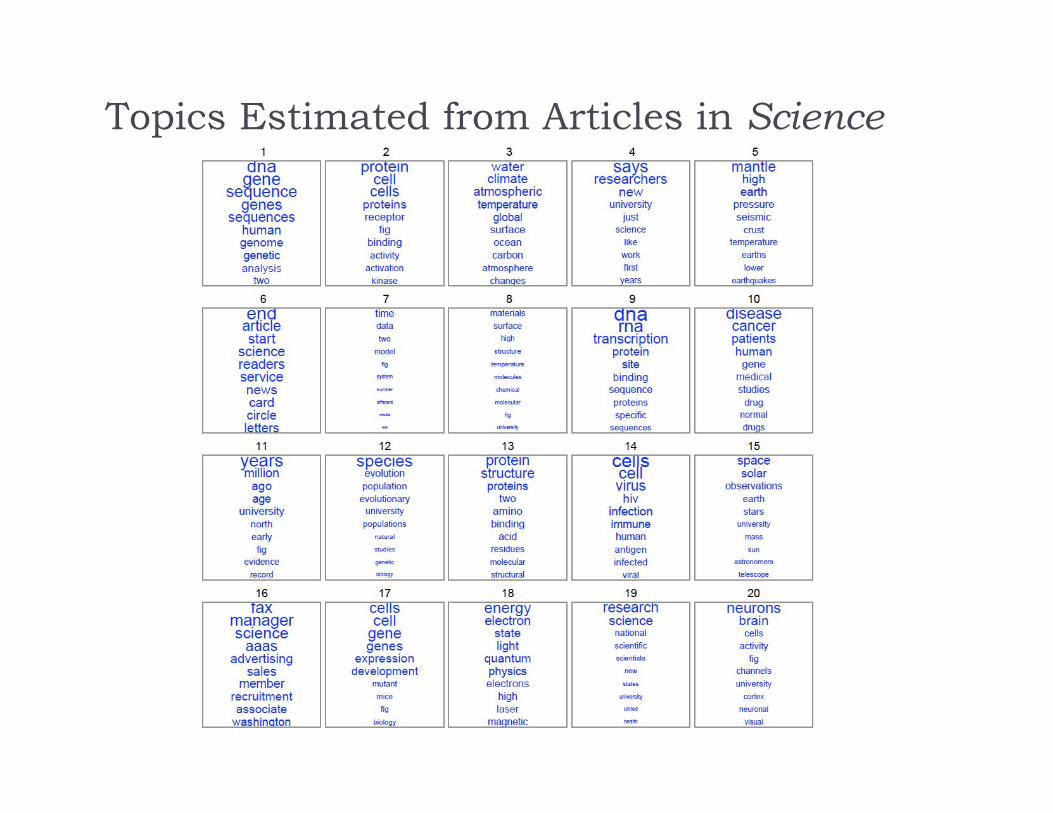
Topics Estimated from Articles in Science
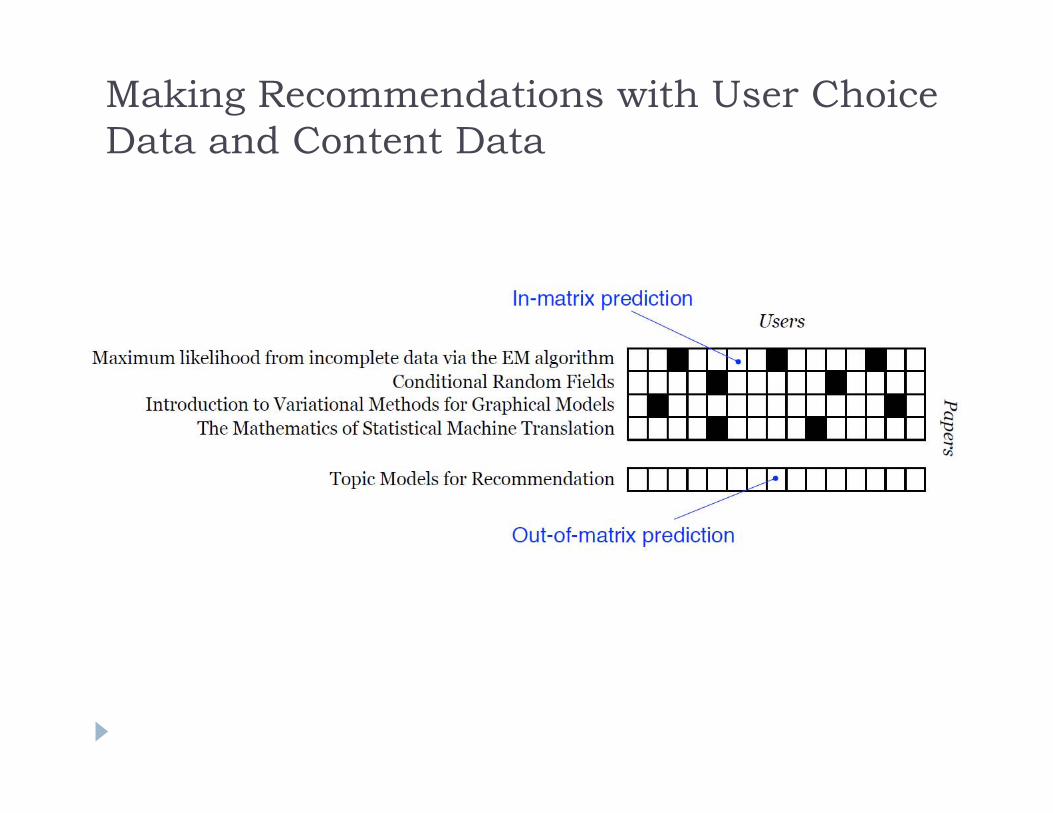
Making Recommendations with User Choice Data and Content Data
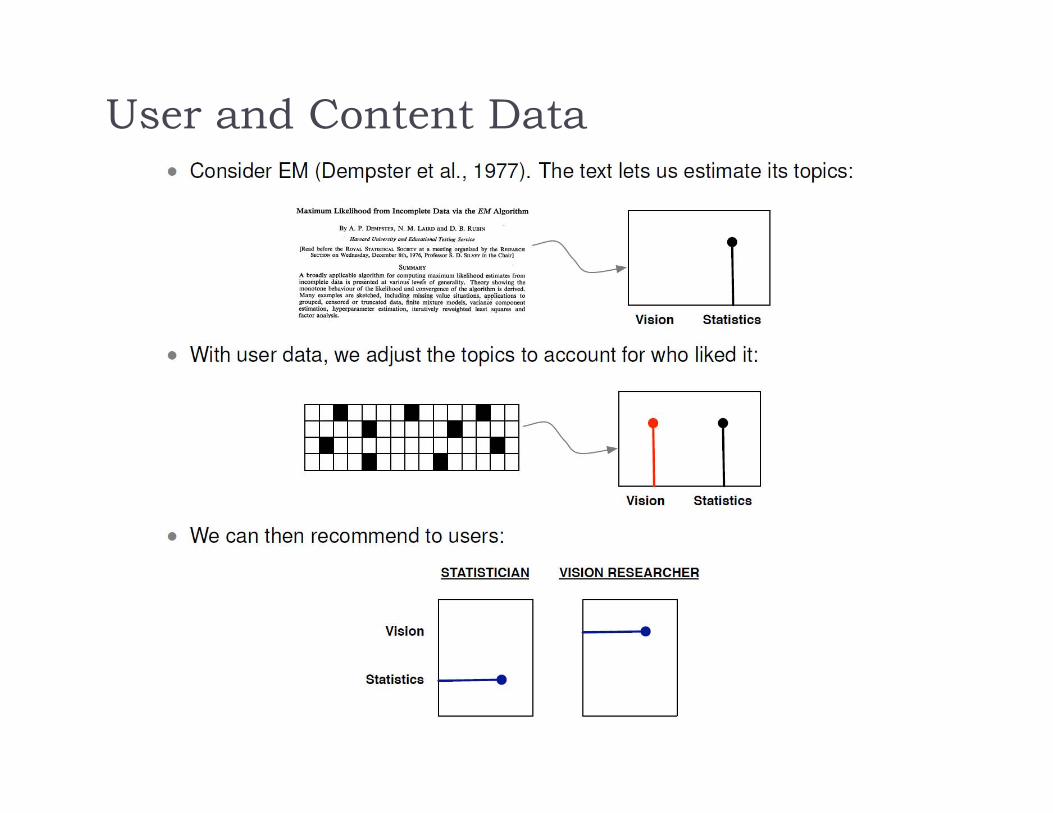
User and Content Data
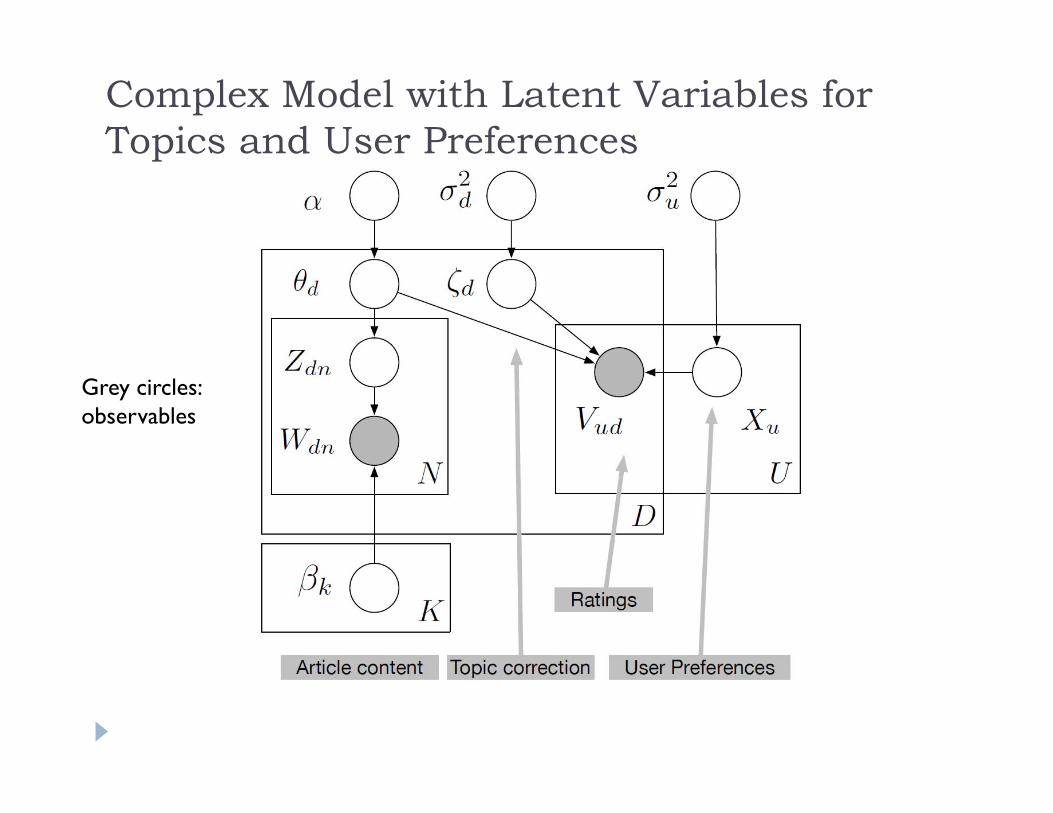
Complex Model with Latent Variables for Topics and User Preferences
Grey circles: observables
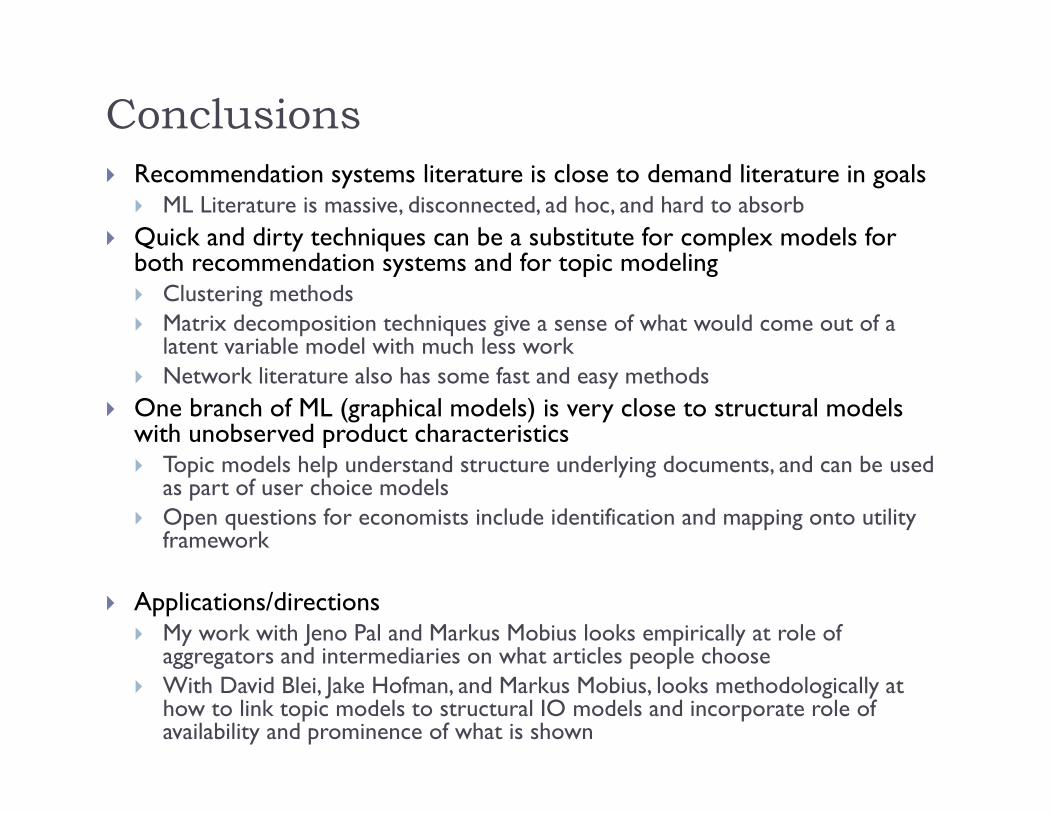
Conclusions Recommendation systems literature is close to demand literature in goals
ML Literature is massive, disconnected, ad hoc, and hard to absorb Quick and dirty techniques can be a substitute for complex models for
both recommendation systems and for topic modeling Clustering methods Matrix decomposition techniques give a sense of what would come out of a
latent variable model with much less work Network literature also has some fast and easy methods
One branch of ML (graphical models) is very close to structural models with unobserved product characteristics Topic models help understand structure underlying documents, and can be used
as part of user choice models Open questions for economists include identification and mapping onto utility
framework
Applications/directions My work with Jeno Pal and Markus Mobius looks empirically at role of
aggregators and intermediaries on what articles people choose With David Blei, Jake Hofman, and Markus Mobius, looks methodologically at
how to link topic models to structural IO models and incorporate role of availability and prominence of what is shown
Machine Learning and Causal Inference
Susan Athey and Guido Imbens, Stanford UniversityNBER Lectures, 2015

Introduction
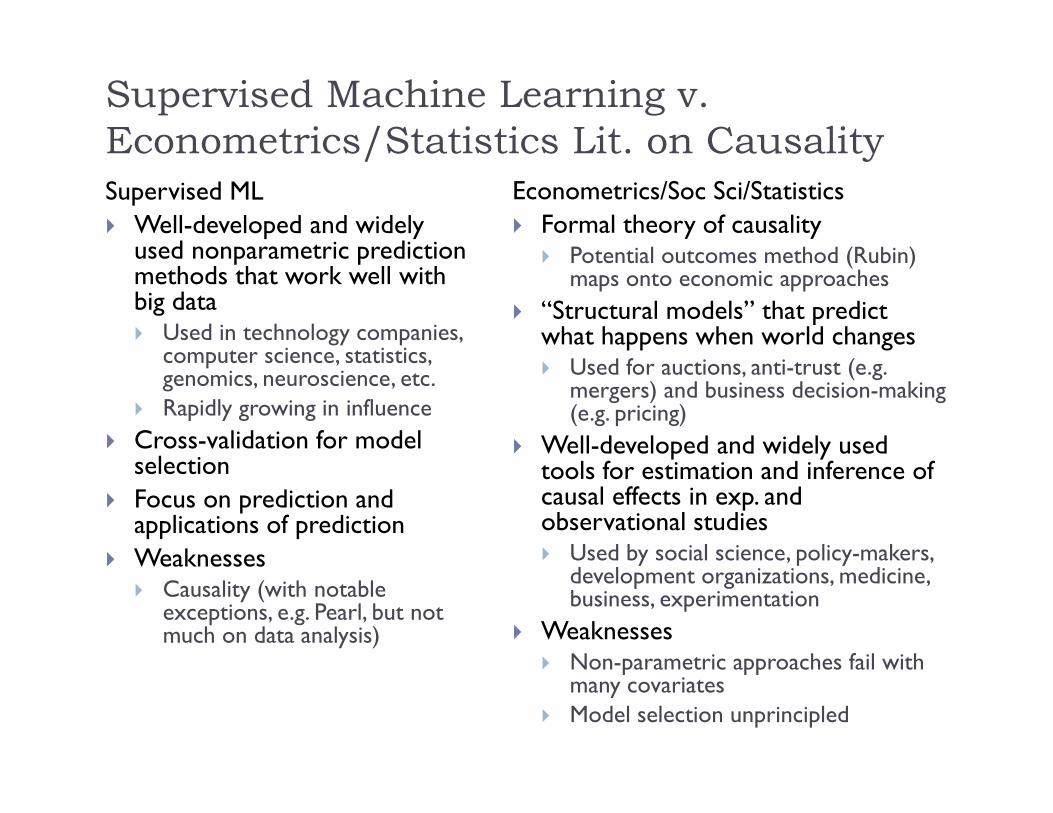
Supervised Machine Learning v. Econometrics/Statistics Lit. on CausalitySupervised ML Well-developed and widely
used nonparametric prediction methods that work well with big data Used in technology companies,
computer science, statistics, genomics, neuroscience, etc.
Rapidly growing in influence Cross-validation for model
selection Focus on prediction and
applications of prediction Weaknesses
Causality (with notable exceptions, e.g. Pearl, but not much on data analysis)
Econometrics/Soc Sci/Statistics Formal theory of causality
Potential outcomes method (Rubin) maps onto economic approaches
“Structural models” that predict what happens when world changes Used for auctions, anti-trust (e.g.
mergers) and business decision-making (e.g. pricing)
Well-developed and widely used tools for estimation and inference of causal effects in exp. and observational studies Used by social science, policy-makers,
development organizations, medicine, business, experimentation
Weaknesses Non-parametric approaches fail with
many covariates Model selection unprincipled
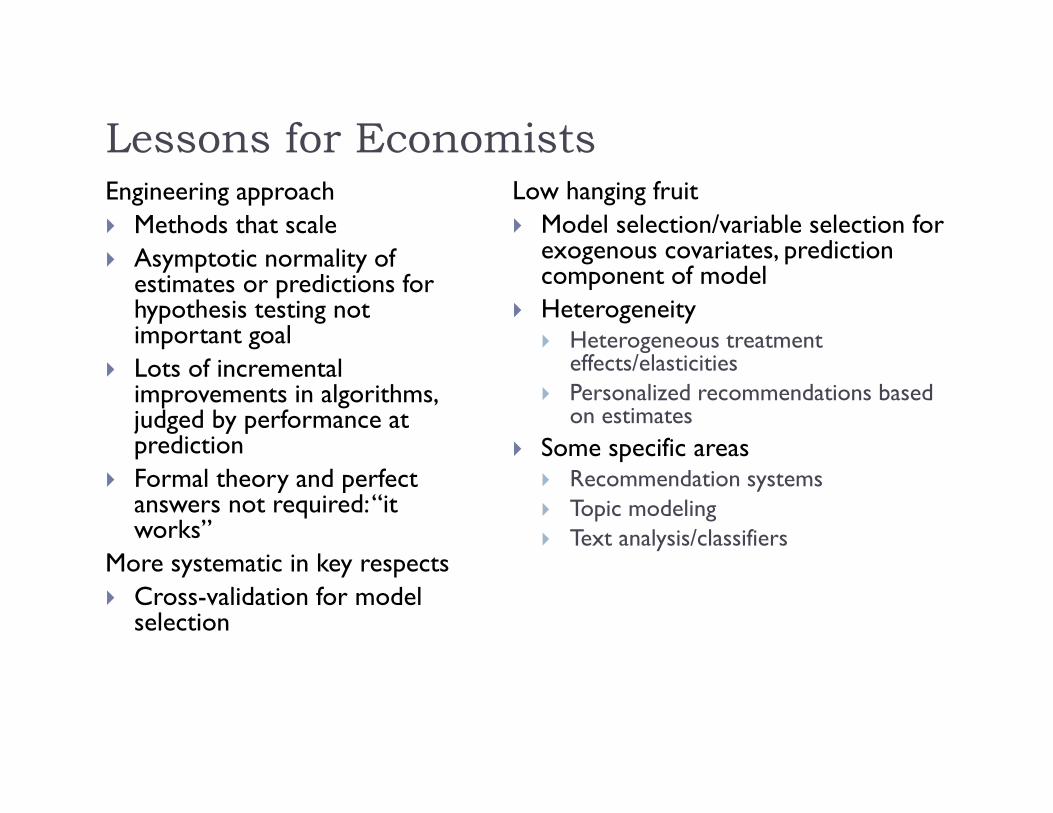
Lessons for EconomistsEngineering approach Methods that scale Asymptotic normality of
estimates or predictions for hypothesis testing not important goal
Lots of incremental improvements in algorithms, judged by performance at prediction
Formal theory and perfect answers not required: “it works”
More systematic in key respects Cross-validation for model
selection
Low hanging fruit Model selection/variable selection for
exogenous covariates, prediction component of model
Heterogeneity Heterogeneous treatment
effects/elasticities Personalized recommendations based
on estimates Some specific areas
Recommendation systems Topic modeling Text analysis/classifiers
Causal Inference
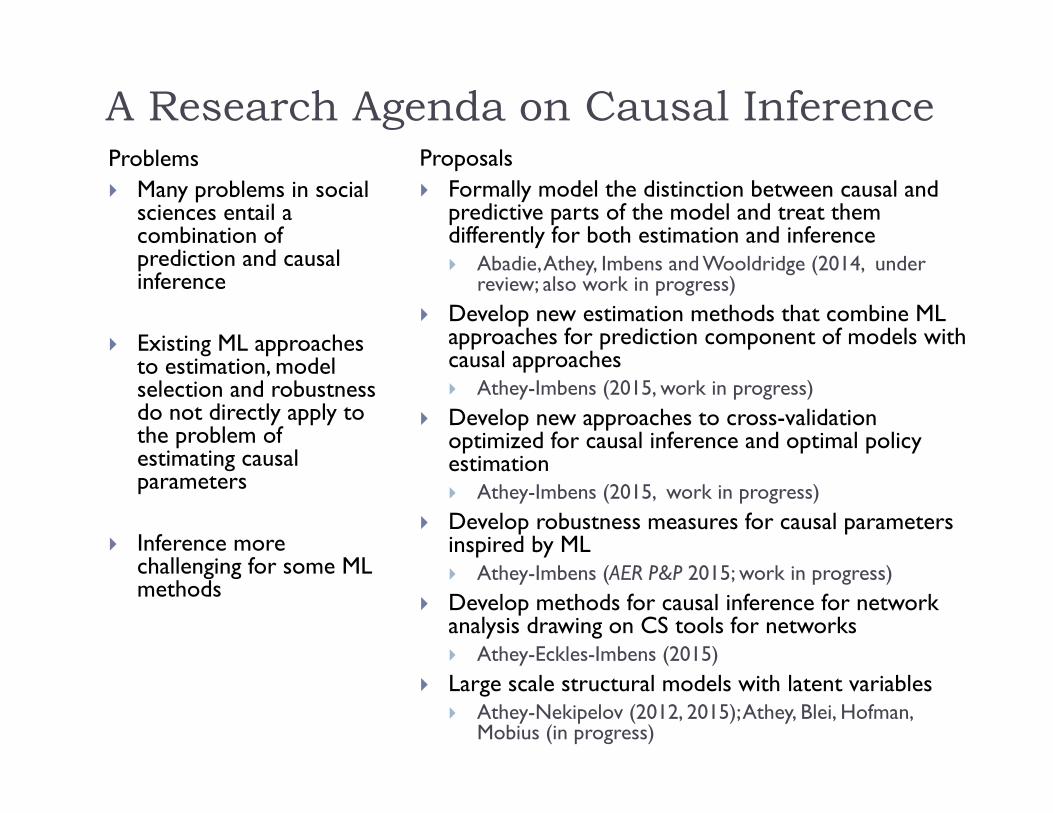
A Research Agenda on Causal InferenceProblems Many problems in social
sciences entail a combination of prediction and causal inference
Existing ML approaches to estimation, model selection and robustness do not directly apply to the problem of estimating causal parameters
Inference more challenging for some ML methods
Proposals Formally model the distinction between causal and
predictive parts of the model and treat them differently for both estimation and inference Abadie, Athey, Imbens and Wooldridge (2014, under
review; also work in progress) Develop new estimation methods that combine ML
approaches for prediction component of models with causal approaches Athey-Imbens (2015, work in progress)
Develop new approaches to cross-validation optimized for causal inference and optimal policy estimation Athey-Imbens (2015, work in progress)
Develop robustness measures for causal parameters inspired by ML Athey-Imbens (AER P&P 2015; work in progress)
Develop methods for causal inference for network analysis drawing on CS tools for networks Athey-Eckles-Imbens (2015)
Large scale structural models with latent variables Athey-Nekipelov (2012, 2015); Athey, Blei, Hofman,
Mobius (in progress)
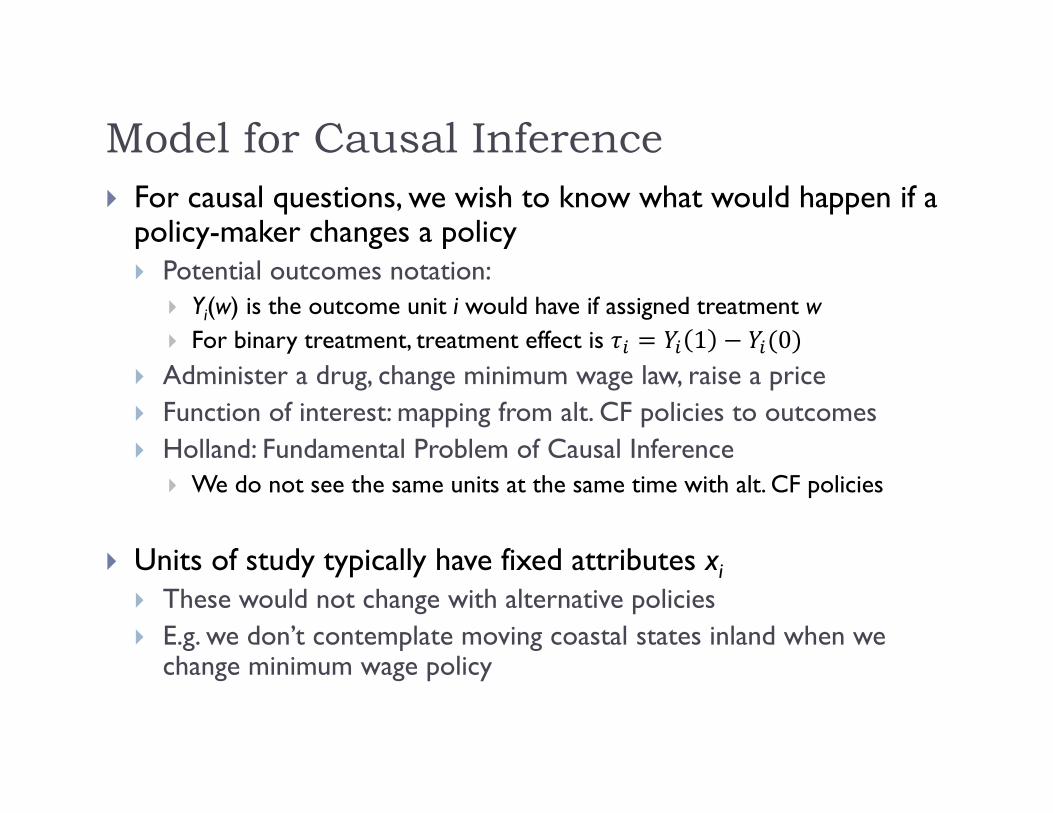
Model for Causal Inference For causal questions, we wish to know what would happen if a
policy-maker changes a policy Potential outcomes notation:
Yi(w) is the outcome unit i would have if assigned treatment w For binary treatment, treatment effect is 1 0
Administer a drug, change minimum wage law, raise a price Function of interest: mapping from alt. CF policies to outcomes Holland: Fundamental Problem of Causal Inference
We do not see the same units at the same time with alt. CF policies
Units of study typically have fixed attributes xi These would not change with alternative policies E.g. we don’t contemplate moving coastal states inland when we
change minimum wage policy
Causal Inference Versus Prediction
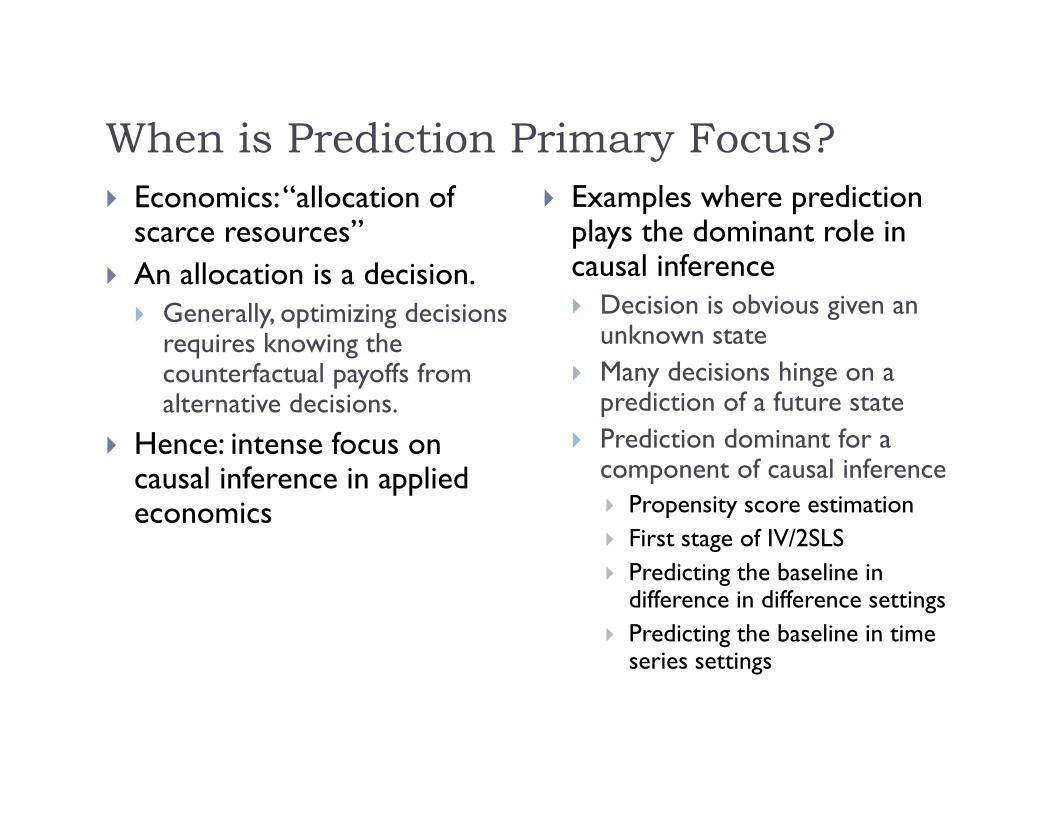
When is Prediction Primary Focus? Economics: “allocation of
scarce resources” An allocation is a decision. Generally, optimizing decisions
requires knowing the counterfactual payoffs from alternative decisions.
Hence: intense focus on causal inference in applied economics
Examples where prediction plays the dominant role in causal inference Decision is obvious given an
unknown state Many decisions hinge on a
prediction of a future state Prediction dominant for a
component of causal inference Propensity score estimation First stage of IV/2SLS Predicting the baseline in
difference in difference settings Predicting the baseline in time
series settings
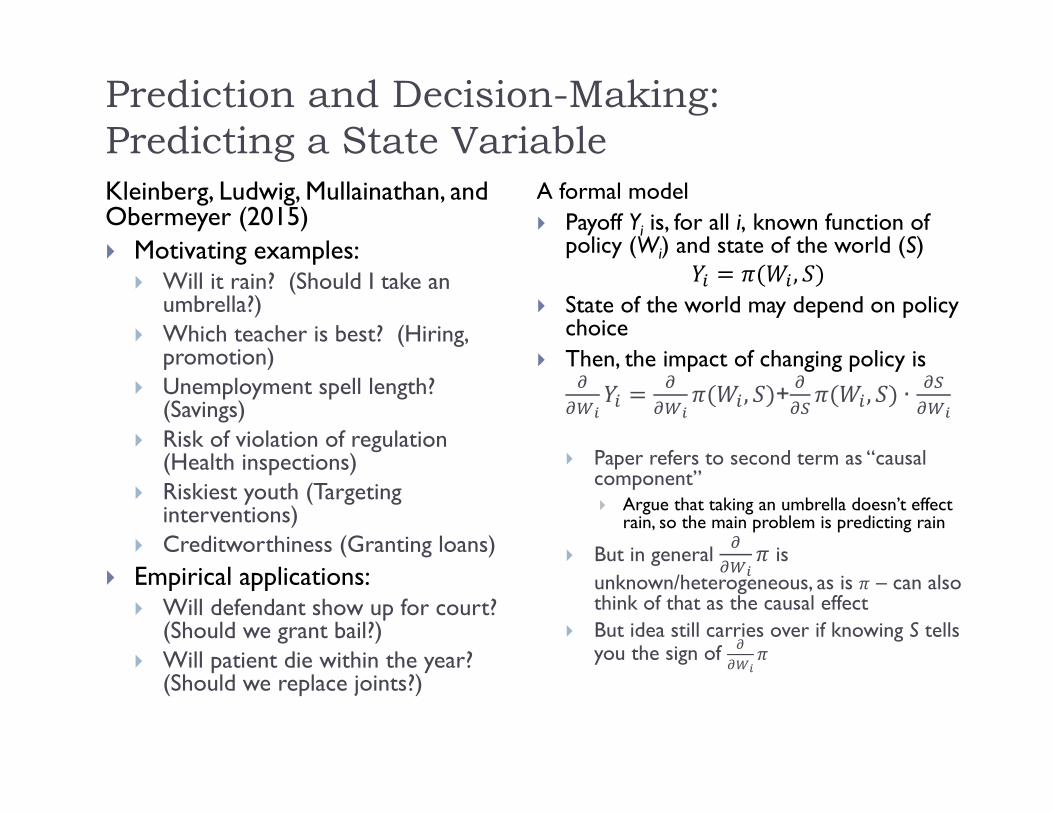
Prediction and Decision-Making:Predicting a State VariableKleinberg, Ludwig, Mullainathan, and Obermeyer (2015) Motivating examples:
Will it rain? (Should I take an umbrella?)
Which teacher is best? (Hiring, promotion)
Unemployment spell length? (Savings)
Risk of violation of regulation (Health inspections)
Riskiest youth (Targeting interventions)
Creditworthiness (Granting loans) Empirical applications:
Will defendant show up for court? (Should we grant bail?)
Will patient die within the year? (Should we replace joints?)
A formal model Payoff Yi is, for all i, known function of
policy (Wi) and state of the world (S),
State of the world may depend on policy choice
Then, the impact of changing policy is, + , ∙
Paper refers to second term as “causal component” Argue that taking an umbrella doesn’t effect
rain, so the main problem is predicting rain
But in general is unknown/heterogeneous, as is – can also think of that as the causal effect
But idea still carries over if knowing S tells you the sign of
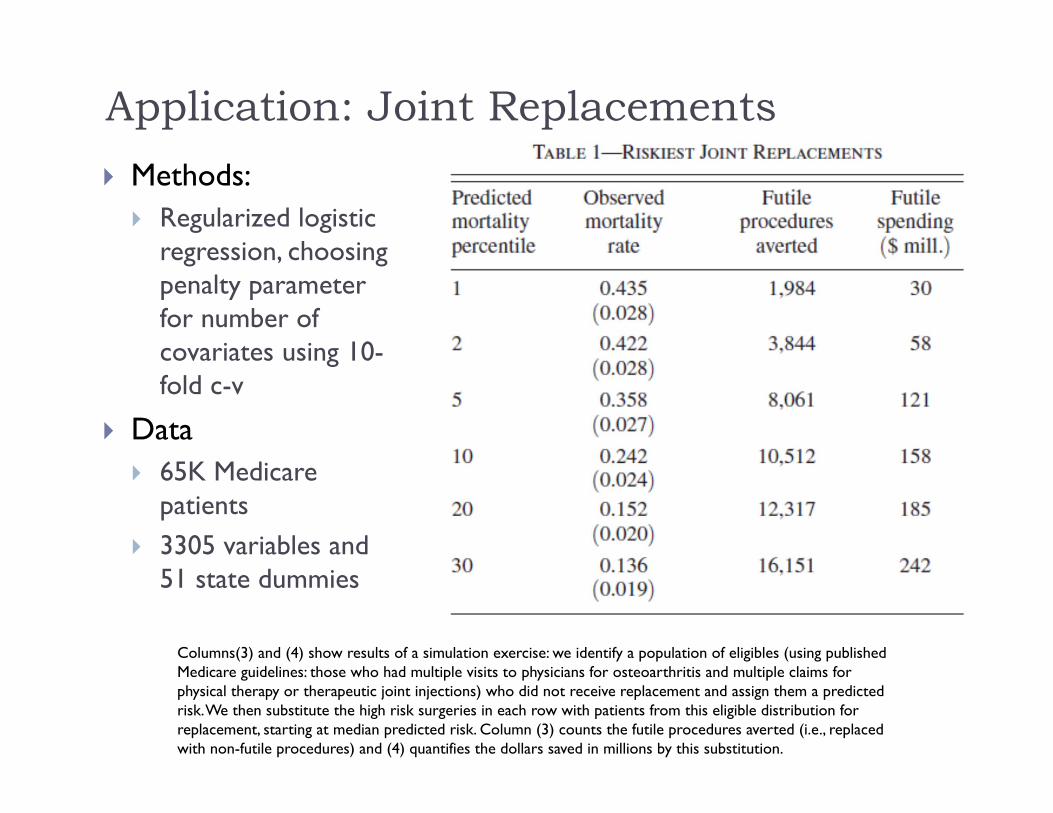
Application: Joint Replacements Methods: Regularized logistic
regression, choosing penalty parameter for number of covariates using 10-fold c-v
Data 65K Medicare
patients 3305 variables and
51 state dummies
Columns(3) and (4) show results of a simulation exercise: we identify a population of eligibles (using publishedMedicare guidelines: those who had multiple visits to physicians for osteoarthritis and multiple claims forphysical therapy or therapeutic joint injections) who did not receive replacement and assign them a predictedrisk. We then substitute the high risk surgeries in each row with patients from this eligible distribution forreplacement, starting at median predicted risk. Column (3) counts the futile procedures averted (i.e., replacedwith non-futile procedures) and (4) quantifies the dollars saved in millions by this substitution.


![Norma Nbe Ea-95[1]](https://img.pdfslide.tips/doc/110x75/5572102e497959fc0b8cc019/norma-nbe-ea-951.jpg)

