Embed Size (px)
Citation preview
1
CDISC Journey in Leukemia
Studies using IWCLL 2008 Kevin Lee
Agenda
1. Introduction of Oncology
2. Introduction of Leukemia Studies
3. Introduction of Chronic Lymphocytic
Leukemia and IWCLL 2008
4. Leukemia Specific CDISC SDTM / ADaM
5. Leukemia Study Example
6. Conclusion
7. Questions 2
Cancer Trivia
• The word ‘cancer’ is related to the Greek word “crab” because its
finger-like projections were similar to the shape of the crab
• In 2010, the economic cost of the disease worldwide was estimated at
$1.16 trillion.
• One in eight deaths in the world are due to cancer.
• Cancer is the leading cause of death in developed countries.
• WHO predicts new cancer cases of 14 million in 2012 to 22 million in
2030 and cancer deaths from 8.2 million a year to 13 million annually.
• In 2013, an estimated 119,386 people in US were living with Chronic
Lymphocytic Leukemia.
• There are 28 million cancer survivors worldwide.
• Men who have never married are up to 35% more likely to die from
cancer than those who are married.
3
FDA CDER NMEs and BLAs Approval
• 2012
–39 Approval
–13 Oncology (33 %)
• 2013
–27 Approval
–8 Oncology (30 %)
• 2014 ( as of the end of October)
–34 Approval
–6 Oncology (18%)
Note: based on the reports of NMEs and BLAs approved by CDER
4
Oncology Study
• How are the oncology studies different from other studies?
– Tumor measurements and their response to drug
– Oncology type specific measurements (e.g., liver and
spleen Enlargement, Bone Marrow Infiltrate and so on)
– Toxicity (Lab and AE)
– Time to Event Analysis
• What tumor studies and response guidelines?
– Solid Tumor : RECIST 1.1
– Lymphoma : Cheson 2007
– Leukemia : IWCLL 2008, IWAML 2003, NCCN Guideline
2012 on ALL, CML ESMO Guidelines
5
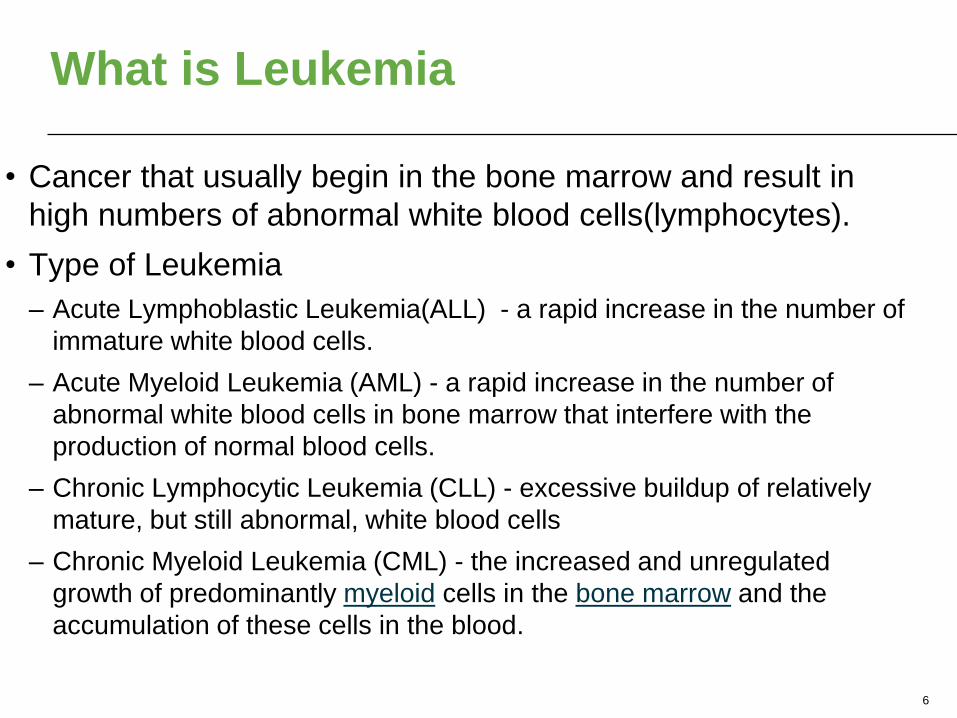
What is Leukemia
• Cancer that usually begin in the bone marrow and result in
high numbers of abnormal white blood cells(lymphocytes).
• Type of Leukemia
– Acute Lymphoblastic Leukemia(ALL) - a rapid increase in the number of
immature white blood cells.
– Acute Myeloid Leukemia (AML) - a rapid increase in the number of
abnormal white blood cells in bone marrow that interfere with the
production of normal blood cells.
– Chronic Lymphocytic Leukemia (CLL) - excessive buildup of relatively
mature, but still abnormal, white blood cells
– Chronic Myeloid Leukemia (CML) - the increased and unregulated
growth of predominantly myeloid cells in the bone marrow and the
accumulation of these cells in the blood.
6
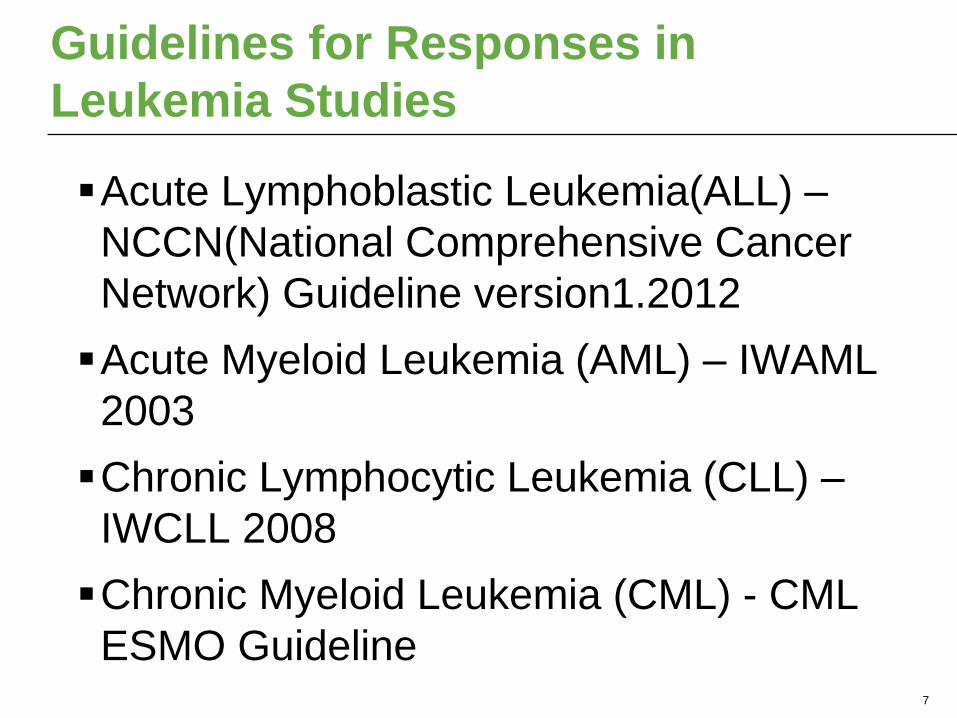
Guidelines for Responses in
Leukemia Studies
Acute Lymphoblastic Leukemia(ALL) –
NCCN(National Comprehensive Cancer
Network) Guideline version1.2012
Acute Myeloid Leukemia (AML) – IWAML
2003
Chronic Lymphocytic Leukemia (CLL) –
IWCLL 2008
Chronic Myeloid Leukemia (CML) - CML
ESMO Guideline 7
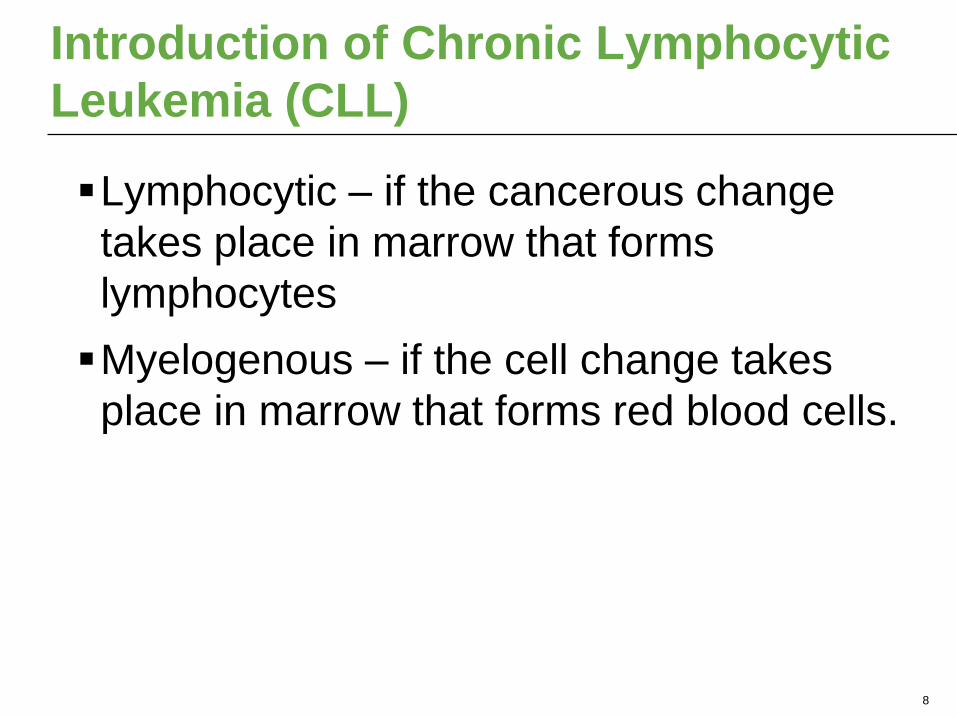
Introduction of Chronic Lymphocytic
Leukemia (CLL)
Lymphocytic – if the cancerous change
takes place in marrow that forms
lymphocytes
Myelogenous – if the cell change takes
place in marrow that forms red blood cells.
8
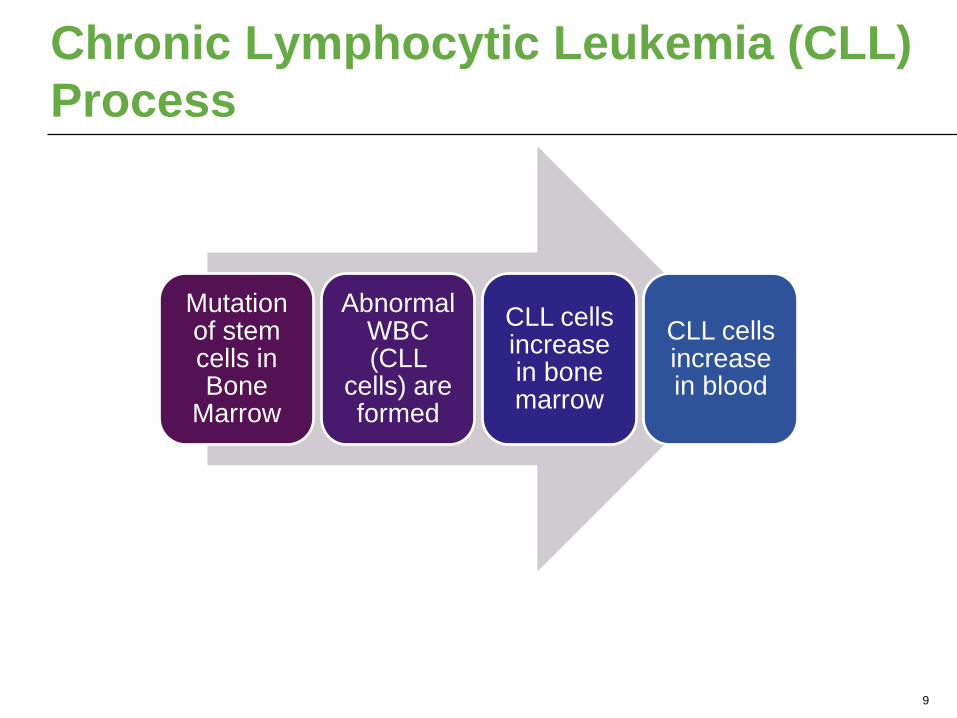
Chronic Lymphocytic Leukemia (CLL)
Process
9
Mutation of stem cells in Bone
Marrow
Abnormal WBC (CLL
cells) are formed
CLL cells increase in bone marrow
CLL cells increase in blood
Introduction of IWCLL ( International
Workshop on Chronic Lymphocytic Leukemia)
• History
–IWCLL 1996 and 2008
• Diagnosis of CLL
–Blood : > 5 * 109 B lymphocytes/L (5000 / uL) in
blood.
–Immunophenotype (flow cytometry) of
Lymphocytes:
• A presence of T-cell antigen CD5
• A presence of B-cell surface CD19, CD20, CD23
• Low surface immunoglobin CD20, CD79b 10
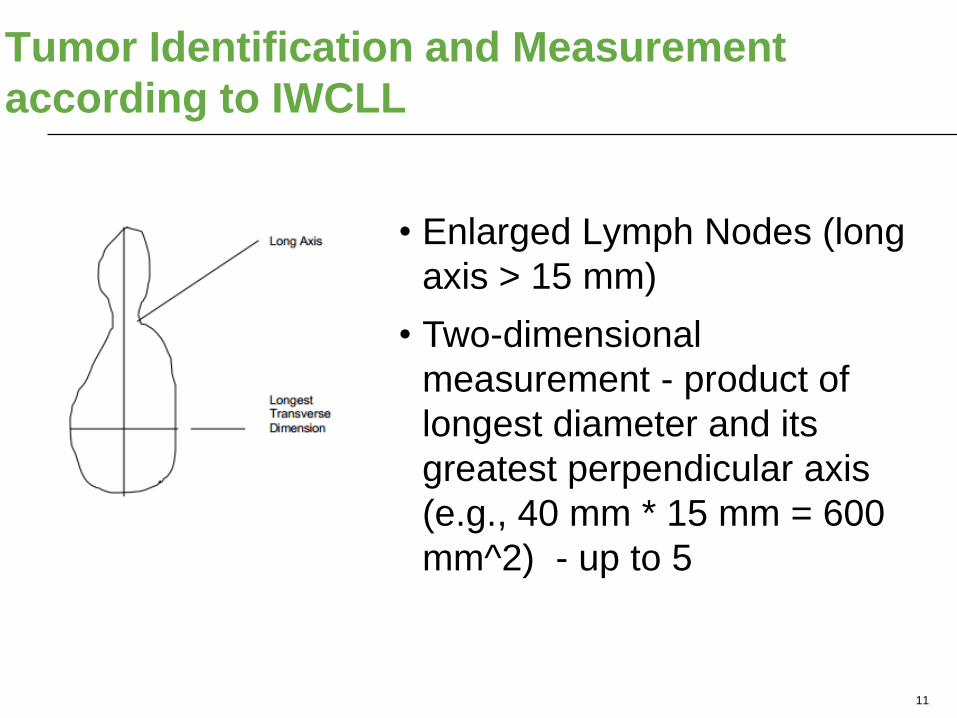
Tumor Identification and Measurement
according to IWCLL
11
• Enlarged Lymph Nodes (long
axis > 15 mm)
• Two-dimensional
measurement - product of
longest diameter and its
greatest perpendicular axis
(e.g., 40 mm * 15 mm = 600
mm^2) - up to 5
What are to measure for response
criteria according to IWCLL 2008
• Tumor measurements in CT / MRI
–Lymph Node
• Lymphocytes Assessment
• Spleen and Liver Enlargement Assessment
• Bone Marrow Assessment
• Blood Count Assessment – Neutrophils,
Platelets, and Hemoglobin.
12
Additional measurements according
to IWCLL 2008
• Immunophenotype (flow Cytometry)
Assessment
• Performance Status by ECOG(Eastern
Cooperative Oncology Group)
• Staging – assessment of disease progress for treatment plan
–Rai : 0 (Low risk), 1&2 (Intermediate risk), 3
(High risk)
–Binet : A, B, C
13
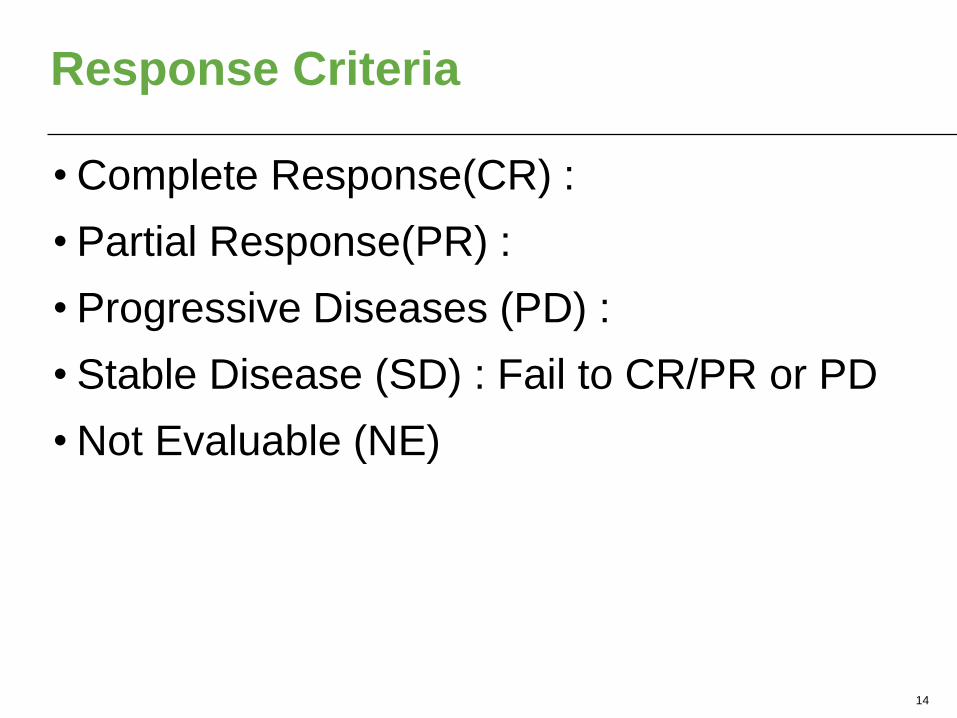
Response Criteria
• Complete Response(CR) :
• Partial Response(PR) :
• Progressive Diseases (PD) :
• Stable Disease (SD) : Fail to CR/PR or PD
• Not Evaluable (NE)
14
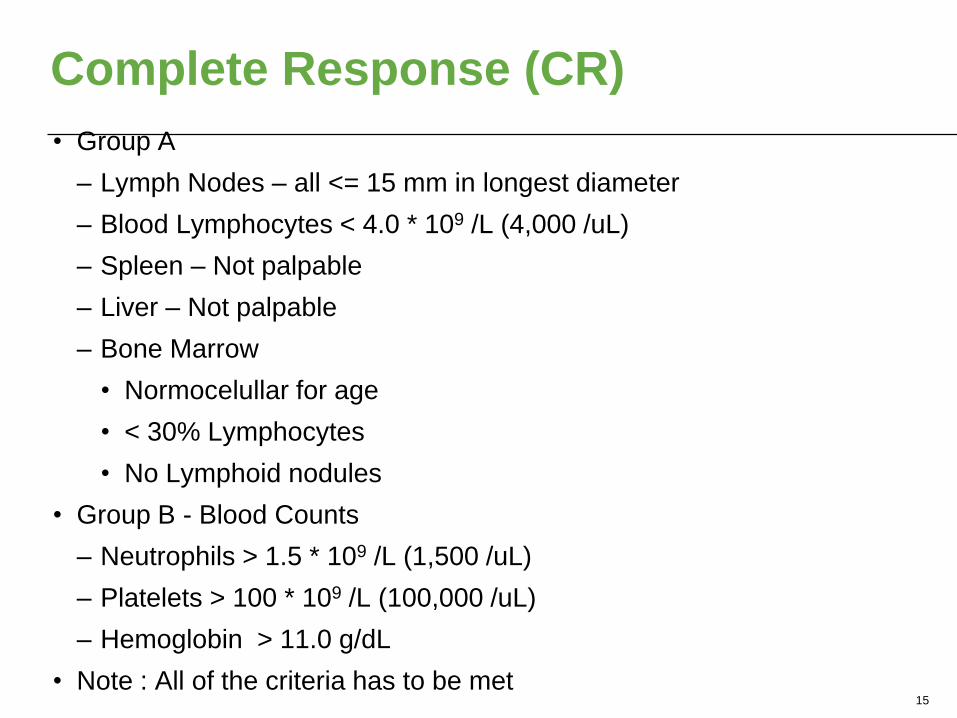
Complete Response (CR)
• Group A
– Lymph Nodes – all <= 15 mm in longest diameter
– Blood Lymphocytes < 4.0 * 109 /L (4,000 /uL)
– Spleen – Not palpable
– Liver – Not palpable
– Bone Marrow
• Normocelullar for age
• < 30% Lymphocytes
• No Lymphoid nodules
• Group B - Blood Counts
– Neutrophils > 1.5 * 109 /L (1,500 /uL)
– Platelets > 100 * 109 /L (100,000 /uL)
– Hemoglobin > 11.0 g/dL
• Note : All of the criteria has to be met 15
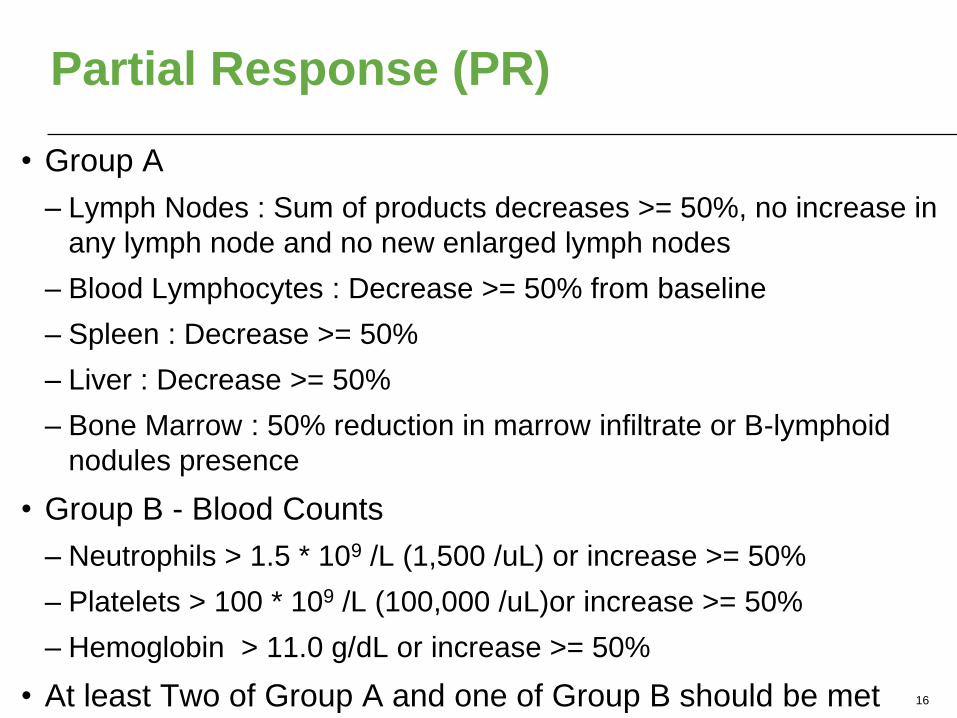
Partial Response (PR)
• Group A
– Lymph Nodes : Sum of products decreases >= 50%, no increase in
any lymph node and no new enlarged lymph nodes
– Blood Lymphocytes : Decrease >= 50% from baseline
– Spleen : Decrease >= 50%
– Liver : Decrease >= 50%
– Bone Marrow : 50% reduction in marrow infiltrate or B-lymphoid
nodules presence
• Group B - Blood Counts
– Neutrophils > 1.5 * 109 /L (1,500 /uL) or increase >= 50%
– Platelets > 100 * 109 /L (100,000 /uL)or increase >= 50%
– Hemoglobin > 11.0 g/dL or increase >= 50%
• At least Two of Group A and one of Group B should be met
16
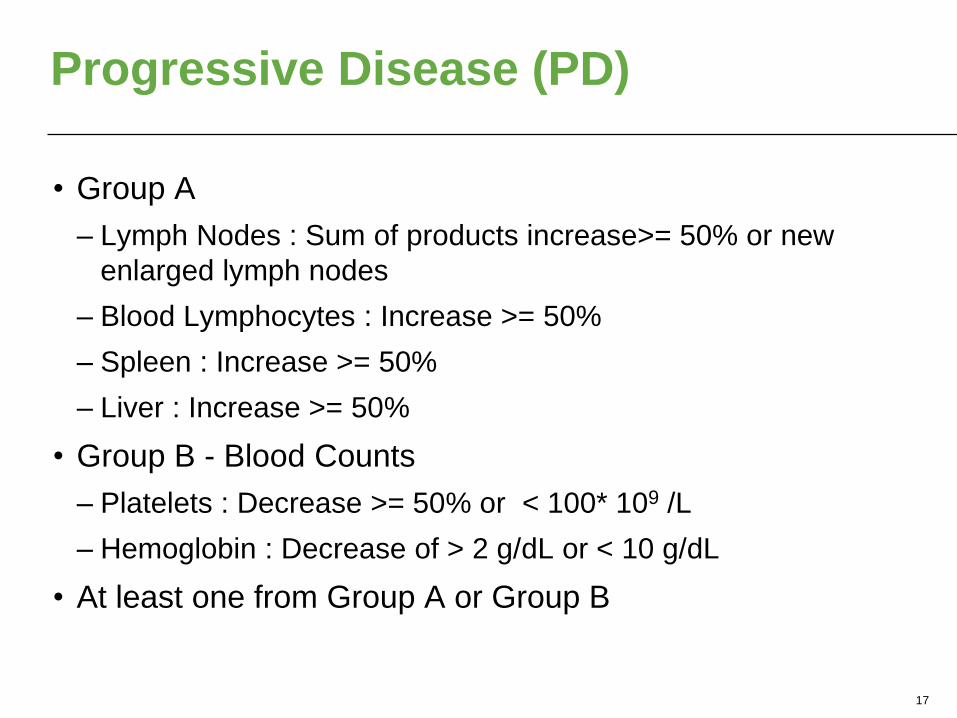
Progressive Disease (PD)
• Group A
– Lymph Nodes : Sum of products increase>= 50% or new
enlarged lymph nodes
– Blood Lymphocytes : Increase >= 50%
– Spleen : Increase >= 50%
– Liver : Increase >= 50%
• Group B - Blood Counts
– Platelets : Decrease >= 50% or < 100* 109 /L
– Hemoglobin : Decrease of > 2 g/dL or < 10 g/dL
• At least one from Group A or Group B
17
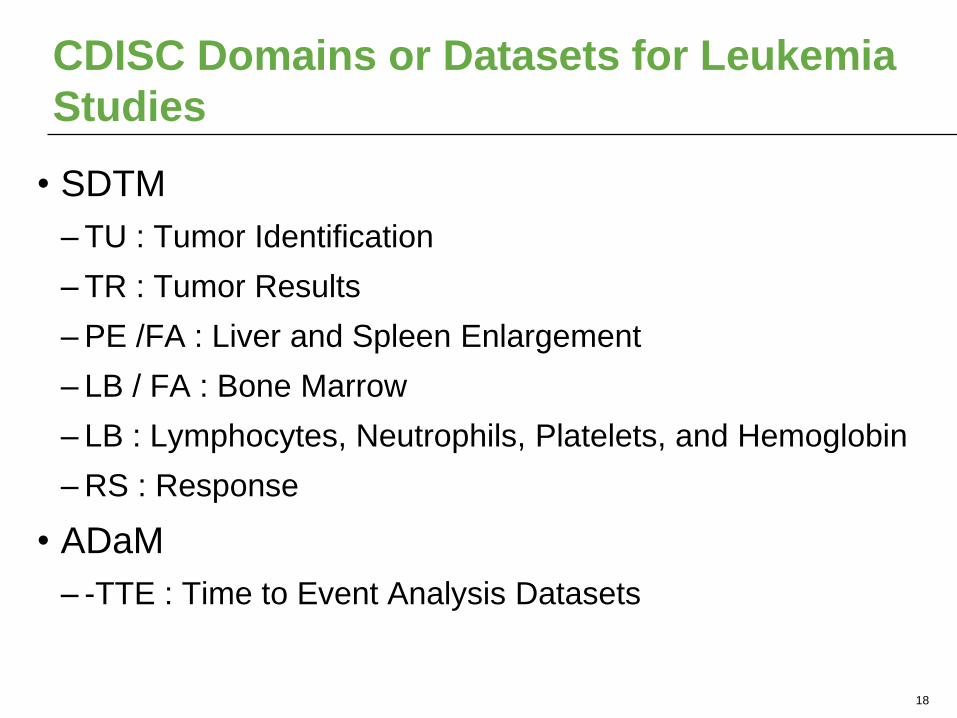
CDISC Domains or Datasets for Leukemia
Studies
• SDTM
– TU : Tumor Identification
– TR : Tumor Results
– PE /FA : Liver and Spleen Enlargement
– LB / FA : Bone Marrow
– LB : Lymphocytes, Neutrophils, Platelets, and Hemoglobin
– RS : Response
• ADaM
– -TTE : Time to Event Analysis Datasets
18
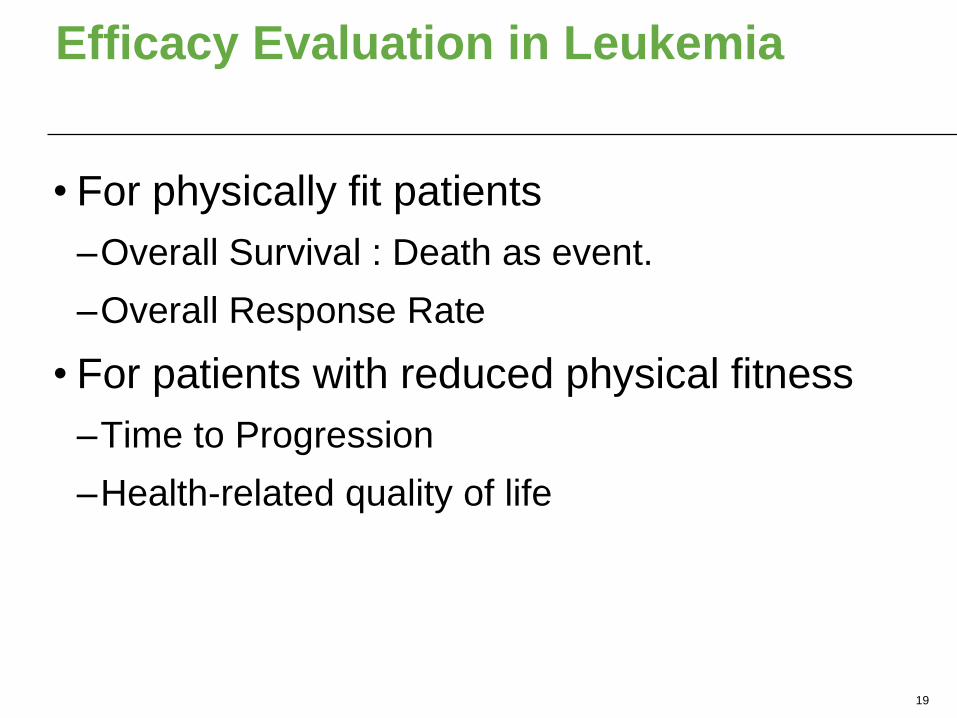
Efficacy Evaluation in Leukemia
• For physically fit patients
–Overall Survival : Death as event.
–Overall Response Rate
• For patients with reduced physical fitness
–Time to Progression
–Health-related quality of life
19
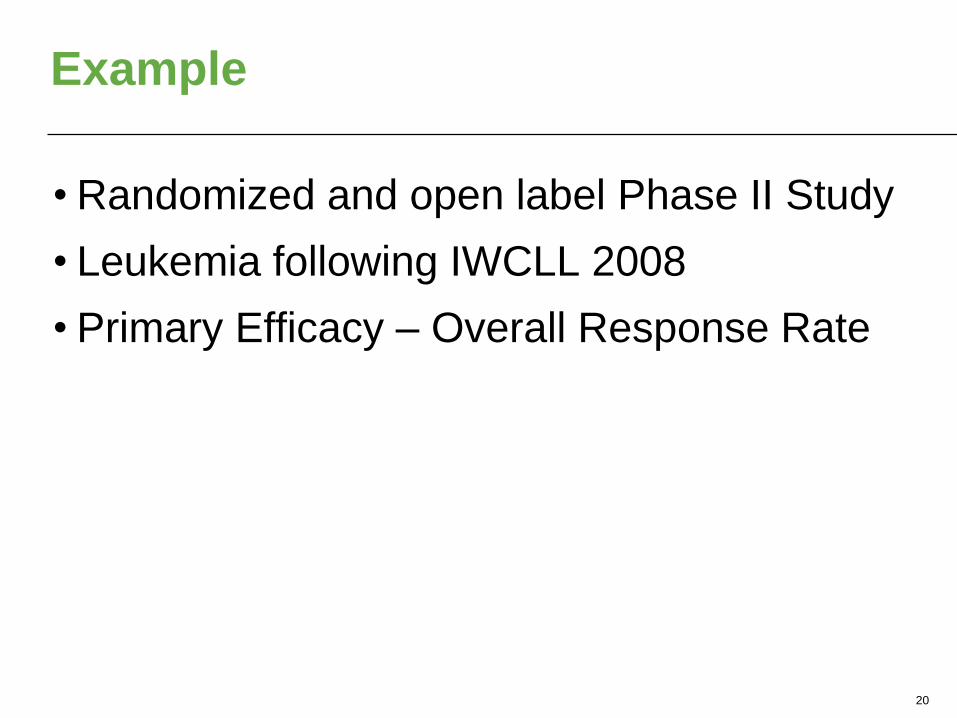
Example
• Randomized and open label Phase II Study
• Leukemia following IWCLL 2008
• Primary Efficacy – Overall Response Rate
20
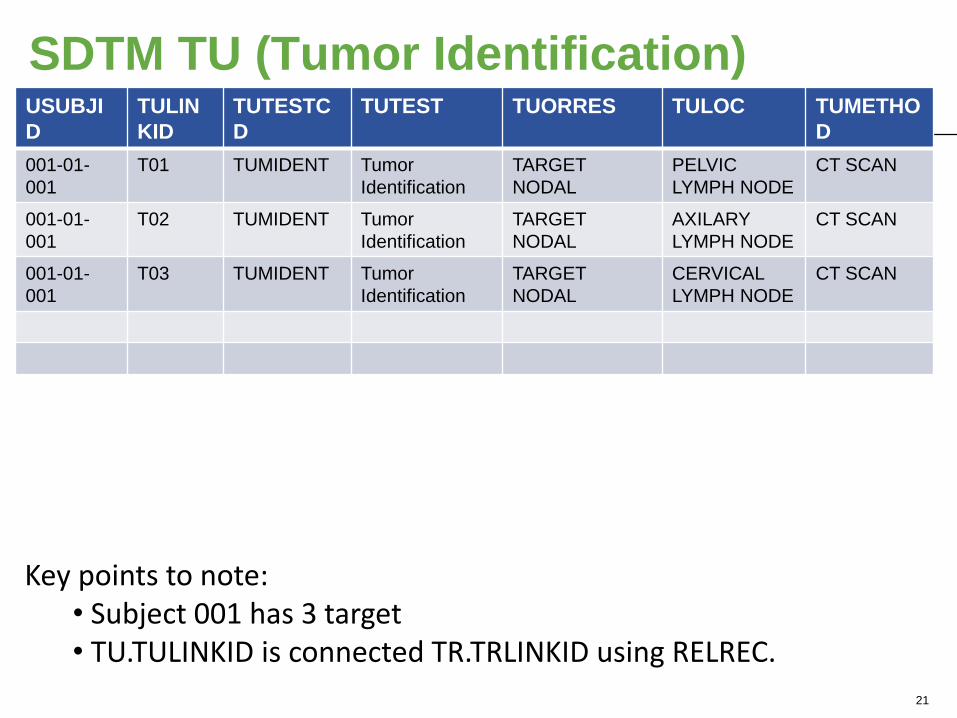
SDTM TU (Tumor Identification) USUBJI
D
TULIN
KID
TUTESTC
D
TUTEST TUORRES TULOC TUMETHO
D
001-01-
001
T01 TUMIDENT Tumor
Identification
TARGET
NODAL
PELVIC
LYMPH NODE
CT SCAN
001-01-
001
T02 TUMIDENT Tumor
Identification
TARGET
NODAL
AXILARY
LYMPH NODE
CT SCAN
001-01-
001
T03 TUMIDENT Tumor
Identification
TARGET
NODAL
CERVICAL
LYMPH NODE
CT SCAN
21
Key points to note: • Subject 001 has 3 target • TU.TULINKID is connected TR.TRLINKID using RELREC.
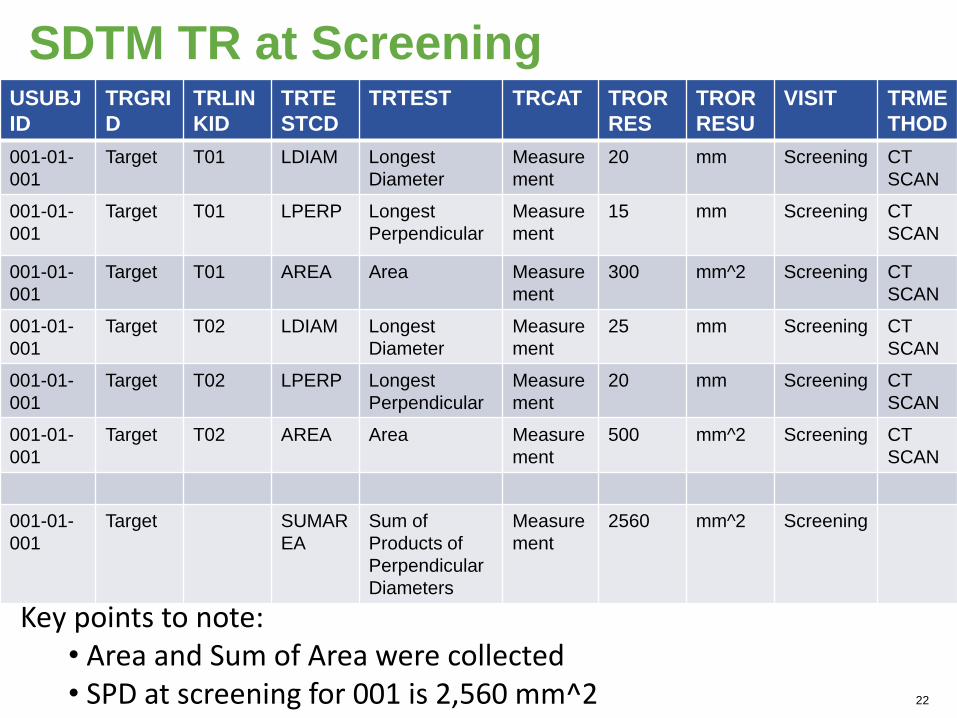
SDTM TR at Screening USUBJ
ID
TRGRI
D
TRLIN
KID
TRTE
STCD
TRTEST TRCAT TROR
RES
TROR
RESU
VISIT TRME
THOD
001-01-
001
Target T01 LDIAM Longest
Diameter
Measure
ment
20 mm Screening CT
SCAN
001-01-
001
Target T01 LPERP Longest
Perpendicular
Measure
ment
15 mm Screening CT
SCAN
001-01-
001
Target T01 AREA Area Measure
ment
300 mm^2 Screening CT
SCAN
001-01-
001
Target T02 LDIAM Longest
Diameter
Measure
ment
25 mm Screening CT
SCAN
001-01-
001
Target T02 LPERP Longest
Perpendicular
Measure
ment
20 mm Screening CT
SCAN
001-01-
001
Target T02 AREA Area Measure
ment
500 mm^2 Screening CT
SCAN
001-01-
001
Target SUMAR
EA
Sum of
Products of
Perpendicular
Diameters
Measure
ment
2560 mm^2 Screening
22
Key points to note: • Area and Sum of Area were collected • SPD at screening for 001 is 2,560 mm^2
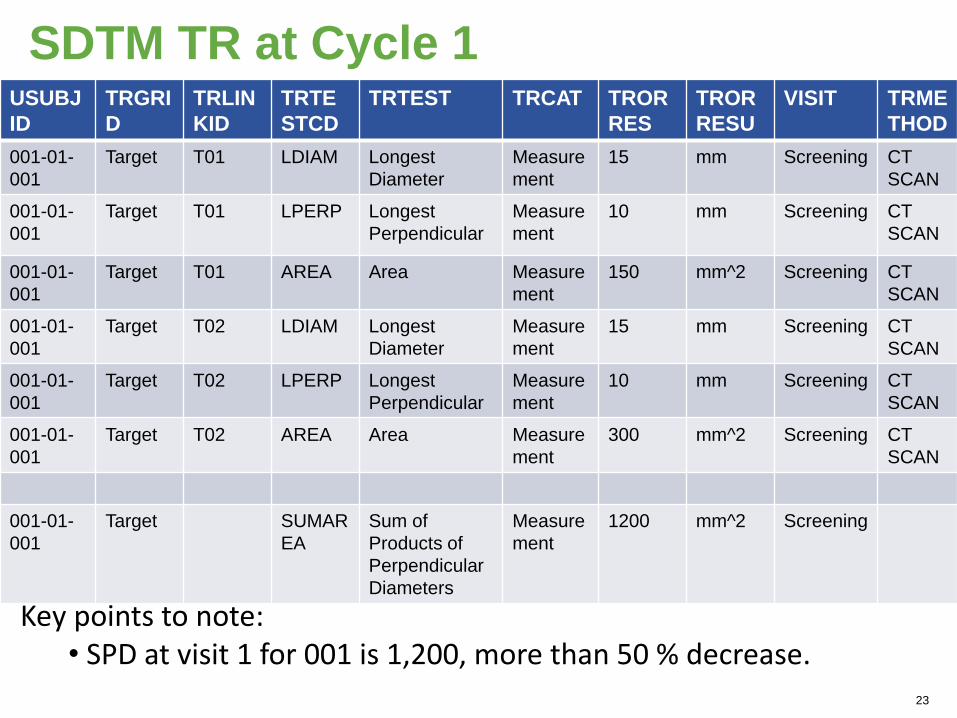
SDTM TR at Cycle 1 USUBJ
ID
TRGRI
D
TRLIN
KID
TRTE
STCD
TRTEST TRCAT TROR
RES
TROR
RESU
VISIT TRME
THOD
001-01-
001
Target T01 LDIAM Longest
Diameter
Measure
ment
15 mm Screening CT
SCAN
001-01-
001
Target T01 LPERP Longest
Perpendicular
Measure
ment
10 mm Screening CT
SCAN
001-01-
001
Target T01 AREA Area Measure
ment
150 mm^2 Screening CT
SCAN
001-01-
001
Target T02 LDIAM Longest
Diameter
Measure
ment
15 mm Screening CT
SCAN
001-01-
001
Target T02 LPERP Longest
Perpendicular
Measure
ment
10 mm Screening CT
SCAN
001-01-
001
Target T02 AREA Area Measure
ment
300 mm^2 Screening CT
SCAN
001-01-
001
Target SUMAR
EA
Sum of
Products of
Perpendicular
Diameters
Measure
ment
1200 mm^2 Screening
23
Key points to note: • SPD at visit 1 for 001 is 1,200, more than 50 % decrease.
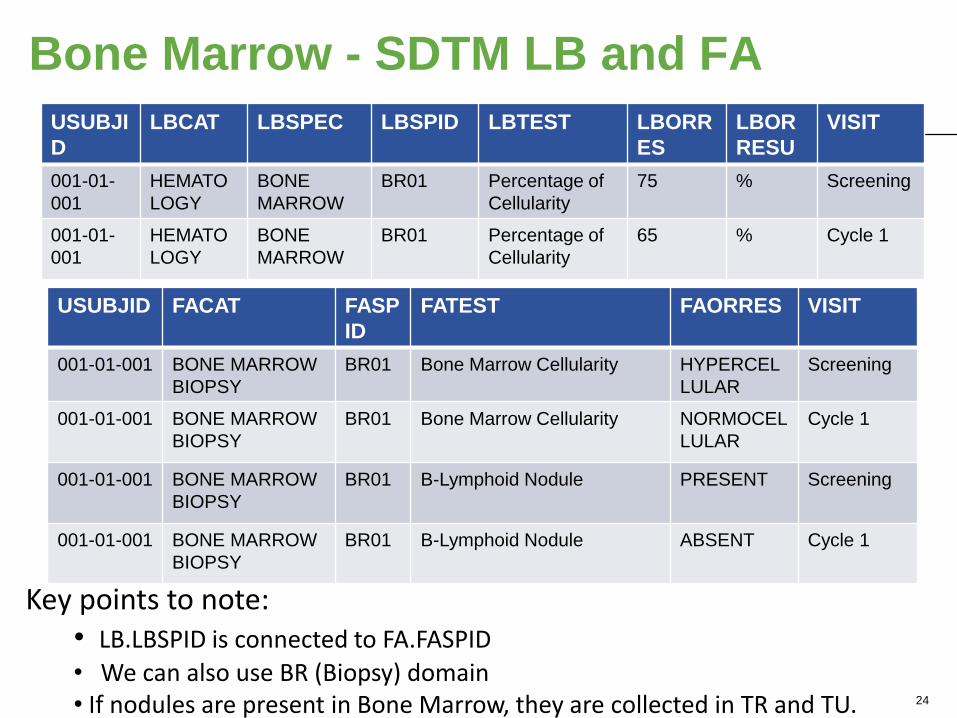
Bone Marrow - SDTM LB and FA
USUBJI
D
LBCAT LBSPEC LBSPID LBTEST LBORR
ES
LBOR
RESU
VISIT
001-01-
001
HEMATO
LOGY
BONE
MARROW
BR01 Percentage of
Cellularity
75 % Screening
001-01-
001
HEMATO
LOGY
BONE
MARROW
BR01 Percentage of
Cellularity
65 % Cycle 1
24
Key points to note: • LB.LBSPID is connected to FA.FASPID
• We can also use BR (Biopsy) domain • If nodules are present in Bone Marrow, they are collected in TR and TU.
USUBJID FACAT FASP
ID
FATEST FAORRES VISIT
001-01-001 BONE MARROW
BIOPSY
BR01 Bone Marrow Cellularity HYPERCEL
LULAR
Screening
001-01-001 BONE MARROW
BIOPSY
BR01 Bone Marrow Cellularity NORMOCEL
LULAR
Cycle 1
001-01-001 BONE MARROW
BIOPSY
BR01 B-Lymphoid Nodule PRESENT Screening
001-01-001 BONE MARROW
BIOPSY
BR01 B-Lymphoid Nodule ABSENT Cycle 1
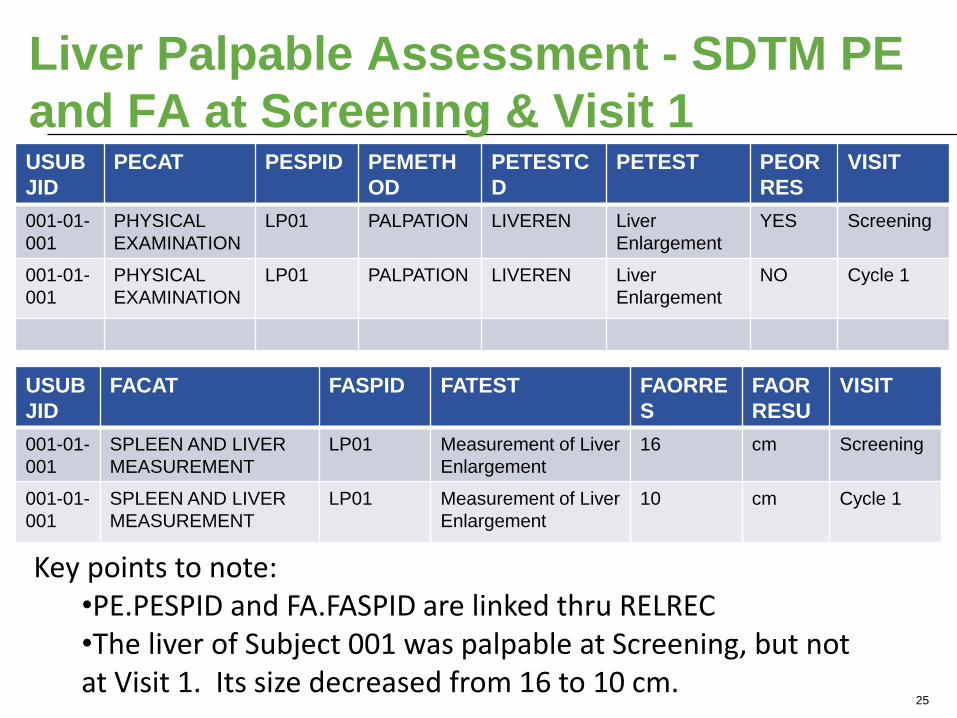
Liver Palpable Assessment - SDTM PE
and FA at Screening & Visit 1 USUB
JID
PECAT PESPID PEMETH
OD
PETESTC
D
PETEST PEOR
RES
VISIT
001-01-
001
PHYSICAL
EXAMINATION
LP01 PALPATION LIVEREN Liver
Enlargement
YES Screening
001-01-
001
PHYSICAL
EXAMINATION
LP01 PALPATION LIVEREN Liver
Enlargement
NO Cycle 1
25
Key points to note: •PE.PESPID and FA.FASPID are linked thru RELREC •The liver of Subject 001 was palpable at Screening, but not at Visit 1. Its size decreased from 16 to 10 cm.
USUB
JID
FACAT FASPID FATEST FAORRE
S
FAOR
RESU
VISIT
001-01-
001
SPLEEN AND LIVER
MEASUREMENT
LP01 Measurement of Liver
Enlargement
16 cm Screening
001-01-
001
SPLEEN AND LIVER
MEASUREMENT
LP01 Measurement of Liver
Enlargement
10 cm Cycle 1
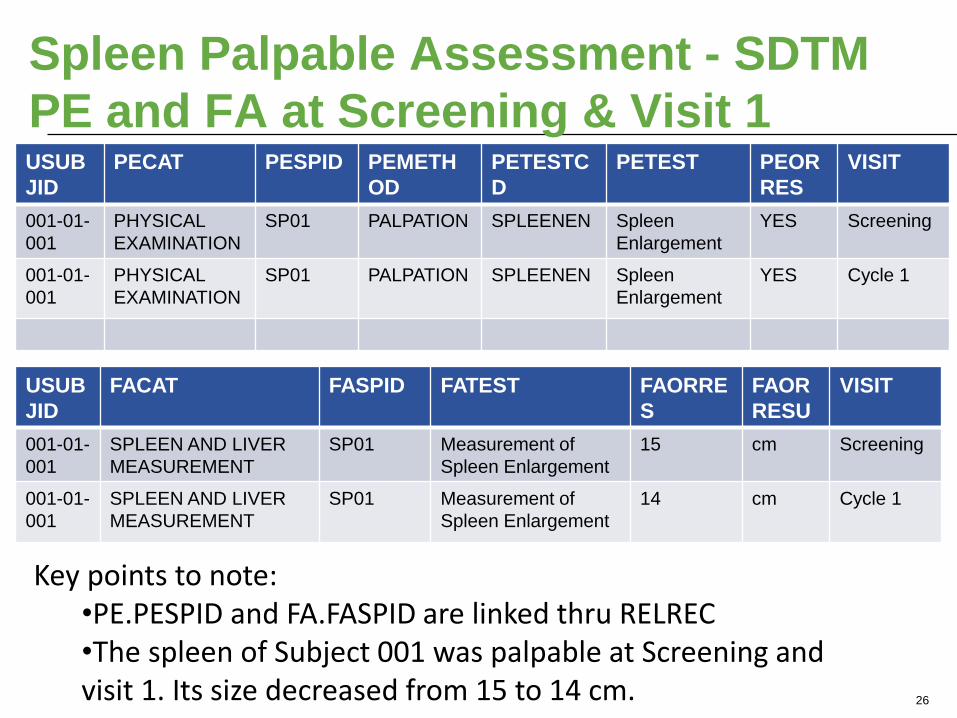
Spleen Palpable Assessment - SDTM
PE and FA at Screening & Visit 1 USUB
JID
PECAT PESPID PEMETH
OD
PETESTC
D
PETEST PEOR
RES
VISIT
001-01-
001
PHYSICAL
EXAMINATION
SP01 PALPATION SPLEENEN Spleen
Enlargement
YES Screening
001-01-
001
PHYSICAL
EXAMINATION
SP01 PALPATION SPLEENEN Spleen
Enlargement
YES Cycle 1
26
Key points to note: •PE.PESPID and FA.FASPID are linked thru RELREC •The spleen of Subject 001 was palpable at Screening and visit 1. Its size decreased from 15 to 14 cm.
USUB
JID
FACAT FASPID FATEST FAORRE
S
FAOR
RESU
VISIT
001-01-
001
SPLEEN AND LIVER
MEASUREMENT
SP01 Measurement of
Spleen Enlargement
15 cm Screening
001-01-
001
SPLEEN AND LIVER
MEASUREMENT
SP01 Measurement of
Spleen Enlargement
14 cm Cycle 1
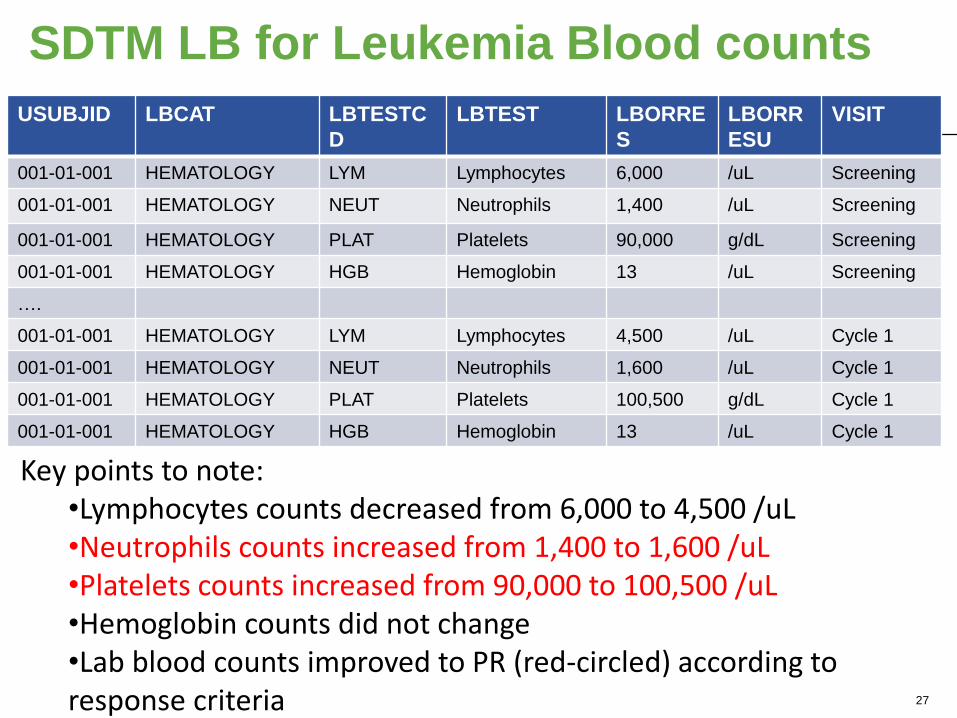
SDTM LB for Leukemia Blood counts
USUBJID LBCAT LBTESTC
D
LBTEST LBORRE
S
LBORR
ESU
VISIT
001-01-001 HEMATOLOGY LYM Lymphocytes 6,000 /uL Screening
001-01-001 HEMATOLOGY NEUT Neutrophils 1,400 /uL Screening
001-01-001 HEMATOLOGY PLAT Platelets 90,000 g/dL Screening
001-01-001 HEMATOLOGY HGB Hemoglobin 13 /uL Screening
….
001-01-001 HEMATOLOGY LYM Lymphocytes 4,500 /uL Cycle 1
001-01-001 HEMATOLOGY NEUT Neutrophils 1,600 /uL Cycle 1
001-01-001 HEMATOLOGY PLAT Platelets 100,500 g/dL Cycle 1
001-01-001 HEMATOLOGY HGB Hemoglobin 13 /uL Cycle 1
27
Key points to note: •Lymphocytes counts decreased from 6,000 to 4,500 /uL •Neutrophils counts increased from 1,400 to 1,600 /uL •Platelets counts increased from 90,000 to 100,500 /uL •Hemoglobin counts did not change •Lab blood counts improved to PR (red-circled) according to response criteria
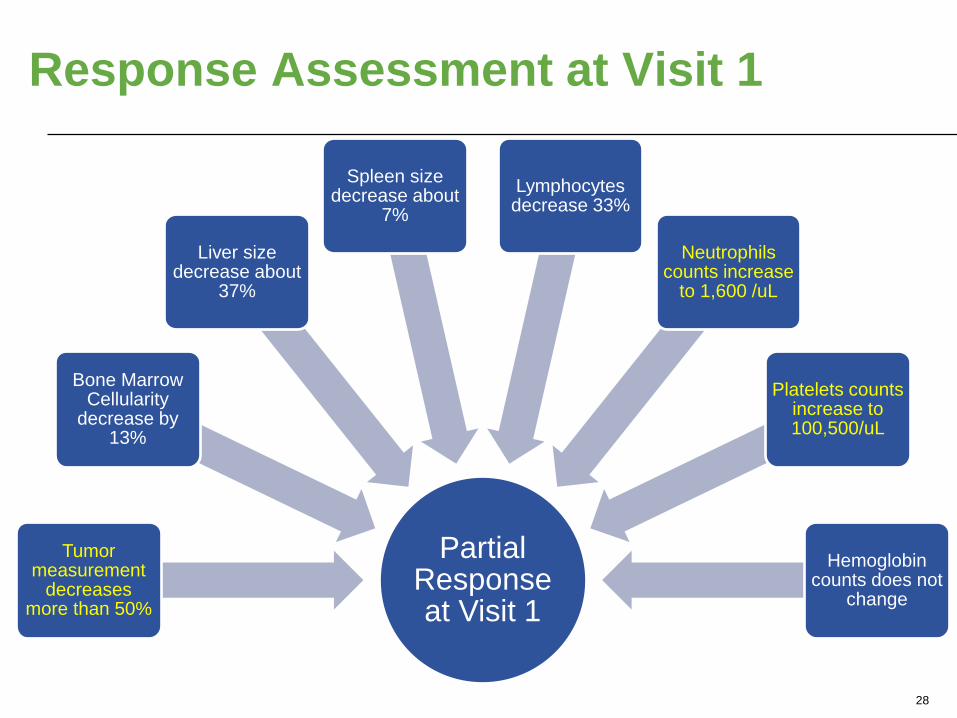
Response Assessment at Visit 1
28
Partial Response at Visit 1
Tumor measurement
decreases more than 50%
Bone Marrow Cellularity
decrease by 13%
Liver size decrease about
37%
Spleen size decrease about
7%
Lymphocytes decrease 33%
Neutrophils counts increase
to 1,600 /uL
Platelets counts increase to 100,500/uL
Hemoglobin counts does not
change
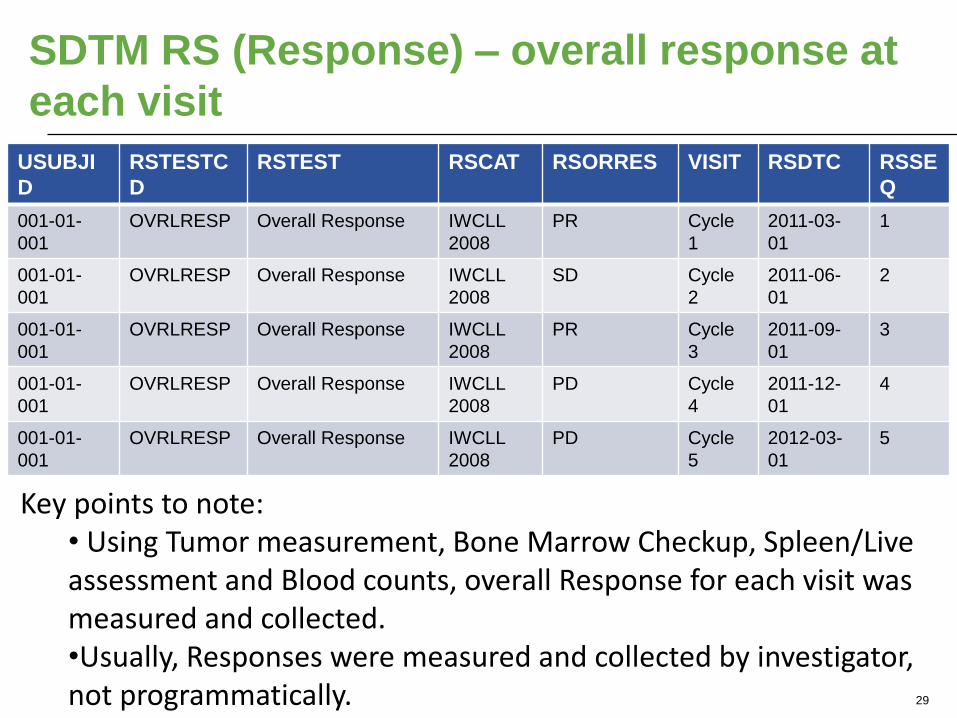
SDTM RS (Response) – overall response at
each visit
USUBJI
D
RSTESTC
D
RSTEST RSCAT RSORRES VISIT RSDTC RSSE
Q
001-01-
001
OVRLRESP Overall Response IWCLL
2008
PR Cycle
1
2011-03-
01
1
001-01-
001
OVRLRESP Overall Response IWCLL
2008
SD Cycle
2
2011-06-
01
2
001-01-
001
OVRLRESP Overall Response IWCLL
2008
PR Cycle
3
2011-09-
01
3
001-01-
001
OVRLRESP Overall Response IWCLL
2008
PD Cycle
4
2011-12-
01
4
001-01-
001
OVRLRESP Overall Response IWCLL
2008
PD Cycle
5
2012-03-
01
5
29
Key points to note: • Using Tumor measurement, Bone Marrow Checkup, Spleen/Live assessment and Blood counts, overall Response for each visit was measured and collected. •Usually, Responses were measured and collected by investigator, not programmatically.
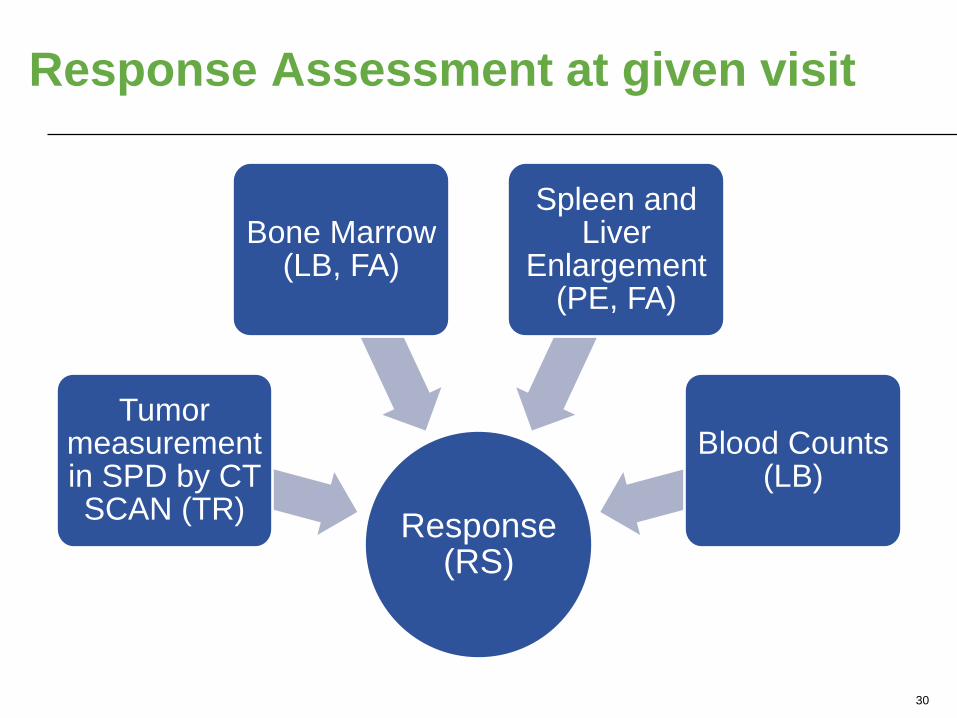
Response Assessment at given visit
30
Response (RS)
Tumor measurement in SPD by CT SCAN (TR)
Bone Marrow (LB, FA)
Spleen and Liver
Enlargement (PE, FA)
Blood Counts (LB)
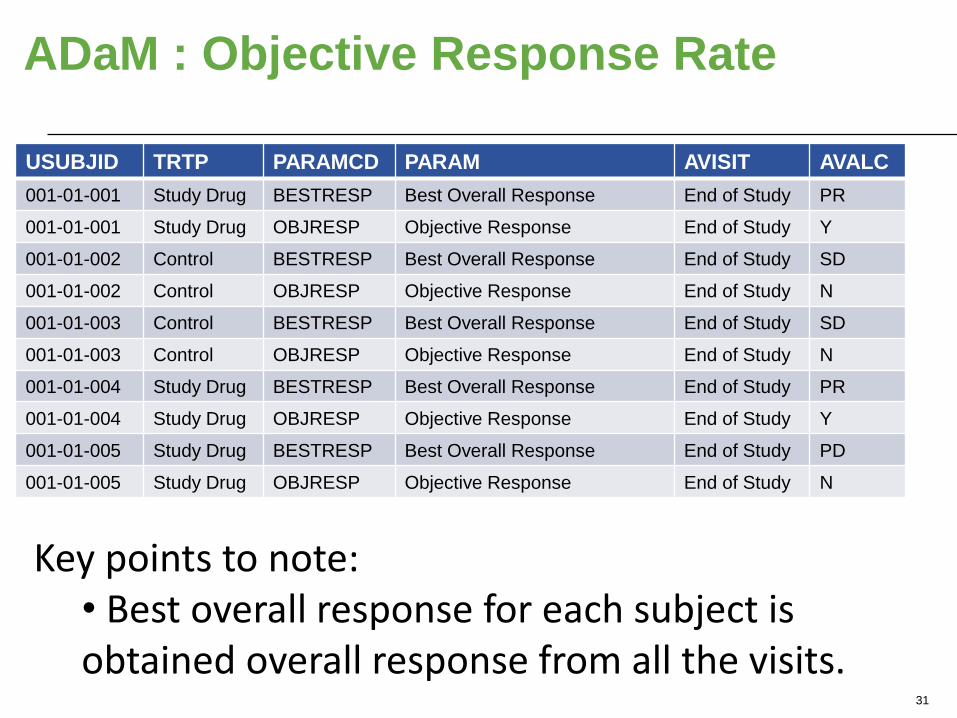
ADaM : Objective Response Rate
31
Key points to note: • Best overall response for each subject is obtained overall response from all the visits.
USUBJID TRTP PARAMCD PARAM AVISIT AVALC
001-01-001 Study Drug BESTRESP Best Overall Response End of Study PR
001-01-001 Study Drug OBJRESP Objective Response End of Study Y
001-01-002 Control BESTRESP Best Overall Response End of Study SD
001-01-002 Control OBJRESP Objective Response End of Study N
001-01-003 Control BESTRESP Best Overall Response End of Study SD
001-01-003 Control OBJRESP Objective Response End of Study N
001-01-004 Study Drug BESTRESP Best Overall Response End of Study PR
001-01-004 Study Drug OBJRESP Objective Response End of Study Y
001-01-005 Study Drug BESTRESP Best Overall Response End of Study PD
001-01-005 Study Drug OBJRESP Objective Response End of Study N
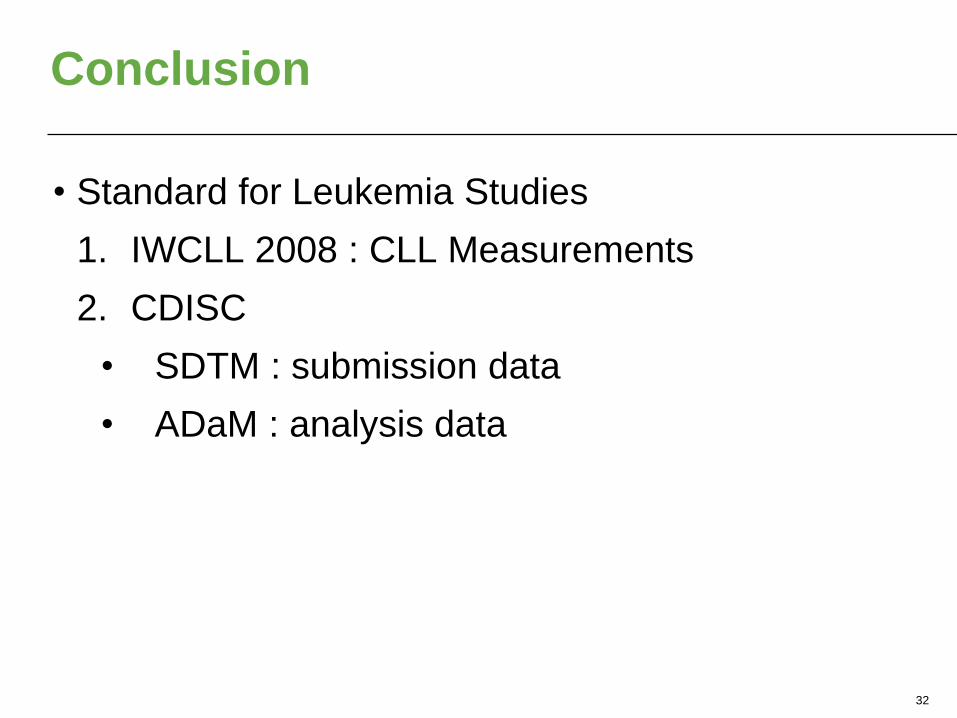
Conclusion
• Standard for Leukemia Studies
1. IWCLL 2008 : CLL Measurements
2. CDISC
• SDTM : submission data
• ADaM : analysis data
32
Contact Information and Questions
33 © 2014 Accenture All Rights Reserved.
Email address :
Linkedin Profile :
www.linkedin.com/in/HelloKevinLe
e/
Tweet : @HelloKevinLee
Slide share :
http://www.slideshare.net/KevinLe
e56
Blogs : HiKevinLee.tumbrl.com