Embed Size (px)
Citation preview
Brian BrazilFounder
PrometheusA Next Generation Monitoring System
Who am I?Engineer passionate about running software reliably in production.
● Based in Ireland● Core-Prometheus developer● Contributor to many open source projects, including Ansible, Python, Aurora
and Zookeeper.● Co-founder of gNewSense● Google SRE for 7 years, working on reliable systems and monitoring● Founder of Robust Perception, providing commercial Prometheus support
and scaling consulting
Why monitor?
● Know when things go wrong○ To call in a human to prevent a business-level issue, or prevent an issue in advance
● Be able to debug and gain insight● Trending to see changes over time, and drive technical/business decisions● To feed into other systems/processes (e.g. QA, security, automation)
Prometheus
Inspired by Google’s Borgmon monitoring system.
Started in 2012 by ex-Googlers working in Soundcloud as an open source project, mainly written in Go. Publically launched just over a year ago, and continues to be independent of any one company.
Monitoring FOSDEM: http://prometheus.conference.fosdem.net/
Community
The Prometheus community is an active ecosystem.
22 core repositories on Github, 250+ contributors.
Over 35 third-party integrations that we know of.
That’s 3 new integrations and 20 new contributors a month since public launch!
Over 100 companies rely on it.
Next Generation Monitoring System?
Three things I will to cover today:
● Instrumentation clients● Data and query model● Manageability and reliability
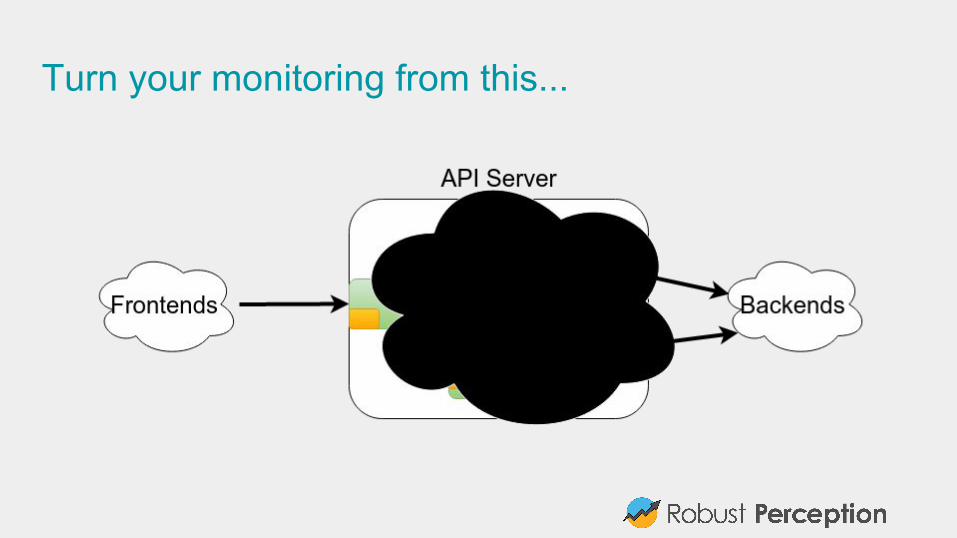
Turn your monitoring from this...
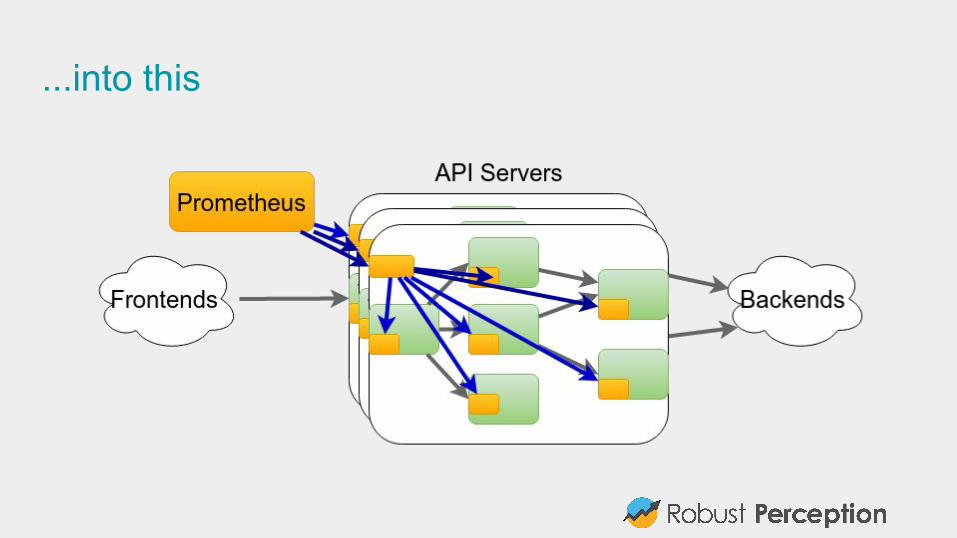
...into this
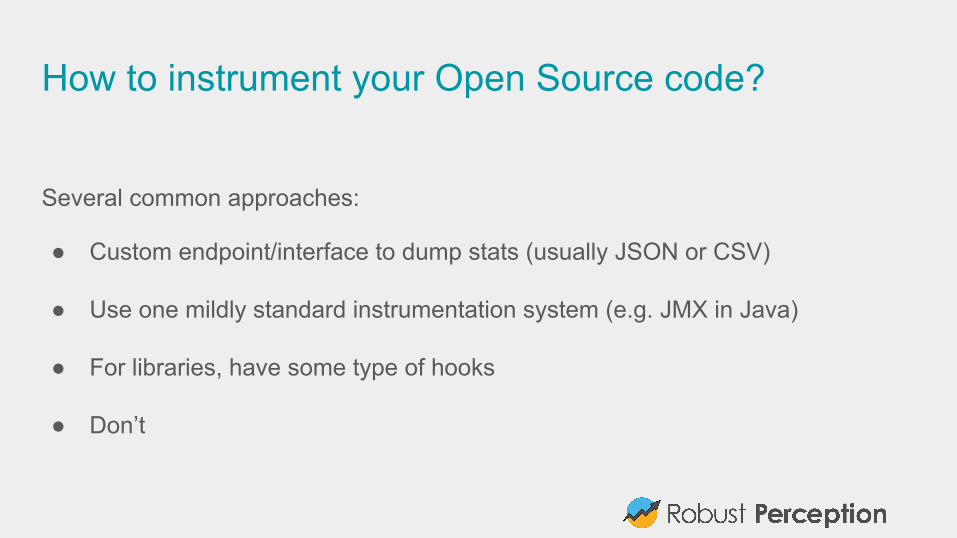
How to instrument your Open Source code?
Several common approaches:
● Custom endpoint/interface to dump stats (usually JSON or CSV)
● Use one mildly standard instrumentation system (e.g. JMX in Java)
● For libraries, have some type of hooks
● Don’t
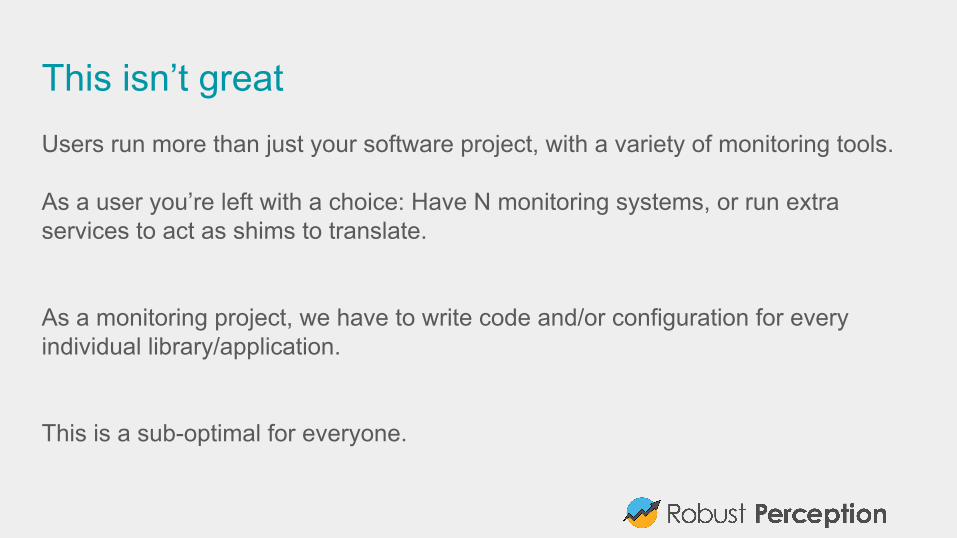
This isn’t greatUsers run more than just your software project, with a variety of monitoring tools.
As a user you’re left with a choice: Have N monitoring systems, or run extra services to act as shims to translate.
As a monitoring project, we have to write code and/or configuration for every individual library/application.
This is a sub-optimal for everyone.
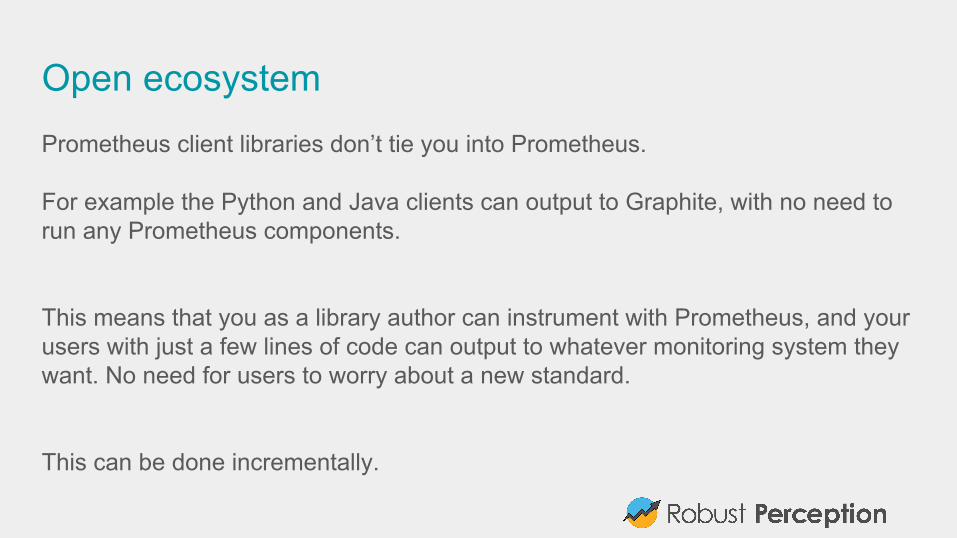
Open ecosystemPrometheus client libraries don’t tie you into Prometheus.
For example the Python and Java clients can output to Graphite, with no need to run any Prometheus components.
This means that you as a library author can instrument with Prometheus, and your users with just a few lines of code can output to whatever monitoring system they want. No need for users to worry about a new standard.
This can be done incrementally.
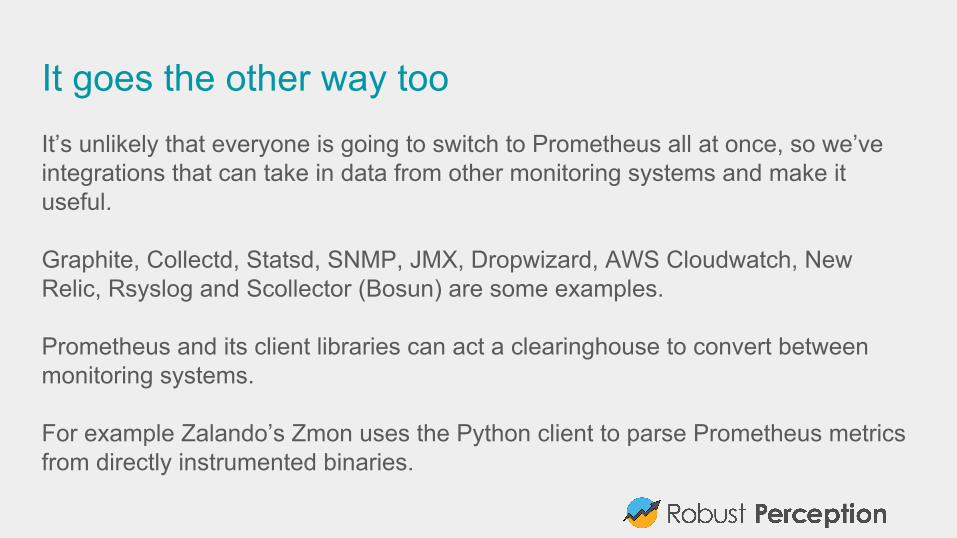
It goes the other way tooIt’s unlikely that everyone is going to switch to Prometheus all at once, so we’ve integrations that can take in data from other monitoring systems and make it useful.
Graphite, Collectd, Statsd, SNMP, JMX, Dropwizard, AWS Cloudwatch, New Relic, Rsyslog and Scollector (Bosun) are some examples.
Prometheus and its client libraries can act a clearinghouse to convert between monitoring systems.
For example Zalando’s Zmon uses the Python client to parse Prometheus metrics from directly instrumented binaries.
Instrumentation made easyPrometheus clients don’t just marshall data.
They take care of the nitty gritty details like concurrency and state tracking.
We take advantage of the strengths of each language.
In Python for example that means context managers and decorators.
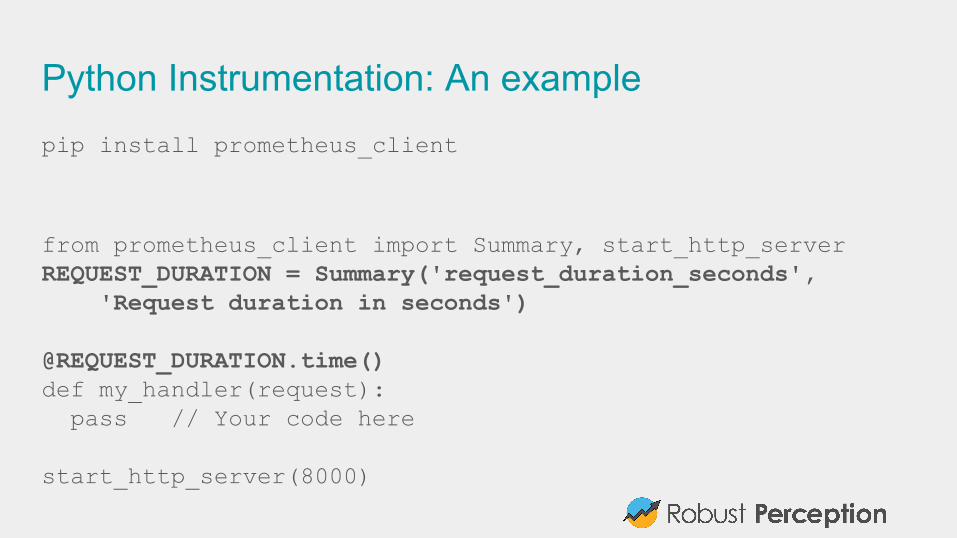
Python Instrumentation: An examplepip install prometheus_client
from prometheus_client import Summary, start_http_serverREQUEST_DURATION = Summary('request_duration_seconds', 'Request duration in seconds')
@REQUEST_DURATION.time()def my_handler(request): pass // Your code here
start_http_server(8000)
Data and Query Language: LabelsPrometheus doesn’t use dotted.strings like metric.fosdem.brussels.
Multi-dimensional labels instead like metric{event=”fosdem”,city=”brussels”}
Can aggregate, cut, and slice along them.
Can come from instrumentation, or be added based on the service you are monitoring.
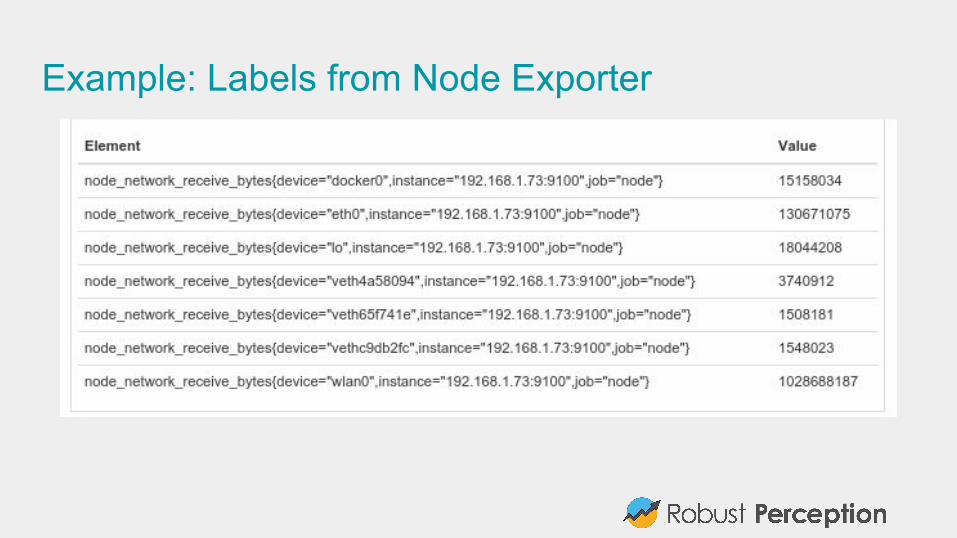
Example: Labels from Node Exporter
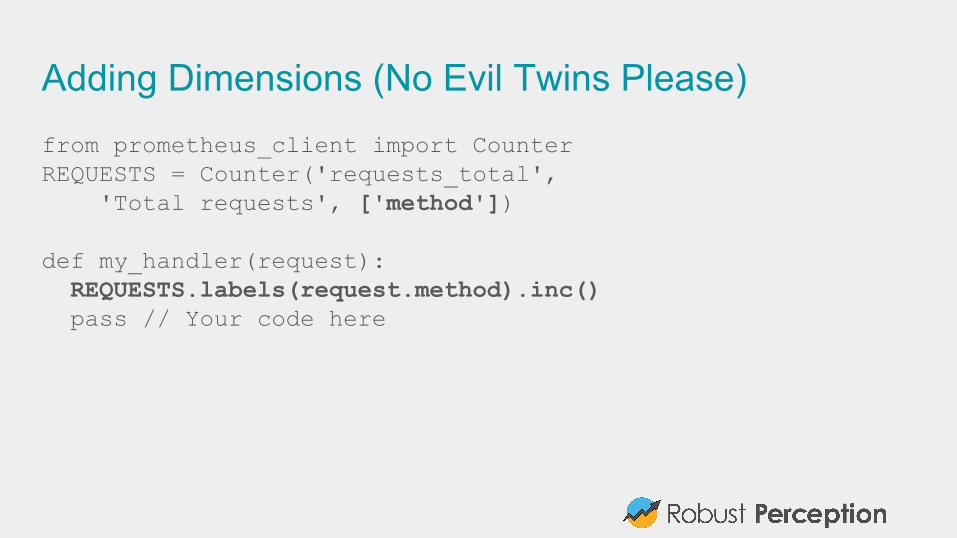
Adding Dimensions (No Evil Twins Please)from prometheus_client import CounterREQUESTS = Counter('requests_total', 'Total requests', ['method'])
def my_handler(request): REQUESTS.labels(request.method).inc() pass // Your code here
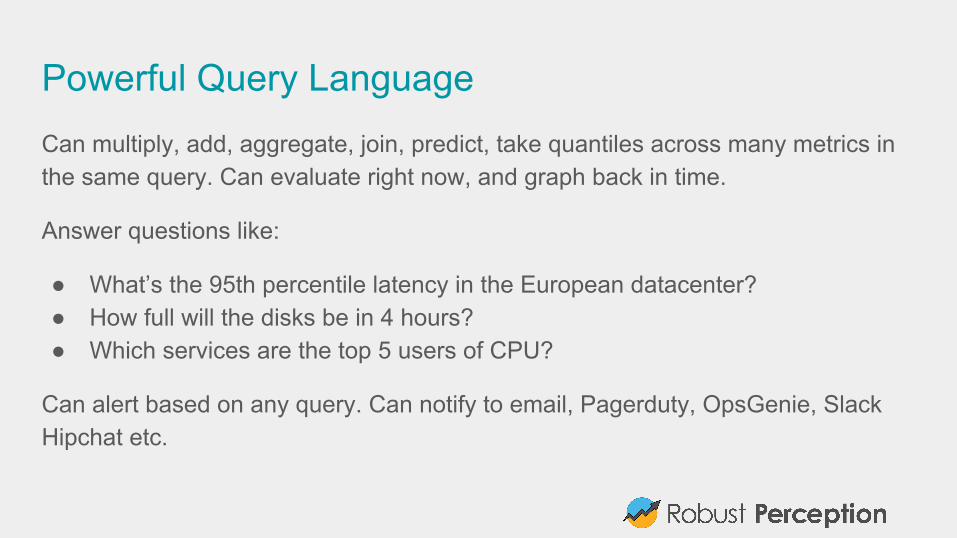
Powerful Query LanguageCan multiply, add, aggregate, join, predict, take quantiles across many metrics in the same query. Can evaluate right now, and graph back in time.
Answer questions like:
● What’s the 95th percentile latency in the European datacenter?● How full will the disks be in 4 hours?● Which services are the top 5 users of CPU?
Can alert based on any query. Can notify to email, Pagerduty, OpsGenie, Slack Hipchat etc.
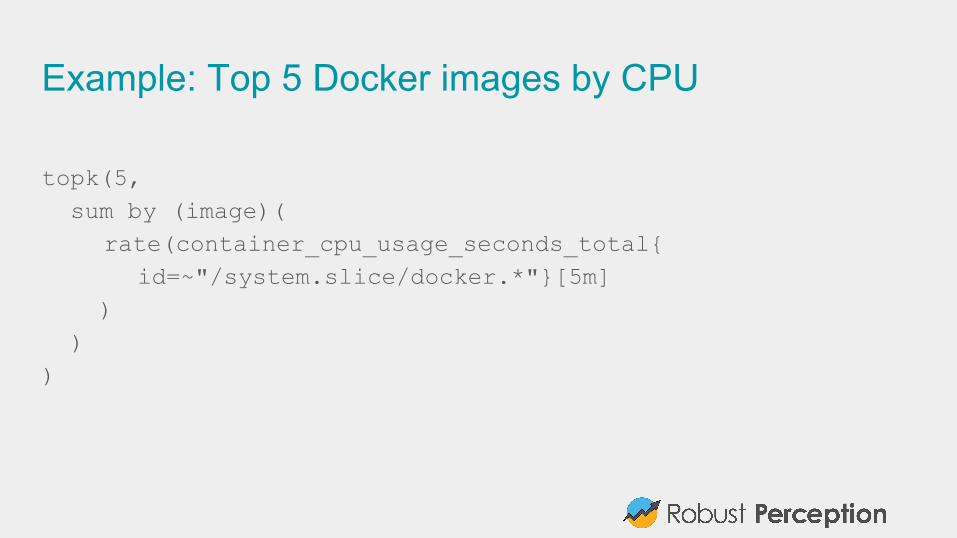
Example: Top 5 Docker images by CPU
topk(5, sum by (image)(
rate(container_cpu_usage_seconds_total{id=~"/system.slice/docker.*"}[5m]
) ))
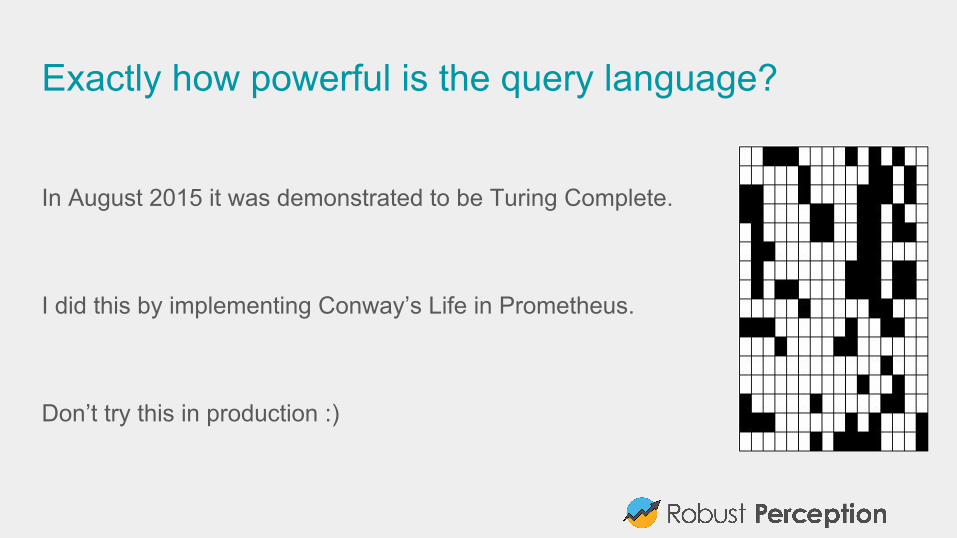
Exactly how powerful is the query language?
In August 2015 it was demonstrated to be Turing Complete.
I did this by implementing Conway’s Life in Prometheus.
Don’t try this in production :)
Manageable and ReliablePrometheus follows the Unix philosophy.
Each component does one job and does it well.
This makes it easier to manage, and isolation makes it more reliable.
Doesn’t depend on Zookeeper, Consul, Cassandra, Hadoop or the Internet.
Only requires local disk (SSD recommended). No potential for cascading failure.
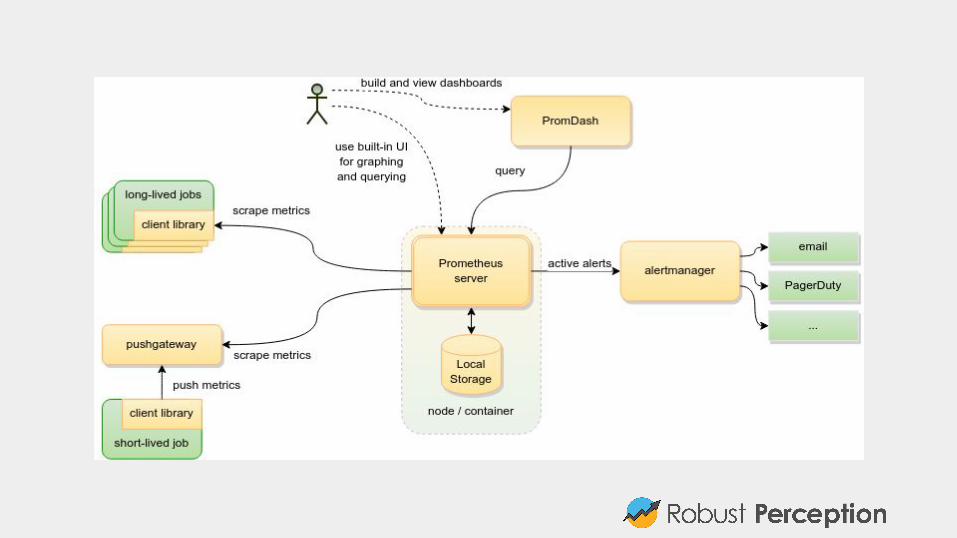
Pull modelAllows for multiple Prometheus servers to scrape services independently.
Also means it’s easy to on run a workstation for testing, no changing every machine to push to you.
Advanced service discovery finds what to monitor.
State not event based, so network blips only lose resolution - not data.
EfficientInstrumenting all the subsystems means a lot of data.
Prometheus is best in class for lossless storage efficiency, 3.5 bytes per datapoint.
A single server can handle:
● millions of metrics● hundreds of thousands of datapoints per second
ScalablePrometheus is easy to run, can give one to each team in each datacenter.
Federation allows pulling key metrics from other Prometheus servers.
When one job is too big for a single Prometheus server, can use sharding+federation to scale out. Needed with thousands of machines.
The Little ThingsWe pay attention to minor details that your life easier
There’s a registry of port numbers so you can try out components without clashes
Prometheus and alertmanager work as expected for SIGHUP and SIGTERM
Lists joined by commas have leading/trailing commas too, to make regexes easier
A Next Generation Monitoring System!I’ve talked about
● Instrumentation clients● Data and query model● Manageability and reliability
Many other aspects, such as dashboards, ease of integration, extensive documentation etc.
ResourcesOfficial Project Website: prometheus.io
Official Mailing List: [email protected]
FOSDEM: http://prometheus.conference.fosdem.net
Demo: demo.robustperception.io
Robust Perception Website: www.robustperception.io
Queries: [email protected]