Embed Size (px)
Citation preview
1
3Q09Results
Villa Flora – Low income

22
3Q09 Results Conference Call
Disclaimer
This material is a presentation of general background information about Rossi Residencial S.A. (“Rossi”) as of the date of this presentation.Information contained herein has been summarized and does not purport to be complete. This presentation shall not be considered an advice ofinvestment by potential investors. This presentation is strictly confidential and may not be disclosed to any third person. There are norepresentations or warranties, express or implied, regarding the accuracy, fairness, or completeness of the information presented herein, which shallnot support any decision of investment.This presentation contains statements and information that are forward-looking pursuant section 27A of the Securities Act of 1933, as amended, andSection 21E of the Securities and Exchange Act of 1934. Such forward-looking statements and information are only predictions and cannot assureRossi’s future performance. Investors have been cautioned that any such forward-looking statements and information are subject to many risks anduncertainties relating to the operations and business of Rossi and its subsidiaries. As a result of such risks and uncertainties, the actual results ofRossi and its subsidiaries may be materially different from any future result expressed or implied in the forward-looking statement or informationcontained herein.Although Rossi believes that the expectations and assumptions reflected in the forward-looking statements and information are reasonable and havebeen based on data currently available to its officers and directors, Rossi cannot guarantee future results or events. Rossi does not assume thecommitment of update any of the forward-looking statement of information.Securities may not be offered or sold in the United States unlesss they are registered or exempt from registration under the Securities Act of 1933,as amended. Any offering of securities to be made in the United States will be made by means of an offering memorandum that may be obtainedfrom the underwriters. Such offering memorandum will contain, or incorporate by reference, detailed information about Rossi and its subsidiaries,their business and financial results, as well as its financial statements.This material is for distribution only to person who (i) have professional experience in matters relating to investments falling within Article 19 (5) ofthe Financial Services and Markets Act of 2000 (Financial Promotion) Order 2005 (as amended, the “Financial Promotion Order”), (ii) are personsfalling within Article 49 (2) (a) to (d) (“high net worth companies, unincorporated associations etc”) of the Financial Promotion Order, (iii) areoutside the United Kingdom, or (iv) are persons to whom an invitation or inducement to engage in investment activity (within the meaning of section21 of the Financial Services and Markets Act 2000) in connection with the issue or sale of any securities may otherwise lawfully be communicated orcaused to be communicated (all such persons together being referred to as “relevant persons”). This material is directed only at relevant personsand must not be acted on or relied on by persons who are not relevant persons. Any investment or investment activity to which this material relatesis available only to relevant persons and will be engaged in only with relevant persons.
This presentation does not constitute an offer, invitation or solicitation of an offer to subscribe to or purchase any securities. Neither thispresentation nor anything contained herein shall form the basis of any contract or commitment whatsoever.
33
3Q09 Results Conference Call
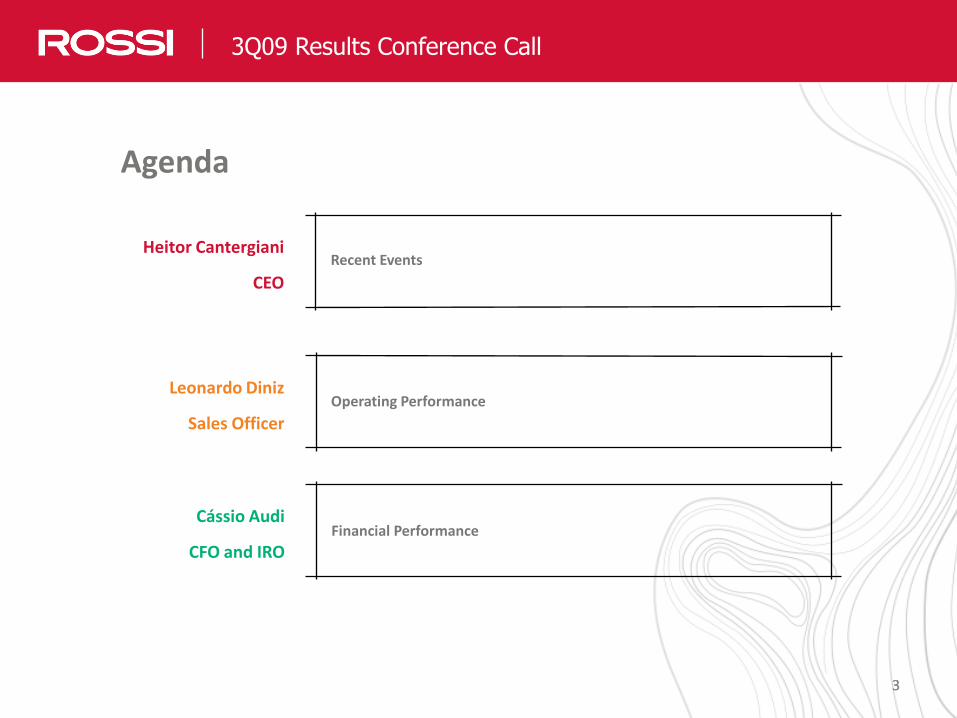
Heitor Cantergiani
CEO
Recent Events
Leonardo Diniz
Sales OfficerOperating Performance
Cássio Audi
CFO and IROFinancial Performance
Agenda

44
3Q09 Highlights
Recent Events
Conclusion of Primary Offering in October 2009, raising a total of R$928 million.
Increase of free float from 47.8% to 62.7%
Liquidity increase - 3rd largest in the Latin American industry.
Operating Performance Record launches of R$ 1.1 bi (R$ 873 million - % Rossi) in 3Q09 divided into 18 projects with a total
of 4,947 units.
Contracted sales of R$ 664 million (R$ 517 million - % Rossi), of which 68% were inventory sales.
SOS of 21.0% (vs. 20.1% in 2Q09)
Economic Segment
3,770 units launched in the quarter (equivalent to 15,000 units annualized), 143% higher than in
3Q08.
62% of launched units in 3Q09 were already sold
Financial Performance Net income growth of 73.7% vs. 3Q08, totaling R$ 61.8 million.
Gross margin(1) stable at 35.0% (3.7 p.p. increase vs. 3Q08)
EBITDA margin of 24.5% (7.5 p.p. increase vs. 3Q08)
Net margin of 14.3% (4.3 p.p. increase vs. 3Q08)
ROE(³) of 18.4% (annualized) vs. 12% in 3Q08 (5.8 p.p. increase)
Continued efficient management of selling and administrative expenses
Cash burn stable and among the lowest in the industry
(1) excluding financial effect
(²) Methodology comparable to our main competitors – detailed at the earnings release
55
Recent Events
Villa Flora – Economic Segment
6
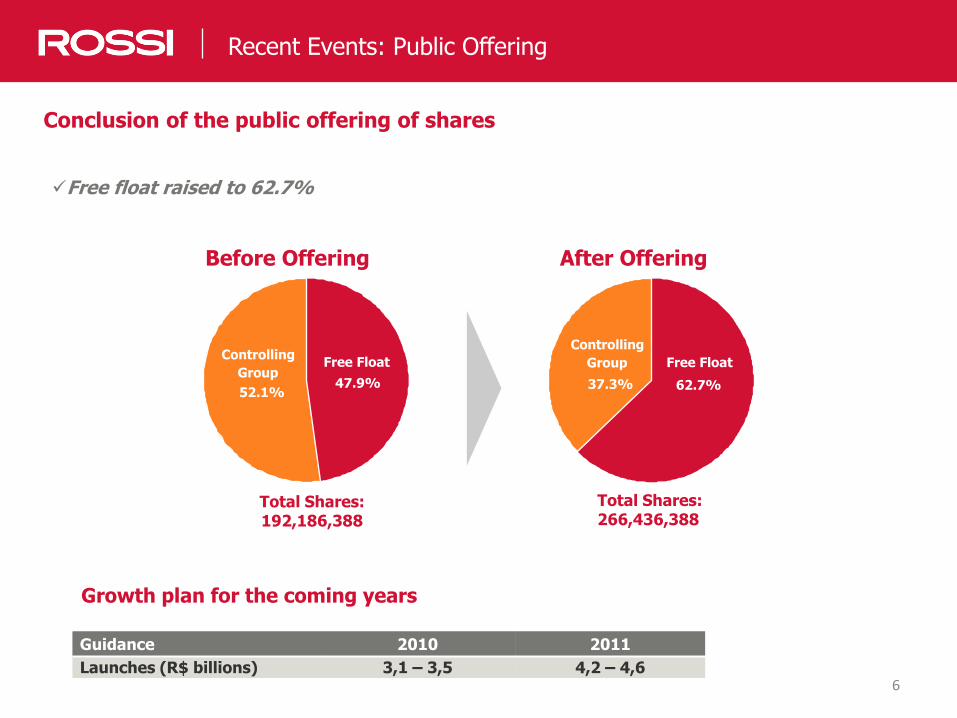
Recent Events: Public Offering
Conclusion of the public offering of shares
Free float raised to 62.7%
Free Float
47.9%
Controlling
Group
52.1%
Free Float
62.7%37.3%
Before Offering After Offering
Controlling
Group
Total Shares:192,186,388
Total Shares:266,436,388
Guidance 2010 2011
Lançamentos (R$ bilhões) 3,1 – 3,5 4,2 – 4,6
Growth plan for the coming years
Guidance 2010 2011
Launches (R$ billions) 3,1 – 3,5 4,2 – 4,6
77
Launches and Sales
Economic Segment
Villa Flora – Economic Segment
88
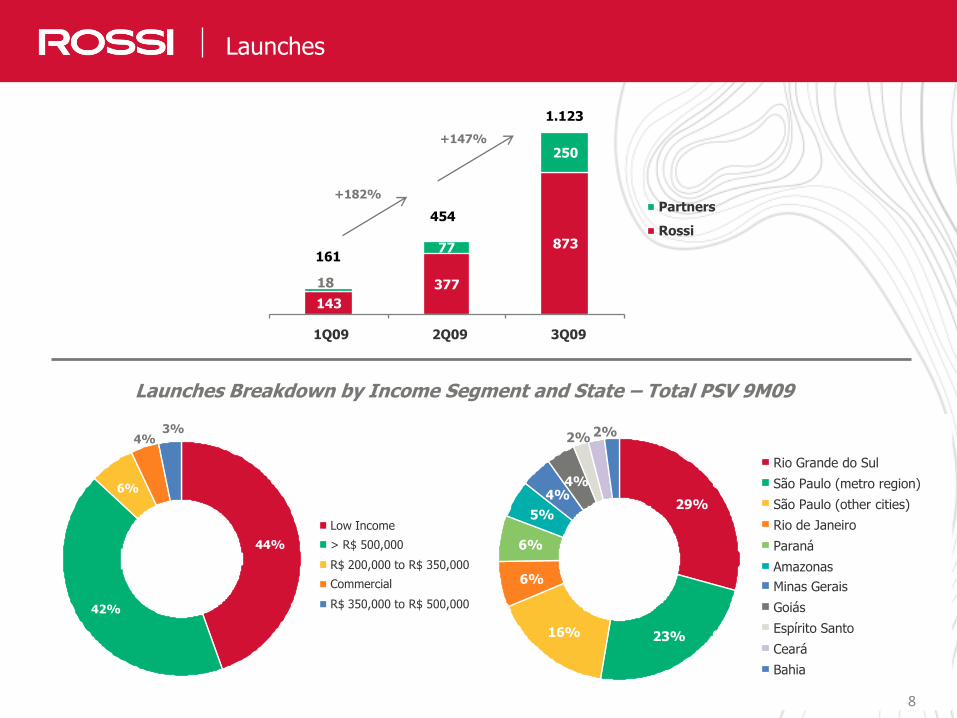
Launches
Launches Breakdown by Income Segment and State – Total PSV 9M09
+147%
801
+182%
143
377
873
18
77
250
1Q09 2Q09 3Q09
Partners
Rossi
161
454
1.123
29%
23%16%
6%
6%
5%
4%4%
2%2%
Rio Grande do Sul
São Paulo (metro region)
São Paulo (other cities)
Rio de Janeiro
Paraná
Amazonas
Minas Gerais
Goiás
Espírito Santo
Ceará
Bahia
44%
42%
6%
4%3%
Low Income
> R$ 500,000
R$ 200,000 to R$ 350,000
Commercial
R$ 350,000 to R$ 500,000
8
9
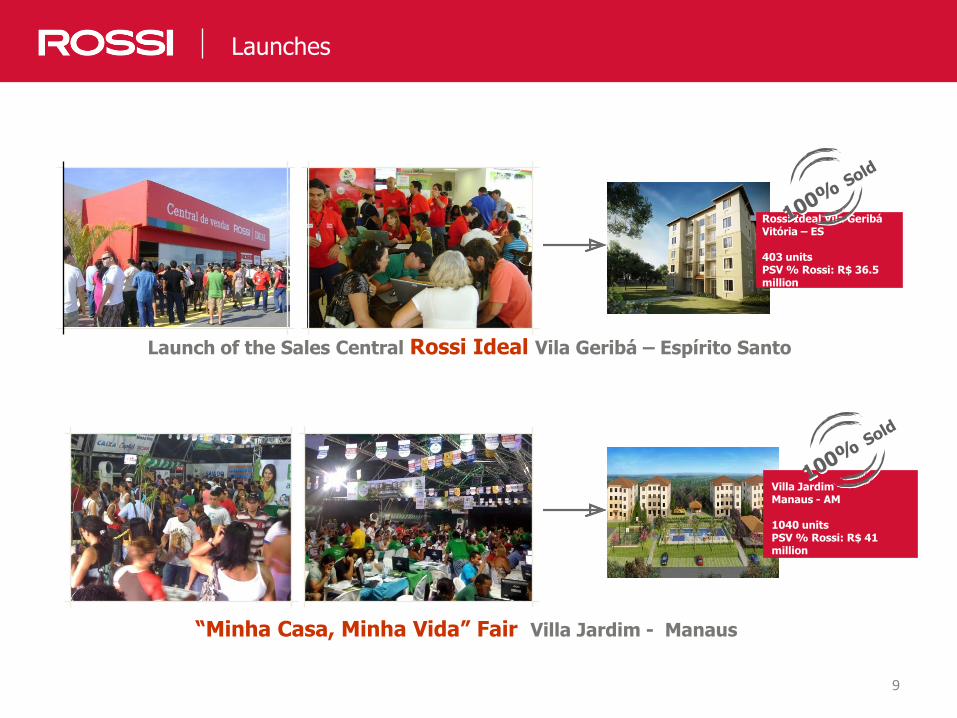
Real Estate Market: Industry and Company OverviewLaunches
Villa Jardim Manaus - AM
1040 unitsPSV % Rossi: R$ 41 million
Launch of the Sales Central Rossi Ideal Vila Geribá – Espírito Santo
“Minha Casa, Minha Vida” Fair Villa Jardim - Manaus
Rossi Ideal Vila GeribáVitória – ES
403 unitsPSV % Rossi: R$ 36.5 million
101010
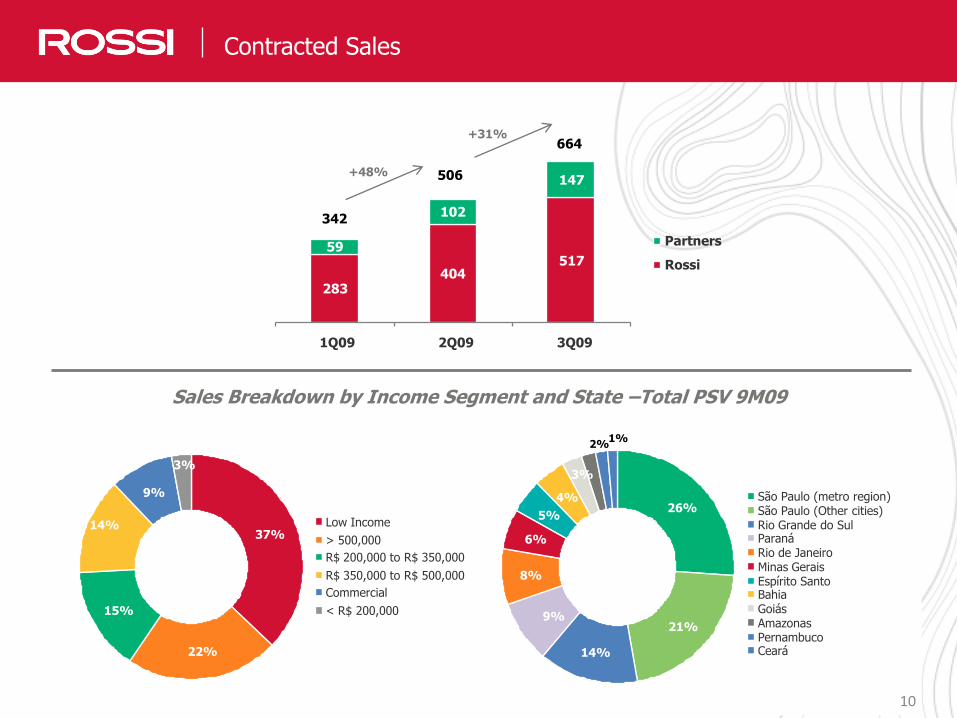
Contracted Sales
Sales Breakdown by Income Segment and State –Total PSV 9M09
342
506
664
283404
51759
102
147
1Q09 2Q09 3Q09
Partners
Rossi
+48%
+31%
37%
22%
15%
9%
3%
14% Low Income
> 500,000
R$ 200,000 to R$ 350,000
R$ 350,000 to R$ 500,000
Commercial
< R$ 200,000
26%
21%
14%
8%
6%
5%
4%
2%1%
9%
3%
São Paulo (metro region)São Paulo (Other cities)Rio Grande do SulParanáRio de JaneiroMinas GeraisEspírito SantoBahiaGoiásAmazonasPernambucoCeará
10
11
Nossos Resultados em Números
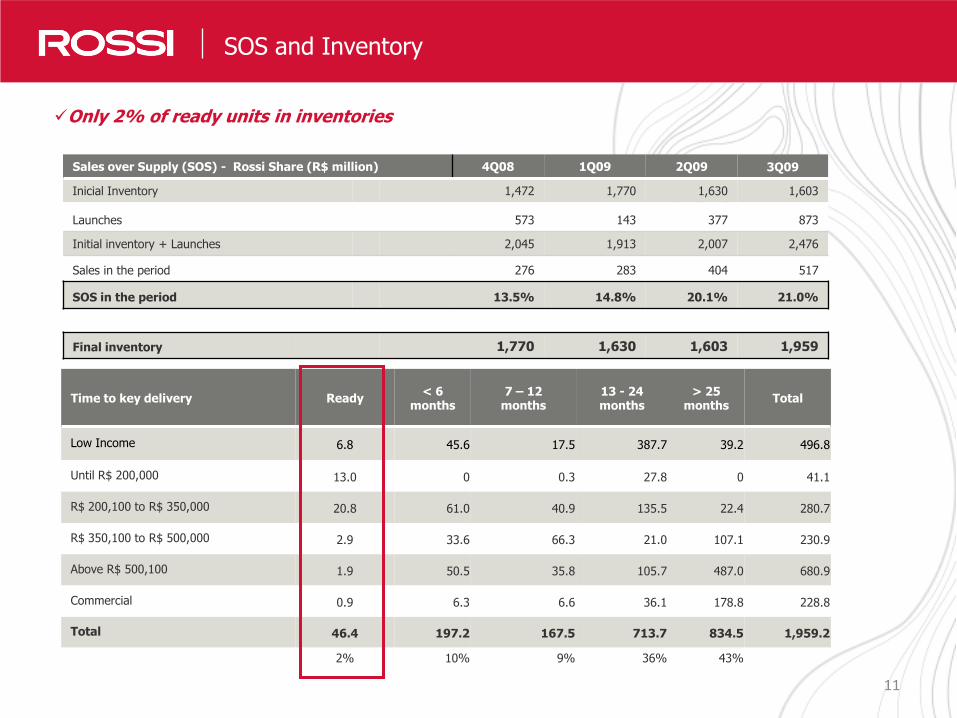
Sales over Supply (SOS) - Rossi Share (R$ million) 4Q08 1Q09 2Q09 3Q09
Inicial Inventory 1,472 1,770 1,630 1,603
Launches 573 143 377 873
Initial inventory + Launches 2,045 1,913 2,007 2,476
Sales in the period 276 283 404 517
SOS in the period 13.5% 14.8% 20.1% 21.0%
Final inventory 1,770 1,630 1,603 1,959
Time to key delivery Ready< 6
months7 – 12
months13 - 24 months
> 25 months
Total
Low Income 6.8 45.6 17.5 387.7 39.2 496.8
Until R$ 200,000 13.0 0 0.3 27.8 0 41.1
R$ 200,100 to R$ 350,000 20.8 61.0 40.9 135.5 22.4 280.7
R$ 350,100 to R$ 500,000 2.9 33.6 66.3 21.0 107.1 230.9
Above R$ 500,100 1.9 50.5 35.8 105.7 487.0 680.9
Commercial 0.9 6.3 6.6 36.1 178.8 228.8
Total 46.4 197.2 167.5 713.7 834.5 1,959.2
2% 10% 9% 36% 43%
Only 2% of ready units in inventories
SOS and Inventory

12
Expertise Rossi e Diferenciais Competitivos
Landbank diversified by region and product
48% of Landbank focused on the Low Income
Landbank 3Q09 (R$ million) - PSV by State and Income Segment
EstadoEconomic Segment
< R$ 200,000
R$200,001 to R$ 350,000
R$350,001 to R$ 500,000 > R$ 500,000 Commercial Lots Total %
Amazonas 371 74 - - - - 445 2%
Bahia - - 879 467 - - - 1,347 6%
Ceará 371 - - 104 - - - 476 2%
Federal District 914 211 - - 367 534 - 2,027 9%
Espírito Santo 662 - - - - 117 - 779 4%
Goiás 1,375 - - - - - - 1,375 6%
Mato Grosso do Sul 53 - - - - - - 53 0%
Minas Gerais 1,775 92 138 - - - - 2,006 9%
Paraná 101 - 112 - - - - 213 1%
Rio de Janeiro 660 - 325 992 88 - - 2,065 9%
Rio Grande do Norte 155 - - - - 82 - 237 1%
Rio Grande do Sul 1,992 - 586 - 778 - - 3,356 15%
São Paulo(other cities)
1,626 188 1,189 455 671 49 423 4,601 21%
São Paulo (metro region)
378 - 192 972 1,089 30 140 2,801 13%
T O T A L 10,435 566 3,421 2,991 2,994 812 563 21,781 100%
Distribution 48% 3% 16% 14% 14% 4% 3% 100%
Land Bank

131313
Financial Highlights
141414
Destaques ResultadosFinancial Highlights
(1) Adjusted to Excluding financial factors
(2) Net income / Average Stockholders' Equity for the period
Net Income
Net income growth of 73.7% over 3Q08, totaling R$ 61.8 million.
Margins
Gross Margin(¹) stable at 35,0% (3.7 p.p. increase over 3Q08)
EBITDA Margin de 24,5% (7.5 p.p. increase over 3Q08)
Net Margin of 14,3% (4.3 p.p. increase over 3Q08)
ROE(²) of 18.4% (annualized) vs. 12% in 3Q08
Administrative and Selling Expenses
Continued efficient management of selling and administrative expenses
Cash Burn stable and among the lowest in the industry

15
96.0
145.6
232.5
360.5
3Q08 3Q09 9M08 9M09
354.6 430.6
914.01,096.3
3Q08 3Q09 9M08 9M09
15
Nossos Resultados em NúmerosFinancial Highlights
Net revenue reaches R$ 431 million, 21.4% higher than 3Q08
Gross Margin of 35,0% - 3.7 p.p. higher than 3Q08
Net Revenue (R$ million)
21%
20%
52%
55%
Adjusted Gross Income (R$ million) and adjusted Gross Margin
Net Revenue 3Q09 3Q08 9M09 9M08
Property sales and services 427 99.2% 320 90.3% 1,080 98.5% 825 90.3%
Monetary variation and interest 14 3.3% 48 13.4% 50 4.5% 121 13.2%
(-) sales taxes (11) -2.5% (13) -3.7% (34) -3.1% (32) -3.5%
Total 431 100.0% 355 100.0% 1,096 100.0% 914 100.0%
Custo dos Imóveis Vendidos 3Q09 3Q08 9M09 9M08
Works + sites (271) 90.9% (211) 95.7% (686) 90.8% (561) 96.1%
Financial charges (27) 9.1% (9) 4.3% (70) 9.2% (23) 3.9%
Total (298) 100% (220) 100% (756) 100% (584) 100%
Adjusted gross income* 145 96 360 232
Adjusted gross margin* 35.0% 31.3% 34.4% 29.3%
* Excluding financial effects
31.3%
35.0%29.3%
34.4%

1616
Nossos Resultados em Números
EBITDA margin of 24.5%, 7.5 p.p. increase (vs 3Q08)
Net income in the period of R$ 61.8 million, 73.7% growth (vs 3Q08)
Financial Highlights
Net Income (R$ million) and Net Margin (%)
35.661.8
102.3
141.5
3Q08 3Q09 9M08 9M09
74%
38%10.0%
14.3% 11.2%
12.9%
EBITDA (R$ million) and EBITDA Margin (%)
60.1105.4
153.4247.2
3Q08 3Q09 9M08 9M09
75%61%
16.9%
24.5%16.8%
22.5%
EBITDA 3Q09 3Q08 Var. 9M09 9M08 Var.
Net Income 62 36 74% 142 102 38%
(+/-) Financial Expenses (Revenues), Net 1 13 -90% (1) 20 -103%
(+) Deferred income tax and social contribution 8 (1) n.m. 19 2 787%
(+) Depreciation and amortization 7 3 132% 17 6 163%
(+) Interest 27 9 188% 70 23 209%
ADJUSTED EBITDA 105 60 75% 247 153 61%
ADJUSTED EBITDA Margin 24.5% 16.9% 7.5 p.p. 22.5% 16.8% 5.8 p.p.

171717
Nossos Resultados em Números
Selling expenses (R$ million) Administrative expenses (R$ million)
More efficient at selling and administrative expenses
Financial Highlights
Operating expenses (R$ million) 3Q09 3Q08 Var. 9M09 9M08 Var.
Administrative 24 29 -17,2% 71 78 -8.8%
Selling 25 44 -43.5% 76 100 -24.1%
Administrative/Net Revenue 5.7% 8.1% -2.5p.p. 6.5% 8.6% -2.1p.p.
Selling/Net Revenue 5.7% 12.4% -6.6p.p. 7.0% 11.0% -4.0p.p.
44
25 25
3T08 2T09 3T09
-43.2%
0.0% 29
23 24
3Q08 2Q09 3Q09
-20%4.3%
3Q08 2Q09 3Q09
181818
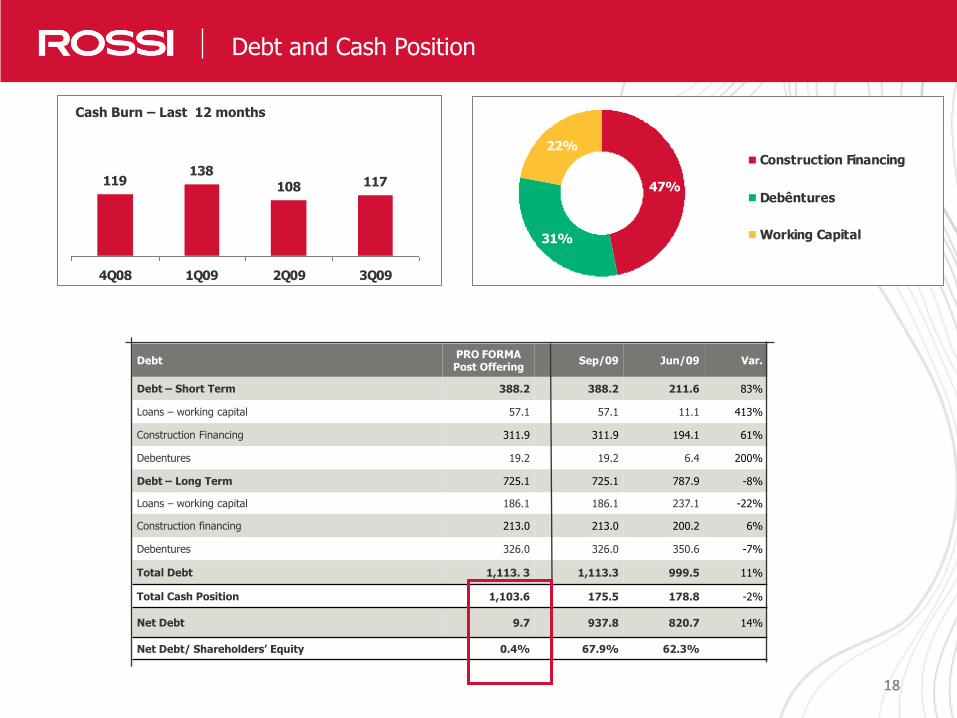
Nossos Resultados em NúmerosDebt and Cash Position
DebtPRO FORMA Post Offering
Sep/09 Jun/09 Var.
Debt – Short Term 388.2 388.2 211.6 83%
Loans – working capital 57.1 57.1 11.1 413%
Construction Financing 311.9 311.9 194.1 61%
Debentures 19.2 19.2 6.4 200%
Debt – Long Term 725.1 725.1 787.9 -8%
Loans – working capital 186.1 186.1 237.1 -22%
Construction financing 213.0 213.0 200.2 6%
Debentures 326.0 326.0 350.6 -7%
Total Debt 1,113. 3 1,113.3 999.5 11%
Total Cash Position 1,103.6 175.5 178.8 -2%
Net Debt 9.7 937.8 820.7 14%
Net Debt/ Shareholders’ Equity 0.4% 67.9% 62.3%
119138
108 117
4Q08 1Q09 2Q09 3Q09
47%
31%
22%Construction Financing
Debêntures
Working Capital
Cash Burn – Last 12 months
191919
NossosResultados em NúmerosShare Performance
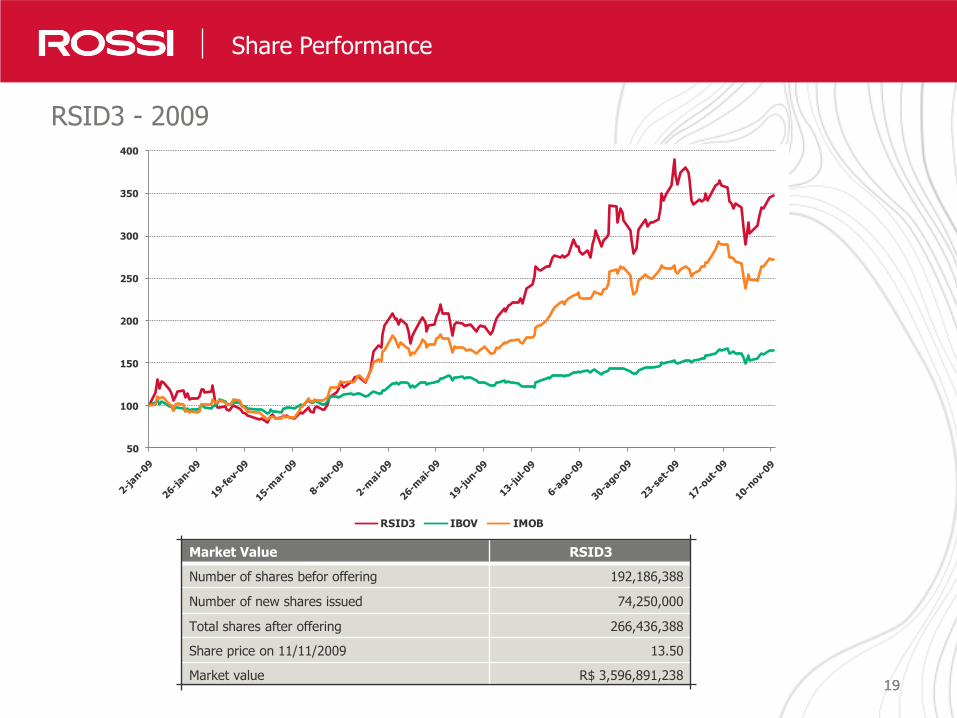
RSID3 - 2009
Market Value RSID3
Number of shares befor offering 192,186,388
Number of new shares issued 74,250,000
Total shares after offering 266,436,388
Share price on 11/11/2009 13.50
Market value R$ 3,596,891,238
50
100
150
200
250
300
350
400
RSID3 IBOV IMOB
202020
Cássio Elias AudiCFO and Investor Relations Officer
Carolina BurgInvestor Relations [email protected]. (55 11) 3759-7516
IR Team
Contacts

2121
Q&A