Embed Size (px)
Citation preview
THIRDQUARTER 2015October 21st, 2015
Tele2 AB
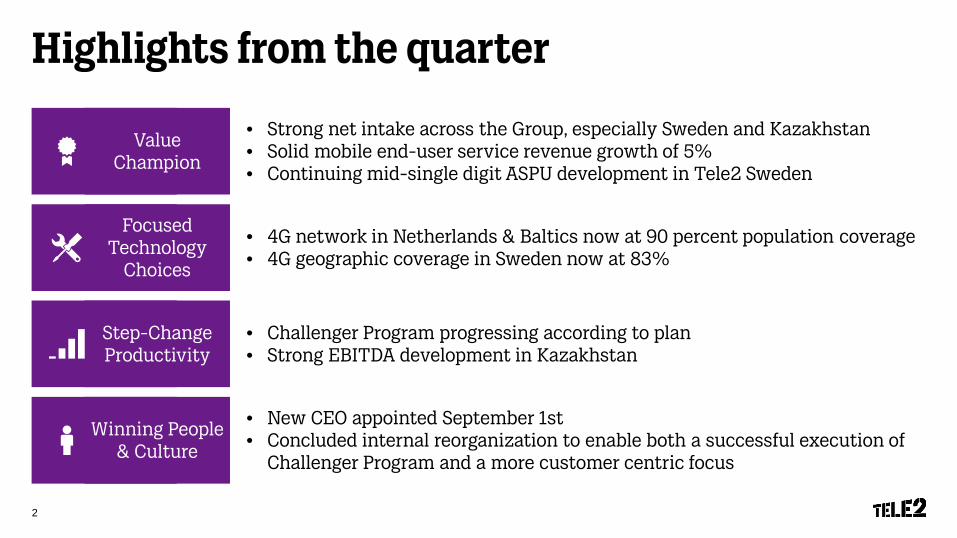
Highlights from the quarter
Winning People & Culture
Value Champion
Step-Change Productivity
Focused Technology
Choices
• New CEO appointed September 1st • Concluded internal reorganization to enable both a successful execution of
Challenger Program and a more customer centric focus
• 4G network in Netherlands & Baltics now at 90 percent population coverage• 4G geographic coverage in Sweden now at 83%
• Strong net intake across the Group, especially Sweden and Kazakhstan• Solid mobile end-user service revenue growth of 5% • Continuing mid-single digit ASPU development in Tele2 Sweden
• Challenger Program progressing according to plan• Strong EBITDA development in Kazakhstan
2
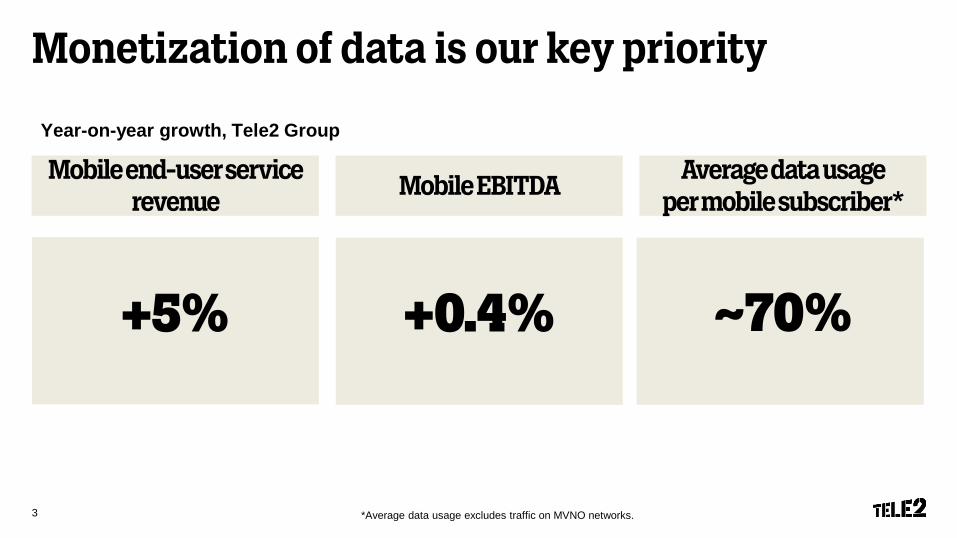
Monetization of data is our key priority
*Average data usage excludes traffic on MVNO networks.
Year-on-year growth, Tele2 Group
Mobile end-user service revenue
Mobile EBITDA Average data usage per mobile subscriber*
+5% +0.4% ~70%
3
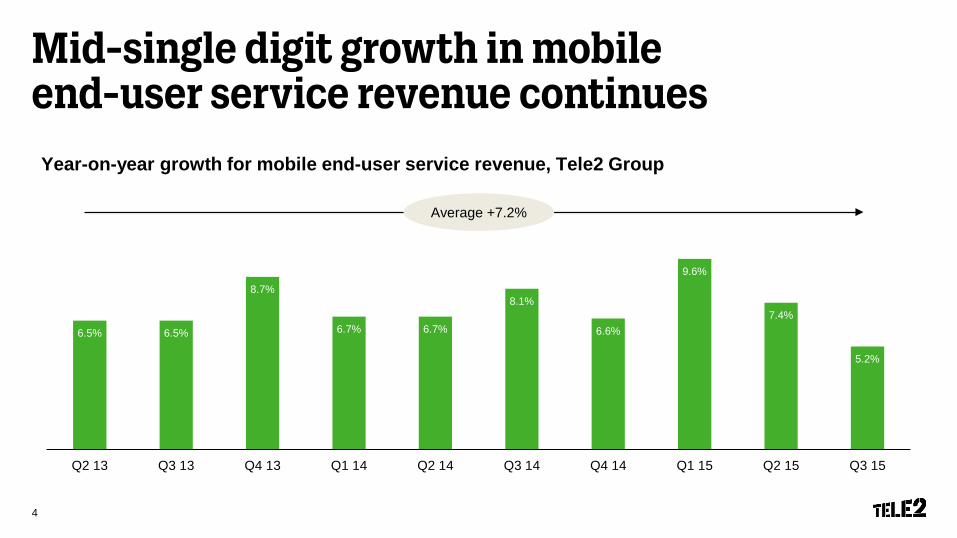
Mid-single digit growth in mobile end-user service revenue continuesYear-on-year growth for mobile end-user service revenue, Tele2 Group
Average +7.2%
6.5% 6.5%
8.7%
6.7% 6.7%
8.1%
6.6%
9.6%
7.4%
5.2%
Q2 13 Q3 13 Q4 13 Q1 14 Q2 14 Q3 14 Q4 14 Q1 15 Q2 15 Q3 15
4
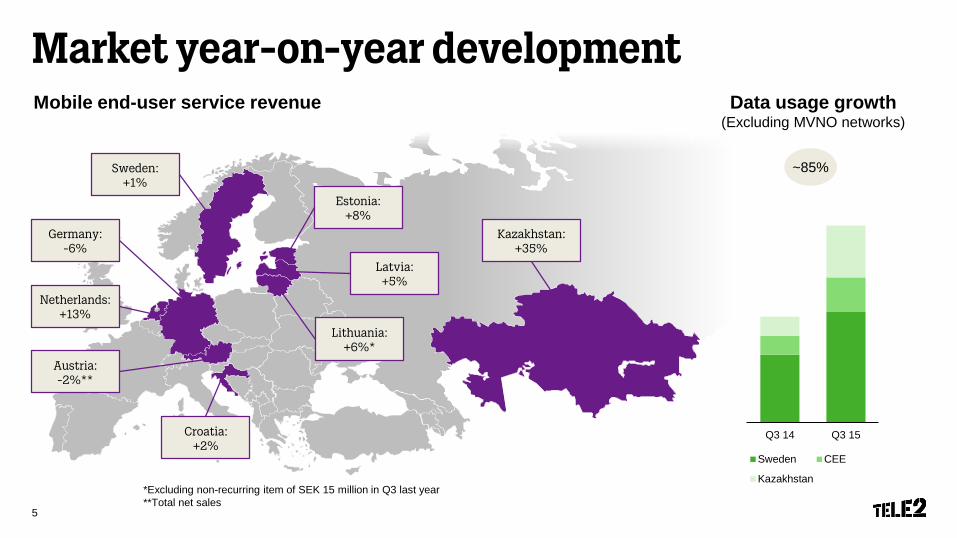
Kazakhstan: +35%
Latvia: +5%
Lithuania: +6%*
Sweden: +1%
Netherlands: +13%
Austria: -2%**
Croatia: +2%
Germany: -6%
Estonia: +8%
Market year-on-year development
*Excluding non-recurring item of SEK 15 million in Q3 last year**Total net sales
Mobile end-user service revenue Data usage growth (Excluding MVNO networks)
~85%
Q3 14 Q3 15
Sweden CEE
Kazakhstan
5
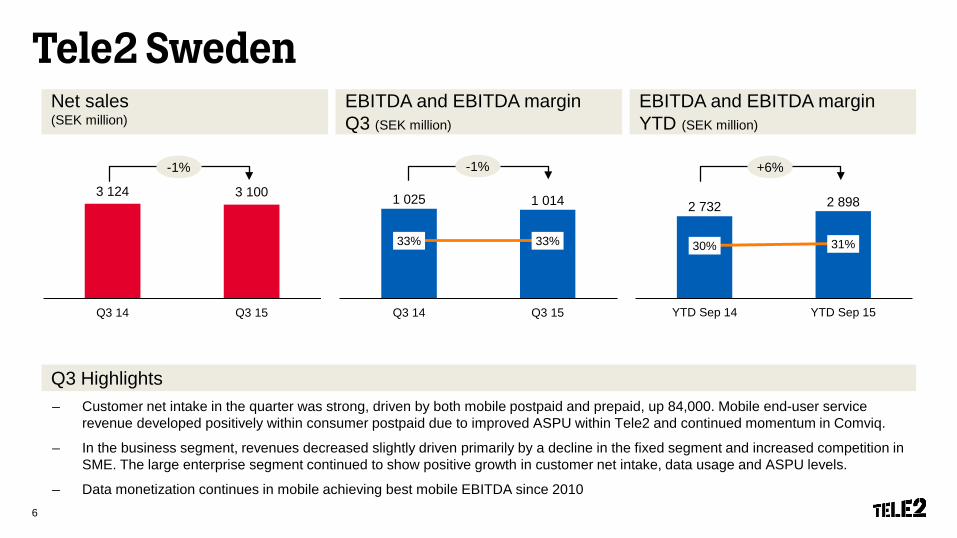
Tele2 SwedenNet sales(SEK million)
EBITDA and EBITDA marginQ3 (SEK million)
– Customer net intake in the quarter was strong, driven by both mobile postpaid and prepaid, up 84,000. Mobile end-user service revenue developed positively within consumer postpaid due to improved ASPU within Tele2 and continued momentum in Comviq.
– In the business segment, revenues decreased slightly driven primarily by a decline in the fixed segment and increased competition in SME. The large enterprise segment continued to show positive growth in customer net intake, data usage and ASPU levels.
– Data monetization continues in mobile achieving best mobile EBITDA since 2010
Q3 Highlights
3 124 3 100
Q3 14 Q3 15
-1% -1%
EBITDA and EBITDA margin YTD (SEK million)
1 025 1 014
33% 33%
0%
10%
20%
30%
40%
50%
60%
Q3 14 Q3 150
200
400
600
800
1,000
1,200
2 732 2 898
30% 31%
0%
10%
20%
30%
40%
50%
60%
YTD Sep 14 YTD Sep 150
500
1,000
1,500
2,000
2,500
3,000
3,500
+6%
6
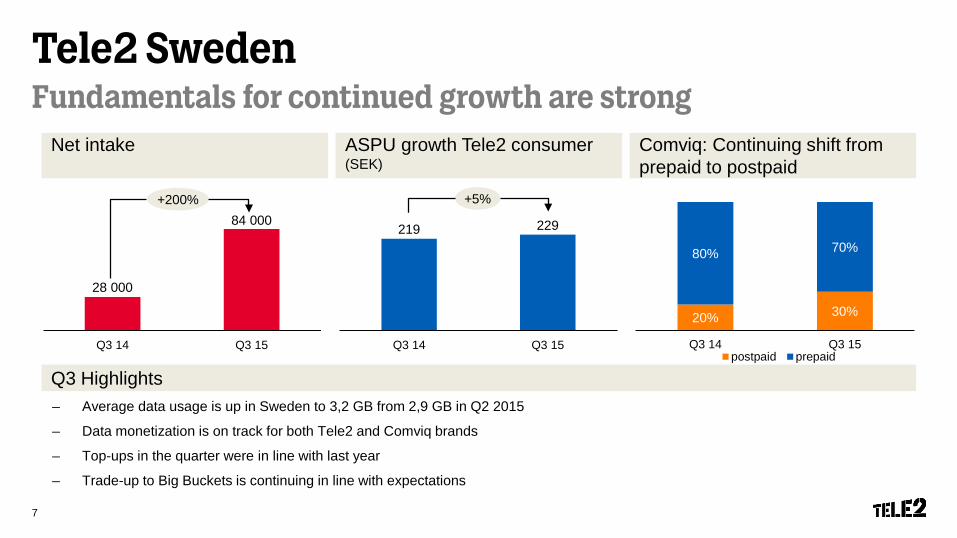
Tele2 SwedenFundamentals for continued growth are strong
Net intake ASPU growth Tele2 consumer (SEK)
Q3 Highlights
Comviq: Continuing shift from prepaid to postpaid
28 000
84 000
Q3 14 Q3 15
+200% +5%
219 229
Q3 14 Q3 150
50
100
150
200
250
– Average data usage is up in Sweden to 3,2 GB from 2,9 GB in Q2 2015
– Data monetization is on track for both Tele2 and Comviq brands
– Top-ups in the quarter were in line with last year
– Trade-up to Big Buckets is continuing in line with expectations
20% 30%
80% 70%
Q3 14 Q3 15postpaid prepaid
7
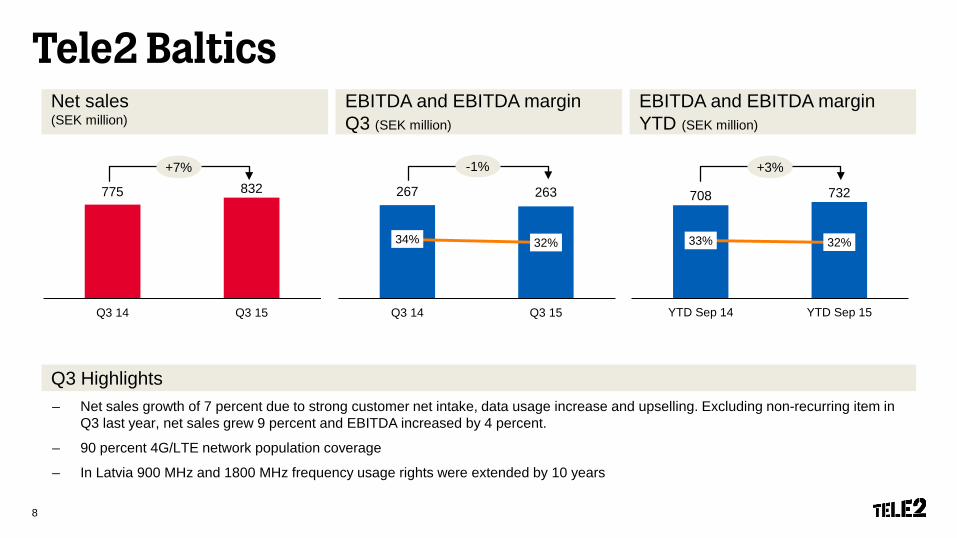
Tele2 BalticsNet sales(SEK million)
EBITDA and EBITDA marginQ3 (SEK million)
EBITDA and EBITDA margin YTD (SEK million)
– Net sales growth of 7 percent due to strong customer net intake, data usage increase and upselling. Excluding non-recurring item in Q3 last year, net sales grew 9 percent and EBITDA increased by 4 percent.
– 90 percent 4G/LTE network population coverage
– In Latvia 900 MHz and 1800 MHz frequency usage rights were extended by 10 years
Q3 Highlights
775 832
Q3 14 Q3 15
267 263
34% 32%
0%
10%
20%
30%
40%
50%
60%
Q3 14 Q3 150
50
100
150
200
250
300
+7% -1%
708 732
33% 32%
0%
10%
20%
30%
40%
50%
60%
YTD Sep 14 YTD Sep 150
100
200
300
400
500
600
700
800
+3%
8
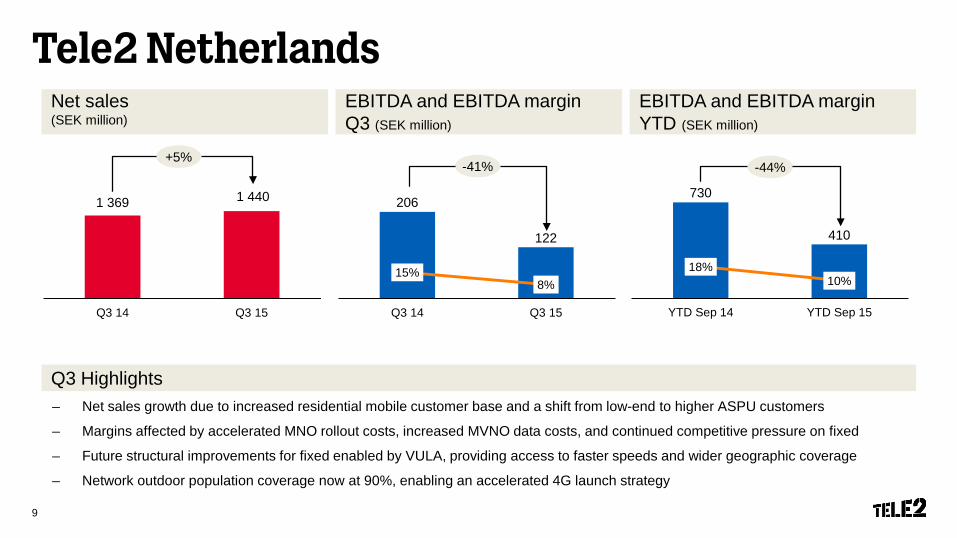
Tele2 NetherlandsNet sales(SEK million)
EBITDA and EBITDA marginQ3 (SEK million)
Q3 Highlights– Net sales growth due to increased residential mobile customer base and a shift from low-end to higher ASPU customers
– Margins affected by accelerated MNO rollout costs, increased MVNO data costs, and continued competitive pressure on fixed
– Future structural improvements for fixed enabled by VULA, providing access to faster speeds and wider geographic coverage
– Network outdoor population coverage now at 90%, enabling an accelerated 4G launch strategy
EBITDA and EBITDA margin YTD (SEK million)
1 369 1 440
Q3 14 Q3 15
206
122
15%8%
0%
10%
20%
30%
40%
50%
60%
Q3 14 Q3 150
50
100
150
200
250
+5%-41%
730
410
18%10%
0%
10%
20%
30%
40%
50%
60%
YTD Sep 14 YTD Sep 150
100
200
300
400
500
600
700
800
-44%
9
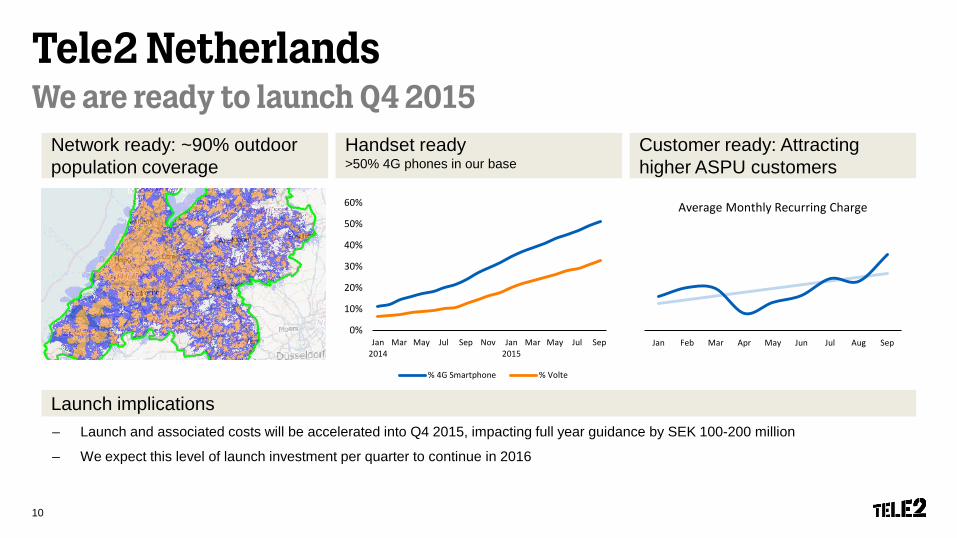
Tele2 NetherlandsWe are ready to launch Q4 2015
0%
10%
20%
30%
40%
50%
60%
Jan2014
Mar May Jul Sep Nov Jan2015
Mar May Jul Sep
% 4G Smartphone % Volte
Launch implications– Launch and associated costs will be accelerated into Q4 2015, impacting full year guidance by SEK 100-200 million
– We expect this level of launch investment per quarter to continue in 2016
Network ready: ~90% outdoorpopulation coverage
Handset ready>50% 4G phones in our base
Customer ready: Attracting higher ASPU customers
Jan Feb Mar Apr May Jun Jul Aug Sep
Average Monthly Recurring Charge
10
Tele2 Kazakhstan
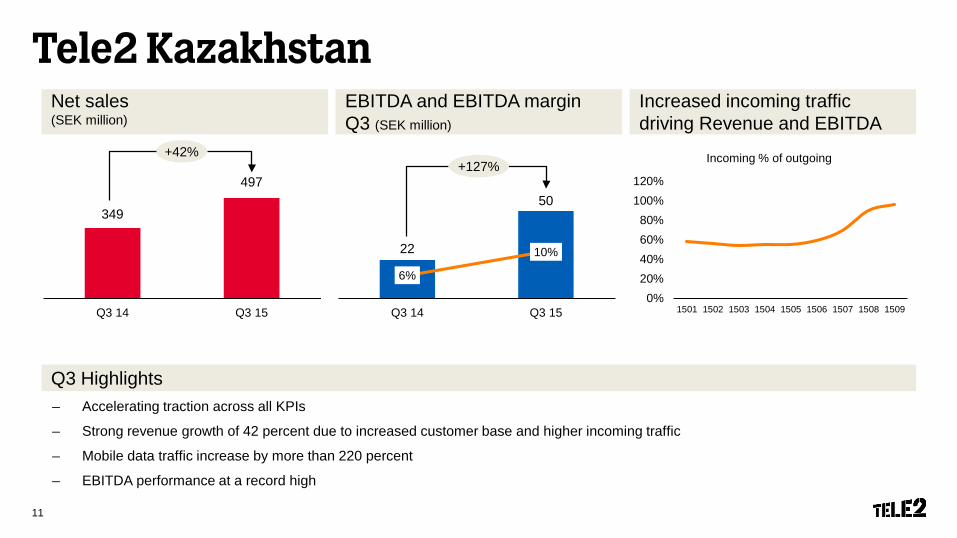
– Accelerating traction across all KPIs
– Strong revenue growth of 42 percent due to increased customer base and higher incoming traffic
– Mobile data traffic increase by more than 220 percent
– EBITDA performance at a record high
Net sales(SEK million)
EBITDA and EBITDA marginQ3 (SEK million)
Q3 Highlights
Increased incoming traffic driving Revenue and EBITDA
349
497
Q3 14 Q3 15
22
50
6%
10%
2%
4%
6%
8%
10%
12%
14%
16%
18%
20%
Q3 14 Q3 150
10
20
30
40
50
60
+42%+127%
0%20%40%60%80%
100%120%
1501 1502 1503 1504 1505 1506 1507 1508 1509
Incoming % of outgoing
11

Financial Overview
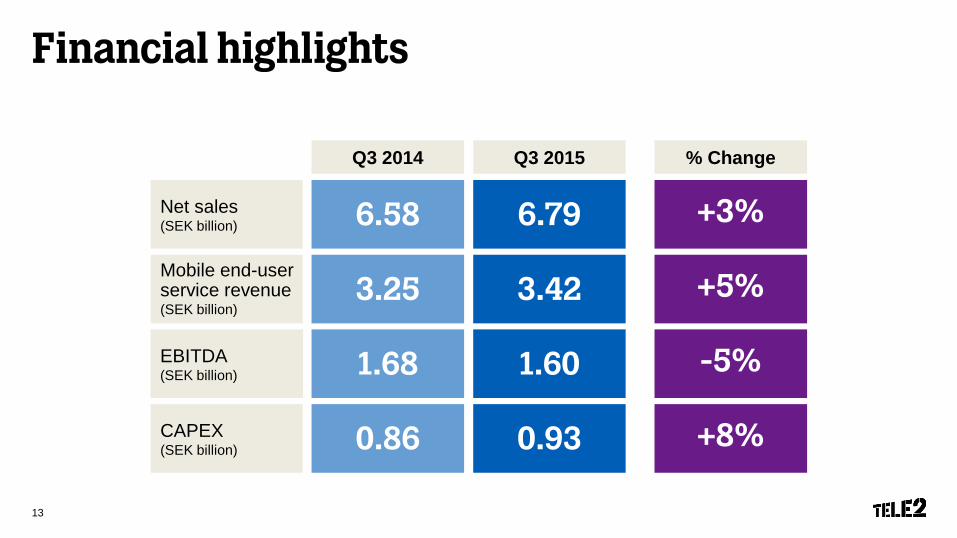
Financial highlights
Mobile end-user service revenue(SEK billion)
3.42
EBITDA(SEK billion) 1.60
CAPEX(SEK billion) 0.93
Net sales(SEK billion) 6.79
Q3 2015 % Change
+5%
-5%
+8%
+3%
3.25
1.68
0.86
6.58
Q3 2014
13
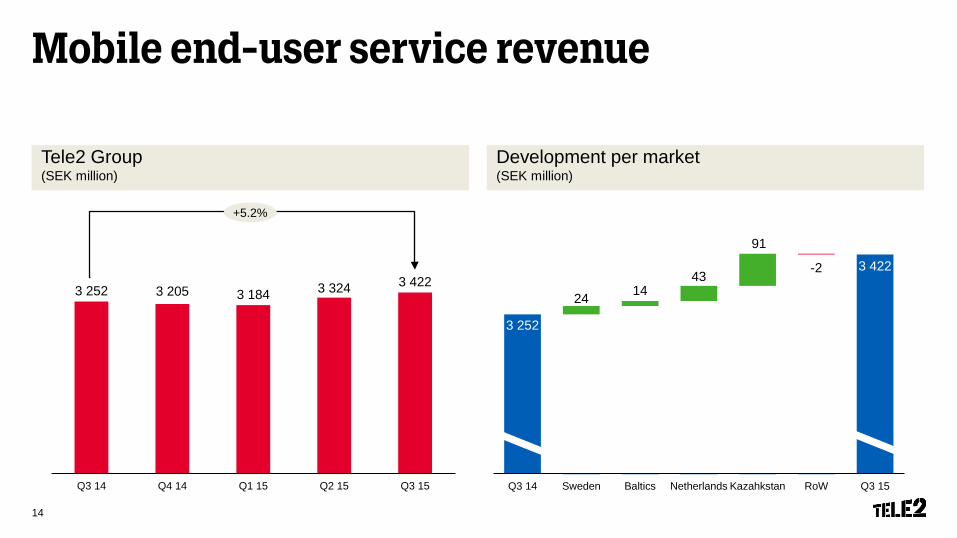
Mobile end-user service revenue
Tele2 Group(SEK million)
Development per market(SEK million)
3,205
3 252 3 205 3 184 3 324 3 422
Q3 14 Q4 14 Q1 15 Q2 15 Q3 15
+5.2%
3 252
3 422
24 1443
91
-2
Q3 14 Sweden Baltics Netherlands Kazahkstan RoW Q3 15
14
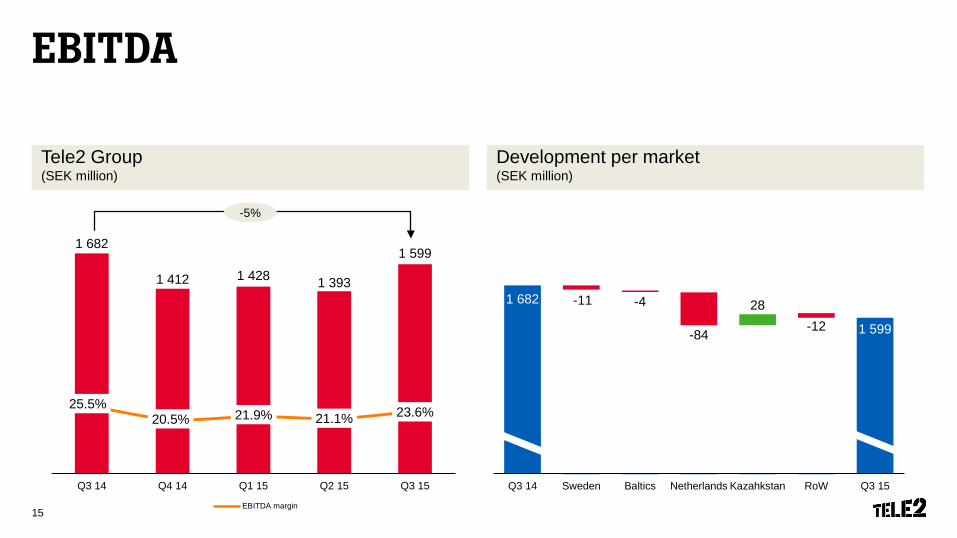
EBITDA
Tele2 Group(SEK million)
1,412
Development per market(SEK million)
1 682
1 412 1 428 1 393
1 599
25.5%20.5% 21.9% 21.1% 23.6%
0
200
400
600
800
1000
1200
1400
1600
1800
Q3 14 Q4 14 Q1 15 Q2 15 Q3 150.00%
10.00%
20.00%
30.00%
40.00%
50.00%
60.00%
70.00%
80.00%
90.00%
EBITDA margin
1 682
1 599
-11 -4
-84
28-12
Q3 14 Sweden Baltics Netherlands Kazahkstan RoW Q3 15
-5%
15
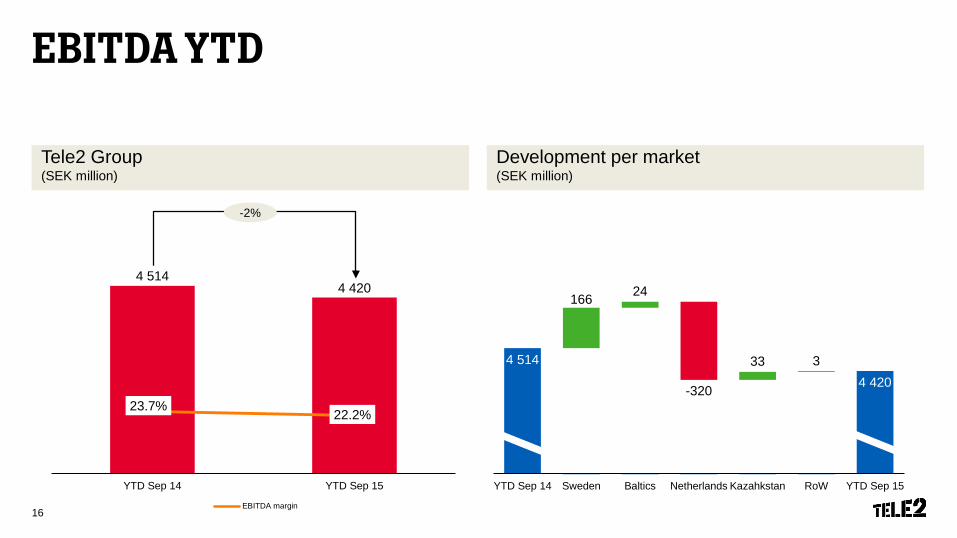
EBITDA YTD
Tele2 Group(SEK million)
1,412
Development per market(SEK million)
4 5144 420
23.7%22.2%
3000
3200
3400
3600
3800
4000
4200
4400
4600
4800
YTD Sep 14 YTD Sep 150.00%
10.00%
20.00%
30.00%
40.00%
50.00%
60.00%
70.00%
80.00%
90.00%
EBITDA margin
4 514
4 420
166 24
-320
33 3
YTD Sep 14 Sweden Baltics Netherlands Kazahkstan RoW YTD Sep 15
-2%
16
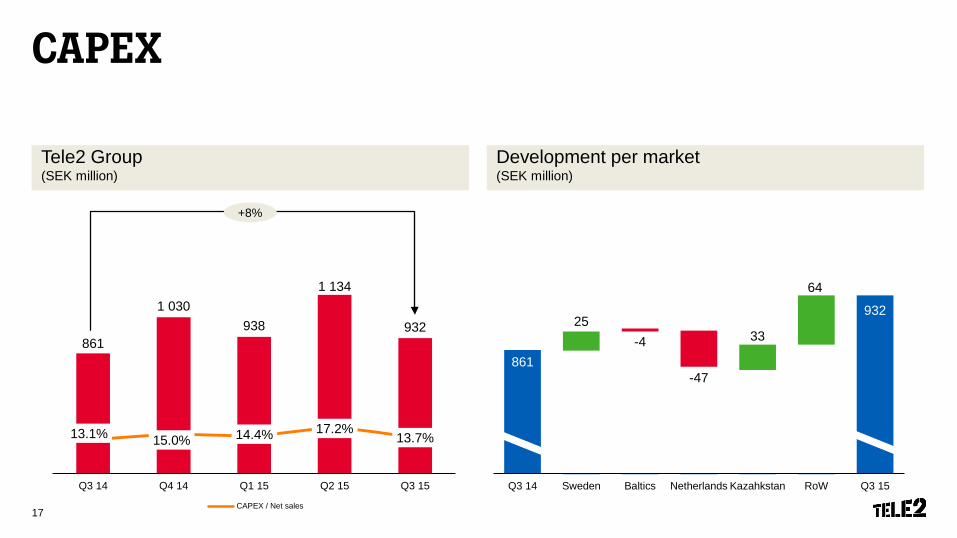
CAPEX
Tele2 Group(SEK million)
Development per market(SEK million)
861
1 030938
1 134
932
13.1% 15.0% 14.4% 17.2%13.7%
300
500
700
900
1,100
1,300
Q3 14 Q4 14 Q1 15 Q2 15 Q3 150.00%
10.00%
20.00%
30.00%
40.00%
50.00%
60.00%
70.00%
80.00%
90.00%
CAPEX / Net sales
861
93225
-4
-47
33
64
Q3 14 Sweden Baltics Netherlands Kazahkstan RoW Q3 15
+8%
17
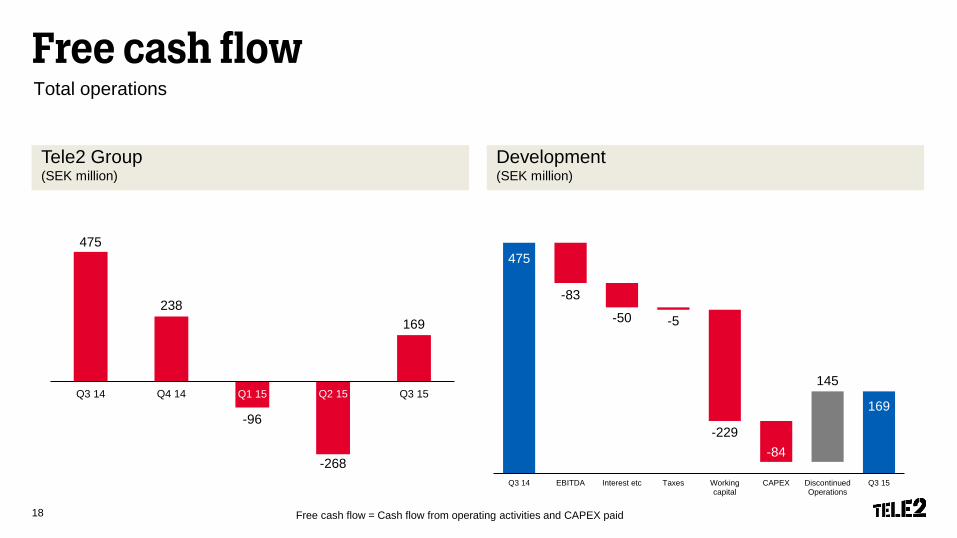
Free cash flowTotal operations
Tele2 Group(SEK million)
Development (SEK million)
Free cash flow = Cash flow from operating activities and CAPEX paid
475
238
-96
-268
169
-400
-300
-200
-100
0
100
200
300
400
500
600
Q3 14 Q4 14 Q1 15 Q2 15 Q3 15
475
-83
-50 -5
-229-84
145
169
Q3 14 EBITDA Interest etc Taxes Workingcapital
CAPEX DiscontinuedOperations
Q3 15
18
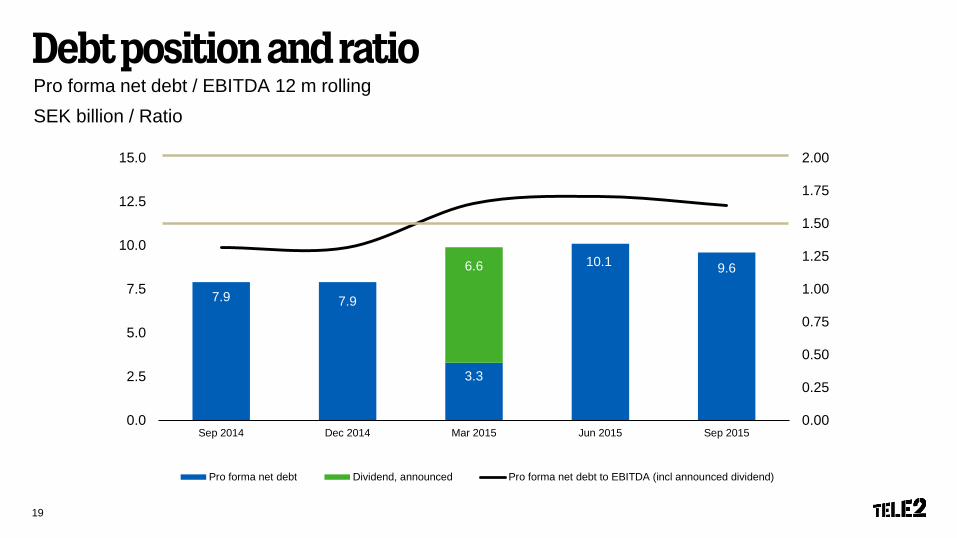
Debt position and ratioPro forma net debt / EBITDA 12 m rollingSEK billion / Ratio
7.9 7.9
3.3
10.1 9.66.6
0.00
0.25
0.50
0.75
1.00
1.25
1.50
1.75
2.00
0.0
2.5
5.0
7.5
10.0
12.5
15.0
Sep 2014 Dec 2014 Mar 2015 Jun 2015 Sep 2015
Pro forma net debt Dividend, announced Pro forma net debt to EBITDA (incl announced dividend)
19
Challenger Program Update
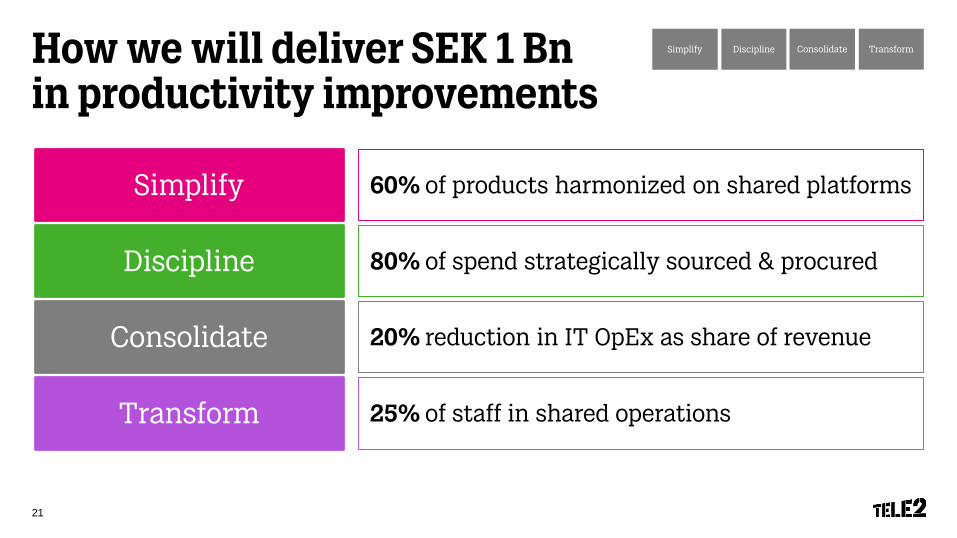
How we will deliver SEK 1 Bnin productivity improvements
Simplify
Transform
Consolidate
Discipline
Simplify Discipline Consolidate Transform
60% of products harmonized on shared platforms
80% of spend strategically sourced & procured
20% reduction in IT OpEx as share of revenue
25% of staff in shared operations
21
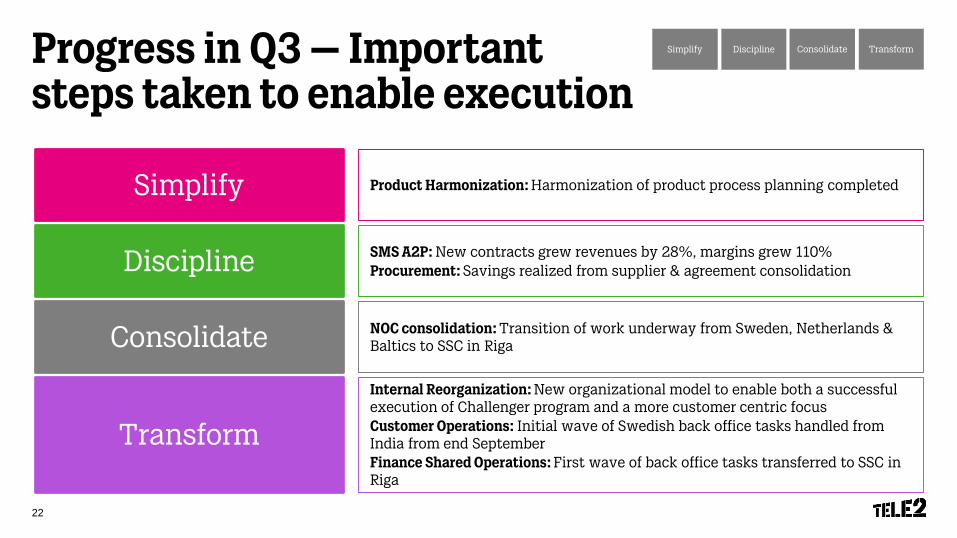
Progress in Q3 – Important steps taken to enable execution
Simplify
Transform
Consolidate
Discipline
Product Harmonization: Harmonization of product process planning completed
SMS A2P: New contracts grew revenues by 28%, margins grew 110%Procurement: Savings realized from supplier & agreement consolidation
NOC consolidation: Transition of work underway from Sweden, Netherlands & Baltics to SSC in Riga
Internal Reorganization: New organizational model to enable both a successful execution of Challenger program and a more customer centric focusCustomer Operations: Initial wave of Swedish back office tasks handled from India from end SeptemberFinance Shared Operations: First wave of back office tasks transferred to SSC in Riga
Simplify Discipline Consolidate Transform
22
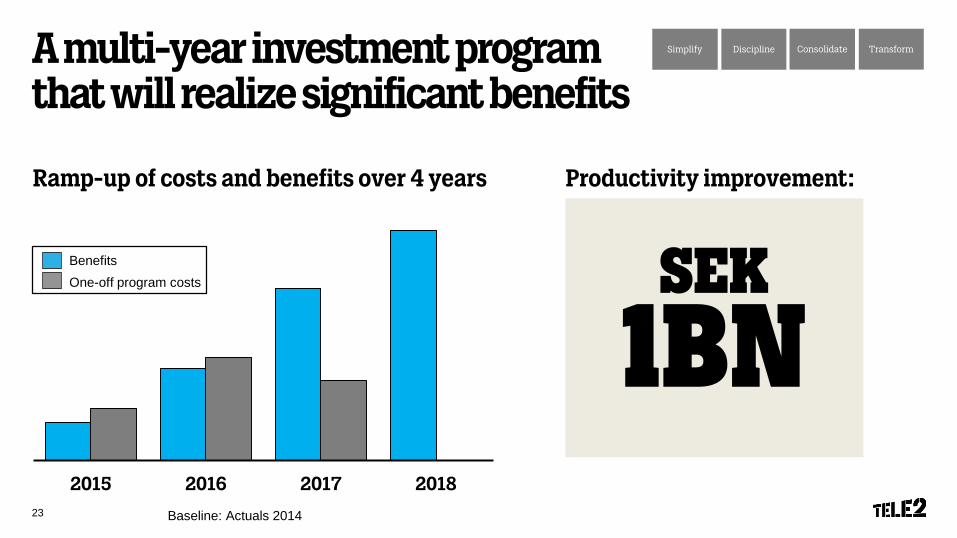
2015 2016 2017 2018
A multi-year investment program that will realize significant benefits
Baseline: Actuals 2014
Ramp-up of costs and benefits over 4 years
Simplify Discipline Consolidate Transform
Productivity improvement:
BenefitsOne-off program costs
1BnSEK
23
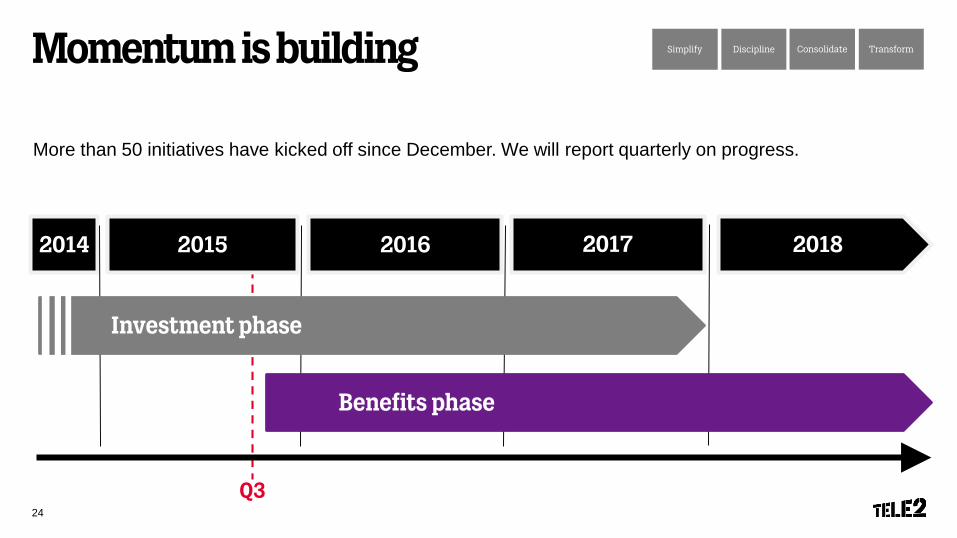
Momentum is building
2015 20162014
More than 50 initiatives have kicked off since December. We will report quarterly on progress.
Q3
2017 2018
Investment phase
Benefits phase
Simplify Discipline Consolidate Transform
24

Financial Guidance
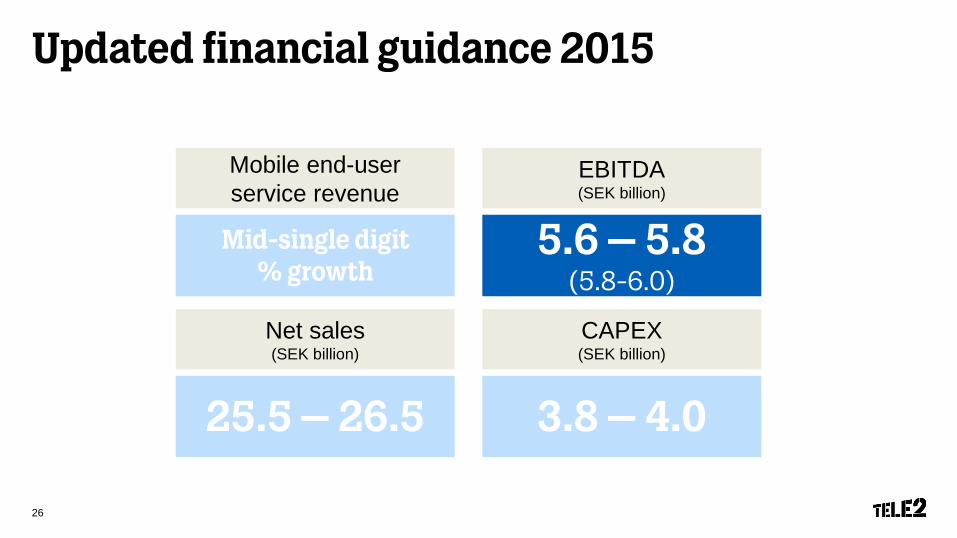
Updated financial guidance 2015
Net sales(SEK billion)
EBITDA(SEK billion)
25.5 – 26.5
5.6 – 5.8(5.8-6.0)
CAPEX(SEK billion)
3.8 – 4.0
Mobile end-user service revenue
Mid-single digit % growth
26
Q3 2015 Summary
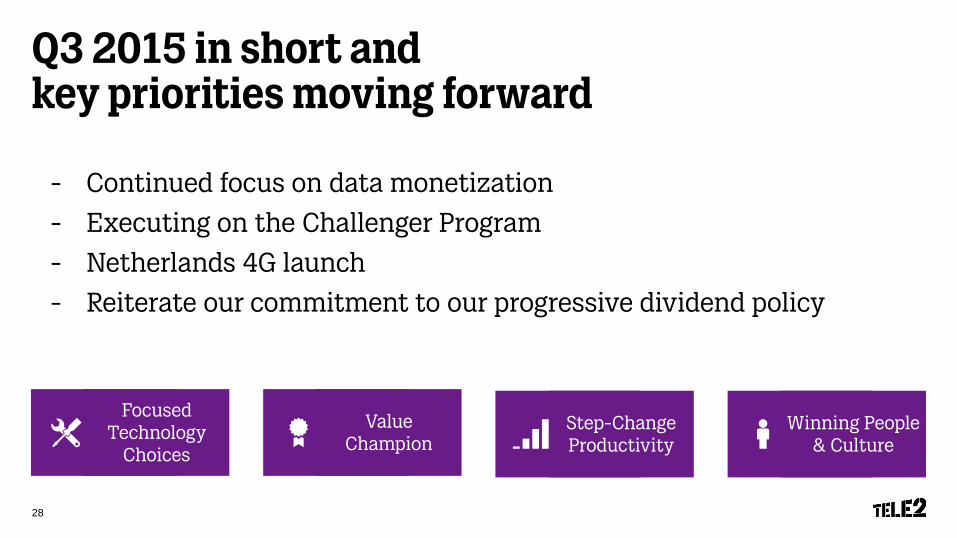
Q3 2015 in short and key priorities moving forward
- Continued focus on data monetization
- Executing on the Challenger Program
- Netherlands 4G launch
- Reiterate our commitment to our progressive dividend policy
Winning People & Culture
Value Champion
Step-Change Productivity
Focused Technology
Choices
28
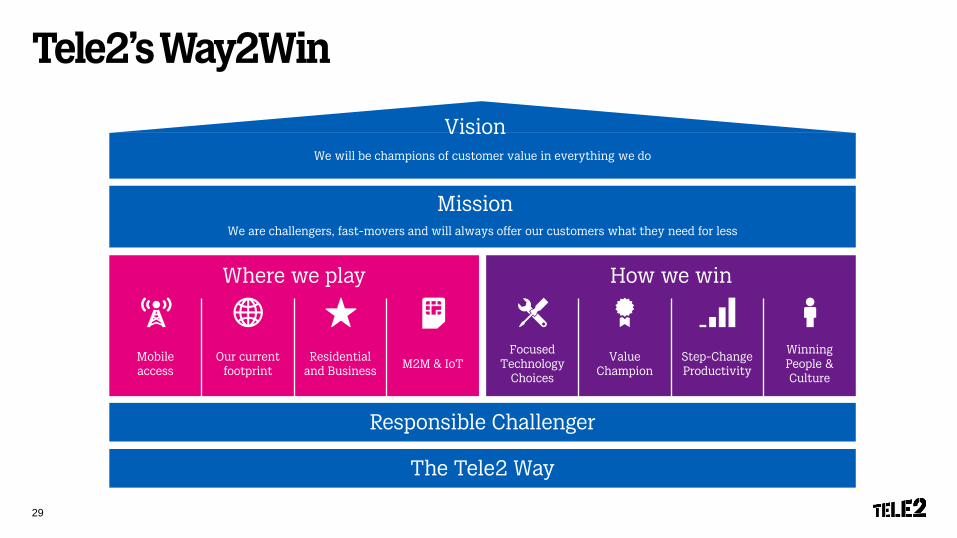
Tele2’s Way2Win
The Tele2 Way
We are challengers, fast-movers and will always offer our customers what they need for less
We will be champions of customer value in everything we do
How we win
Focused Technology
Choices
Value Champion
Step-Change Productivity
Winning People & Culture
Vision
Mission
Where we play
Mobile access
Our current footprint
Residential and Business
M2M & IoT
Responsible Challenger
29
THEEND
![ASMI Investor presentation Q3-2013 … PowerPoint - ASMI_Investor presentation Q3-2013_1November2013.pptx [Read-Only]](https://img.pdfslide.tips/doc/110x75/5bd6338909d3f2623e8d4ac3/asmi-investor-presentation-q3-2013-powerpoint-asmiinvestor-presentation-q3-20131november2013pptx.jpg)


![Presentation - Q3 FY 2015-16 [Company Update]](https://img.pdfslide.tips/doc/110x75/577ca58d1a28abea748b9589/presentation-q3-fy-2015-16-company-update.jpg)