Embed Size (px)
Citation preview

Welcome!
1. Forward-Looking Statements
2. What We Do
3. The Team
4. The Business
5. The Opportunity
6. Growth Strategies
7. Financial Summary
Forward-Looking Statements
This presentation may include forward-looking statements within the meaning of Section 27A of the Securities Act of 1933 as amended,
and Section 21E of the Securities Exchange Act of 1934. We have based these forward-looking statements on our current expectations
and projections about future events. These forward-looking statements are subject to known and unknown risks, uncertainties and
assumptions about us and our affiliate companies, that may cause our actual results, levels of activity, performance or achievements to
be materially different from any future results, levels of activity, performance or achievements expressed or implied by such forward-
looking statements.
This presentation is supplied for informational purposes only and does not constitute (1) an offer to sell, or solicitation of an offer to buy,
and securities of U-Vend, Inc. or (2) a promise or representation that any such offer will be made to the recipient or any other party. This
presentation contains confidential information regarding U-Vend, Inc.
50
%
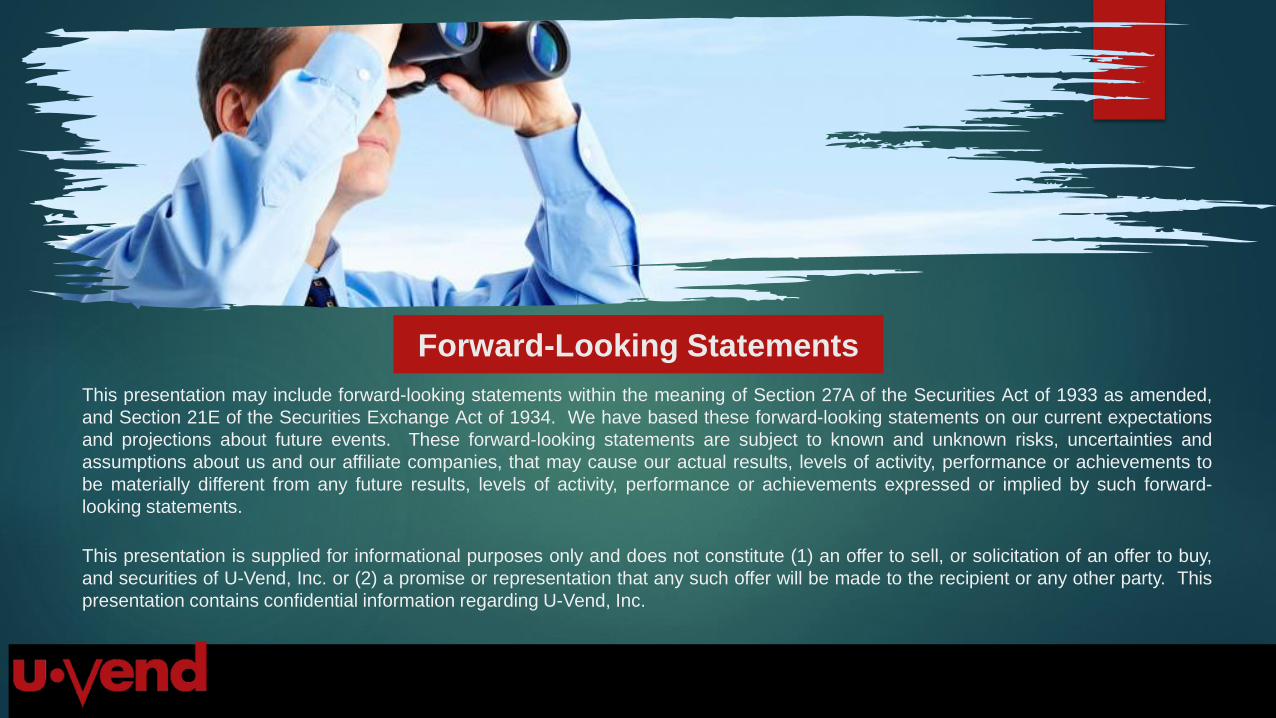
What We Do
U-Vend’s diversified, multi-channel revenue base includes the following
business segments:
Professional Sports-Themed Brands
‐ Currently the Official Ice Cream of Major League Baseball, others pending
‐ Marrying fantasy sports phenomenon with consumer product sales and sports collectibles
Wholesale Distributor for Mini Melts (novelty ice cream product)
‐ Current points-of-sale over 145, currently focus on Southern California & Las Vegas markets
Digital Advertising Solutions Provider
‐ Wireless Samsung digital software partnership in place 2015
‐ Placing wireless digital at all points-of-sale provides additional ad revenue

The Team

50
%
David Graber
Chief Executive Officer
Currently CEO of U-Vend, Inc. and Managing
Principal of Cobrador Capital Advisors, an
investment firm focused on consumer sector.
Previously was Managing Director, Investment
Banking at New Century Partners and National
Securities Corporation.
Acted as CEO of OKC Corporation, a
manufacturer and retailer in home improvement
industry, oversaw national rollout with Home
Depot, created strategic partnerships with major
U.S. homebuilders.
Was Sr. VP and Director with Donaldson, Lufkin &
Jenrette, as well as Credit Suisse First Boston.
Holds dual MBA’s from Columbia University (NYC)
and London Business School (UK). Obtained BA at
Tulane University (1994)
50
%
Mark ChapmanPresident, U-Vend America, Inc.
Began career in Marketing and Sales with General
Foods Corporation.
Director of Marketing for Dr. Pepper
VP of The Mauna Loa Macadamia Nut Company, took
revenue from $4.5mm to $41mm in 2.5 years.
From 1983-1985, oversaw revenue growth from
$28mm to $87mm as Director of Sales and Marketing
at Malt-O-Meal.
Zone Director in the Specialty Foods Division of
Ralston Purina in St Louis, MO.
Founder and CEO of United Sales Inc., of which he
grew over 10 years and sold to Fleming, Inc.
C-Level Executive positions in the Consumer Products
industry as a business owner and consultant.
BA in Marketing and Psychology, Masters in
Psychology from Richmond University in London, UK.
50
%
Michael CroneExecutive Vice President of Sales
Veteran sales executive of the ice cream industry with
over 40 years of consumer sales and strategic
planning with numerous multi-billion consumer
products companies.
As Senior Vice President of Sales at Wells Dairy for
over 10 years, increased sales over 53% to $1.2
Billion.
In his 5 years at Nestle Ice Cream Company,
increased return on distribution sales 250% through
acquisitions, new businesses, and re-engineering of
operations.
Spent over 8 years at Häagen-Dazs Ice Cream where
he increased sales from $325 Million to over $700
Million.
Holds a degree in Business Management from
Stephen F. Austin University.
50
%
U-Vend Advisory Board
GREG HOGARTH - Greg is currently the owner and operator of the Ontario, Canada-based QSR Group Inc. Mr. Hogarth has grown the QSR Group
from one single Tim Horton’s store in 1986 to 26 Tim Horton’s and Wendy’s restaurants today with combined sales in excess of $50 million and over
1,400 full and part-time employees.
MARCEL DIONNE - Marcel is a naturally gifted goal scorer and playmaker, center Marcel Dionne was one of the most productive offensive
performers in National Hockey League history. Marcel played 18 seasons in the NHL for the Detroit Red Wings, Los Angeles Kings and New York
Rangers and was inducted into the Hockey Hall of Fame in 1992. Marcel retired with 731 goals and 1,771 points.
JAMES BUTTS - James is the Founder and Director of Operation of GPS Distribution Inc., a privately held firm with revenues in excess of $10
million that specializes in distribution of newspapers to retail outlets, home delivery and also includes in excess of 250 vending machine locations
within the Southern Ontario, Canada marketplace. Mr. Butts has over 30 years’ experience and possesses a strong knowledge of logistics,
operations, finance, and cost-savings strategies.
RANDY J. GILLEN - Randy was a partner in the St. Catharines, Ontario law firm Chown, Cairns from 1980 until he retired from the practice of law in
1993. His expertise was concentrated in business and commercial matters, in particular, the negotiation and preparation of licensing and distribution
agreements. Randy developed a licensing program that included arrangements with The Walt Disney Company, Coca-Cola Ltd., Hasbro Inc.,
Cunard, The Random House Group and other well-known entities.

Our Business
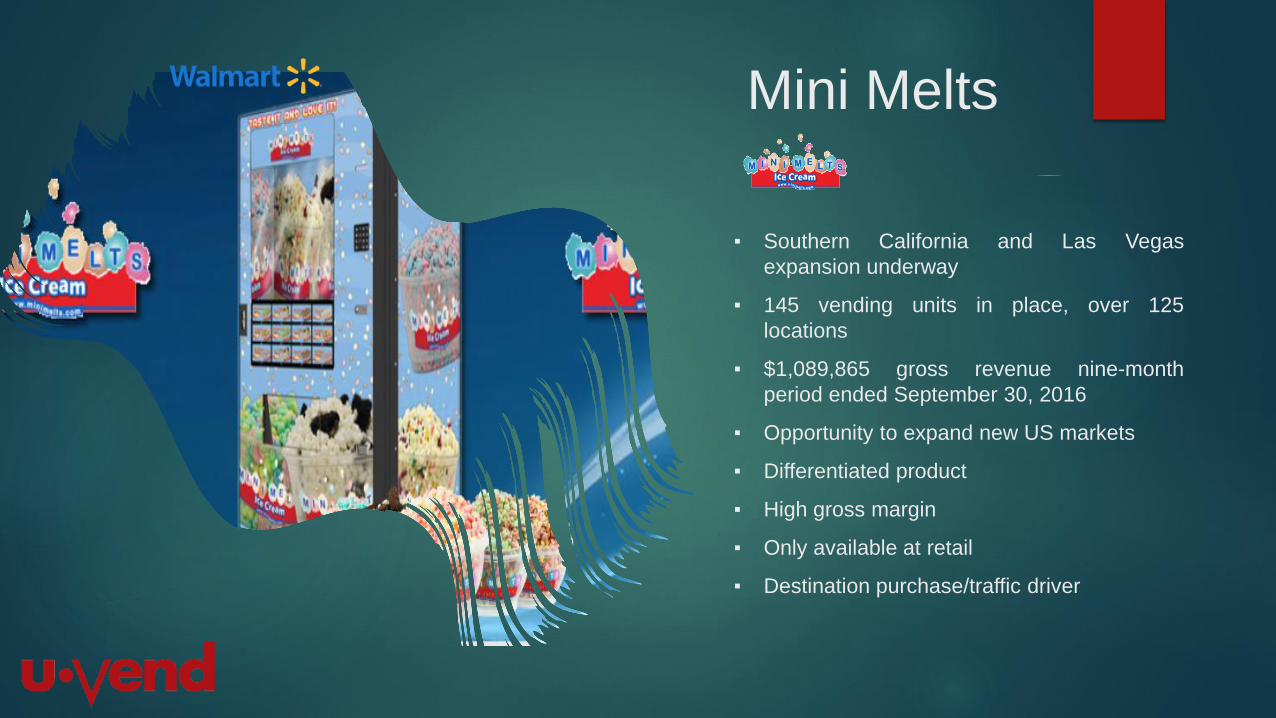
▪ Southern California and Las Vegas
expansion underway
▪ 145 vending units in place, over 125
locations
▪ $1,089,865 gross revenue nine-month
period ended September 30, 2016
▪ Opportunity to expand new US markets
▪ Differentiated product
▪ High gross margin
▪ Only available at retail
▪ Destination purchase/traffic driver
Mini Melts
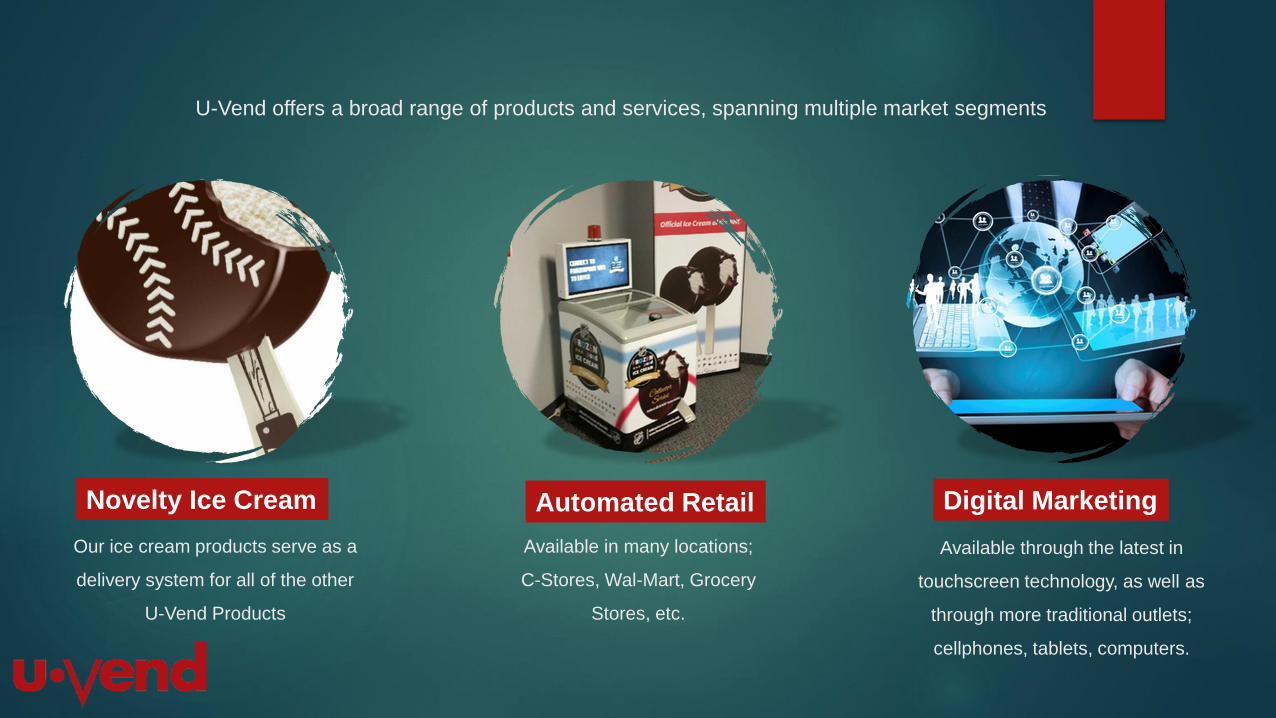
U-Vend offers a broad range of products and services, spanning multiple market segments
Novelty Ice Cream
Our ice cream products serve as a
delivery system for all of the other
U-Vend Products
Automated Retail
Available in many locations;
C-Stores, Wal-Mart, Grocery
Stores, etc.
Digital Marketing
Available through the latest in
touchscreen technology, as well as
through more traditional outlets;
cellphones, tablets, computers.
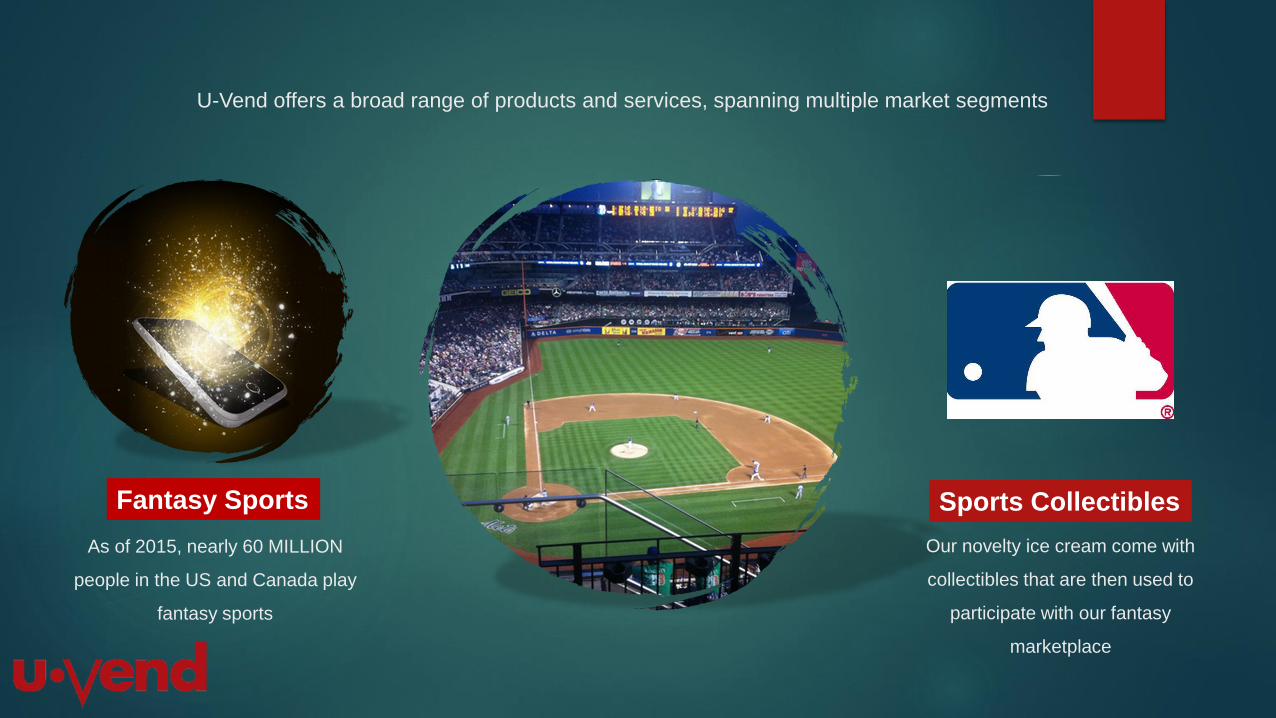
U-Vend offers a broad range of products and services, spanning multiple market segments
Fantasy Sports
As of 2015, nearly 60 MILLION
people in the US and Canada play
fantasy sports
Sports Collectibles
Our novelty ice cream come with
collectibles that are then used to
participate with our fantasy
marketplace

Our Opportunities
Across ALL Categories
1. Novelty Ice Cream
2. Automated Retail
3. Digital Advertising
4. Fantasy Sports
5. Sports Collectibles
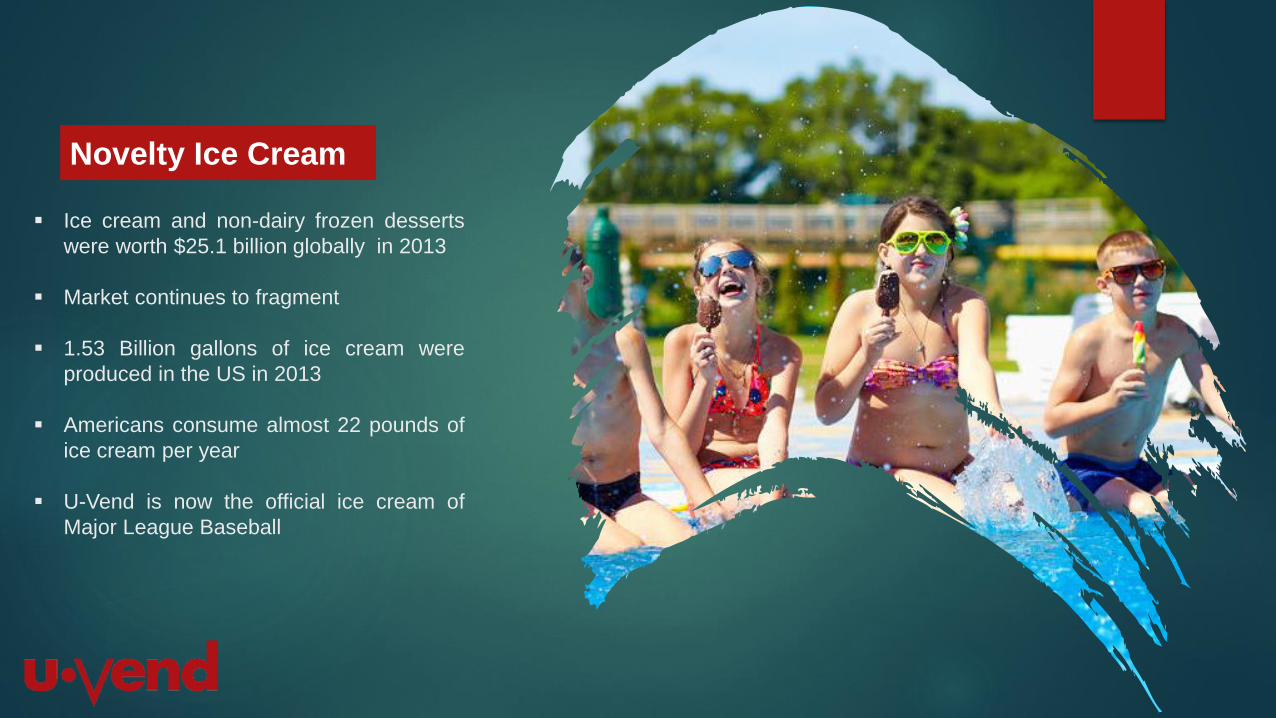
Novelty Ice Cream
Ice cream and non-dairy frozen desserts
were worth $25.1 billion globally in 2013
Market continues to fragment
1.53 Billion gallons of ice cream were
produced in the US in 2013
Americans consume almost 22 pounds of
ice cream per year
U-Vend is now the official ice cream of
Major League Baseball
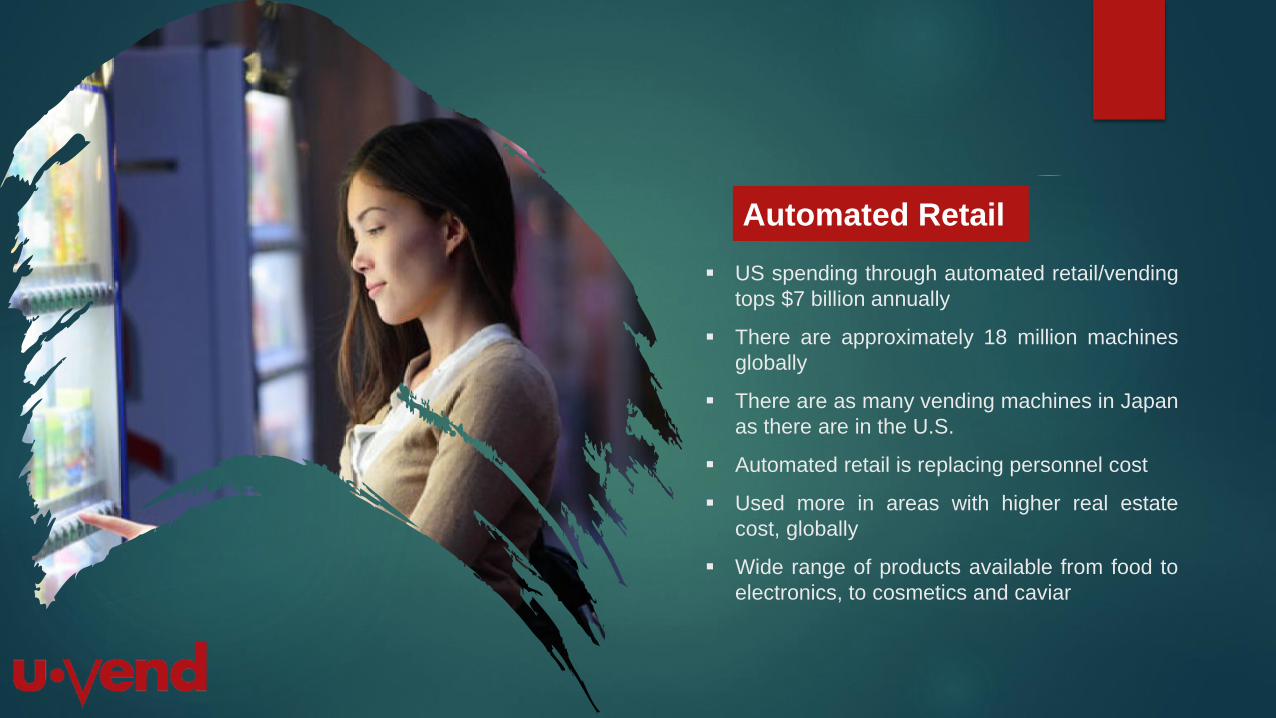
Automated Retail
US spending through automated retail/vending
tops $7 billion annually
There are approximately 18 million machines
globally
There are as many vending machines in Japan
as there are in the U.S.
Automated retail is replacing personnel cost
Used more in areas with higher real estate
cost, globally
Wide range of products available from food to
electronics, to cosmetics and caviar
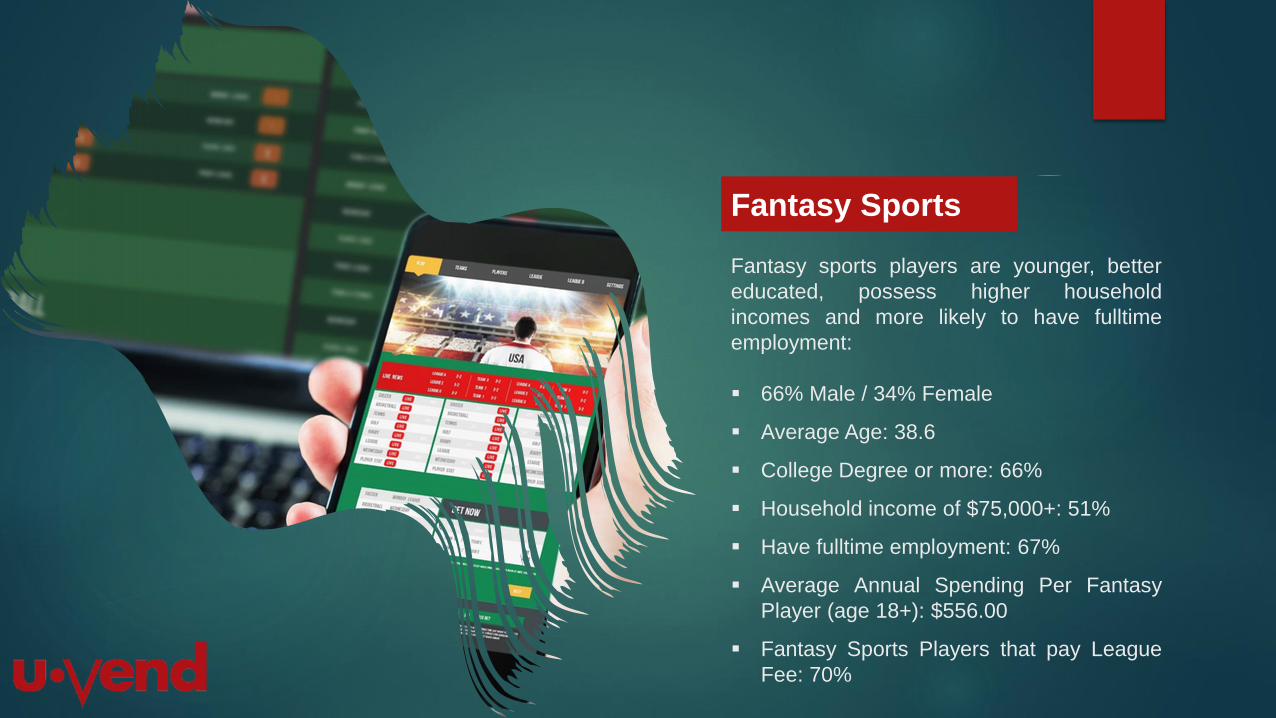
Fantasy Sports
Fantasy sports players are younger, better
educated, possess higher household
incomes and more likely to have fulltime
employment:
66% Male / 34% Female
Average Age: 38.6
College Degree or more: 66%
Household income of $75,000+: 51%
Have fulltime employment: 67%
Average Annual Spending Per Fantasy
Player (age 18+): $556.00
Fantasy Sports Players that pay League
Fee: 70%
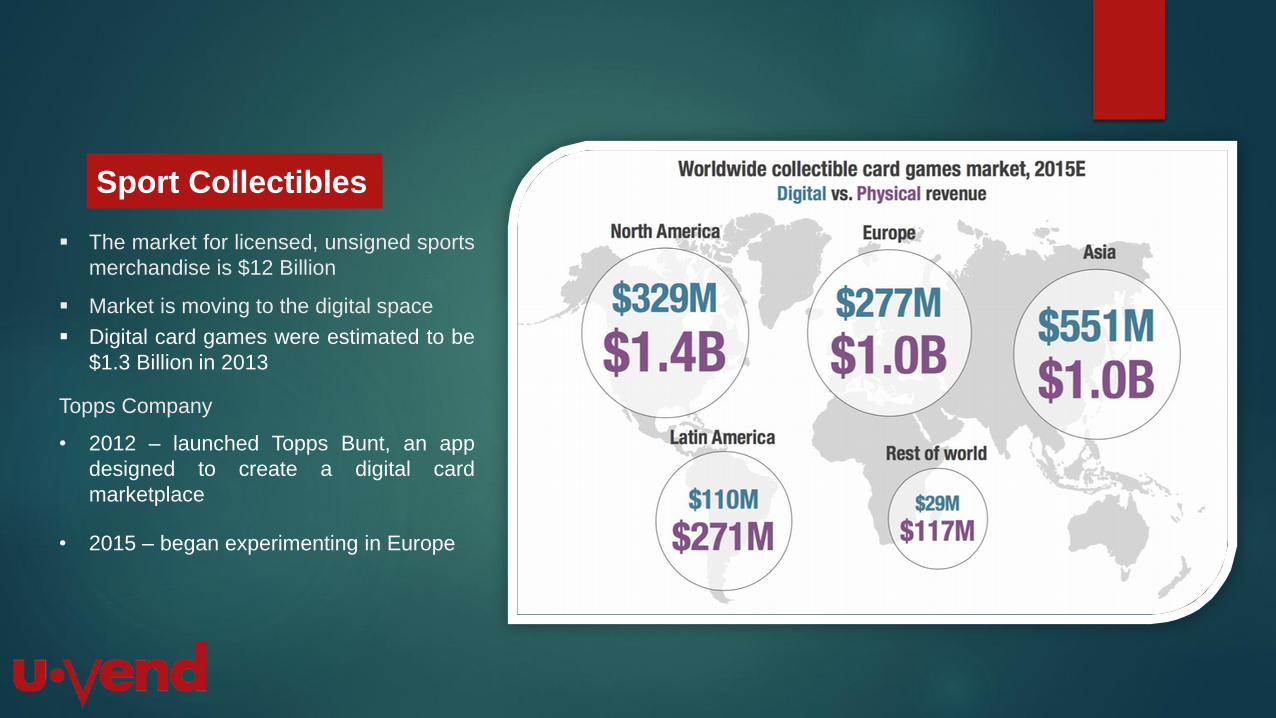
Sport Collectibles
The market for licensed, unsigned sports
merchandise is $12 Billion
Market is moving to the digital space
Digital card games were estimated to be
$1.3 Billion in 2013
Topps Company
• 2012 – launched Topps Bunt, an app
designed to create a digital card
marketplace
• 2015 – began experimenting in Europe
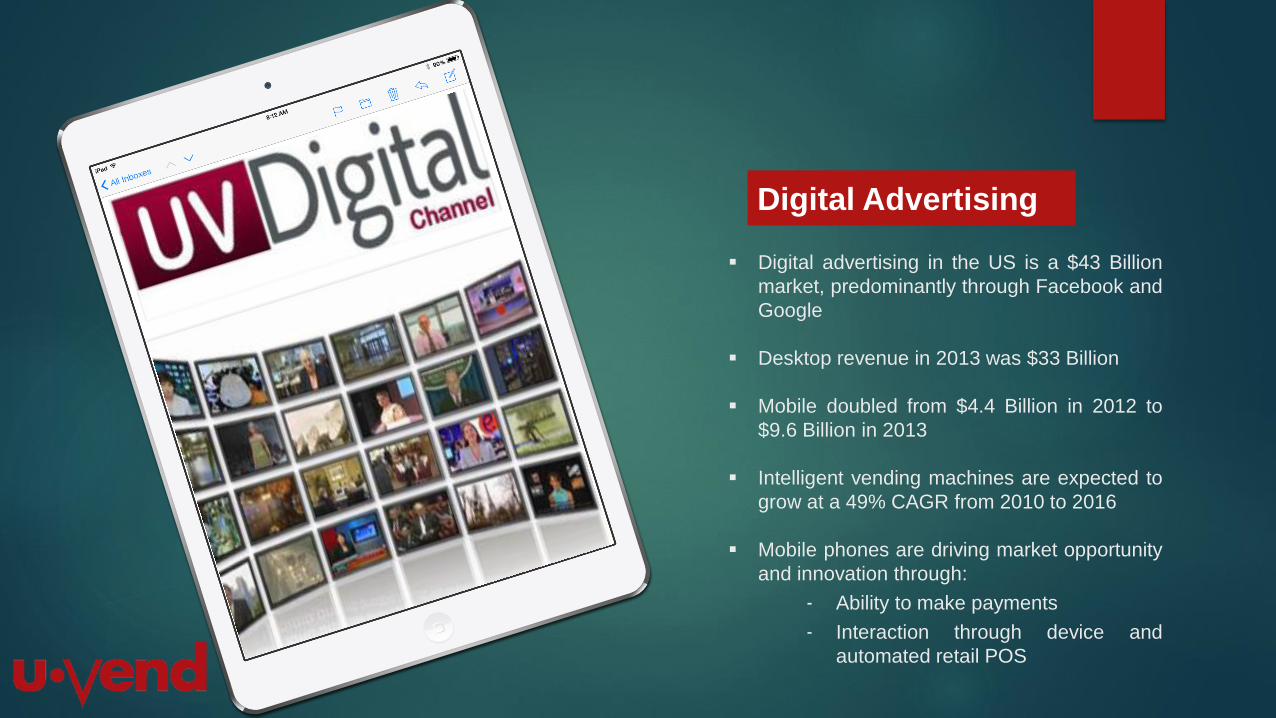
Digital Advertising
Digital advertising in the US is a $43 Billion
market, predominantly through Facebook and
Desktop revenue in 2013 was $33 Billion
Mobile doubled from $4.4 Billion in 2012 to
$9.6 Billion in 2013
Intelligent vending machines are expected to
grow at a 49% CAGR from 2010 to 2016
Mobile phones are driving market opportunity
and innovation through:
‐ Ability to make payments
‐ Interaction through device and
automated retail POS
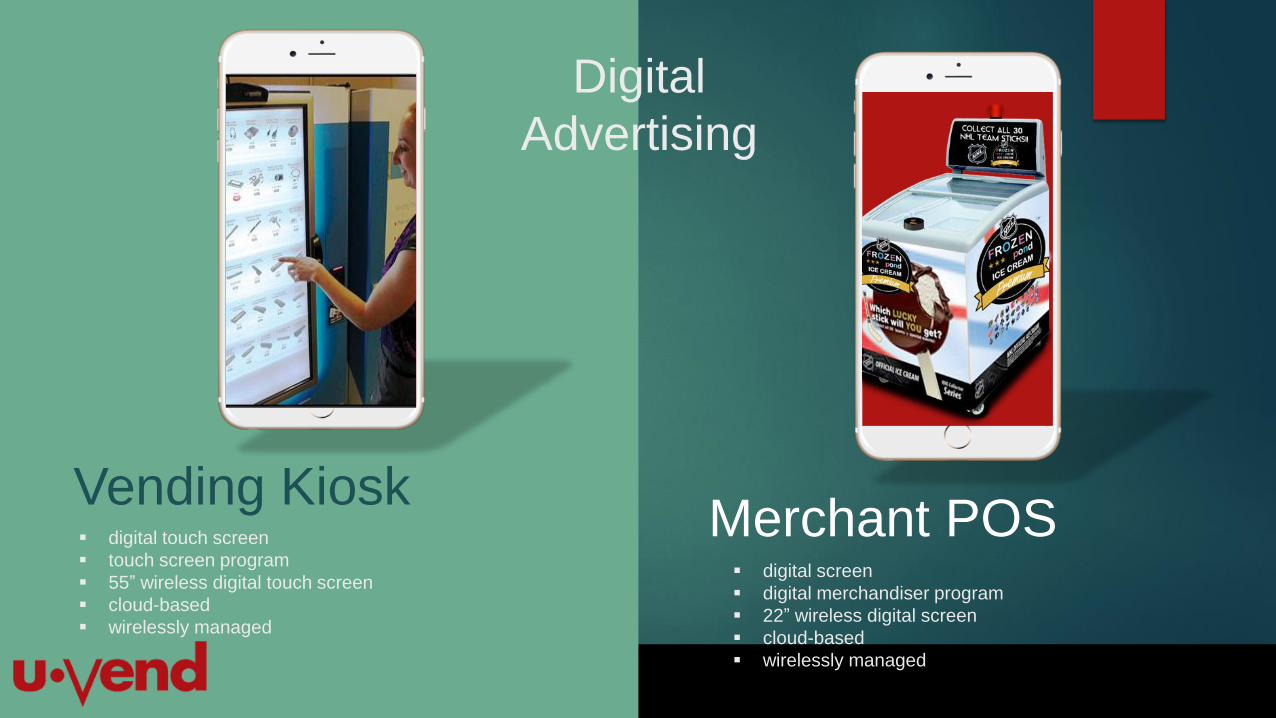
Vending Kiosk digital touch screen
touch screen program
55” wireless digital touch screen
cloud-based
wirelessly managed
Merchant POS digital screen
digital merchandiser program
22” wireless digital screen
cloud-based
wirelessly managed
Digital
Advertising
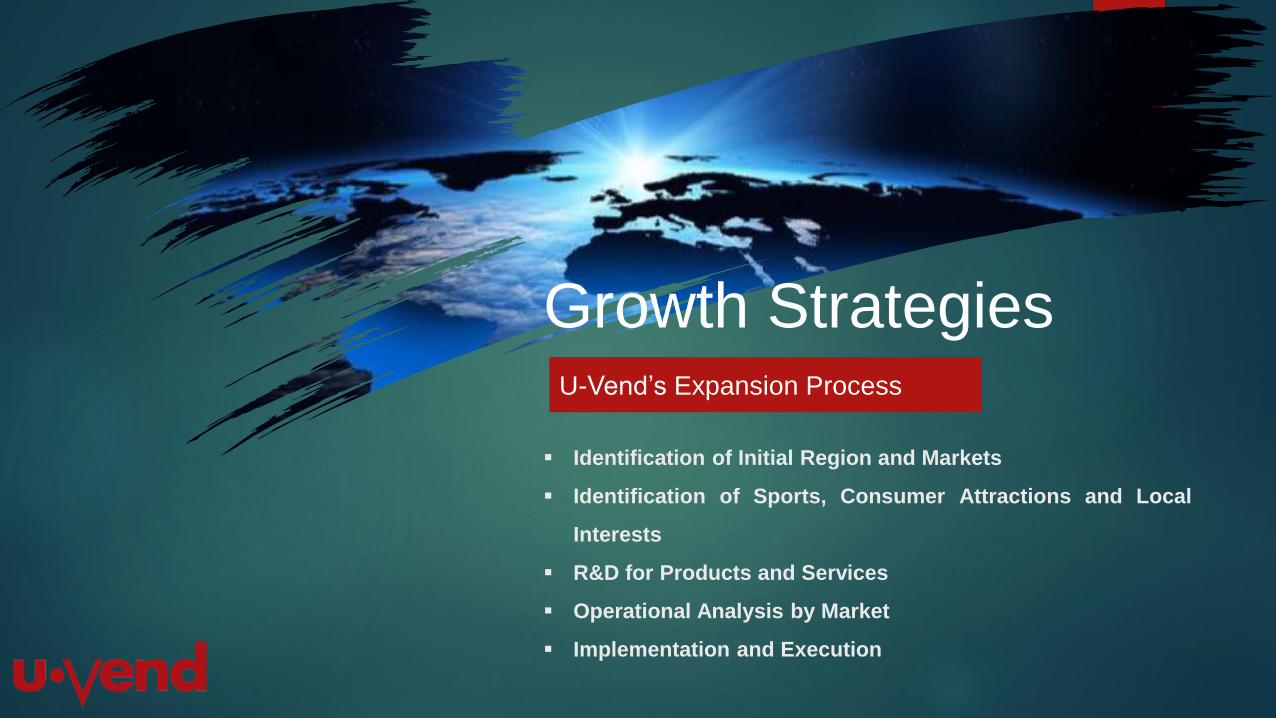
Identification of Initial Region and Markets
Identification of Sports, Consumer Attractions and Local
Interests
R&D for Products and Services
Operational Analysis by Market
Implementation and Execution
Growth StrategiesU-Vend’s Expansion Process
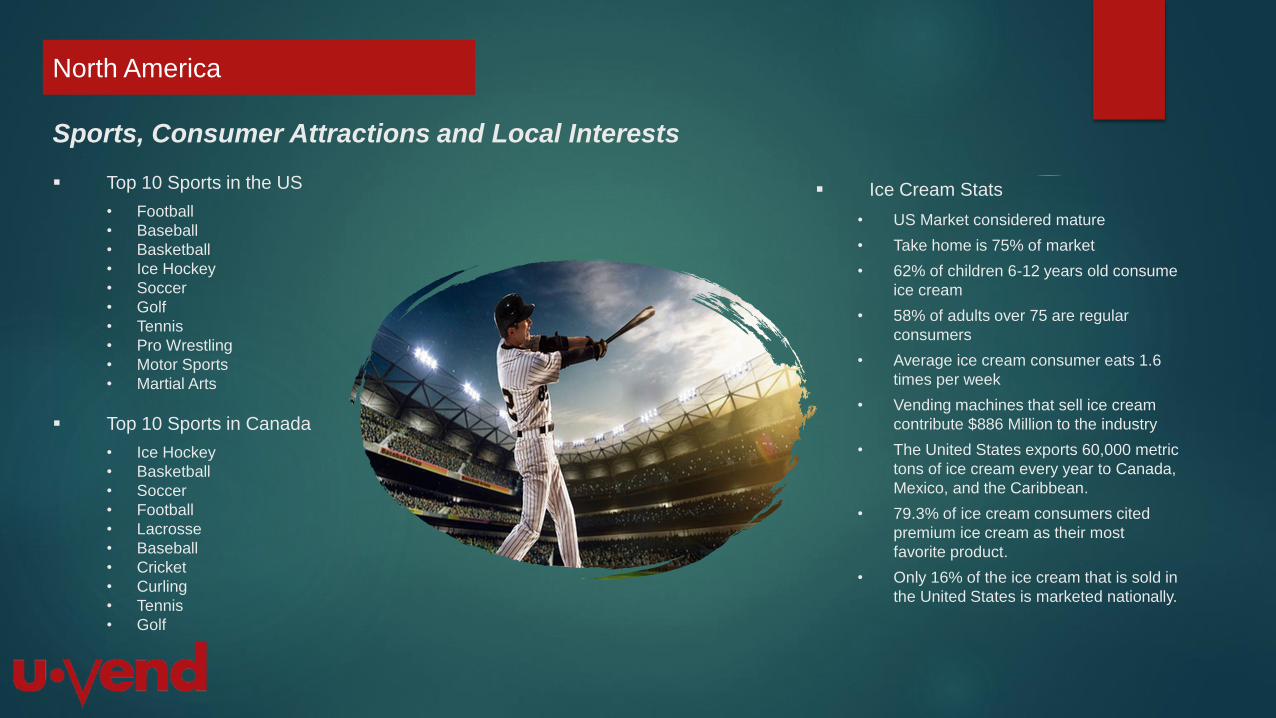
North America
Sports, Consumer Attractions and Local Interests
Top 10 Sports in the US
• Football
• Baseball
• Basketball
• Ice Hockey
• Soccer
• Golf
• Tennis
• Pro Wrestling
• Motor Sports
• Martial Arts
Top 10 Sports in Canada
• Ice Hockey
• Basketball
• Soccer
• Football
• Lacrosse
• Baseball
• Cricket
• Curling
• Tennis
• Golf
Ice Cream Stats
• US Market considered mature
• Take home is 75% of market
• 62% of children 6-12 years old consume
ice cream
• 58% of adults over 75 are regular
consumers
• Average ice cream consumer eats 1.6
times per week
• Vending machines that sell ice cream
contribute $886 Million to the industry
• The United States exports 60,000 metric
tons of ice cream every year to Canada,
Mexico, and the Caribbean.
• 79.3% of ice cream consumers cited
premium ice cream as their most
favorite product.
• Only 16% of the ice cream that is sold in
the United States is marketed nationally.

From Store,
to Fantasy and
Social Media
and Stadium,
U-Vend is in part a multi-media company built
upon consumer products, through distribution,
automated retail and novelty ice cream
consumables.
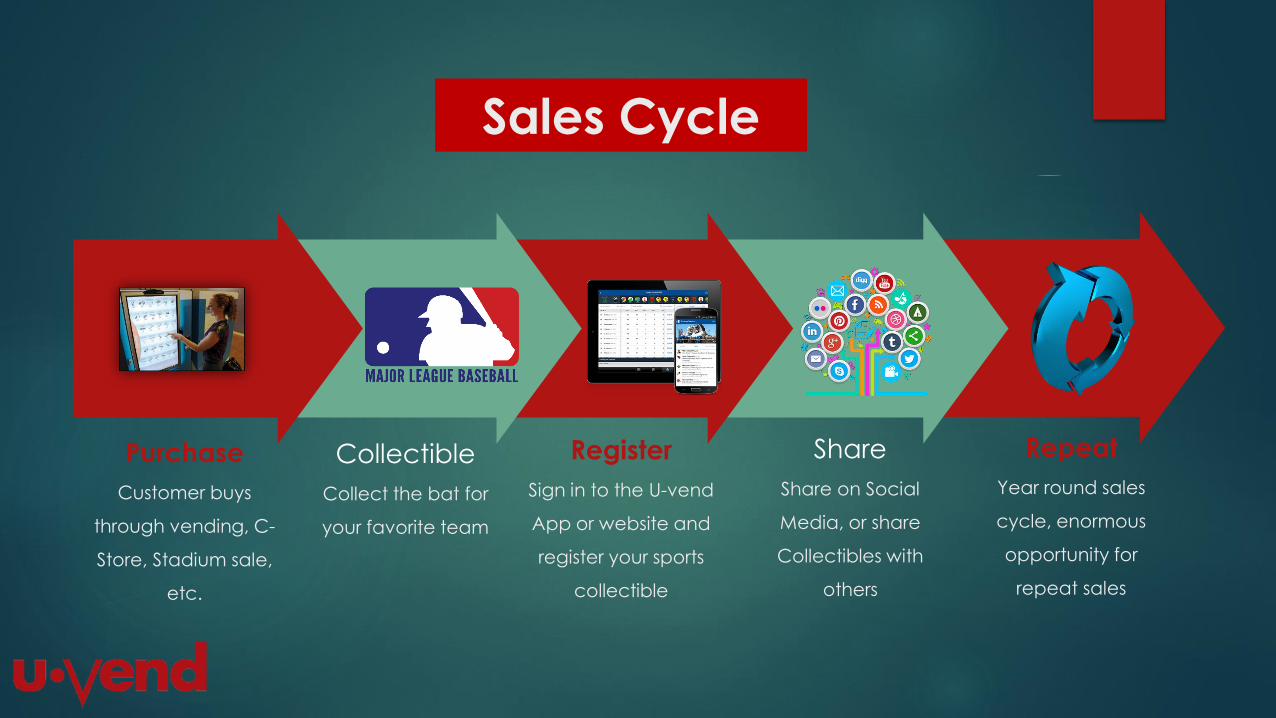
Sales Cycle
Purchase
Customer buys
through vending, C-
Store, Stadium sale,
etc.
Collectible
Collect the bat for
your favorite team
Register
Sign in to the U-vend
App or website and
register your sports
collectible
Share
Share on Social
Media, or share
Collectibles with
others
Repeat
Year round sales
cycle, enormous
opportunity for
repeat sales
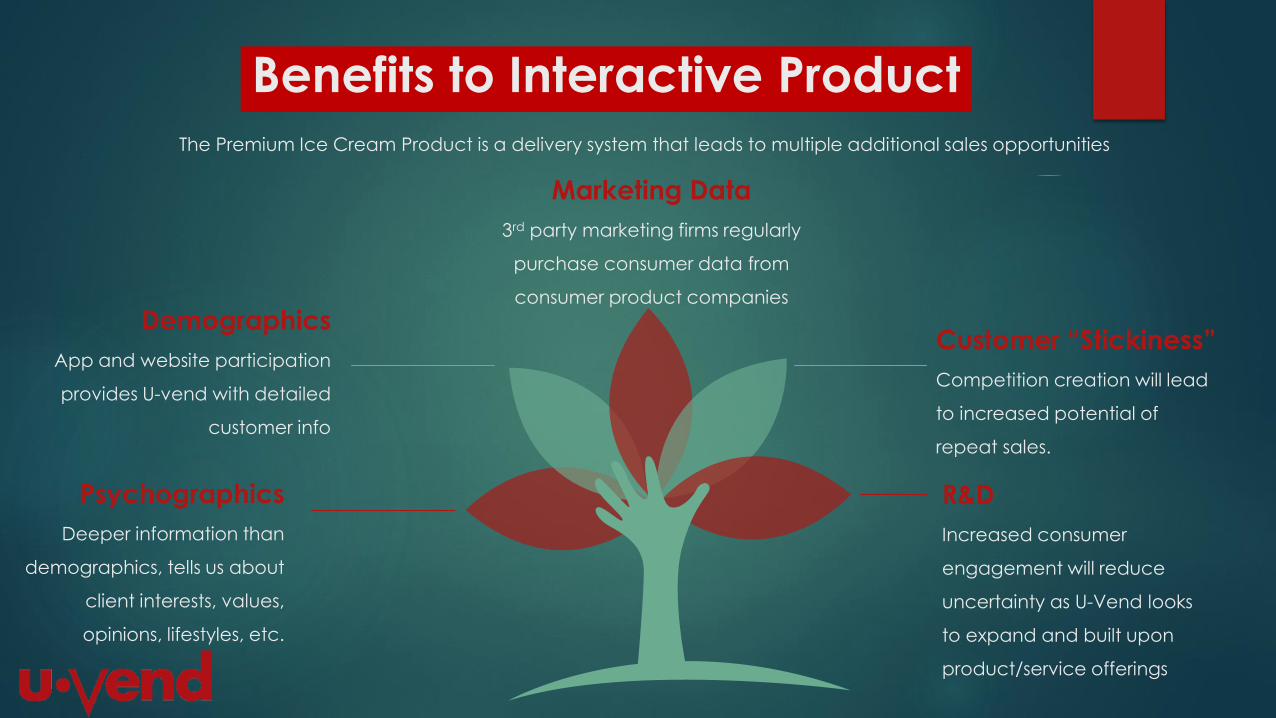
Benefits to Interactive ProductThe Premium Ice Cream Product is a delivery system that leads to multiple additional sales opportunities
R&D
Increased consumer
engagement will reduce
uncertainty as U-Vend looks
to expand and built upon
product/service offerings
Customer “Stickiness”
Competition creation will lead
to increased potential of
repeat sales.
Demographics
App and website participation
provides U-vend with detailed
customer info
Psychographics
Deeper information than
demographics, tells us about
client interests, values,
opinions, lifestyles, etc.
Marketing Data
3rd party marketing firms regularly
purchase consumer data from
consumer product companies
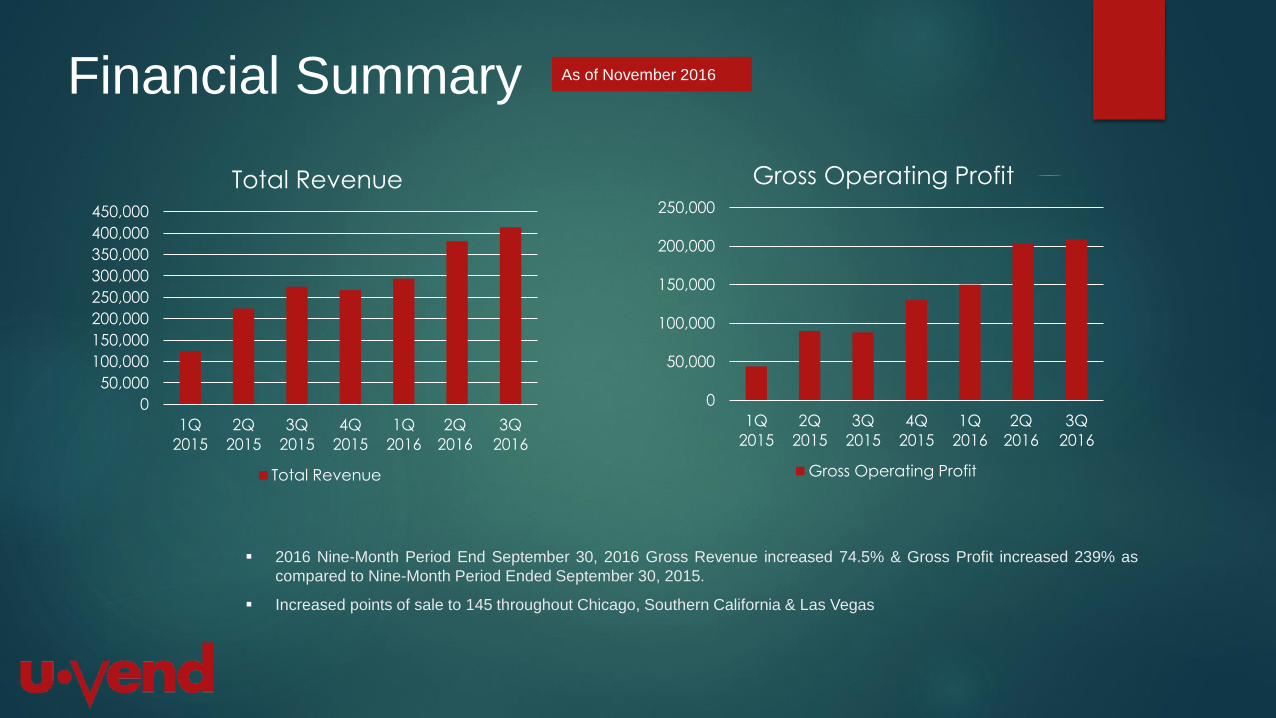
2016 Nine-Month Period End September 30, 2016 Gross Revenue increased 74.5% & Gross Profit increased 239% as
compared to Nine-Month Period Ended September 30, 2015.
Increased points of sale to 145 throughout Chicago, Southern California & Las Vegas
Financial Summary As of November 2016
0
50,000
100,000
150,000
200,000
250,000
300,000
350,000
400,000
450,000
1Q
2015
2Q
2015
3Q
2015
4Q
2015
1Q
2016
2Q
2016
3Q
2016
Total Revenue
Total Revenue
0
50,000
100,000
150,000
200,000
250,000
1Q
2015
2Q
2015
3Q
2015
4Q
2015
1Q
2016
2Q
2016
3Q
2016
Gross Operating Profit
Gross Operating Profit

1080 N. Batavia St. Unit A
Orange, CA 92867
( 8 8 8 ) 5 5 U - V E N D
w w w . u - v e n d . c o m
i n f o @ u - v e n d . c o m
THANK YOU!