Embed Size (px)
Citation preview

2015 © Trivadis
BASEL BERN BRUGG GENF LAUSANNE ZÜRICH DÜSSELDORF FRANKFURT A.M. FREIBURG I.BR. HAMBURG MÜNCHEN STUTTGART WIEN
KOPENHAGEN
2015 © Trivadis
Haben Sie Ihre
WebLogic Umgebung im Griff?
Daniel Joray
2015 © Trivadis
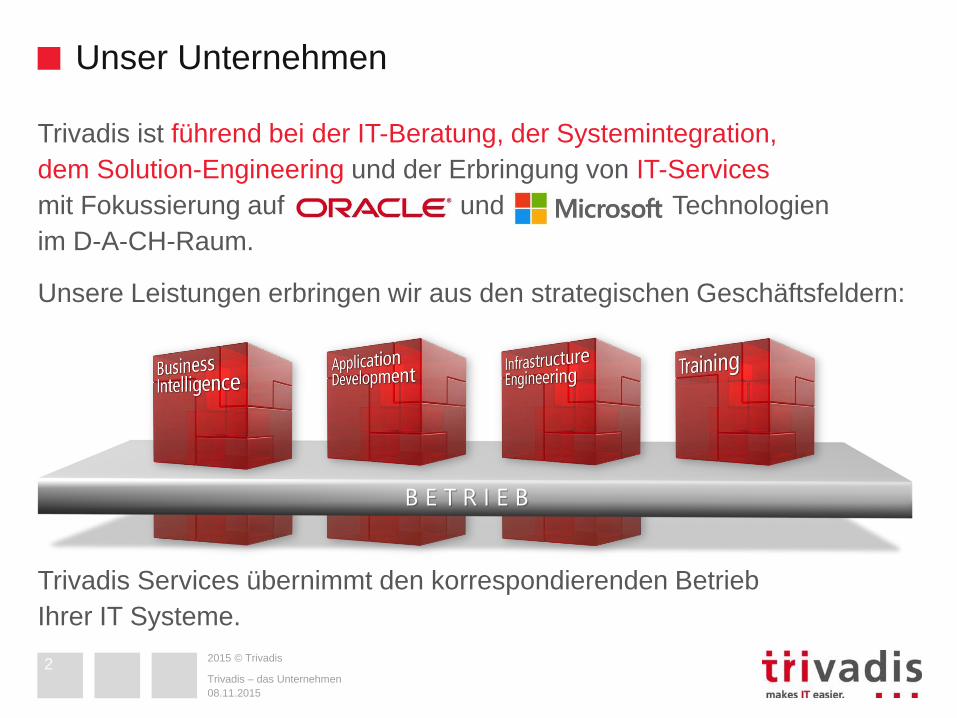
Trivadis ist führend bei der IT-Beratung, der Systemintegration,
dem Solution-Engineering und der Erbringung von IT-Services
mit Fokussierung auf und Technologien
im D-A-CH-Raum.
Unsere Leistungen erbringen wir aus den strategischen Geschäftsfeldern:
Trivadis Services übernimmt den korrespondierenden Betrieb
Ihrer IT Systeme.
Unser Unternehmen
08.11.2015
Trivadis – das Unternehmen
B E T R I E B
2
2015 © Trivadis
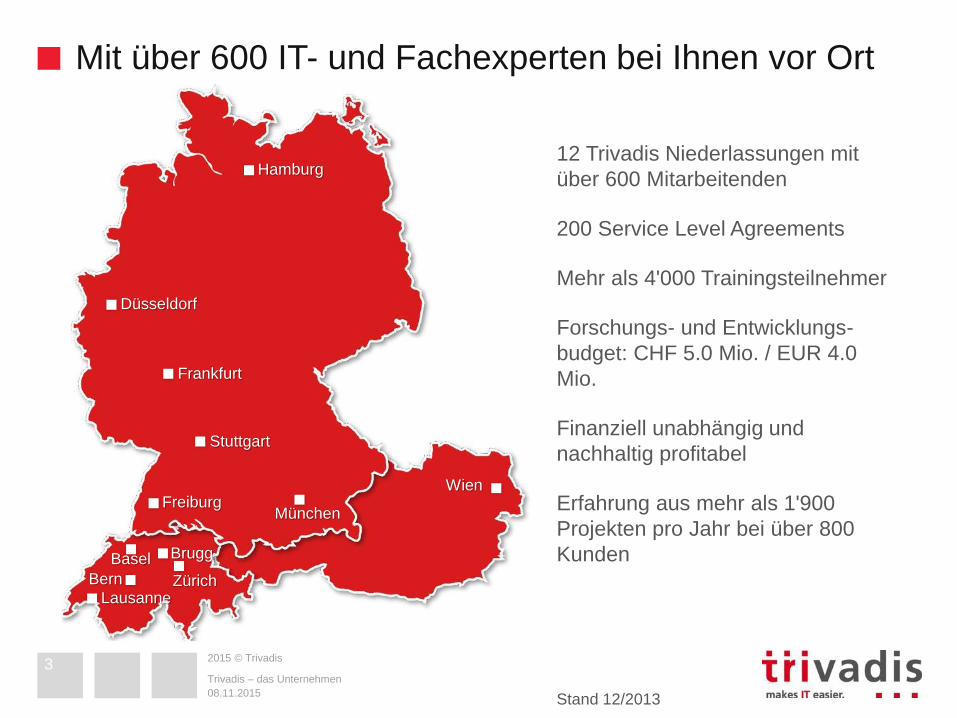
Mit über 600 IT- und Fachexperten bei Ihnen vor Ort
3
12 Trivadis Niederlassungen mit
über 600 Mitarbeitenden
200 Service Level Agreements
Mehr als 4'000 Trainingsteilnehmer
Forschungs- und Entwicklungs-
budget: CHF 5.0 Mio. / EUR 4.0
Mio.
Finanziell unabhängig und
nachhaltig profitabel
Erfahrung aus mehr als 1'900
Projekten pro Jahr bei über 800
Kunden
Stand 12/2013
Hamburg
Düsseldorf
Frankfurt
FreiburgMünchen
Wien
Basel
ZürichBern
Lausanne
3
Stuttgart
08.11.2015
Trivadis – das Unternehmen
3
Brugg
2015 © Trivadis
Trivadis – das Unternehmen
Trivadis an der DOAG
Ebene 3 - gleich neben der Rolltreppe
Wir freuen uns auf Ihren Besuch.
Denn mit Trivadis gewinnen Sie immer.
2015 © Trivadis
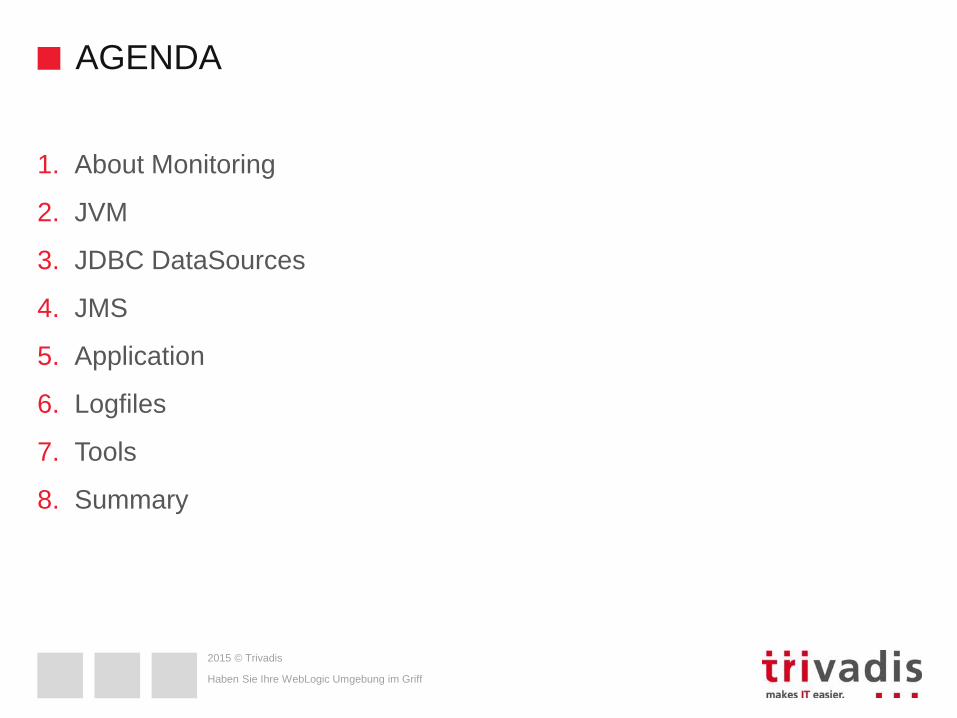
AGENDA
1. About Monitoring
2. JVM
3. JDBC DataSources
4. JMS
5. Application
6. Logfiles
7. Tools
8. Summary
Haben Sie Ihre WebLogic Umgebung im Griff
2015 © Trivadis
Haben Sie Ihre WebLogic Umgebung im Griff
About Monitoring
2015 © Trivadis
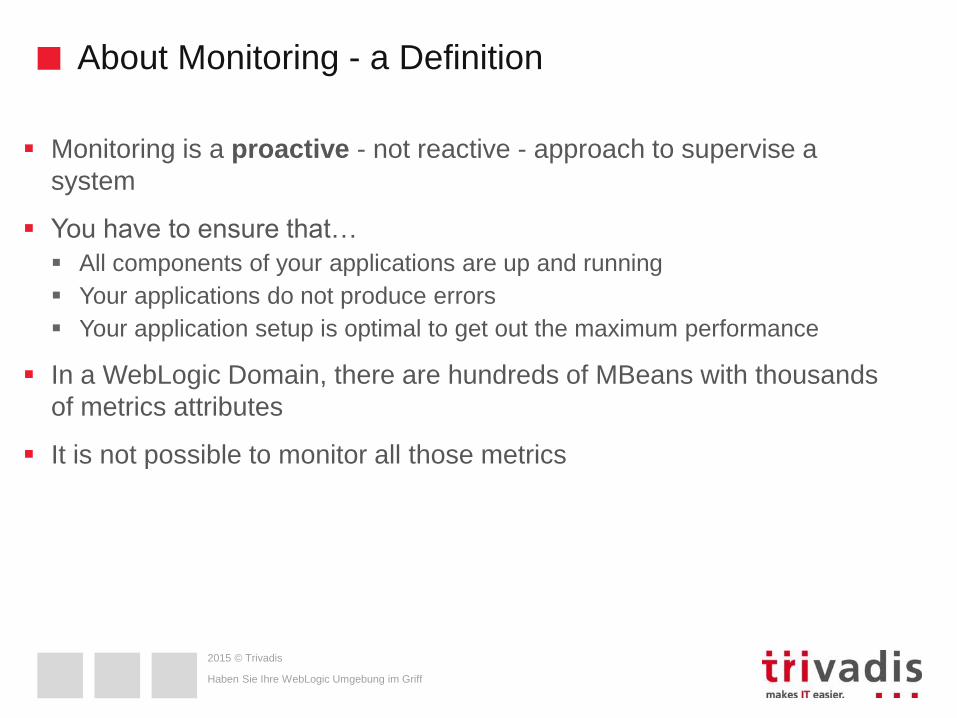
About Monitoring - a Definition
Haben Sie Ihre WebLogic Umgebung im Griff
Monitoring is a proactive - not reactive - approach to supervise a
system
You have to ensure that…
All components of your applications are up and running
Your applications do not produce errors
Your application setup is optimal to get out the maximum performance
In a WebLogic Domain, there are hundreds of MBeans with thousands
of metrics attributes
It is not possible to monitor all those metrics
2015 © Trivadis
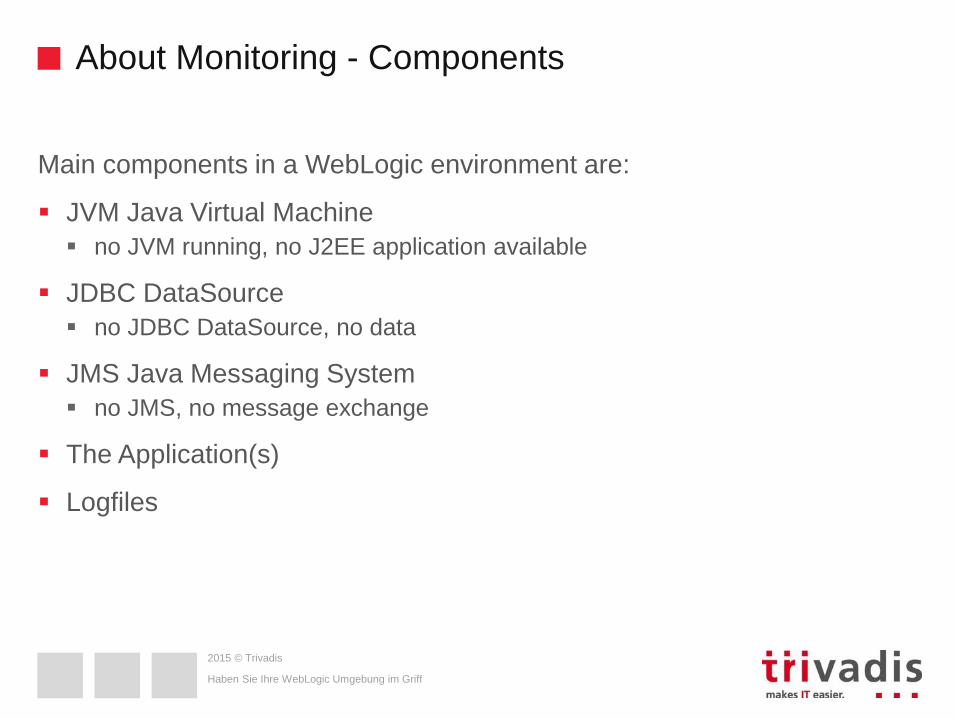
About Monitoring - Components
Main components in a WebLogic environment are:
JVM Java Virtual Machine
no JVM running, no J2EE application available
JDBC DataSource
no JDBC DataSource, no data
JMS Java Messaging System
no JMS, no message exchange
The Application(s)
Logfiles
Haben Sie Ihre WebLogic Umgebung im Griff
2015 © Trivadis
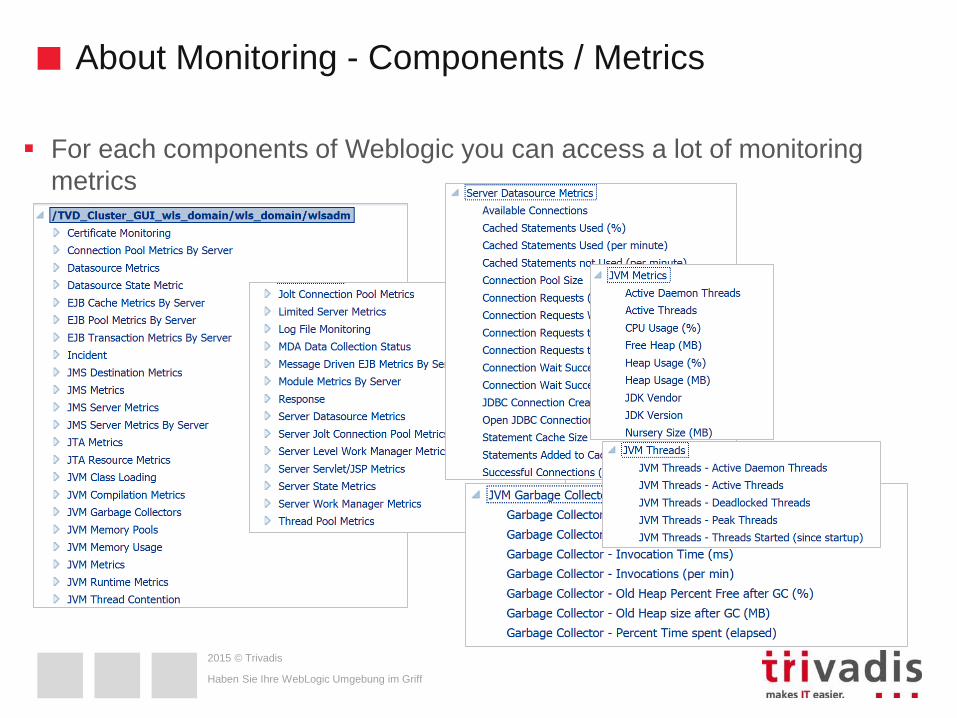
About Monitoring - Components / Metrics
Haben Sie Ihre WebLogic Umgebung im Griff
For each components of Weblogic you can access a lot of monitoring
metrics
2015 © Trivadis
Haben Sie Ihre WebLogic Umgebung im Griff
But which are really
important for your
application?
2015 © Trivadis
Haben Sie Ihre WebLogic Umgebung im Griff
JVM
2015 © Trivadis
JVM – General
A Java virtual machine (JVM) is a virtual machine capable of executing
Java bytecode, it is the code execution component of the Java software
platform
WebLogic can use HotSpot JVM from Oracle, JRockit from BEA, IBM
JVM and HP JVM
Not all JVMs are created equal
The Java virtual machine heap is the area of memory used by the JVM
for dynamic memory allocation, the heap is split up into “generations”
The memory management is not a task of WebLogic server, this is the
work of the Java Virtual Machine (JVM)
The Java Virtual Machine (JVM) you use to run your WebLogic Server–
based application is a key factor in server performance
Haben Sie Ihre WebLogic Umgebung im Griff
2015 © Trivadis
JVM - Memory
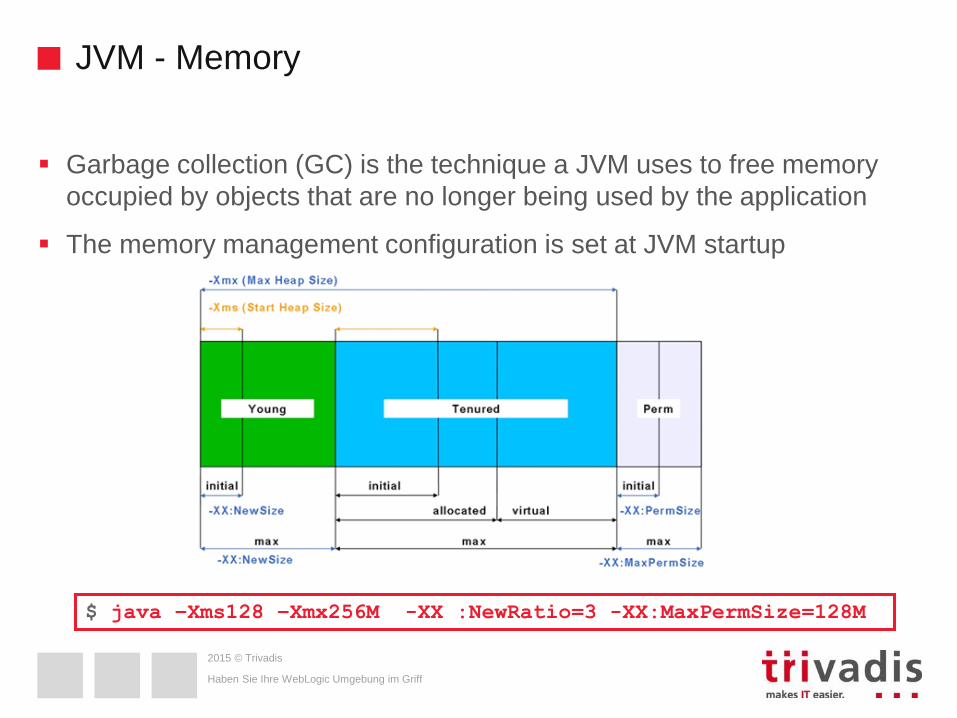
Garbage collection (GC) is the technique a JVM uses to free memory
occupied by objects that are no longer being used by the application
The memory management configuration is set at JVM startup
Haben Sie Ihre WebLogic Umgebung im Griff
$ java –Xms128 –Xmx256M -XX :NewRatio=3 -XX:MaxPermSize=128M
2015 © Trivadis
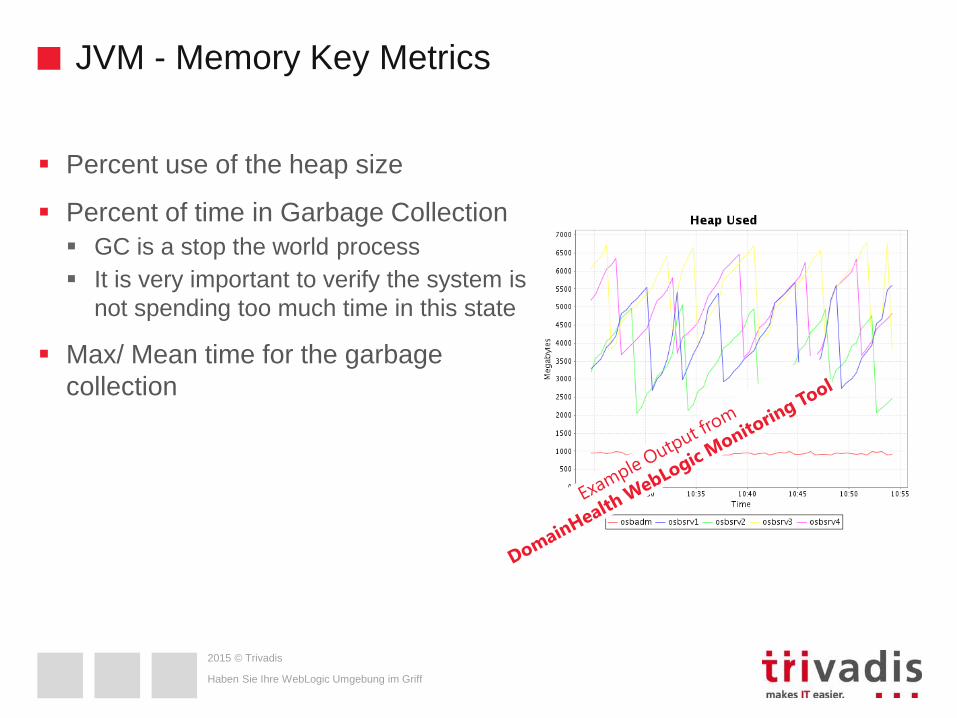
JVM - Memory Key Metrics
Percent use of the heap size
Percent of time in Garbage Collection
GC is a stop the world process
It is very important to verify the system is
not spending too much time in this state
Max/ Mean time for the garbage
collection
Haben Sie Ihre WebLogic Umgebung im Griff
2015 © Trivadis
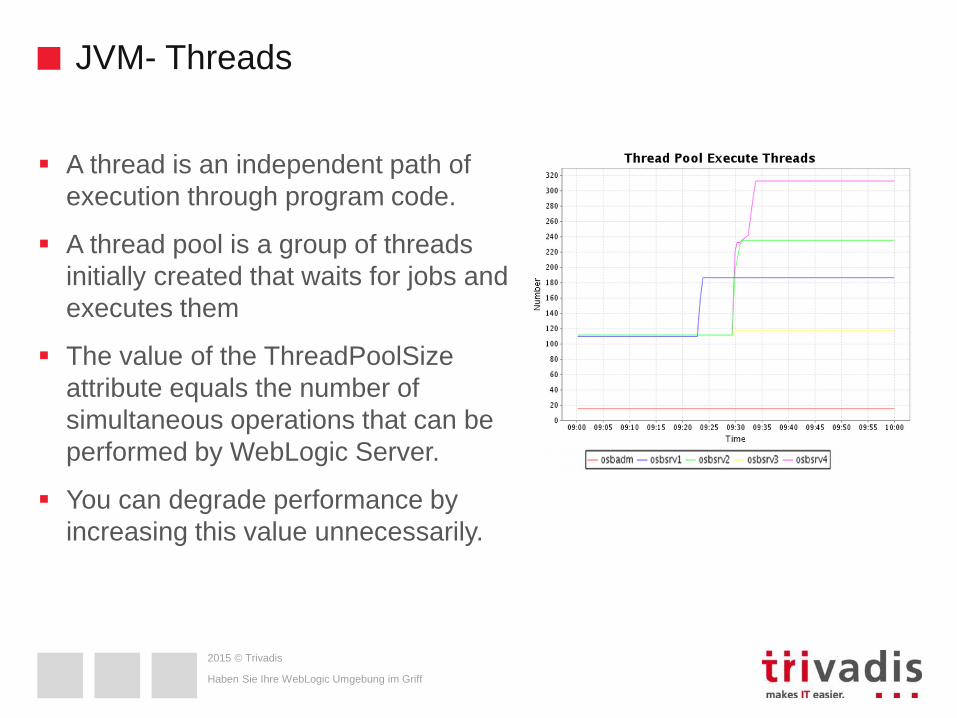
JVM- Threads
A thread is an independent path of
execution through program code.
A thread pool is a group of threads
initially created that waits for jobs and
executes them
The value of the ThreadPoolSize
attribute equals the number of
simultaneous operations that can be
performed by WebLogic Server.
You can degrade performance by
increasing this value unnecessarily.
Haben Sie Ihre WebLogic Umgebung im Griff
2015 © Trivadis
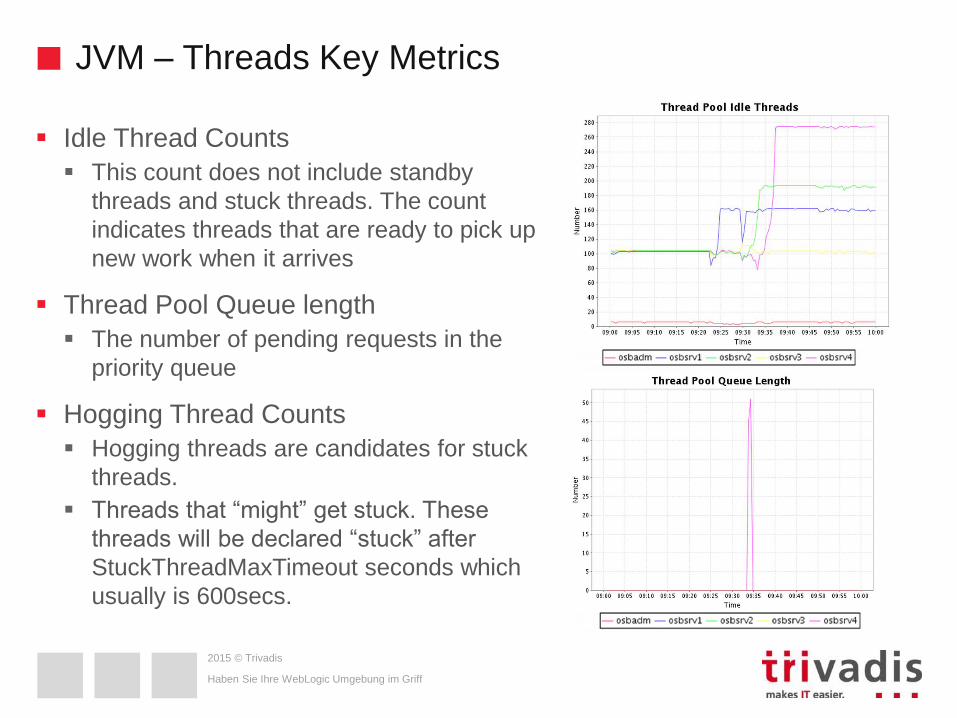
JVM – Threads Key Metrics
Idle Thread Counts
This count does not include standby
threads and stuck threads. The count
indicates threads that are ready to pick up
new work when it arrives
Thread Pool Queue length
The number of pending requests in the
priority queue
Hogging Thread Counts
Hogging threads are candidates for stuck
threads.
Threads that “might” get stuck. These
threads will be declared “stuck” after
StuckThreadMaxTimeout seconds which
usually is 600secs.
Haben Sie Ihre WebLogic Umgebung im Griff
2015 © Trivadis
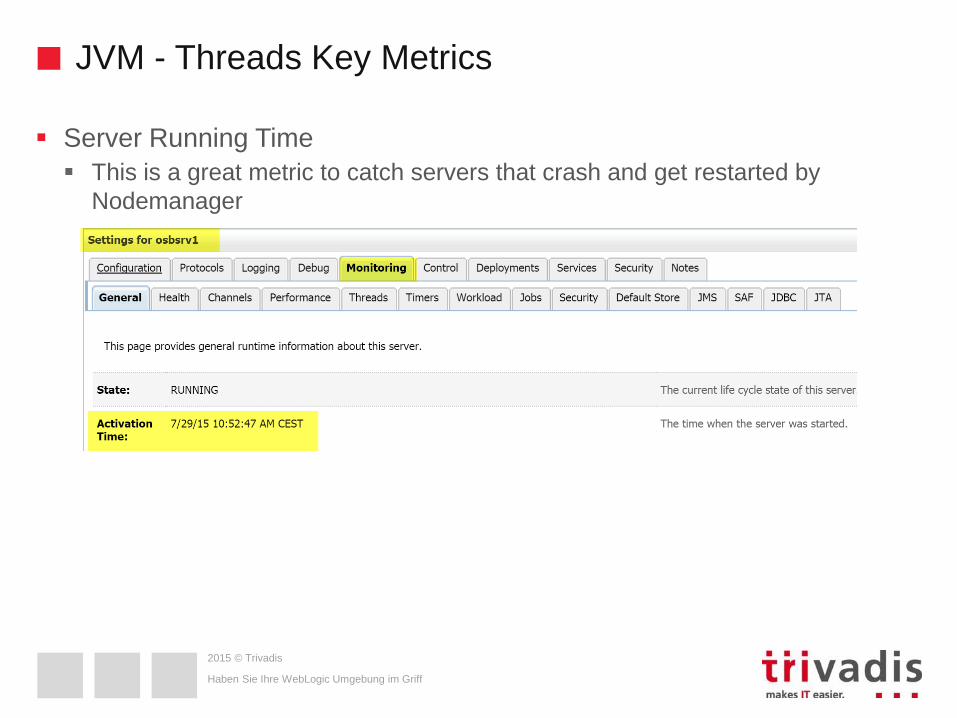
JVM - Threads Key Metrics
Server Running Time
This is a great metric to catch servers that crash and get restarted by
Nodemanager
Haben Sie Ihre WebLogic Umgebung im Griff
2015 © Trivadis
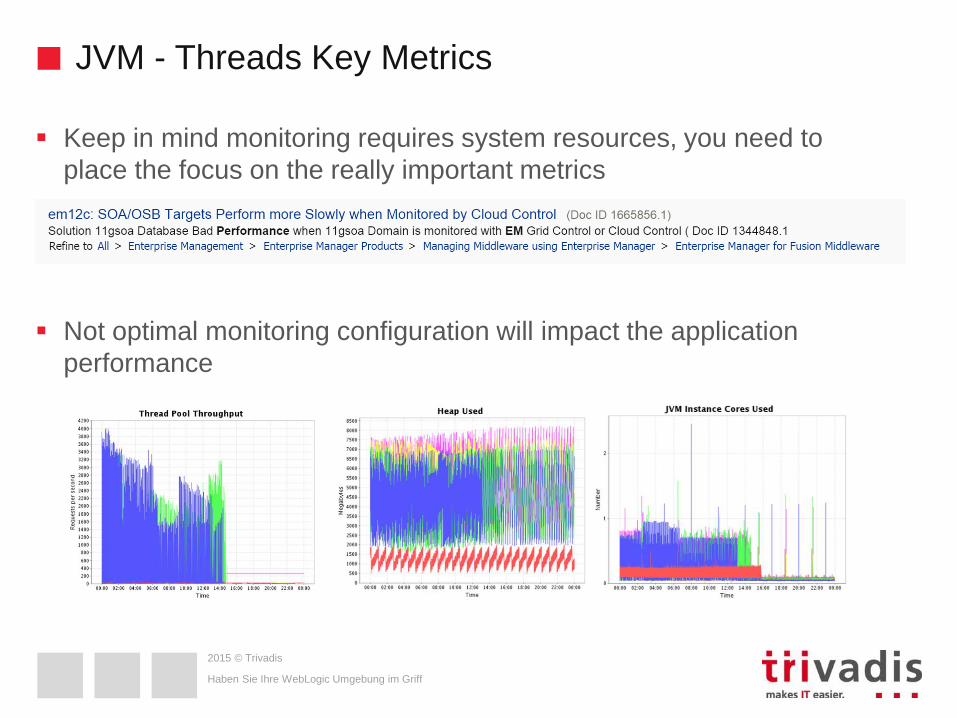
JVM - Threads Key Metrics
Keep in mind monitoring requires system resources, you need to
place the focus on the really important metrics
Not optimal monitoring configuration will impact the application
performance
Haben Sie Ihre WebLogic Umgebung im Griff
2015 © Trivadis
Haben Sie Ihre WebLogic Umgebung im Griff
JDBC DataSource
2015 © Trivadis
JDBC DataSource – General
The application connects to the database with
a JDBC DataSource
A JDBC DataSource contains a pool of
database connections which are ready-to-use
A JBCD DataSource can be configured with
different behaviours e.g.
initial-capacity
min-capacity
max-capacity
etc.
Haben Sie Ihre WebLogic Umgebung im Griff
2015 © Trivadis
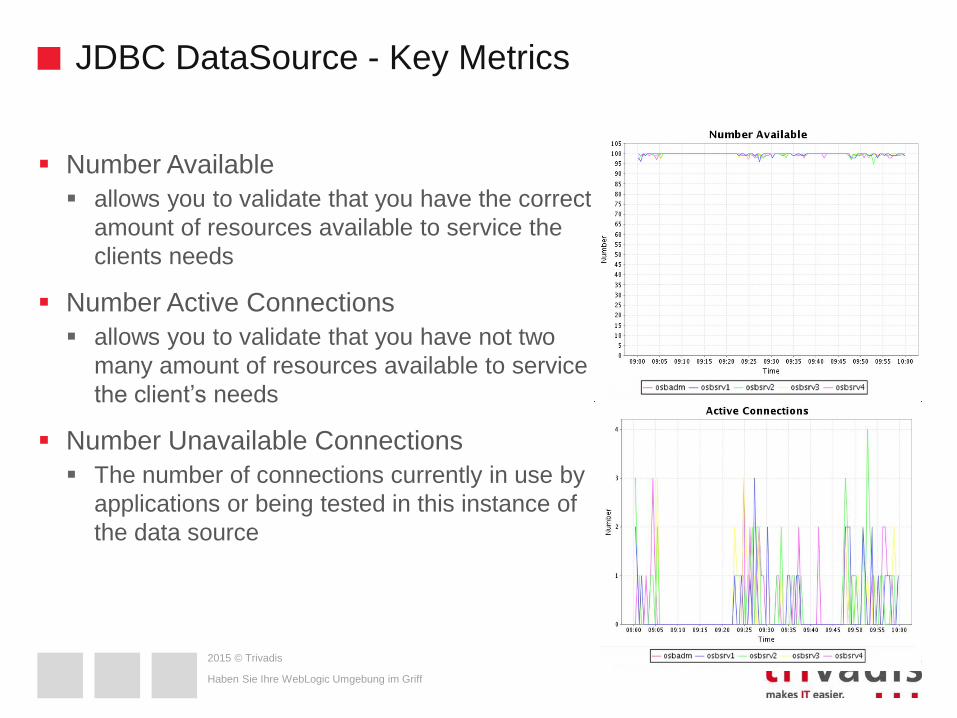
JDBC DataSource - Key Metrics
Number Available
allows you to validate that you have the correct
amount of resources available to service the
clients needs
Number Active Connections
allows you to validate that you have not two
many amount of resources available to service
the client’s needs
Number Unavailable Connections
The number of connections currently in use by
applications or being tested in this instance of
the data source
Haben Sie Ihre WebLogic Umgebung im Griff
2015 © Trivadis
Haben Sie Ihre WebLogic Umgebung im Griff
JMS
2015 © Trivadis
JMS – General
The Java Message Service (JMS) is a standard API for accessing
enterprise messaging systems. Specifically, JMS:
Enables Java applications sharing a messaging system to exchange
messages
Simplifies application development by providing a standard interface for
creating, sending, and receiving messages
Haben Sie Ihre WebLogic Umgebung im Griff
2015 © Trivadis
JMS - Key Metrics
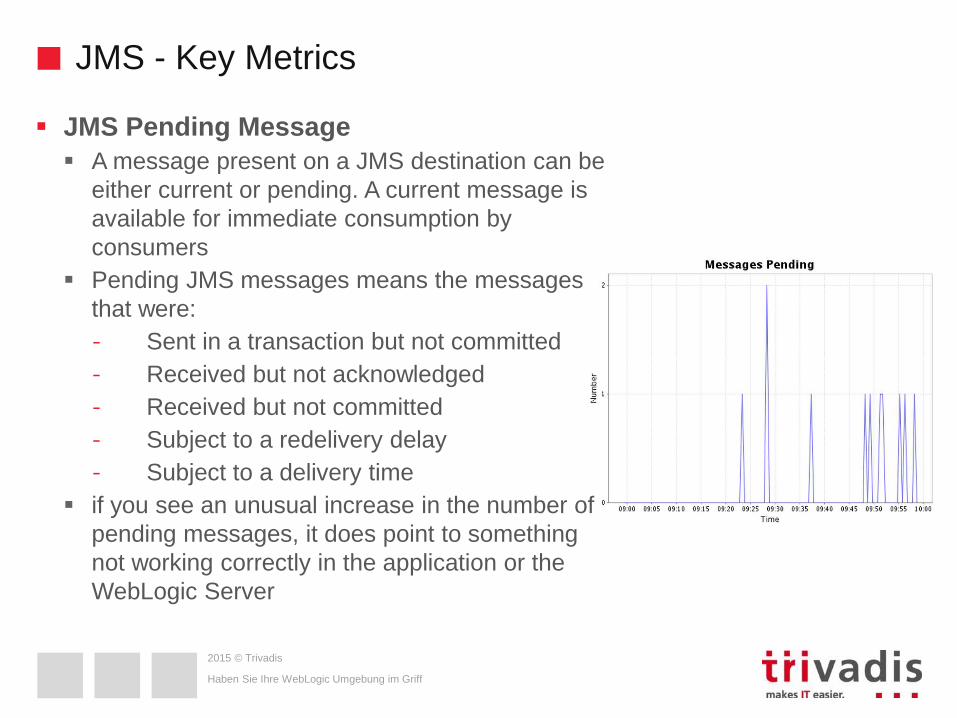
JMS Pending Message
A message present on a JMS destination can be
either current or pending. A current message is
available for immediate consumption by
consumers
Pending JMS messages means the messages
that were:
- Sent in a transaction but not committed
- Received but not acknowledged
- Received but not committed
- Subject to a redelivery delay
- Subject to a delivery time
if you see an unusual increase in the number of
pending messages, it does point to something
not working correctly in the application or the
WebLogic Server
Haben Sie Ihre WebLogic Umgebung im Griff
2015 © Trivadis
JMS - Key Metrics
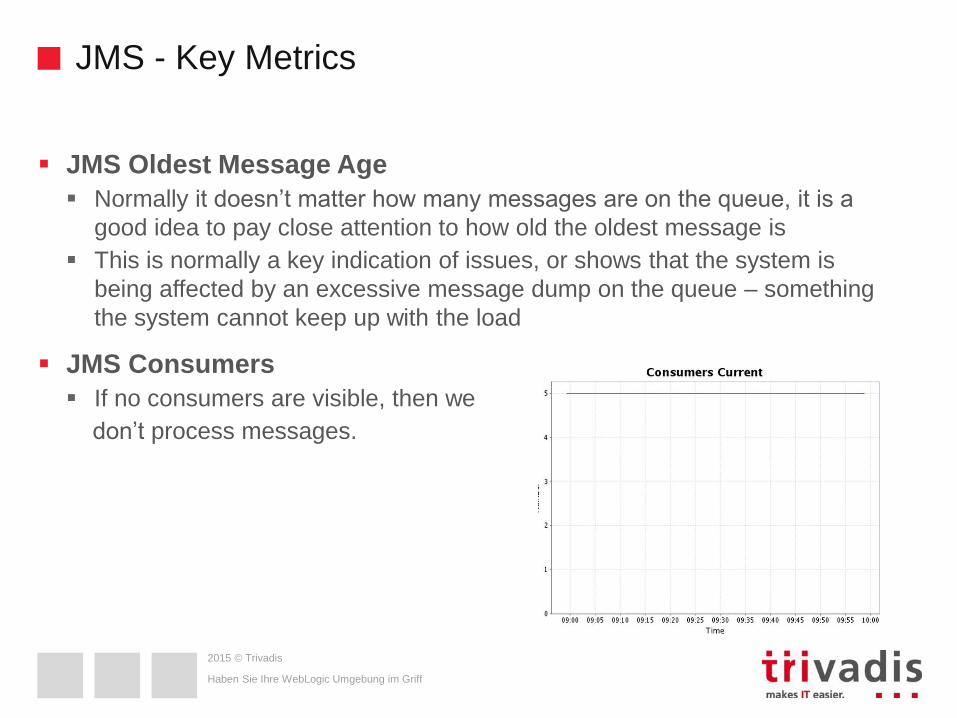
JMS Oldest Message Age
Normally it doesn’t matter how many messages are on the queue, it is a
good idea to pay close attention to how old the oldest message is
This is normally a key indication of issues, or shows that the system is
being affected by an excessive message dump on the queue – something
the system cannot keep up with the load
JMS Consumers
If no consumers are visible, then we
don’t process messages.
Haben Sie Ihre WebLogic Umgebung im Griff
2015 © Trivadis
Haben Sie Ihre WebLogic Umgebung im Griff
Application
2015 © Trivadis
Application – General
A WebLogic Server application consists of one of the following modules or
applications running on WebLogic Server:
Web application modules - HTML pages, servlets, JavaServer Pages,
and related files
Enterprise Java Beans (EJB) modules - entity beans, session beans,
and message-driven beans
Connector modules - resource adapters
Haben Sie Ihre WebLogic Umgebung im Griff
2015 © Trivadis
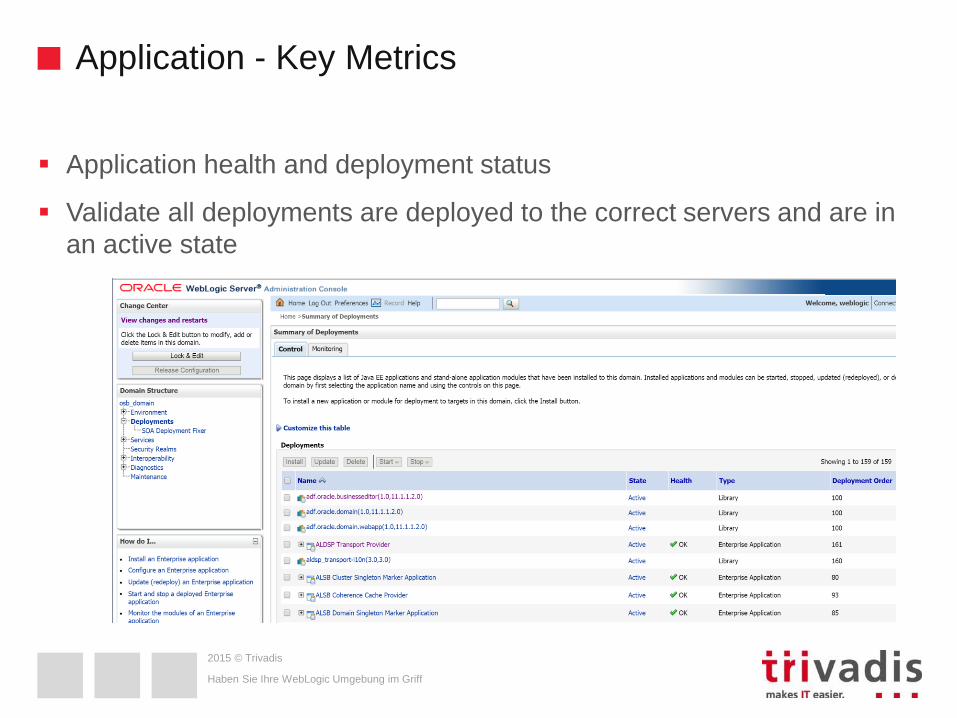
Application - Key Metrics
Application health and deployment status
Validate all deployments are deployed to the correct servers and are in
an active state
Haben Sie Ihre WebLogic Umgebung im Griff
2015 © Trivadis
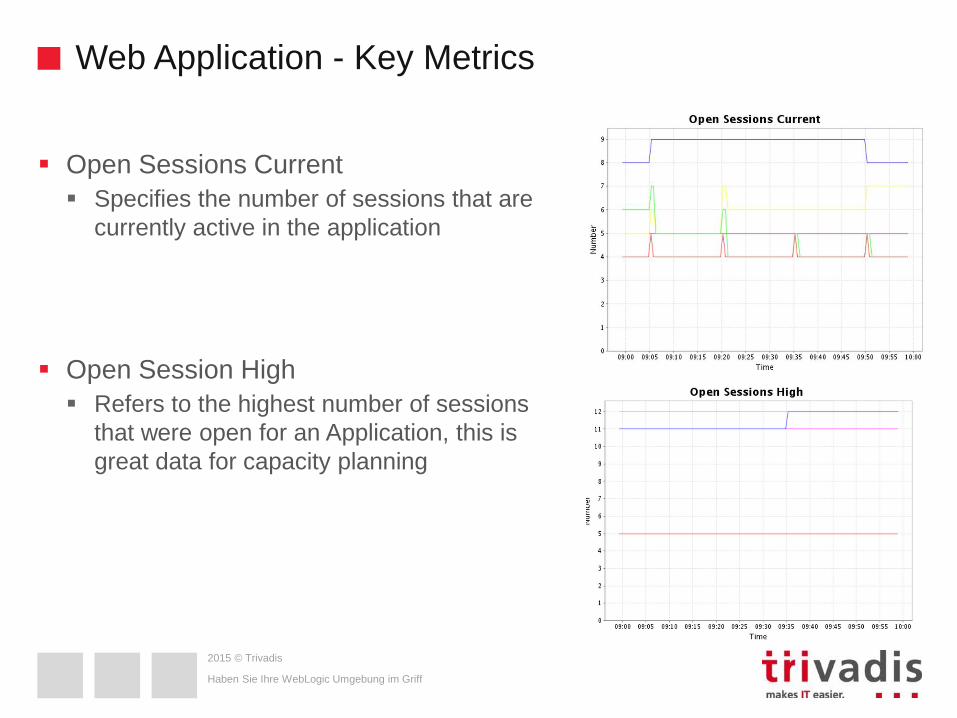
Web Application - Key Metrics
Open Sessions Current
Specifies the number of sessions that are
currently active in the application
Open Session High
Refers to the highest number of sessions
that were open for an Application, this is
great data for capacity planning
Haben Sie Ihre WebLogic Umgebung im Griff
2015 © Trivadis
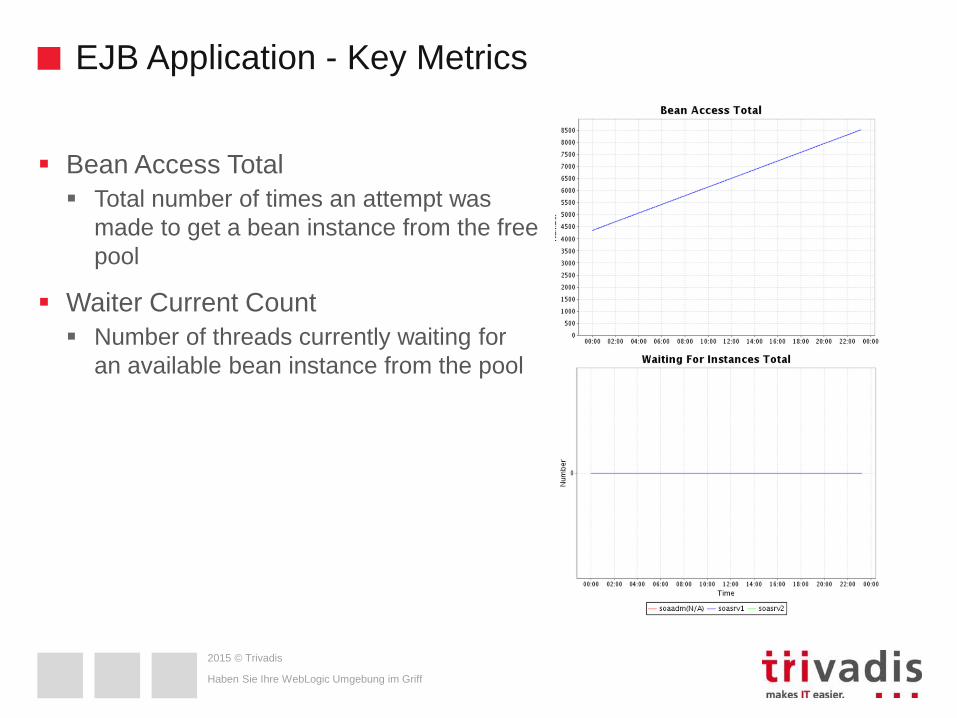
EJB Application - Key Metrics
Bean Access Total
Total number of times an attempt was
made to get a bean instance from the free
pool
Waiter Current Count
Number of threads currently waiting for
an available bean instance from the pool
Haben Sie Ihre WebLogic Umgebung im Griff
2015 © Trivadis
Haben Sie Ihre WebLogic Umgebung im Griff
Logfiles
2015 © Trivadis
Logfiles – General
In a WebLogic Domain, most components have logfiles
Domain
Managed Server
Instance Log File stderr/stdout of the JVM server_name.out
Server Log File server_name.log
HTTP access log File access.log
JDBC subsystem
DataSource.log
JMS subsystem jmsServers\JMSServer_server\jms.messages.log
Haben Sie Ihre WebLogic Umgebung im Griff
2015 © Trivadis
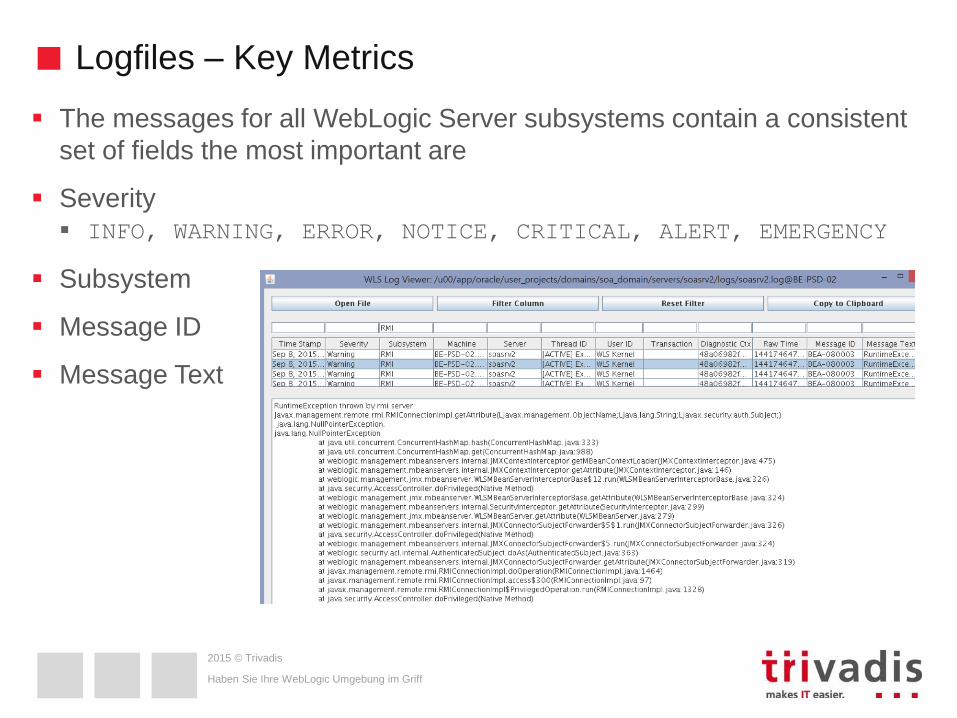
Logfiles – Key Metrics
The messages for all WebLogic Server subsystems contain a consistent
set of fields the most important are
Severity INFO, WARNING, ERROR, NOTICE, CRITICAL, ALERT, EMERGENCY
Subsystem
Message ID
Message Text
Haben Sie Ihre WebLogic Umgebung im Griff
2015 © Trivadis
Haben Sie Ihre WebLogic Umgebung im Griff
Tools
2015 © Trivadis
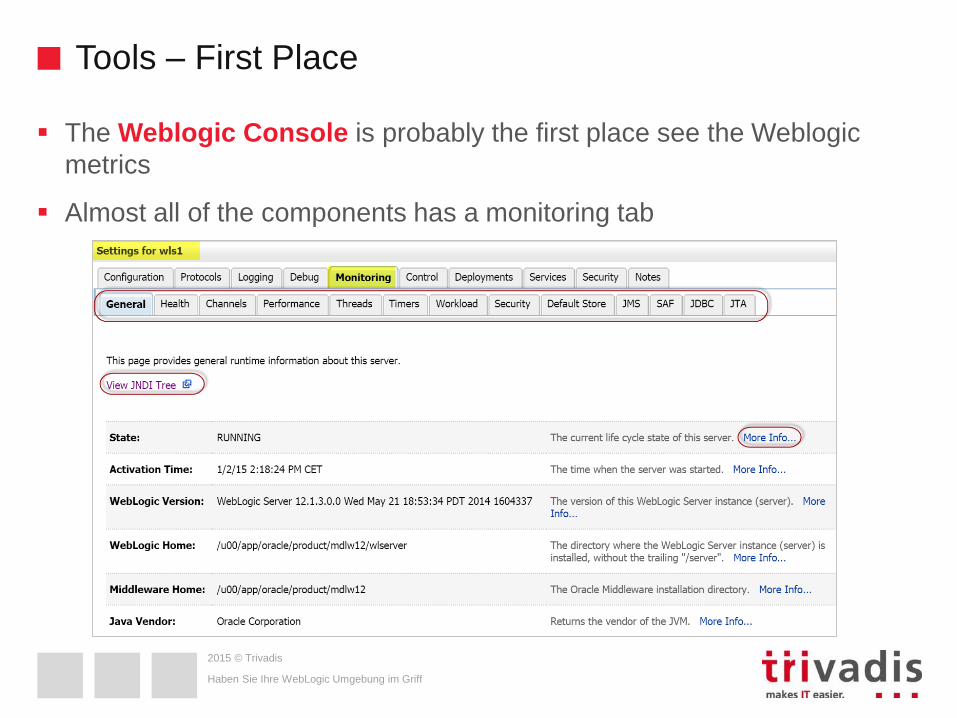
Tools – First Place
The Weblogic Console is probably the first place see the Weblogic
metrics
Almost all of the components has a monitoring tab
Haben Sie Ihre WebLogic Umgebung im Griff
2015 © Trivadis
Tools – Low Cost Solutions
The jconsole is a JMX-compliant graphical tool for monitoring a Java
virtual machine
The jvisualvm is a tool that provides a visual interface for viewing
detailed information about Java applications while they are running on a
Java Virtual Machine (JVM), command allows you to query various
aspects of specific virtual machines
The Java Mission Control jmc and Java Flight Recorder together create
a complete tool chain to continuously collect low level and detailed
runtime information enabling after-the-fact incident analysis
DomainHealth is a J2EE application, which is deployed on a
AdminServer, it shows the most key metrics
GCViewer analyses logfile from the JVM garbage collection actions
WLST – The WebLogic Scripting Tool
Haben Sie Ihre WebLogic Umgebung im Griff
2015 © Trivadis
Tools – Professional
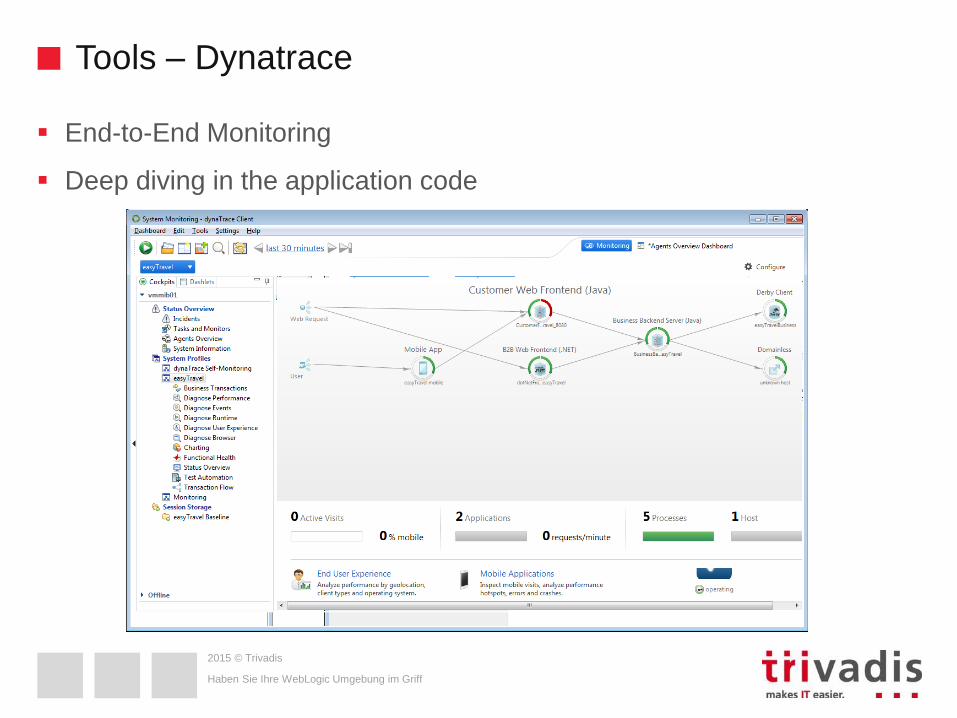
Dynatrace / Appdynamics
Those applications manage the availability and performance of software
applications and the impact on user experience in the form of deep
transaction tracing, synthetic monitoring, real user monitoring, and network
monitoring.
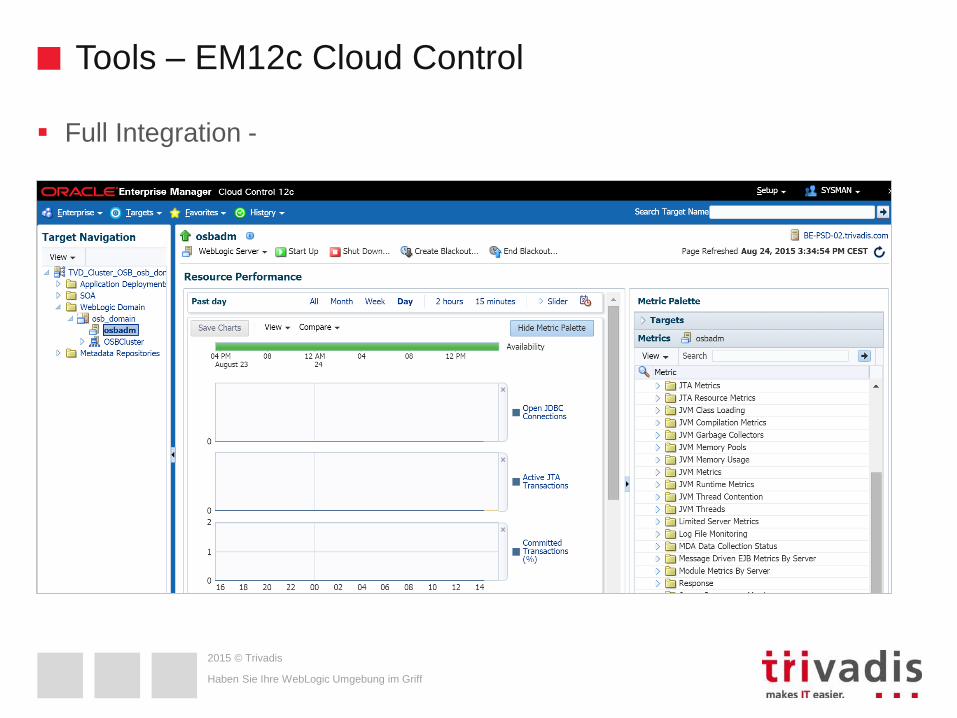
EM12c Middleware Monitoring Plugin
The WebLogic Server Management Pack Enterprise Edition greatly improves
server as well as application performance by providing unique functionality to
automatically detect performance bottlenecks; quickly diagnose these
performance problems, and identify their root cause.
Haben Sie Ihre WebLogic Umgebung im Griff
2015 © Trivadis
Tools – jvisualvm
Haben Sie Ihre WebLogic Umgebung im Griff
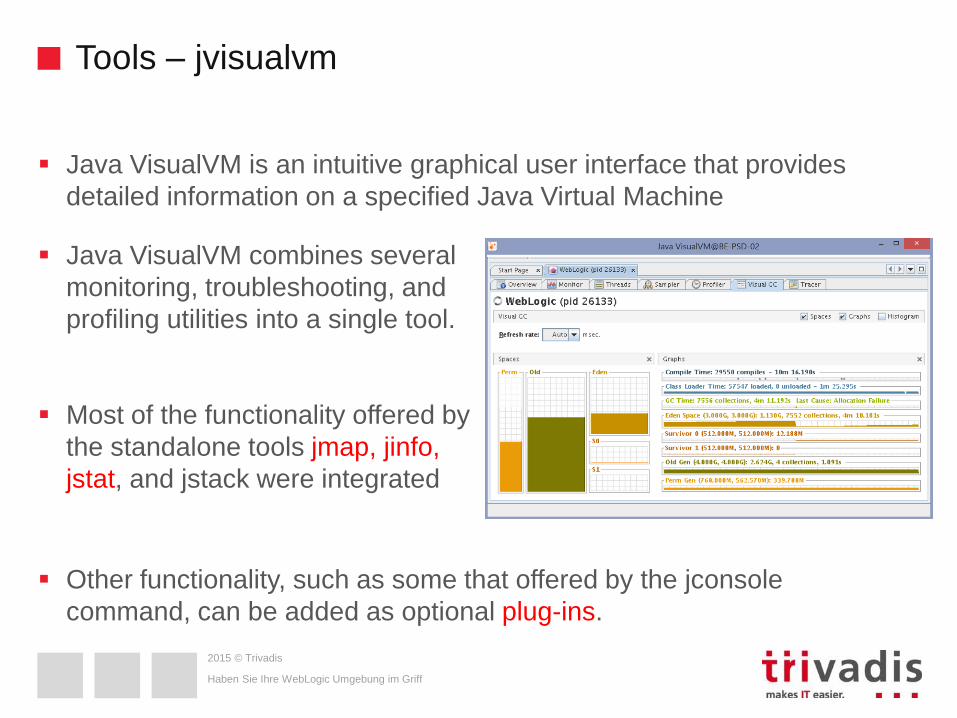
Java VisualVM is an intuitive graphical user interface that provides
detailed information on a specified Java Virtual Machine
Other functionality, such as some that offered by the jconsole
command, can be added as optional plug-ins.
Java VisualVM combines several
monitoring, troubleshooting, and
profiling utilities into a single tool.
Most of the functionality offered by
the standalone tools jmap, jinfo,
jstat, and jstack were integrated
2015 © Trivadis
Tools – DomainHealth
Haben Sie Ihre WebLogic Umgebung im Griff
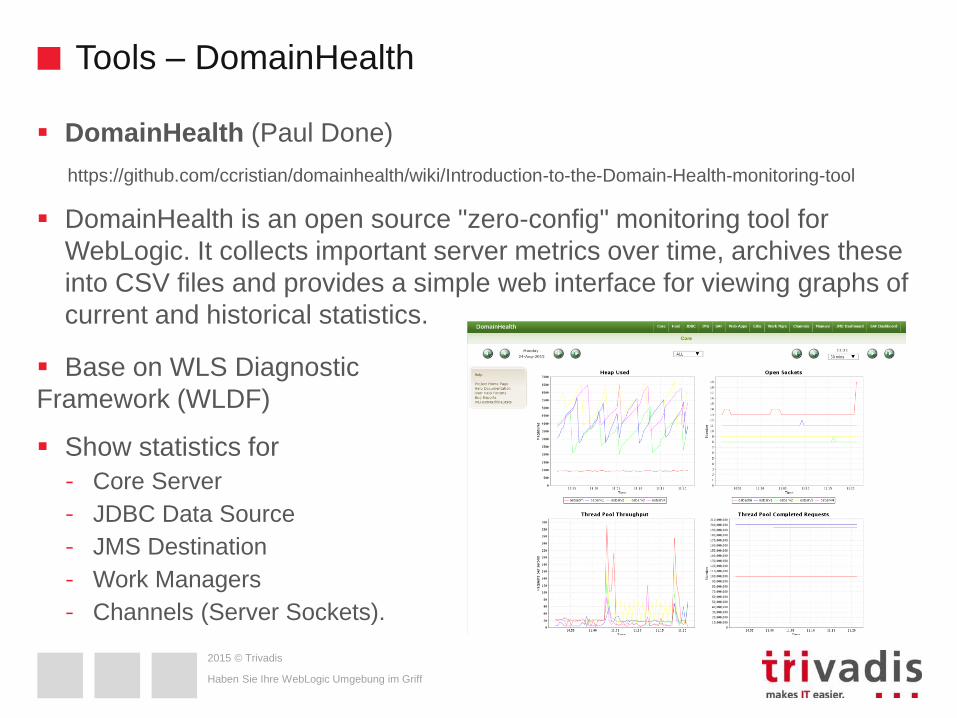
DomainHealth (Paul Done)
https://github.com/ccristian/domainhealth/wiki/Introduction-to-the-Domain-Health-monitoring-tool
DomainHealth is an open source "zero-config" monitoring tool for
WebLogic. It collects important server metrics over time, archives these
into CSV files and provides a simple web interface for viewing graphs of
current and historical statistics.
Base on WLS Diagnostic
Framework (WLDF)
Show statistics for
- Core Server
- JDBC Data Source
- JMS Destination
- Work Managers
- Channels (Server Sockets).
2015 © Trivadis
Tools – GCViewer (1)
Haben Sie Ihre WebLogic Umgebung im Griff
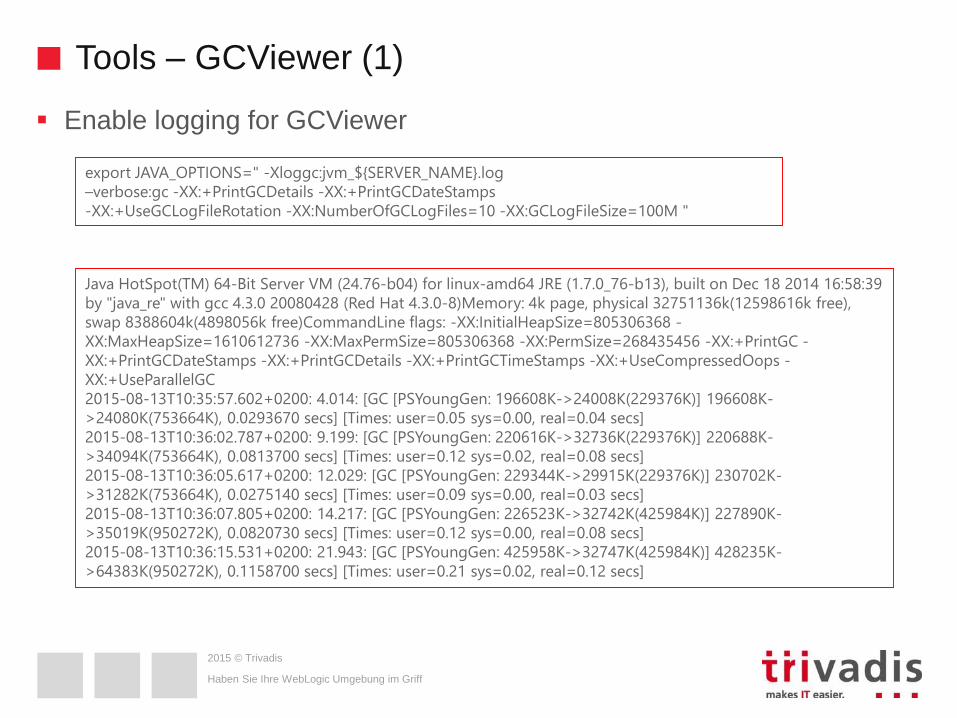
Enable logging for GCViewer
export JAVA_OPTIONS=" -Xloggc:jvm_${SERVER_NAME}.log
–verbose:gc -XX:+PrintGCDetails -XX:+PrintGCDateStamps
-XX:+UseGCLogFileRotation -XX:NumberOfGCLogFiles=10 -XX:GCLogFileSize=100M "
Java HotSpot(TM) 64-Bit Server VM (24.76-b04) for linux-amd64 JRE (1.7.0_76-b13), built on Dec 18 2014 16:58:39
by "java_re" with gcc 4.3.0 20080428 (Red Hat 4.3.0-8)Memory: 4k page, physical 32751136k(12598616k free),
swap 8388604k(4898056k free)CommandLine flags: -XX:InitialHeapSize=805306368 -
XX:MaxHeapSize=1610612736 -XX:MaxPermSize=805306368 -XX:PermSize=268435456 -XX:+PrintGC -
XX:+PrintGCDateStamps -XX:+PrintGCDetails -XX:+PrintGCTimeStamps -XX:+UseCompressedOops -
XX:+UseParallelGC
2015-08-13T10:35:57.602+0200: 4.014: [GC [PSYoungGen: 196608K->24008K(229376K)] 196608K-
>24080K(753664K), 0.0293670 secs] [Times: user=0.05 sys=0.00, real=0.04 secs]
2015-08-13T10:36:02.787+0200: 9.199: [GC [PSYoungGen: 220616K->32736K(229376K)] 220688K-
>34094K(753664K), 0.0813700 secs] [Times: user=0.12 sys=0.02, real=0.08 secs]
2015-08-13T10:36:05.617+0200: 12.029: [GC [PSYoungGen: 229344K->29915K(229376K)] 230702K-
>31282K(753664K), 0.0275140 secs] [Times: user=0.09 sys=0.00, real=0.03 secs]
2015-08-13T10:36:07.805+0200: 14.217: [GC [PSYoungGen: 226523K->32742K(425984K)] 227890K-
>35019K(950272K), 0.0820730 secs] [Times: user=0.12 sys=0.00, real=0.08 secs]
2015-08-13T10:36:15.531+0200: 21.943: [GC [PSYoungGen: 425958K->32747K(425984K)] 428235K-
>64383K(950272K), 0.1158700 secs] [Times: user=0.21 sys=0.02, real=0.12 secs]
2015 © Trivadis
Tools – GC Viewer (2)
Haben Sie Ihre WebLogic Umgebung im Griff
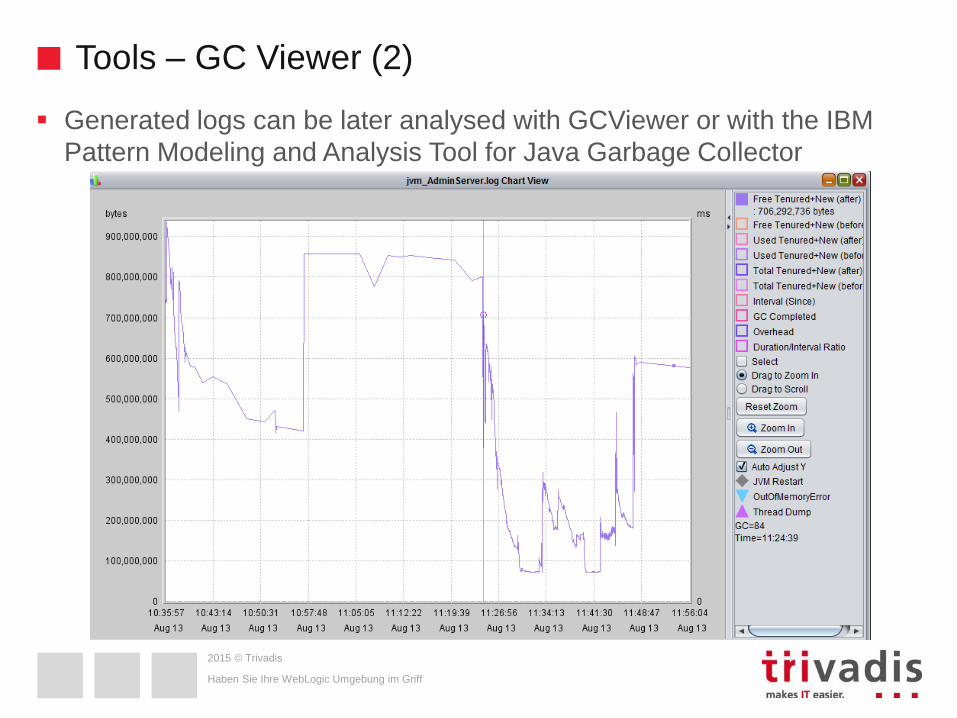
Generated logs can be later analysed with GCViewer or with the IBM
Pattern Modeling and Analysis Tool for Java Garbage Collector
2015 © Trivadis
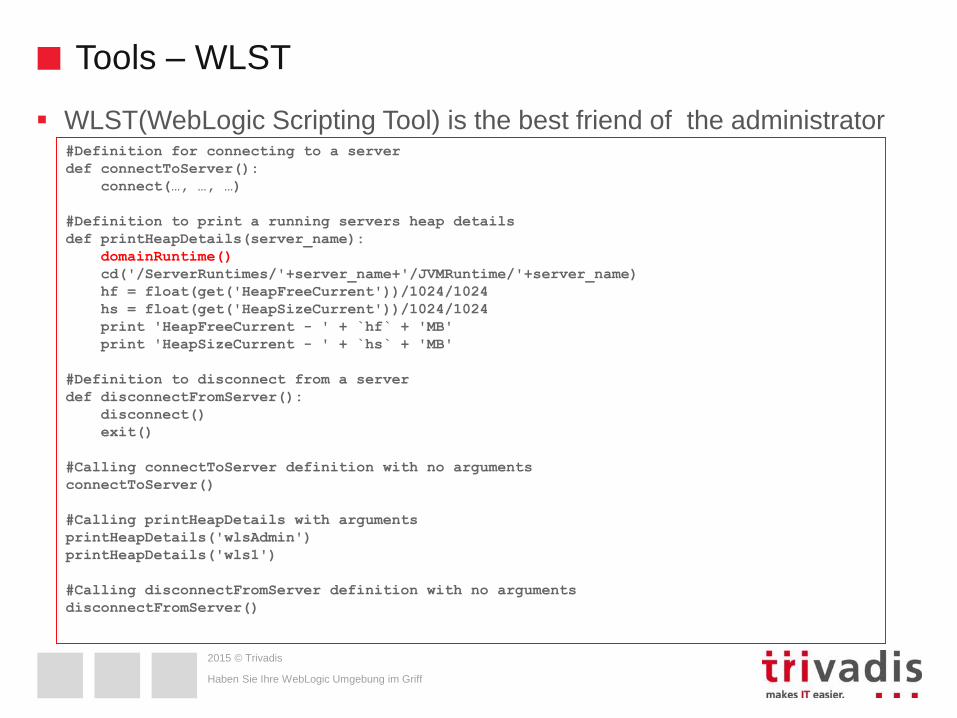
Tools – WLST
Haben Sie Ihre WebLogic Umgebung im Griff
WLST(WebLogic Scripting Tool) is the best friend of the administrator#Definition for connecting to a server
def connectToServer():
connect(…, …, …)
#Definition to print a running servers heap details
def printHeapDetails(server_name):
domainRuntime()
cd('/ServerRuntimes/'+server_name+'/JVMRuntime/'+server_name)
hf = float(get('HeapFreeCurrent'))/1024/1024
hs = float(get('HeapSizeCurrent'))/1024/1024
print 'HeapFreeCurrent - ' + `hf` + 'MB'
print 'HeapSizeCurrent - ' + `hs` + 'MB'
#Definition to disconnect from a server
def disconnectFromServer():
disconnect()
exit()
#Calling connectToServer definition with no arguments
connectToServer()
#Calling printHeapDetails with arguments
printHeapDetails('wlsAdmin')
printHeapDetails('wls1')
#Calling disconnectFromServer definition with no arguments
disconnectFromServer()
2015 © Trivadis
Tools – EM12c Cloud Control
Haben Sie Ihre WebLogic Umgebung im Griff
Full Integration -
2015 © Trivadis
Tools – Dynatrace
Haben Sie Ihre WebLogic Umgebung im Griff
End-to-End Monitoring
Deep diving in the application code
2015 © Trivadis
Tools – Distributed Log Collectors
Haben Sie Ihre WebLogic Umgebung im Griff
Logs are a critical part of any system, they give you insight into what a
system is doing as well what happened
When your system grows to multiple hosts, managing the logs and
accessing them can get complicated
Searching for a particular error across hundreds of log files on hundreds
of servers is difficult without good tools
A common approach to this problem is to setup a centralized logging
solution
Distributed Log Collectors
2015 © Trivadis
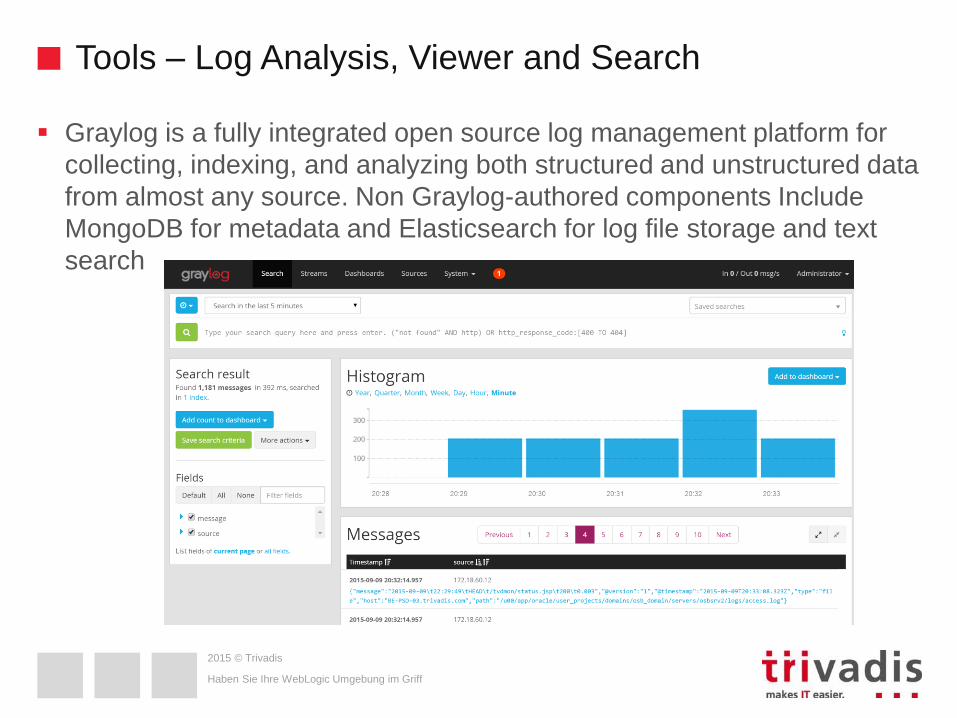
Tools – Log Analysis, Viewer and Search
Haben Sie Ihre WebLogic Umgebung im Griff
Graylog is a fully integrated open source log management platform for
collecting, indexing, and analyzing both structured and unstructured data
from almost any source. Non Graylog-authored components Include
MongoDB for metadata and Elasticsearch for log file storage and text
search
2015 © Trivadis
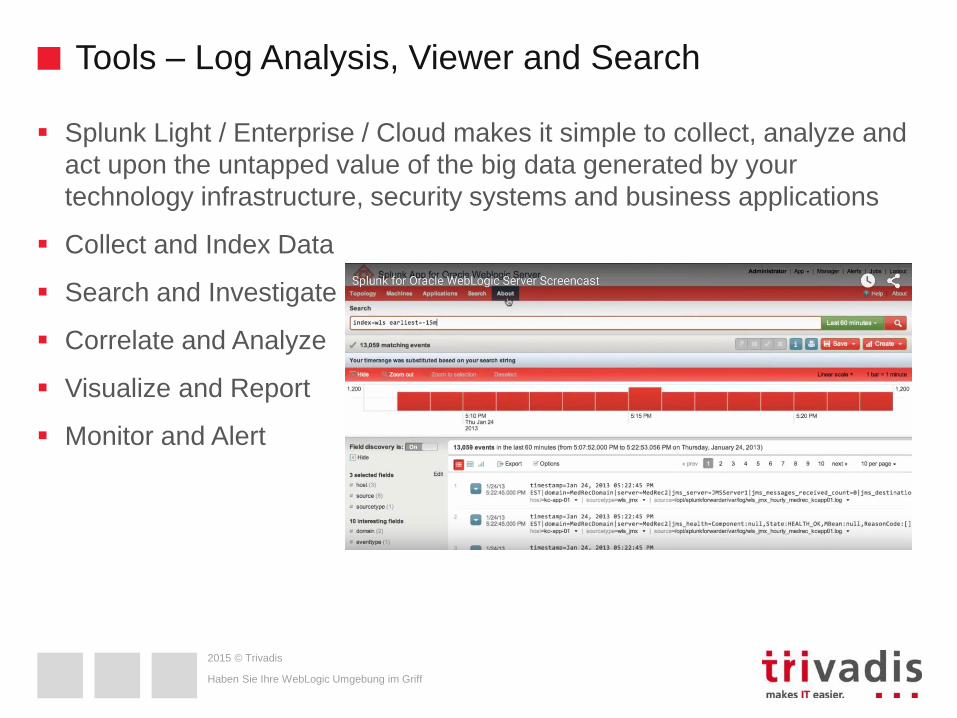
Tools – Log Analysis, Viewer and Search
Haben Sie Ihre WebLogic Umgebung im Griff
Splunk Light / Enterprise / Cloud makes it simple to collect, analyze and
act upon the untapped value of the big data generated by your
technology infrastructure, security systems and business applications
Collect and Index Data
Search and Investigate
Correlate and Analyze
Visualize and Report
Monitor and Alert
2015 © Trivadis
Summary
Each components from a WebLogic Domain should be monitored, but
not each metrics
Probably you need more than one tool
Not all monitored metrics should send alarm, but in problem case or if
you want plan the capacity of your system for the next months you
should have enough information to do your job
Haben Sie Ihre WebLogic Umgebung im Griff
“This is as much an art as it is a science.” (John Mounjoy, WebLogic The Definitive Guide)

2015 © Trivadis
Fragen und Antworten...
2015 © Trivadis
BASEL BERN BRUGG GENF LAUSANNE ZÜRICH DÜSSELDORF FRANKFURT A.M. FREIBURG I.BR. HAMBURG MÜNCHEN STUTTGART WIEN
KOPENHAGEN
Daniel Joray
Principal Consultant
Tel. +41 58 459 50 26
Haben Sie Ihre WebLogic Umgebung im Griff