Embed Size (px)
Citation preview
Impact of Contralateral Carotid or Vertebral Artery
Occlusion in Patients Undergoing CEA or CAS
Young-Wook Kim, DI Kim, YJ Park, GH Kim, KM Kim, GH Lee
Vascular Surgery, Neurology, Samsung Medical Center, Sungkyunkwan
University School of Medicine, Seoul, Korea, [email protected]

Disclosure
• Financially nothing to disclosure
• To be published in J Vasc Surg
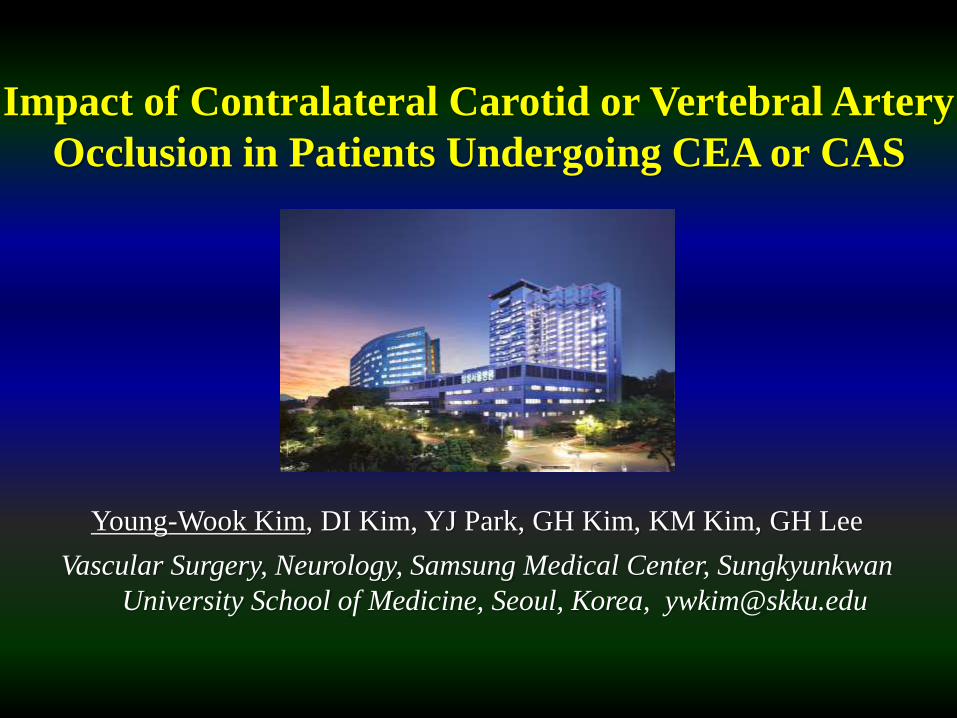
Updated SVS Guidelines for
Management of Extra-cranial Carotid Disease
CEA is recommended as the 1st-line treatment
• symptomatic carotid stenosis of 50%-99%
• asymptomatic carotid stenosis of 60%-99%.
(perioperative risk of stroke and death < 3%)
CAS is recommended
• symptomatic carotid stenosis of 50%-99%
at risk for CEA
Medical treatment
• asymptomatic patients at high risk for intervention
or with short (< 3 years) life expectancy
J Vasc Surg Sep. 2011
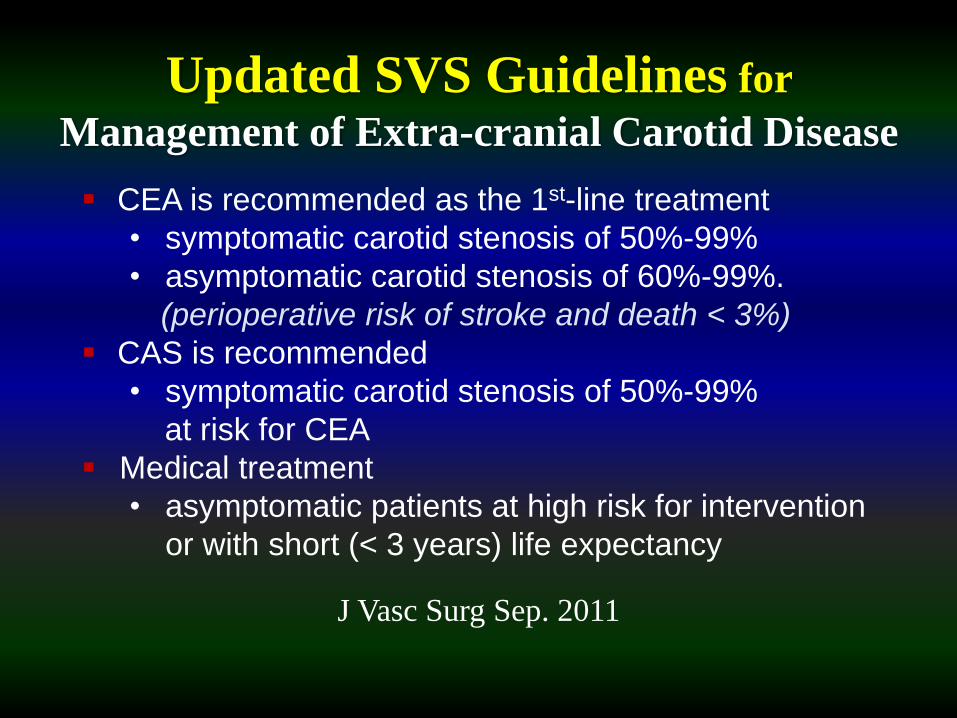
Contralateral Carotid Occlusion (CCO)
• Occurs in 6%-10% of patients undergoing
CEA
• Reduced collateral blood flow through the
circle of Willis: complete circle in 54%
CCO, contralateral carotid occlusion; CEA, carotid endarterectomy;
CAS, carotid artery stenting
• Increases flow amount and velocity of the
patent carotid or vertebral artery
• Often defined as a high risk factor for CEA
• Some authors advocated CAS rather than
CEA for patients with CCO
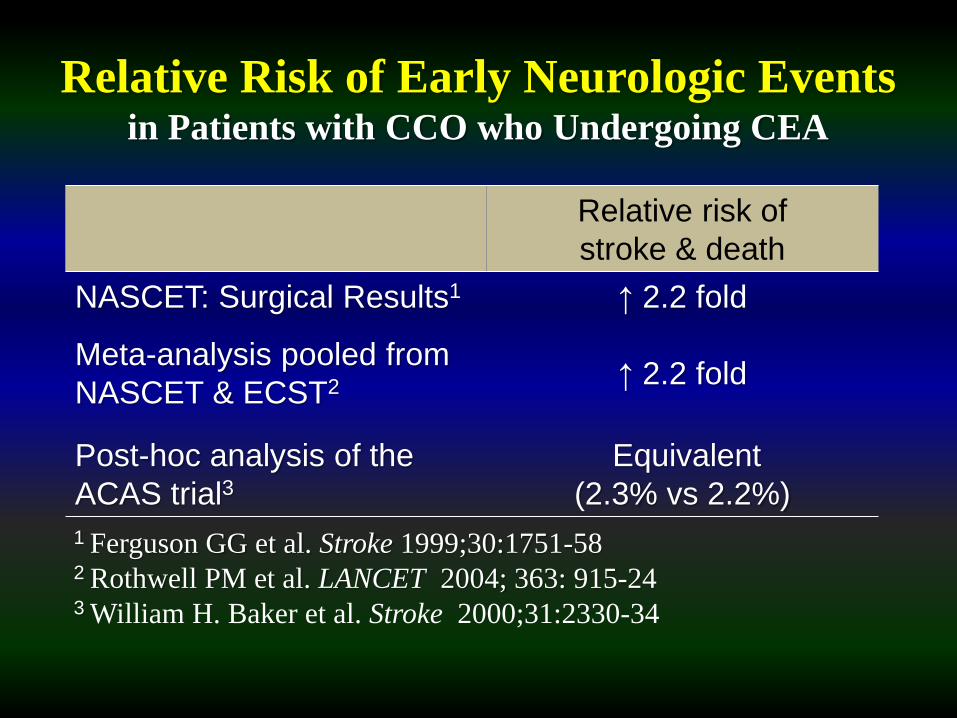
Relative Risk of Early Neurologic Eventsin Patients with CCO who Undergoing CEA
Relative risk of
stroke & death
NASCET: Surgical Results1
Meta-analysis pooled from
NASCET & ECST2
↑ 2.2 fold
↑ 2.2 fold
Post-hoc analysis of the
ACAS trial3Equivalent
(2.3% vs 2.2%)
1 Ferguson GG et al. Stroke 1999;30:1751-582 Rothwell PM et al. LANCET 2004; 363: 915-243 William H. Baker et al. Stroke 2000;31:2330-34
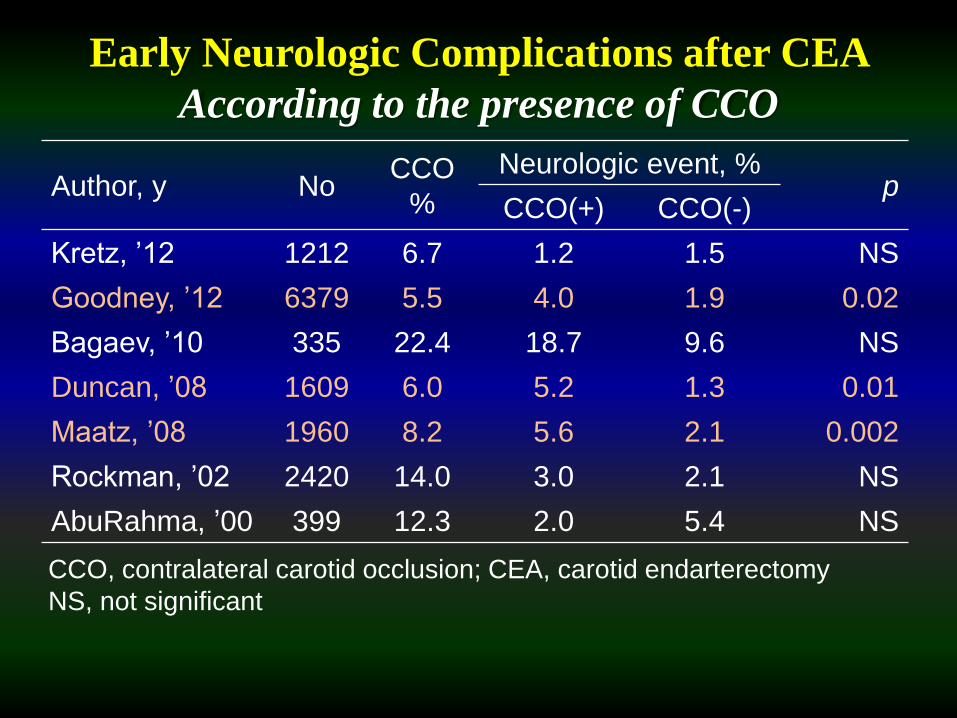
Author, y NoCCO
%
Neurologic event, %p
CCO(+) CCO(-)
Kretz, ’12 1212 6.7 1.2 1.5 NS
Goodney, ’12 6379 5.5 4.0 1.9 0.02
Bagaev, ’10 335 22.4 18.7 9.6 NS
Duncan, ’08 1609 6.0 5.2 1.3 0.01
Maatz, ’08 1960 8.2 5.6 2.1 0.002
Rockman, ’02 2420 14.0 3.0 2.1 NS
AbuRahma, ’00 399 12.3 2.0 5.4 NS
Early Neurologic Complications after CEA
According to the presence of CCO
CCO, contralateral carotid occlusion; CEA, carotid endarterectomy
NS, not significant
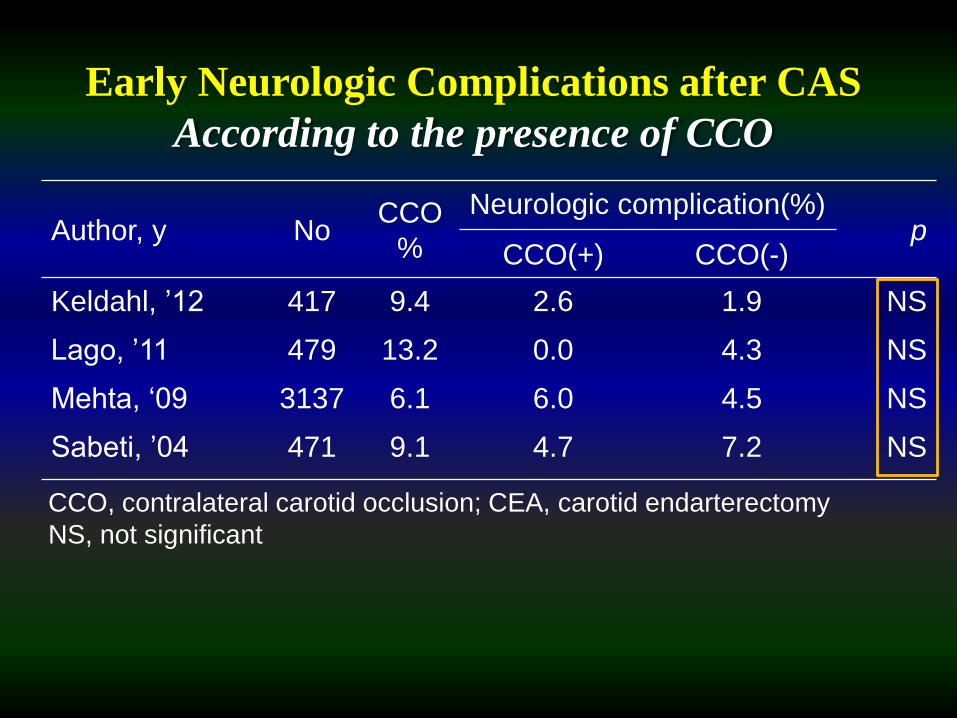
Early Neurologic Complications after CAS
According to the presence of CCO
Author, y NoCCO
%
Neurologic complication(%)p
CCO(+) CCO(-)
Keldahl, ’12 417 9.4 2.6 1.9 NS
Lago, ’11 479 13.2 0.0 4.3 NS
Mehta, ‘09 3137 6.1 6.0 4.5 NS
Sabeti, ’04 471 9.1 4.7 7.2 NS
CCO, contralateral carotid occlusion; CEA, carotid endarterectomy
NS, not significant
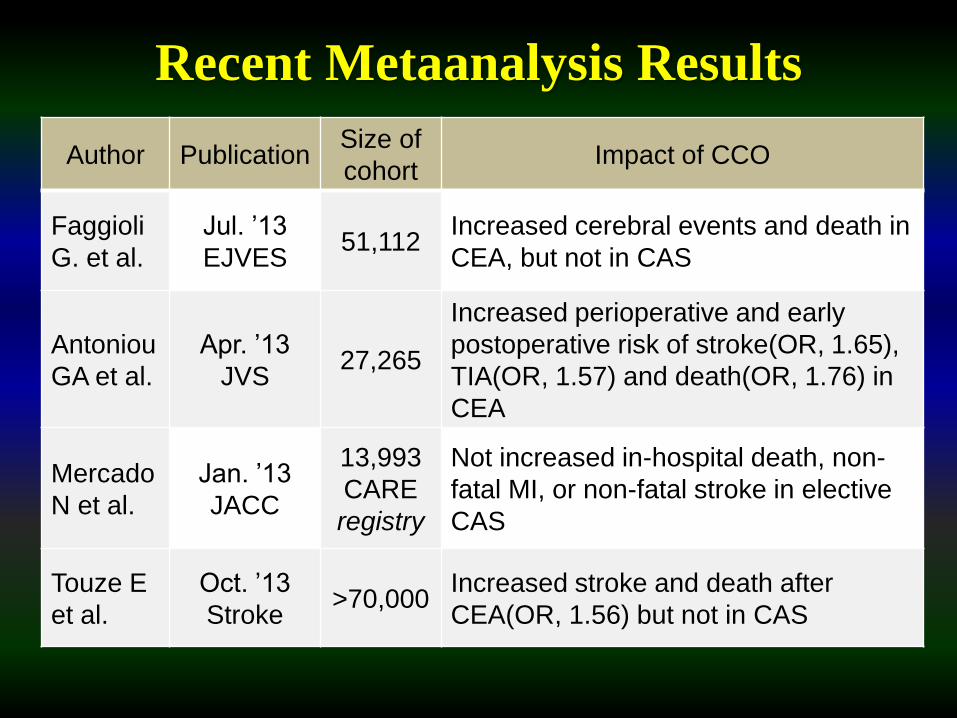
Recent Metaanalysis Results
Author PublicationSize of
cohortImpact of CCO
Faggioli
G. et al.
Jul. ’13
EJVES51,112
Increased cerebral events and death in
CEA, but not in CAS
Antoniou
GA et al.
Apr. ’13
JVS27,265
Increased perioperative and early
postoperative risk of stroke(OR, 1.65),
TIA(OR, 1.57) and death(OR, 1.76) in
CEA
Mercado
N et al.
Jan. ’13
JACC
13,993
CARE
registry
Not increased in-hospital death, non-
fatal MI, or non-fatal stroke in elective
CAS
Touze E
et al.
Oct. ’13
Stroke>70,000
Increased stroke and death after
CEA(OR, 1.56) but not in CAS
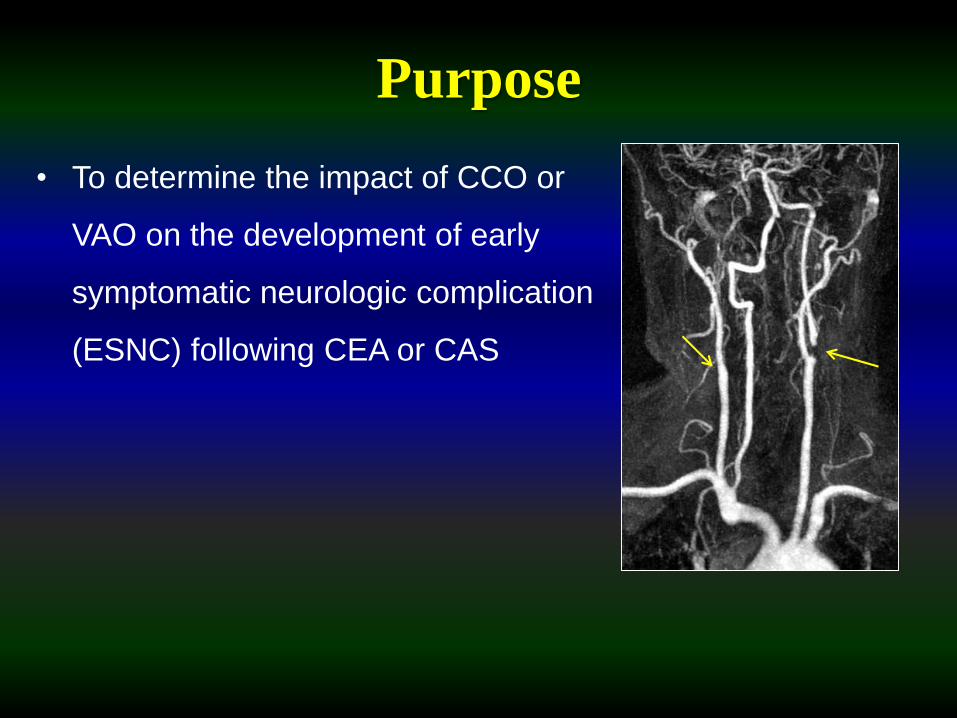
Purpose
• To determine the impact of CCO or
VAO on the development of early
symptomatic neurologic complication
(ESNC) following CEA or CAS
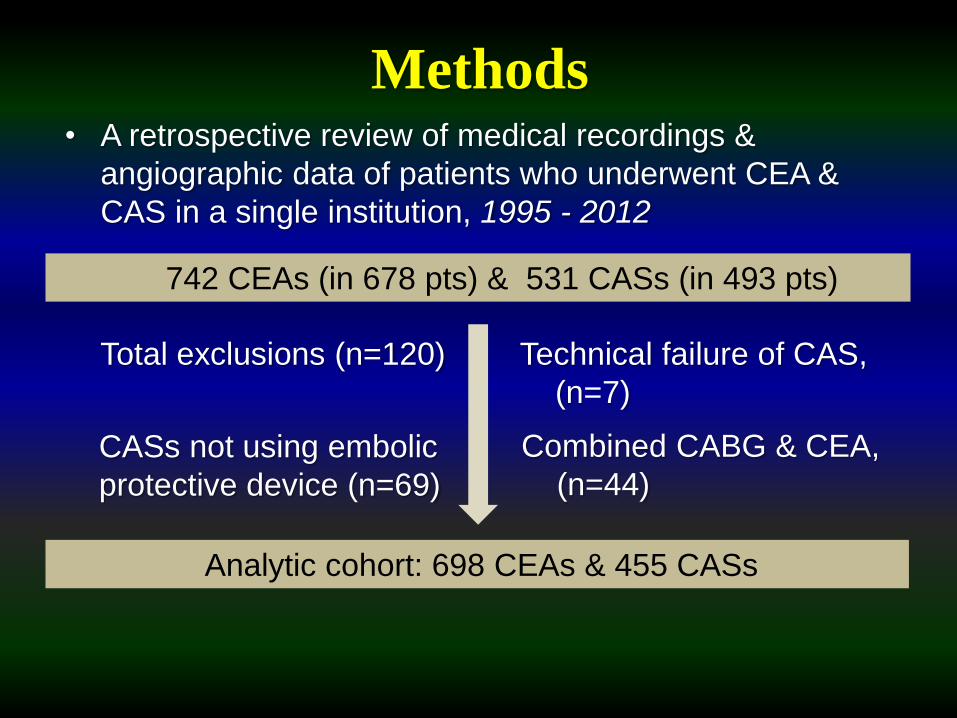
742 CEAs (in 678 pts) & 531 CASs (in 493 pts)
Total exclusions (n=120)
Analytic cohort: 698 CEAs & 455 CASs
CASs not using embolic
protective device (n=69)
Technical failure of CAS,
(n=7)
• A retrospective review of medical recordings &
angiographic data of patients who underwent CEA &
CAS in a single institution, 1995 - 2012
Methods
Combined CABG & CEA,
(n=44)
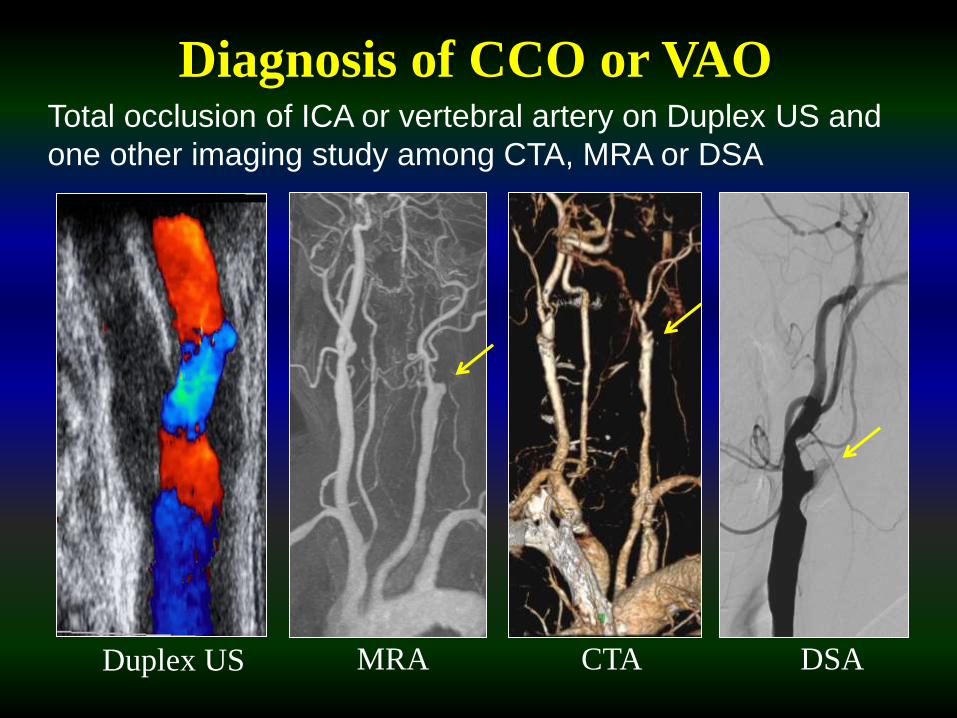
Diagnosis of CCO or VAO
MRA DSADuplex US CTA
Total occlusion of ICA or vertebral artery on Duplex US and
one other imaging study among CTA, MRA or DSA
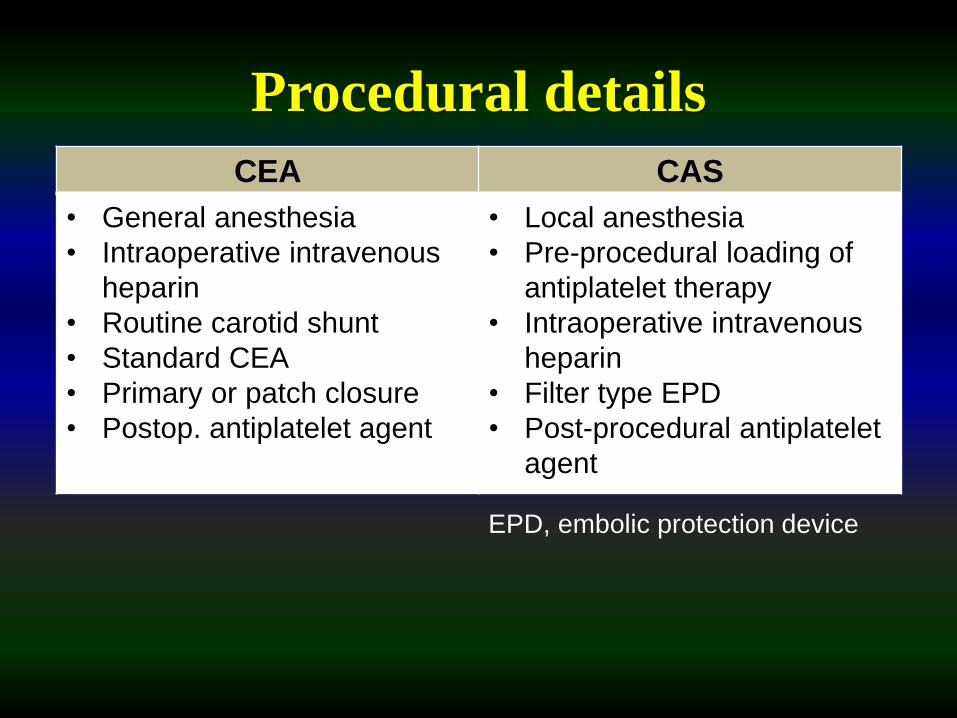
Procedural details
CEA CAS
• General anesthesia
• Intraoperative intravenous
heparin
• Routine carotid shunt
• Standard CEA
• Primary or patch closure
• Postop. antiplatelet agent
• Local anesthesia
• Pre-procedural loading of
antiplatelet therapy
• Intraoperative intravenous
heparin
• Filter type EPD
• Post-procedural antiplatelet
agent
EPD, embolic protection device
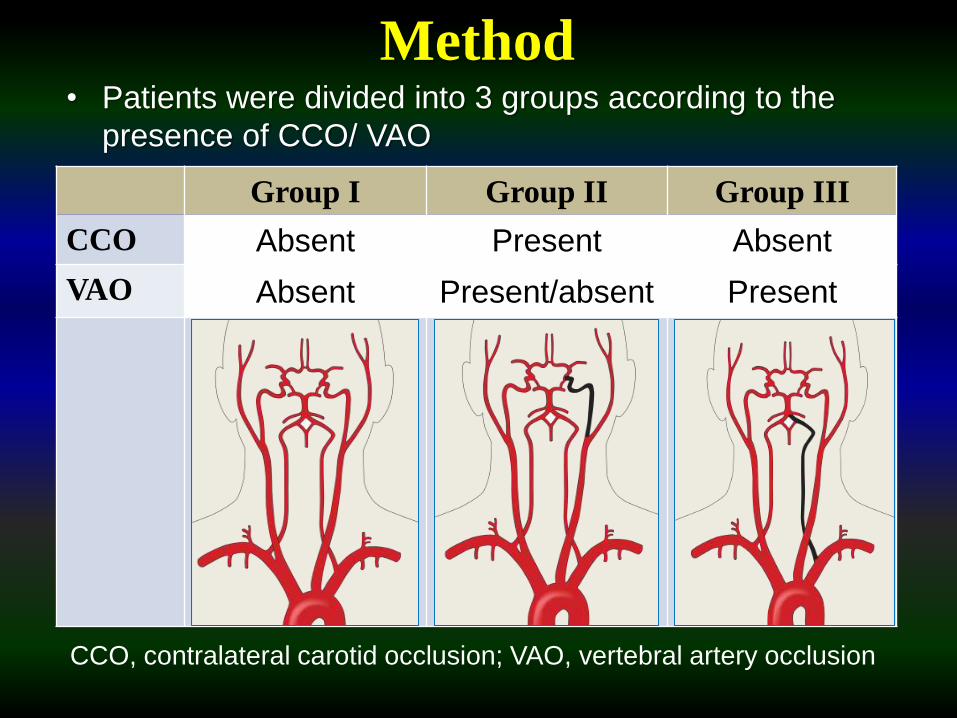
Method• Patients were divided into 3 groups according to the
presence of CCO/ VAO
Group I Group II Group III
CCO Absent Present Absent
VAO Absent Present/absent Present
CCO, contralateral carotid occlusion; VAO, vertebral artery occlusion
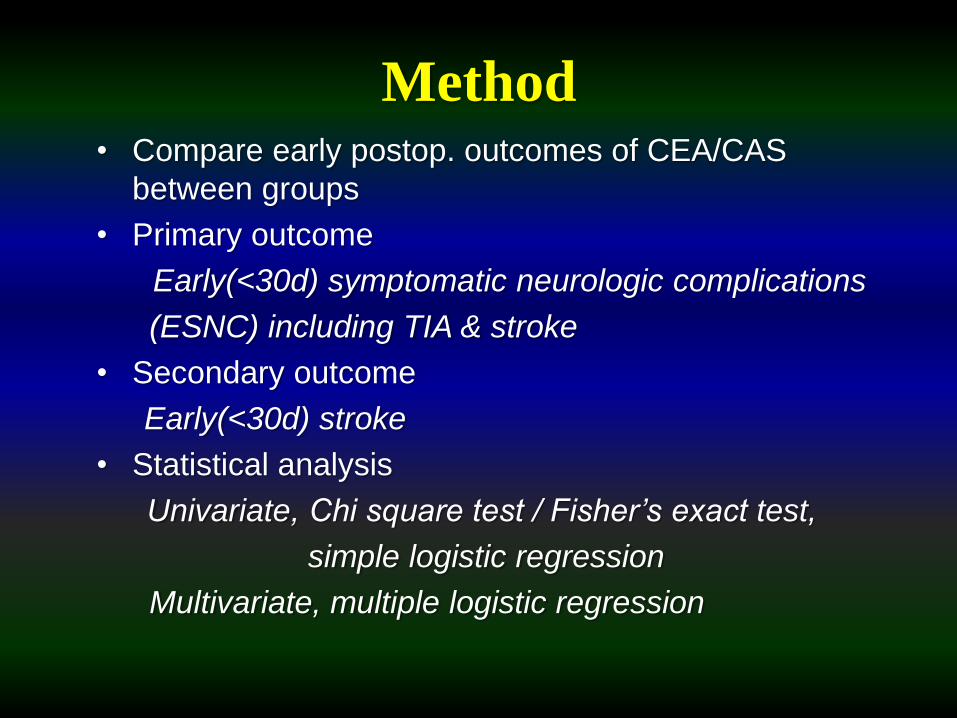
Method• Compare early postop. outcomes of CEA/CAS
between groups
• Primary outcome
Early(<30d) symptomatic neurologic complications
(ESNC) including TIA & stroke
• Secondary outcome
Early(<30d) stroke
• Statistical analysis
Univariate, Chi square test / Fisher’s exact test,
simple logistic regression
Multivariate, multiple logistic regression
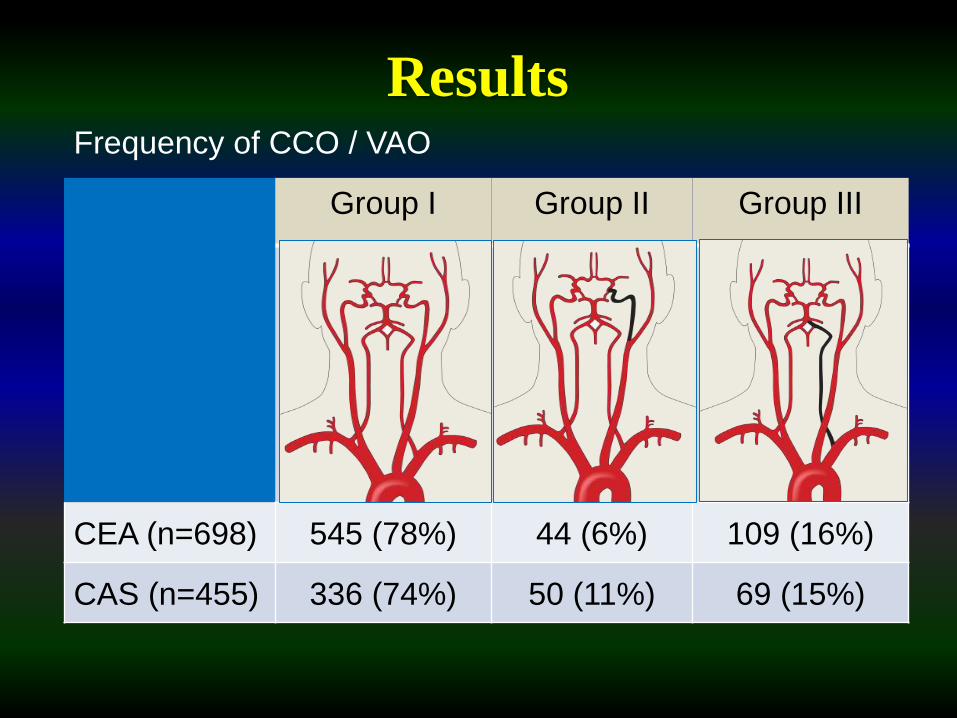
Frequency of CCO / VAO
Results
Group I Group II Group III
CEA (n=698) 545 (78%) 44 (6%) 109 (16%)
CAS (n=455) 336 (74%) 50 (11%) 69 (15%)
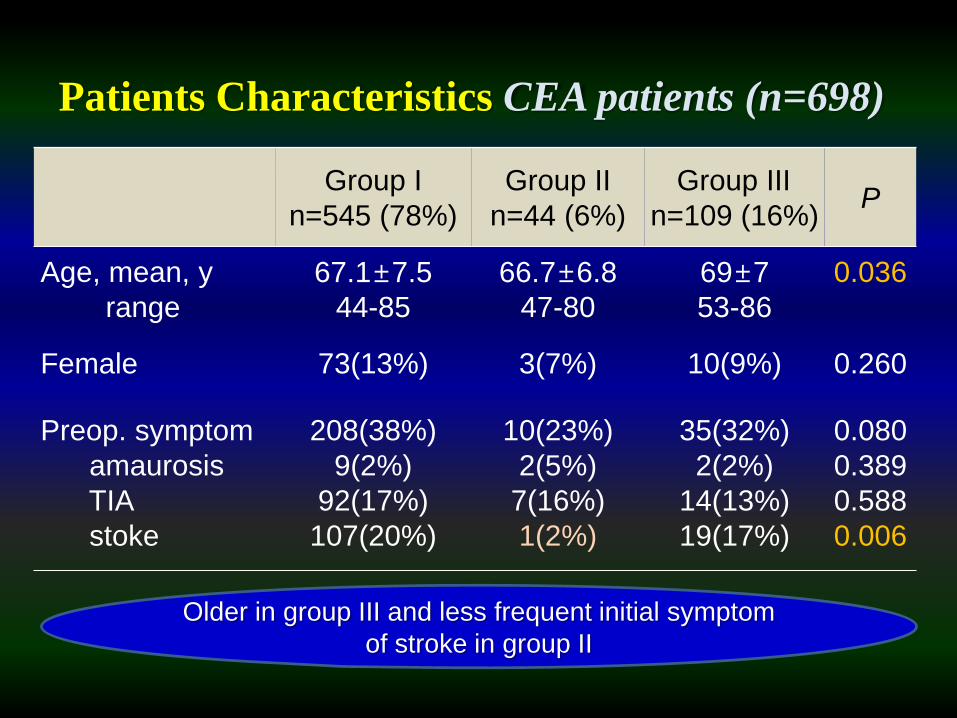
Patients Characteristics CEA patients (n=698)
Group I
n=545 (78%)
Group II
n=44 (6%)
Group III
n=109 (16%)P
Age, mean, y
range
67.1±7.5
44-85
66.7±6.8
47-80
69±7
53-86
0.036
Female 73(13%) 3(7%) 10(9%) 0.260
Preop. symptom
amaurosis
TIA
stoke
208(38%)
9(2%)
92(17%)
107(20%)
10(23%)
2(5%)
7(16%)
1(2%)
35(32%)
2(2%)
14(13%)
19(17%)
0.080
0.389
0.588
0.006
Older in group III and less frequent initial symptom
of stroke in group II
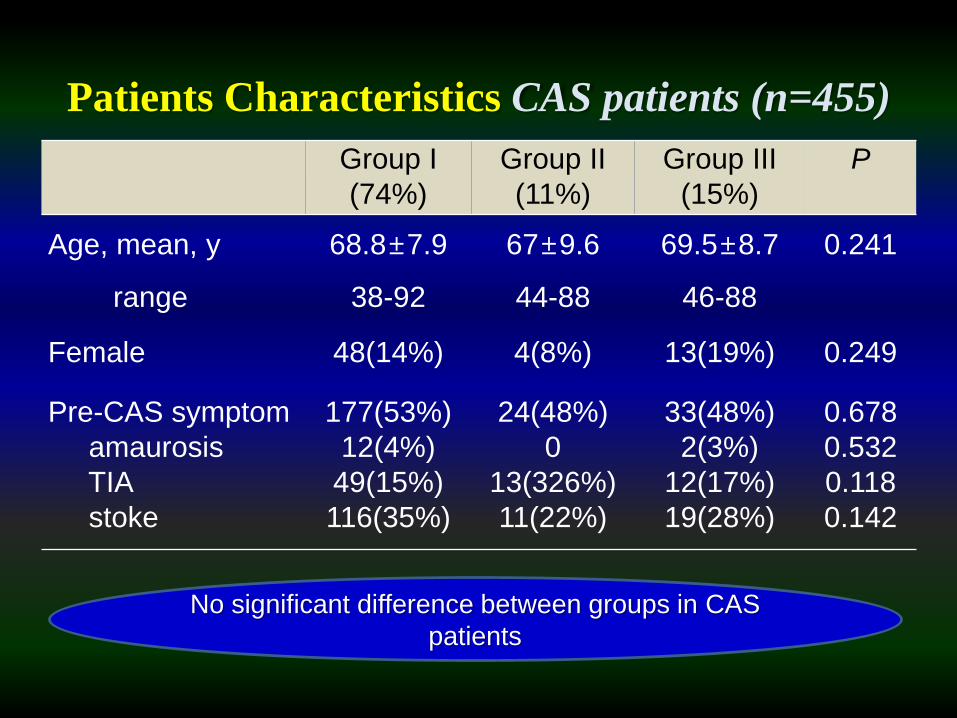
Patients Characteristics CAS patients (n=455)
Group I
(74%)
Group II
(11%)
Group III
(15%)
P
Age, mean, y
range
68.8±7.9
38-92
67±9.6
44-88
69.5±8.7
46-88
0.241
Female 48(14%) 4(8%) 13(19%) 0.249
Pre-CAS symptom
amaurosis
TIA
stoke
177(53%)
12(4%)
49(15%)
116(35%)
24(48%)
0
13(326%)
11(22%)
33(48%)
2(3%)
12(17%)
19(28%)
0.678
0.532
0.118
0.142
No significant difference between groups in CAS
patients
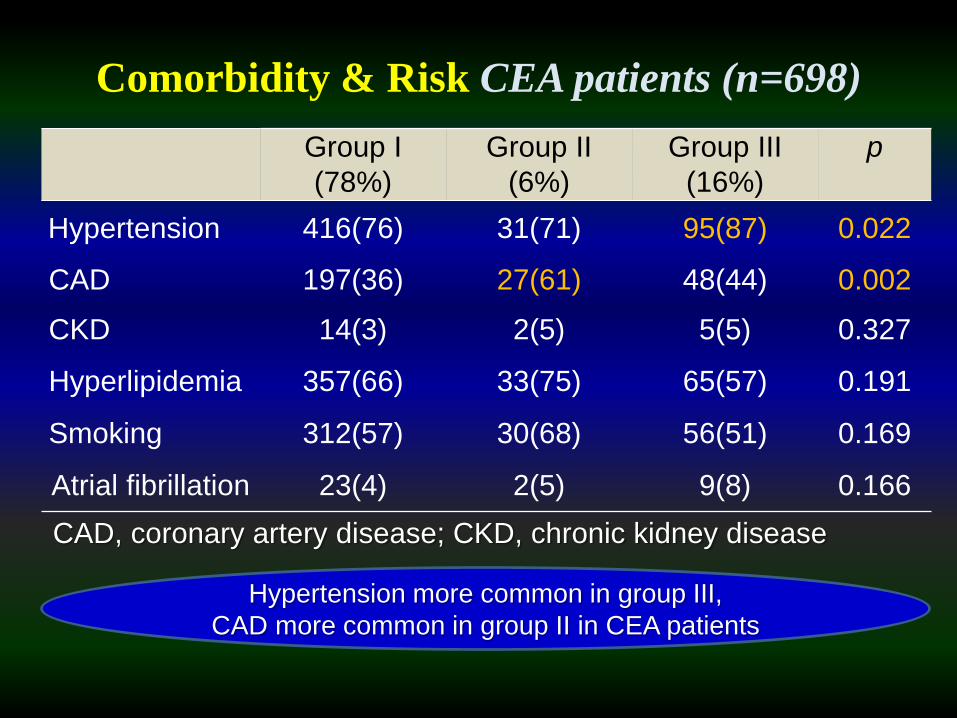
Comorbidity & Risk CEA patients (n=698)
Group I
(78%)
Group II
(6%)
Group III
(16%)
p
Hypertension 416(76) 31(71) 95(87) 0.022
CAD 197(36) 27(61) 48(44) 0.002
CKD 14(3) 2(5) 5(5) 0.327
Hyperlipidemia 357(66) 33(75) 65(57) 0.191
Smoking 312(57) 30(68) 56(51) 0.169
Atrial fibrillation 23(4) 2(5) 9(8) 0.166
CAD, coronary artery disease; CKD, chronic kidney disease
Hypertension more common in group III,
CAD more common in group II in CEA patients
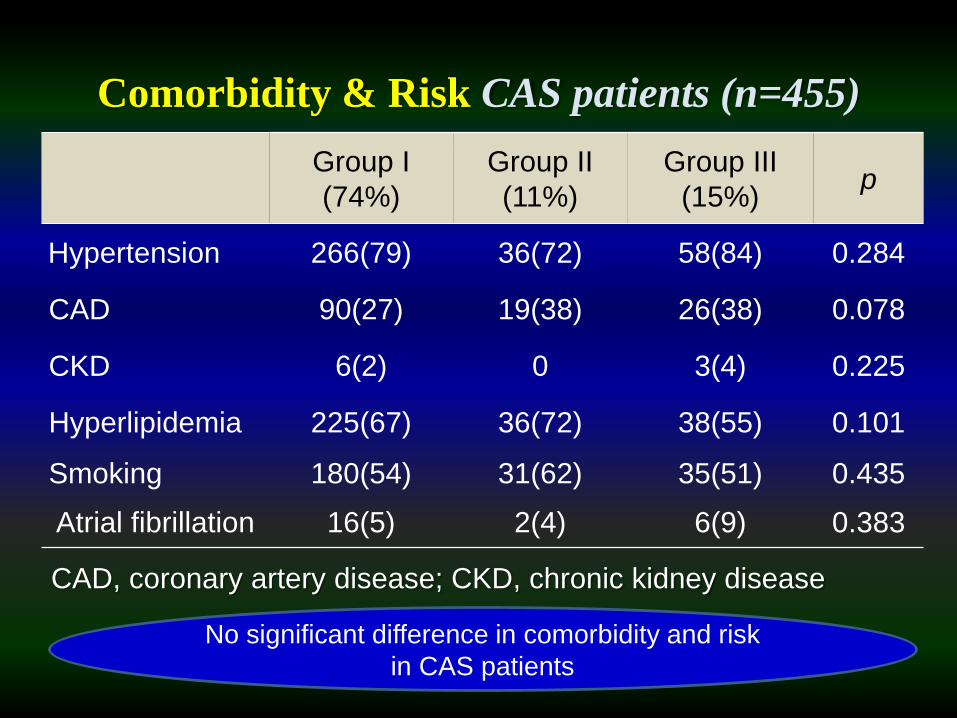
Comorbidity & Risk CAS patients (n=455)
Group I
(74%)
Group II
(11%)
Group III
(15%)p
Hypertension 266(79) 36(72) 58(84) 0.284
CAD 90(27) 19(38) 26(38) 0.078
CKD 6(2) 0 3(4) 0.225
Hyperlipidemia 225(67) 36(72) 38(55) 0.101
Smoking 180(54) 31(62) 35(51) 0.435
Atrial fibrillation 16(5) 2(4) 6(9) 0.383
CAD, coronary artery disease; CKD, chronic kidney disease
No significant difference in comorbidity and risk
in CAS patients
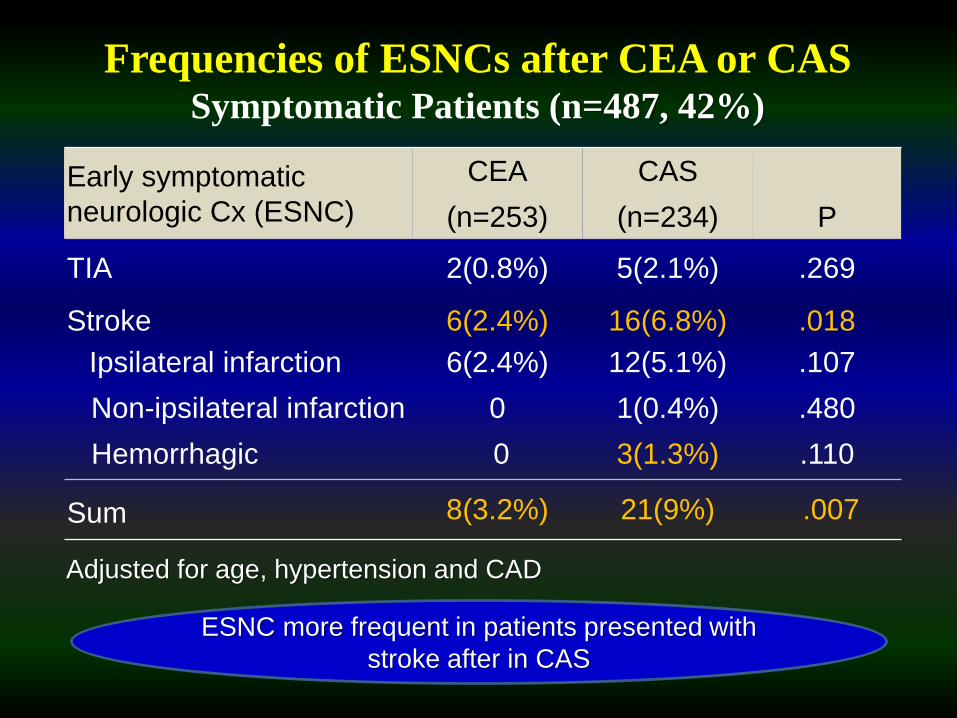
Early symptomatic
neurologic Cx (ESNC)
CEA
(n=253)
CAS
(n=234) P
TIA 2(0.8%) 5(2.1%) .269
Stroke 6(2.4%) 16(6.8%) .018
Ipsilateral infarction
Non-ipsilateral infarction
Hemorrhagic
6(2.4%)
0
0
12(5.1%)
1(0.4%)
3(1.3%)
.107
.480
.110
Sum 8(3.2%) 21(9%) .007
Frequencies of ESNCs after CEA or CAS Symptomatic Patients (n=487, 42%)
Adjusted for age, hypertension and CAD
ESNC more frequent in patients presented with
stroke after in CAS
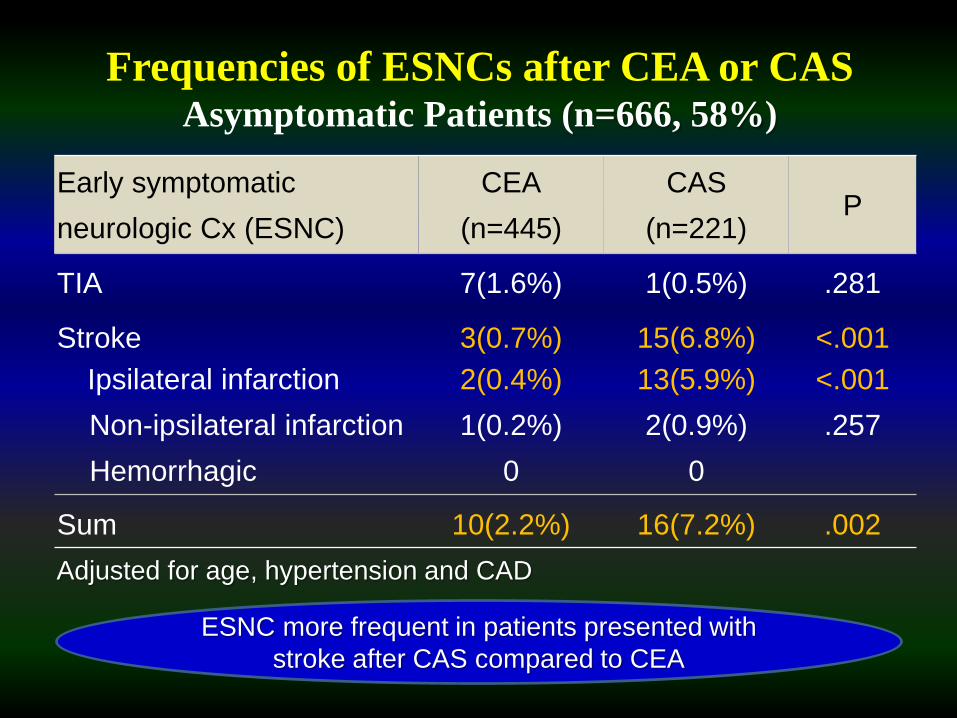
Early symptomatic
neurologic Cx (ESNC)
CEA
(n=445)
CAS
(n=221)P
TIA 7(1.6%) 1(0.5%) .281
Stroke 3(0.7%) 15(6.8%) <.001
Ipsilateral infarction
Non-ipsilateral infarction
Hemorrhagic
2(0.4%)
1(0.2%)
0
13(5.9%)
2(0.9%)
0
<.001
.257
Sum 10(2.2%) 16(7.2%) .002
Frequencies of ESNCs after CEA or CAS Asymptomatic Patients (n=666, 58%)
Adjusted for age, hypertension and CAD
ESNC more frequent in patients presented with
stroke after CAS compared to CEA
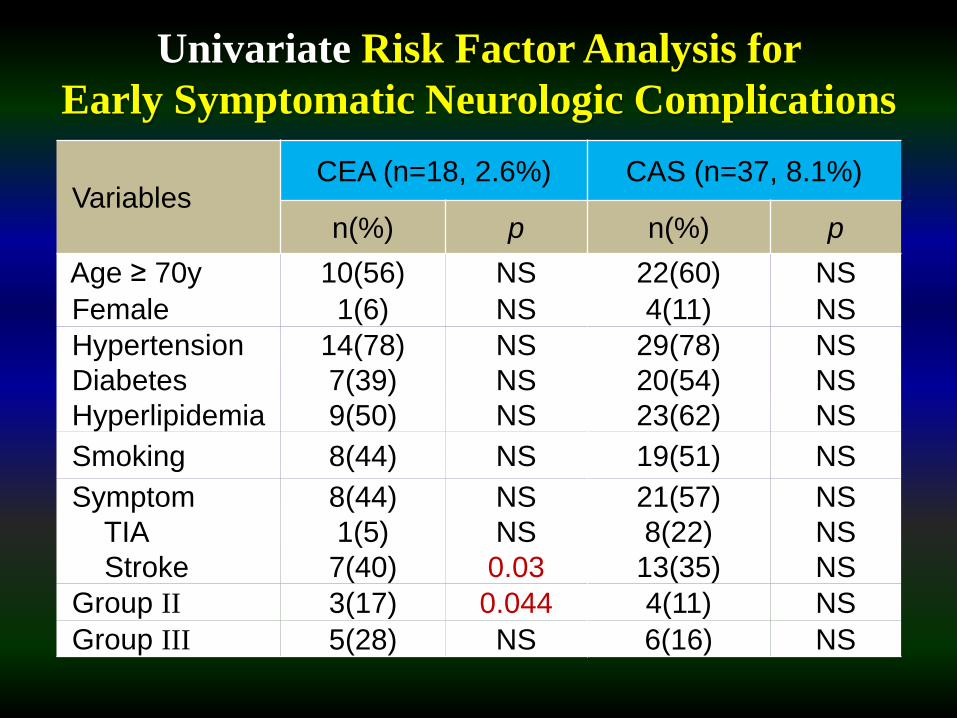
Univariate Risk Factor Analysis for
Early Symptomatic Neurologic Complications
VariablesCEA (n=18, 2.6%) CAS (n=37, 8.1%)
n(%) p n(%) p
Age ≥ 70y 10(56) NS 22(60) NS
Female 1(6) NS 4(11) NS
Hypertension
Diabetes
Hyperlipidemia
14(78)
7(39)
9(50)
NS
NS
NS
29(78)
20(54)
23(62)
NS
NS
NS
Smoking 8(44) NS 19(51) NS
Symptom
TIA
Stroke
8(44)
1(5)
7(40)
NS
NS
0.03
21(57)
8(22)
13(35)
NS
NS
NS
Group II 3(17) 0.044 4(11) NS
Group III 5(28) NS 6(16) NS
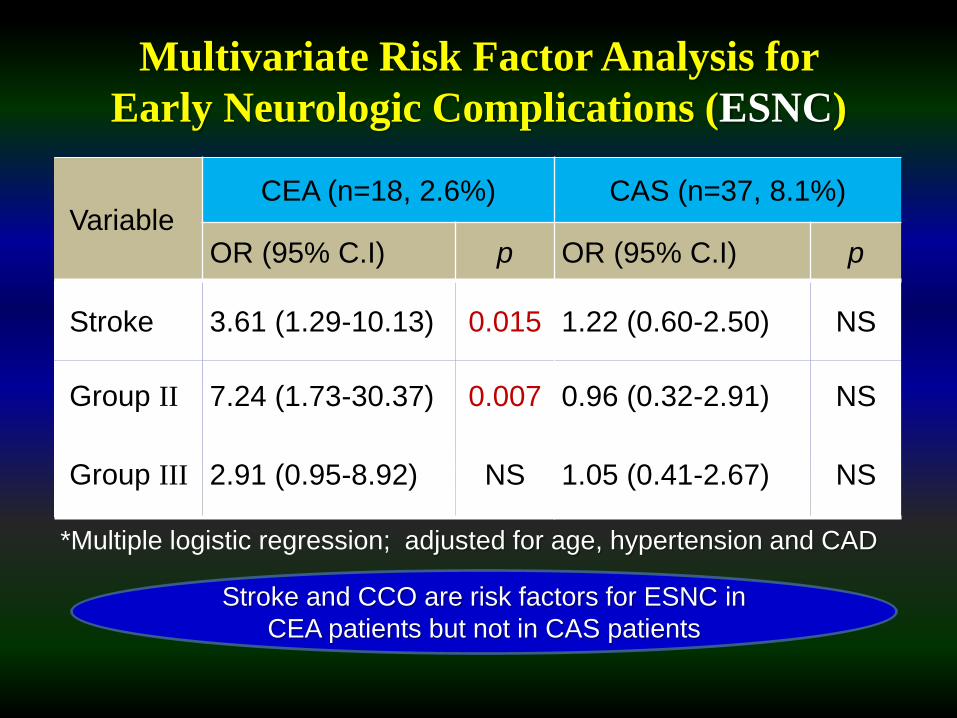
Multivariate Risk Factor Analysis for
Early Neurologic Complications (ESNC)
VariableCEA (n=18, 2.6%) CAS (n=37, 8.1%)
OR (95% C.I) p OR (95% C.I) p
Stroke 3.61 (1.29-10.13) 0.015 1.22 (0.60-2.50) NS
Group II 7.24 (1.73-30.37) 0.007 0.96 (0.32-2.91) NS
Group III 2.91 (0.95-8.92) NS 1.05 (0.41-2.67) NS
*Multiple logistic regression; adjusted for age, hypertension and CAD
Stroke and CCO are risk factors for ESNC in
CEA patients but not in CAS patients
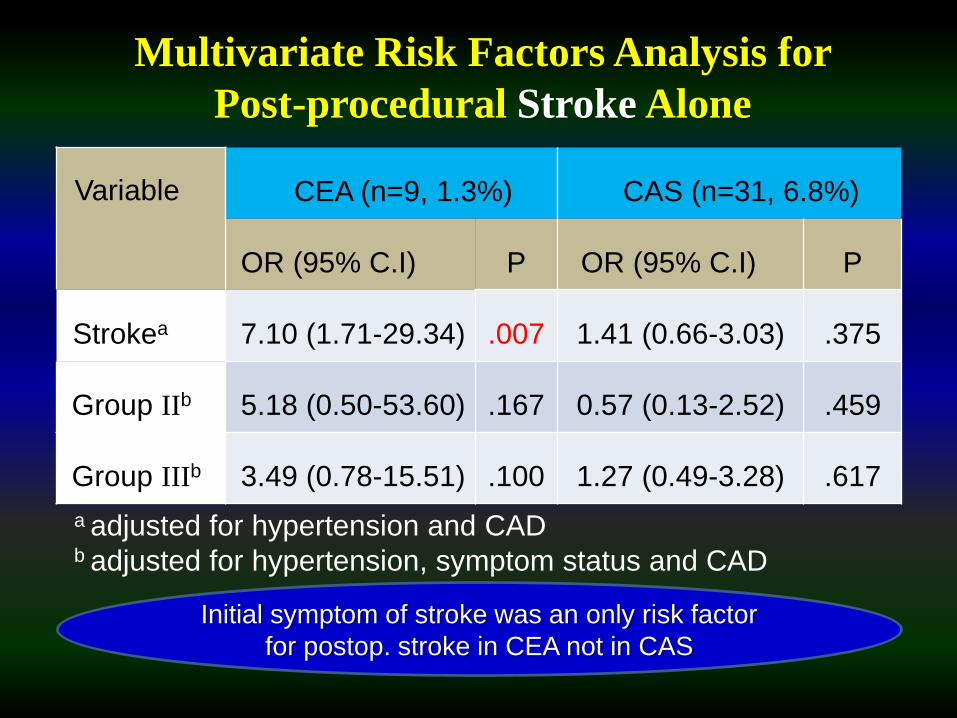
Variable CEA (n=9, 1.3%) CAS (n=31, 6.8%)
OR (95% C.I) P OR (95% C.I) P
Strokea 7.10 (1.71-29.34) .007 1.41 (0.66-3.03) .375
Group IIb 5.18 (0.50-53.60) .167 0.57 (0.13-2.52) .459
Group IIIb 3.49 (0.78-15.51) .100 1.27 (0.49-3.28) .617
Multivariate Risk Factors Analysis for
Post-procedural Stroke Alone
a adjusted for hypertension and CAD b adjusted for hypertension, symptom status and CAD
Initial symptom of stroke was an only risk factor
for postop. stroke in CEA not in CAS
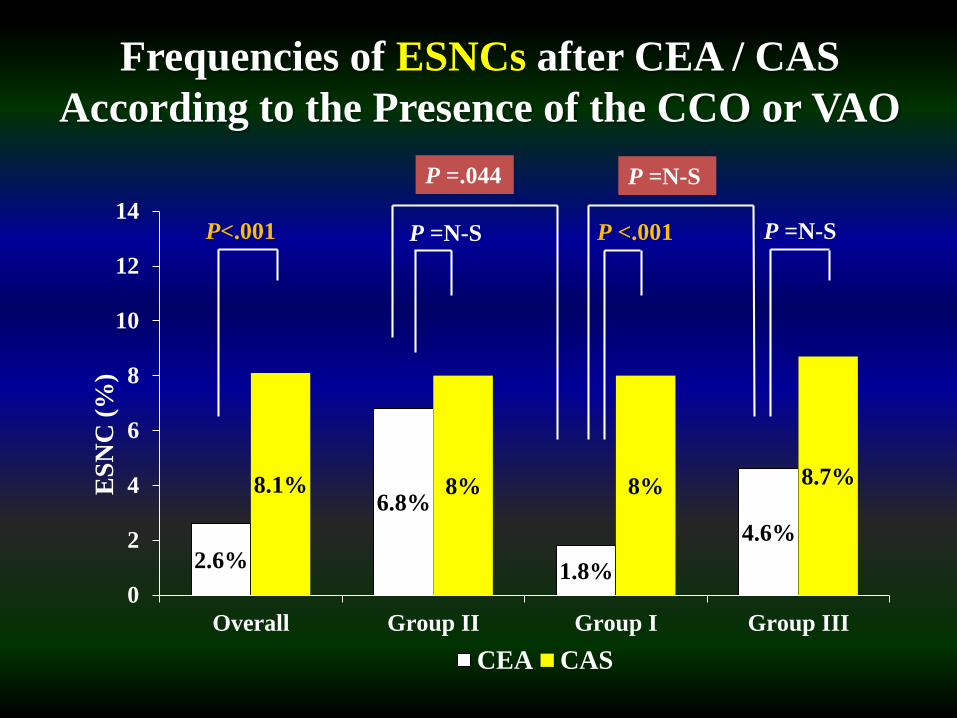
2.6%
6.8%
1.8%
4.6%
8.1% 8% 8% 8.7%
0
2
4
6
8
10
12
14
Overall Group II Group I Group III
ES
NC
(%
)
CEA CAS
P<.001 P <.001 P =N-SP =N-S
Frequencies of ESNCs after CEA / CAS
According to the Presence of the CCO or VAO
P =.044 P =N-S
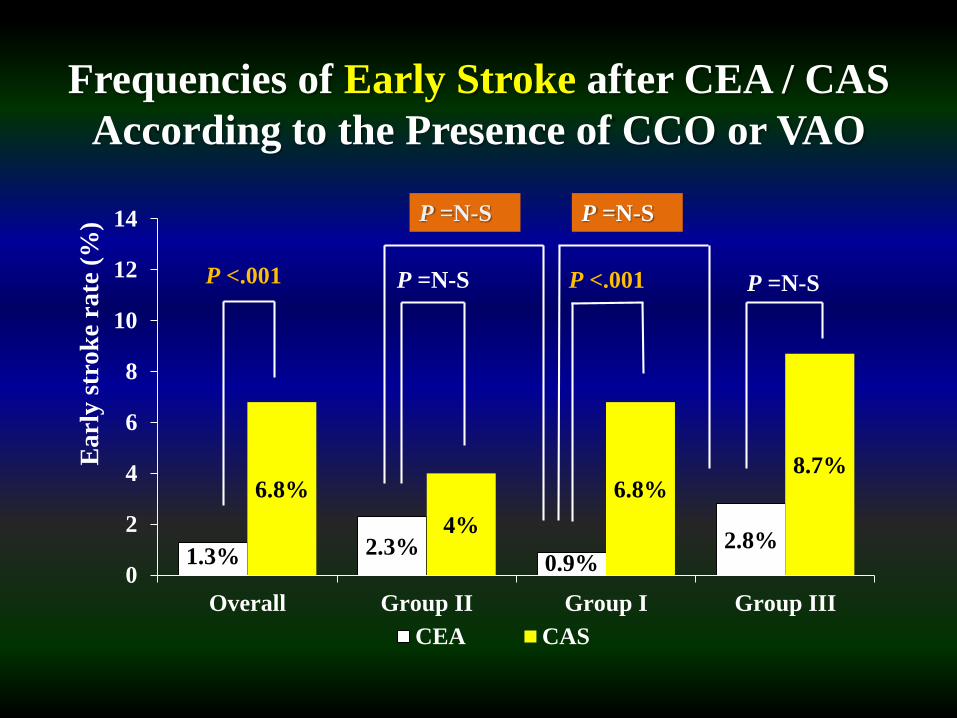
Frequencies of Early Stroke after CEA / CAS
According to the Presence of CCO or VAO
1.3% 2.3%0.9%
2.8%
6.8%
4%
6.8%8.7%
0
2
4
6
8
10
12
14
Overall Group II Group I Group III
Ea
rly
str
ok
e ra
te (
%)
CEA CAS
P <.001 P <.001P =N-S P =N-S
P =N-SP =N-S
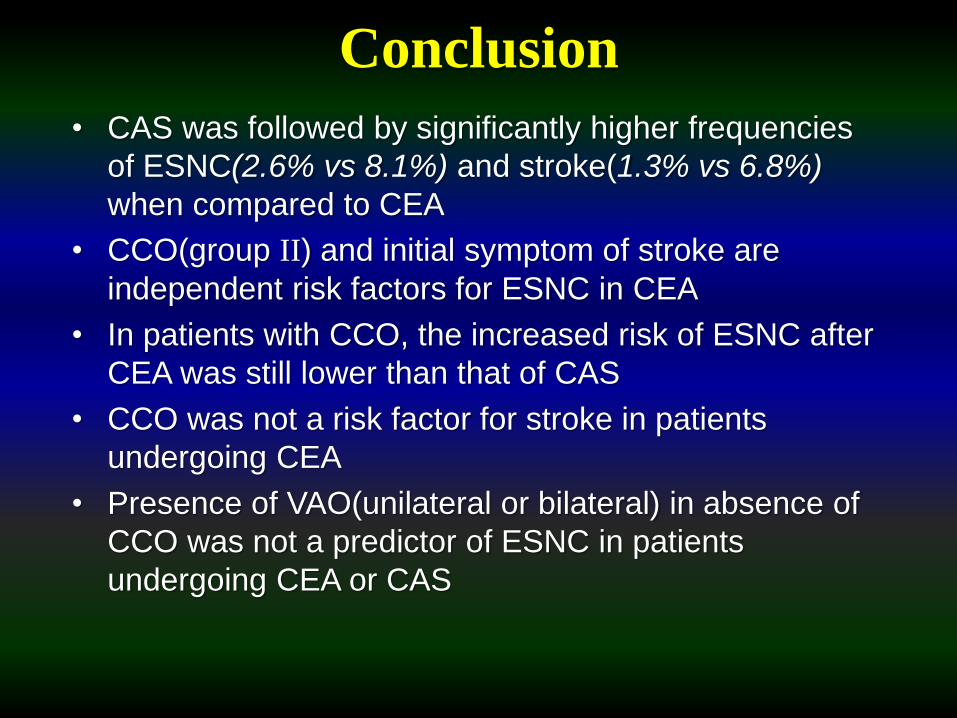
Conclusion
• CAS was followed by significantly higher frequencies
of ESNC(2.6% vs 8.1%) and stroke(1.3% vs 6.8%)
when compared to CEA
• CCO(group II) and initial symptom of stroke are
independent risk factors for ESNC in CEA
• In patients with CCO, the increased risk of ESNC after
CEA was still lower than that of CAS
• CCO was not a risk factor for stroke in patients
undergoing CEA
• Presence of VAO(unilateral or bilateral) in absence of
CCO was not a predictor of ESNC in patients
undergoing CEA or CAS

Thank you for your kind attention
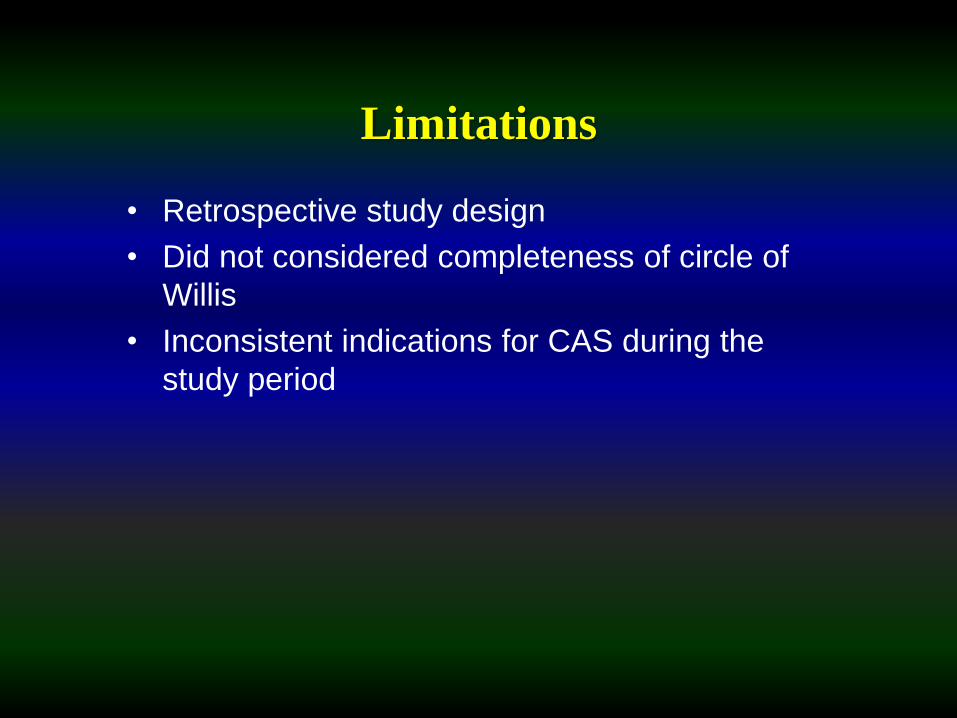
Limitations
• Retrospective study design
• Did not considered completeness of circle of
Willis
• Inconsistent indications for CAS during the
study period
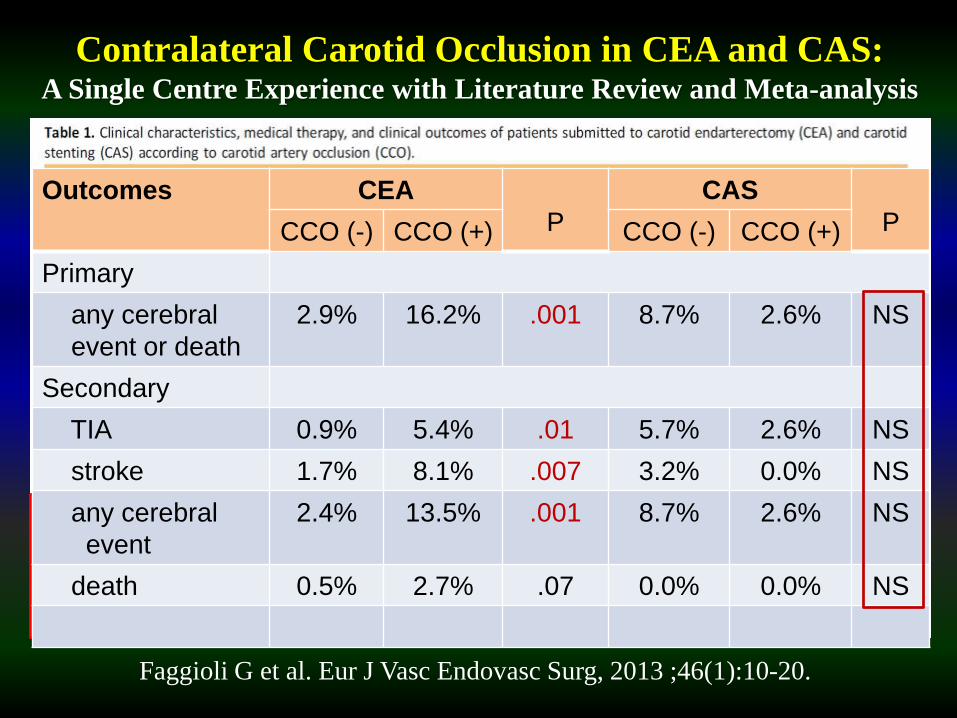
Contralateral Carotid Occlusion in CEA and CAS: A Single Centre Experience with Literature Review and Meta-analysis
Faggioli G et al. Eur J Vasc Endovasc Surg, 2013 ;46(1):10-20.
Outcomes CEA
P
CAS
PCCO (-) CCO (+) CCO (-) CCO (+)
Primary
any cerebral
event or death
2.9% 16.2% .001 8.7% 2.6% NS
Secondary
TIA 0.9% 5.4% .01 5.7% 2.6% NS
stroke 1.7% 8.1% .007 3.2% 0.0% NS
any cerebral
event
2.4% 13.5% .001 8.7% 2.6% NS
death 0.5% 2.7% .07 0.0% 0.0% NS
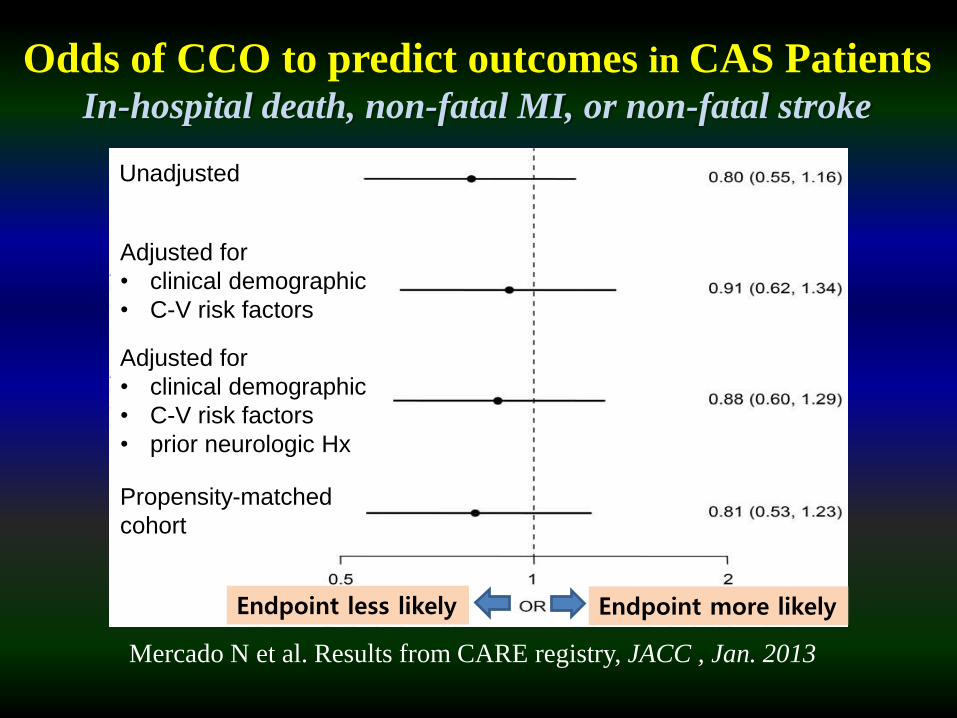
Odds of CCO to predict outcomes in CAS PatientsIn-hospital death, non-fatal MI, or non-fatal stroke
Endpoint less likely Endpoint more likely
Mercado N et al. Results from CARE registry, JACC , Jan. 2013
Propensity-matched
cohort
Adjusted for
• clinical demographic
• C-V risk factors
• prior neurologic Hx
Adjusted for
• clinical demographic
• C-V risk factors
Unadjusted
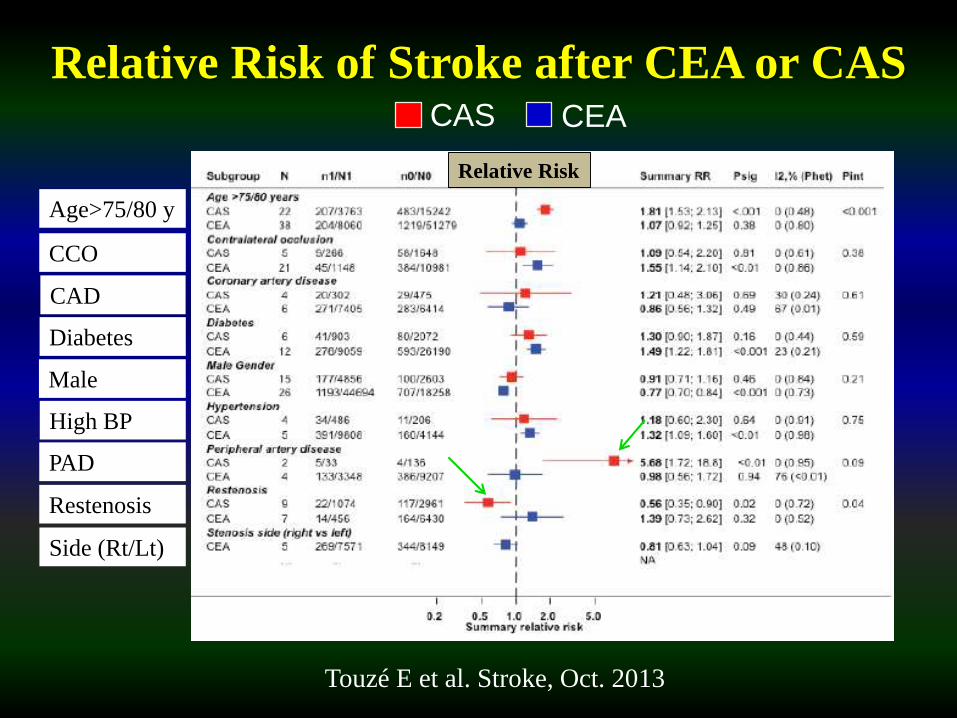
Relative Risk of Stroke after CEA or CAS
Touzé E et al. Stroke, Oct. 2013
Age>75/80 y
CCO
CAD
Diabetes
Male
High BP
Restenosis
PAD
Relative Risk
Side (Rt/Lt)
CAS CEA