Embed Size (px)
Citation preview
Yogi C. Agrawal, President Sequoia Scientific, Inc., Bellevue, Washington
HORIBA ‐ SEQUOIA JOINT WEBINAR
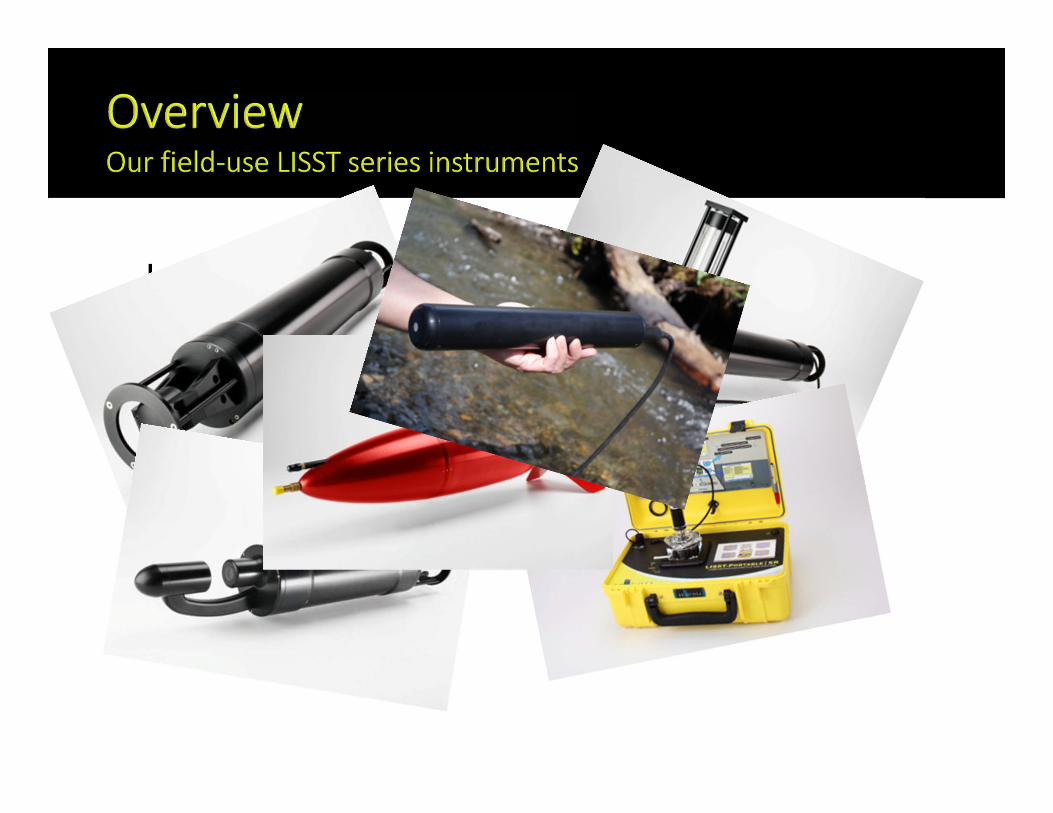
Sequoia Scientific, Inc. (Bellevue, WA) are makers of LISST‐series field instruments.
These are used in coasts, ports, harbors, oceans, rivers, and in industry.
[LISST is a trademark of Sequoia Scientific, Inc.]

Laser Diffraction
In‐line Holography
New: LISST‐ABS: 8MHz Acoustic Backscatter
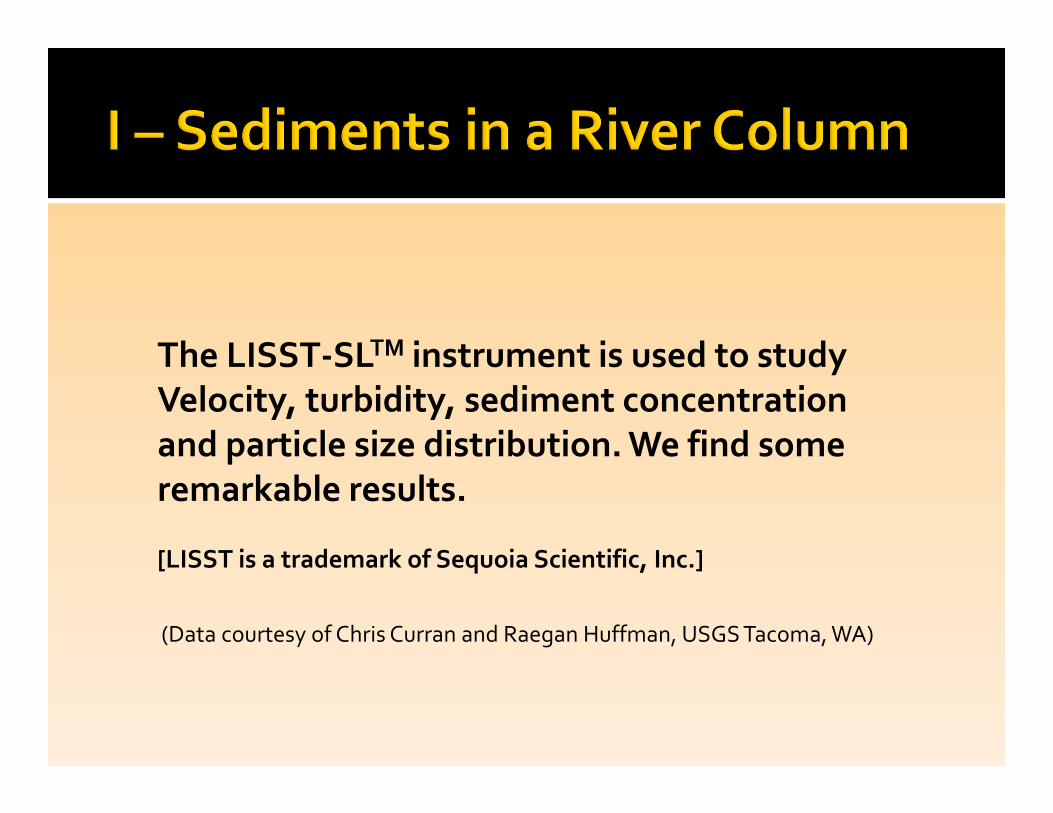
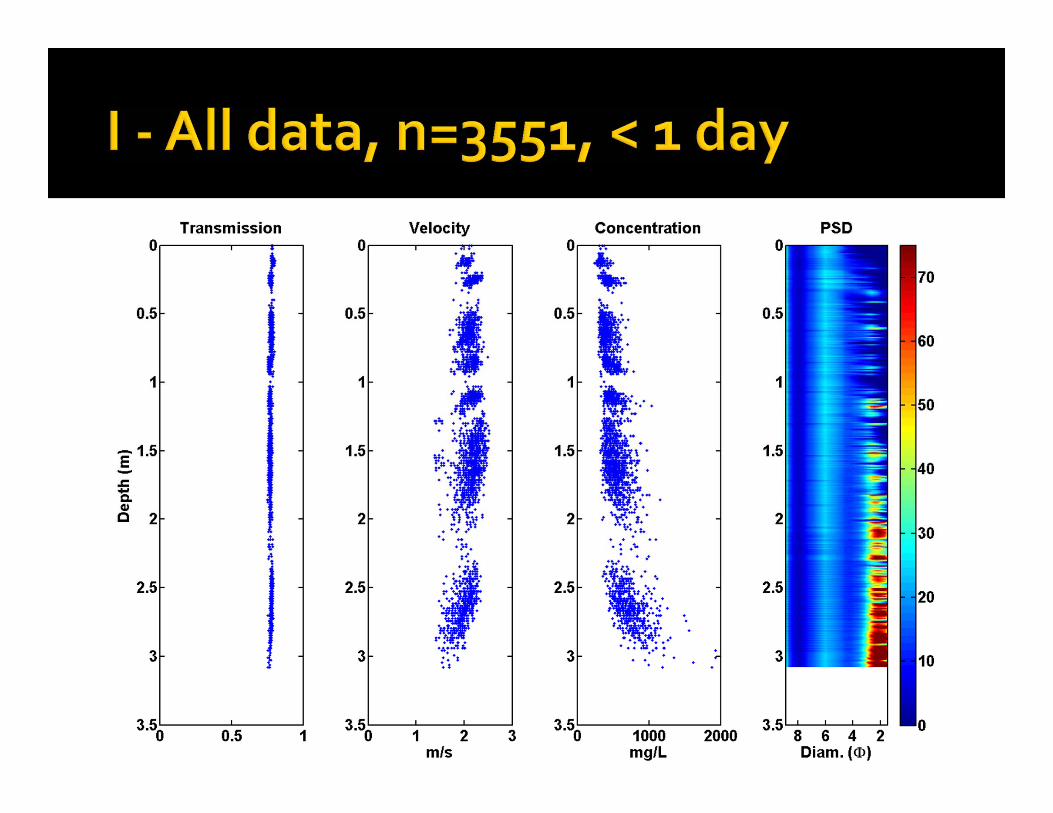
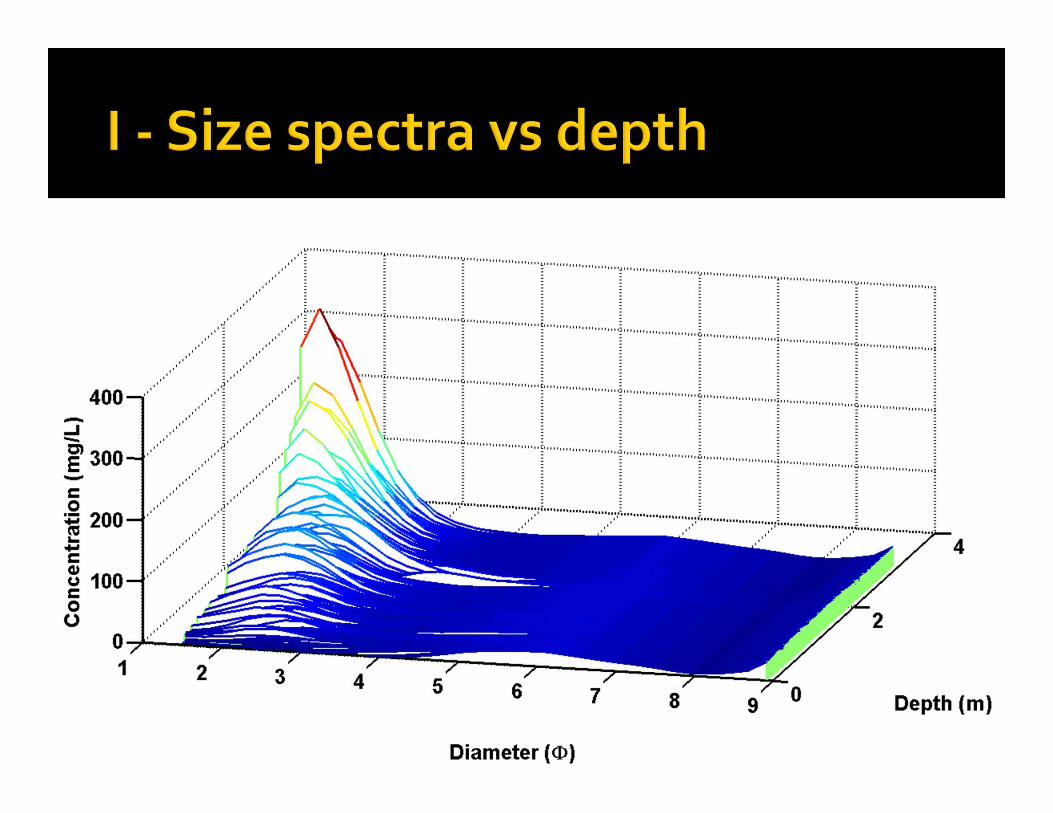
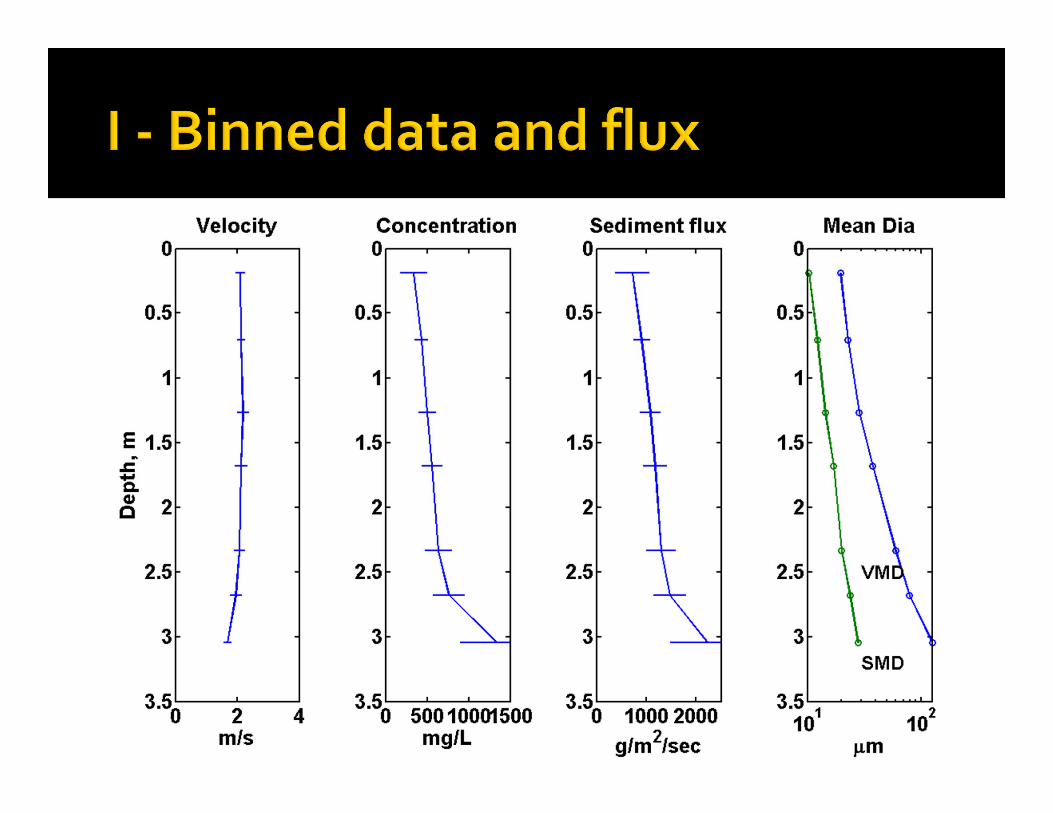
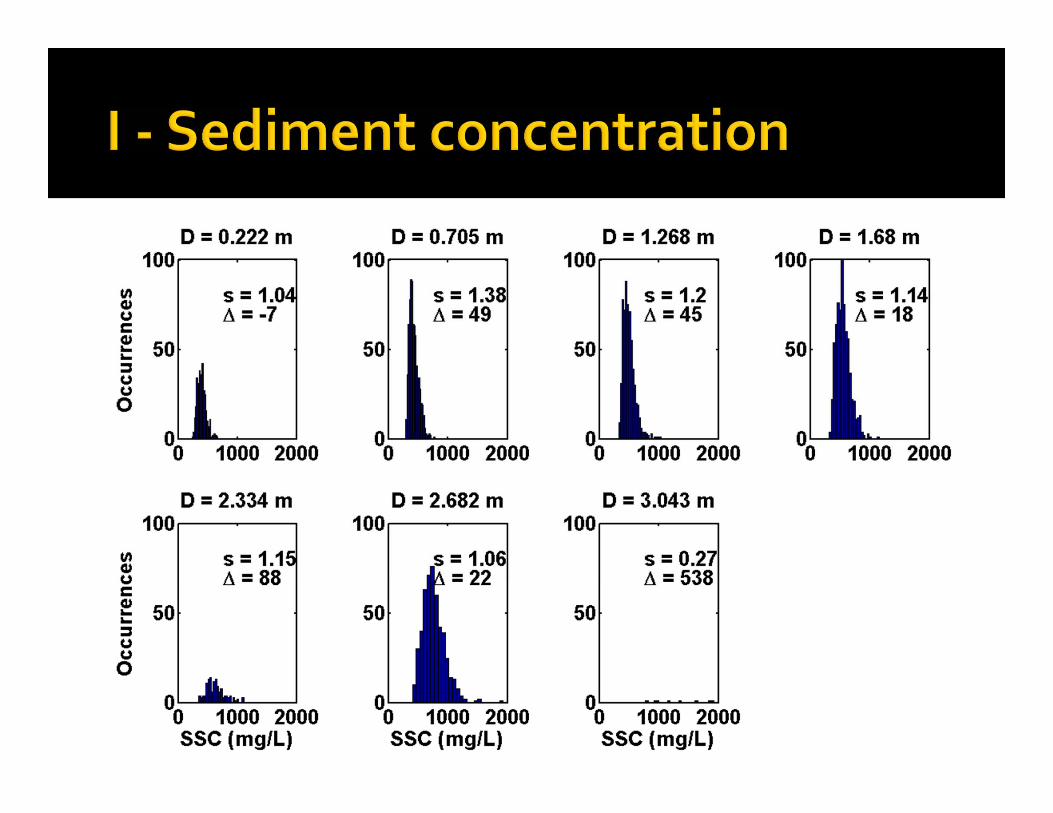
The LISST‐SLTM instrument is used to study Velocity, turbidity, sediment concentration and particle size distribution. We find some remarkable results.
[LISST is a trademark of Sequoia Scientific, Inc.]
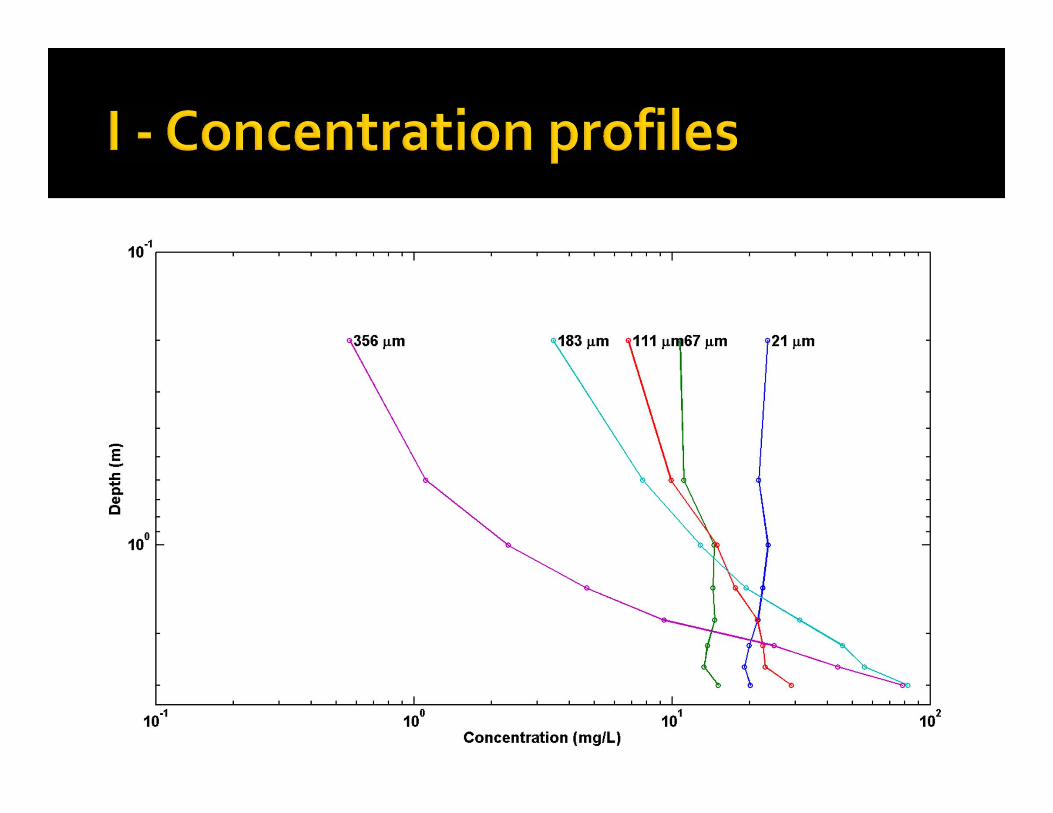
(Data courtesy of Chris Curran and Raegan Huffman, USGS Tacoma, WA)
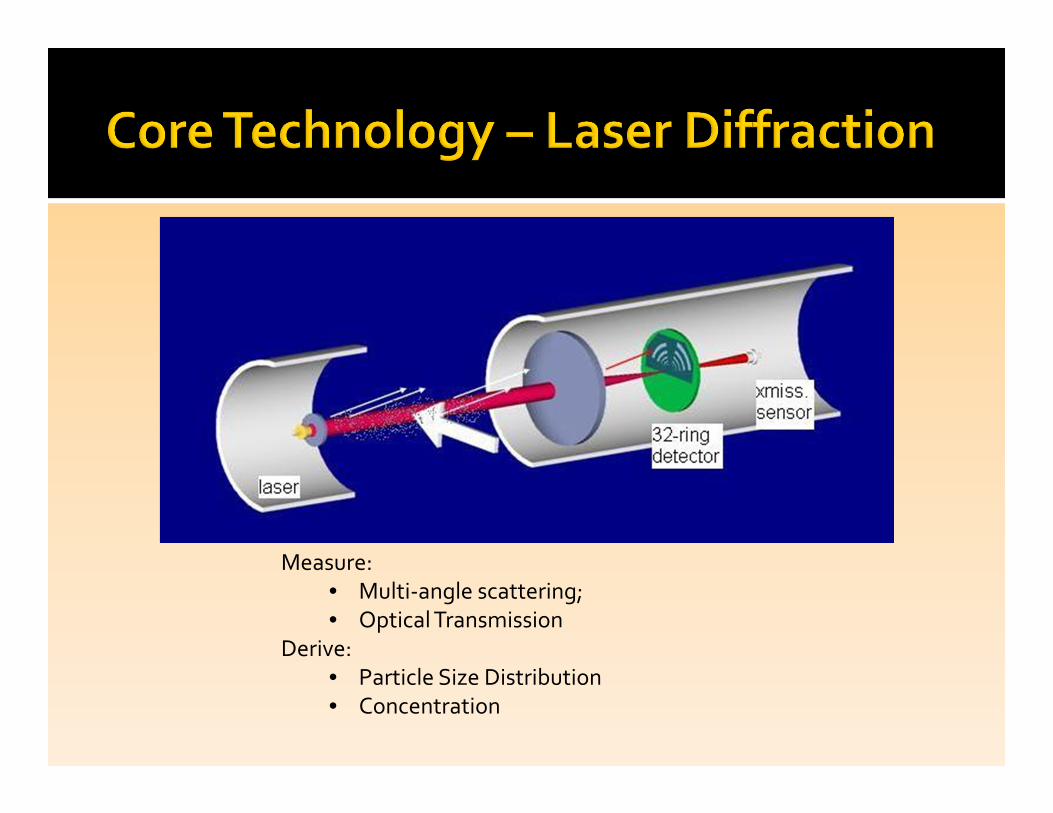
Measure:• Multi‐angle scattering; • Optical Transmission
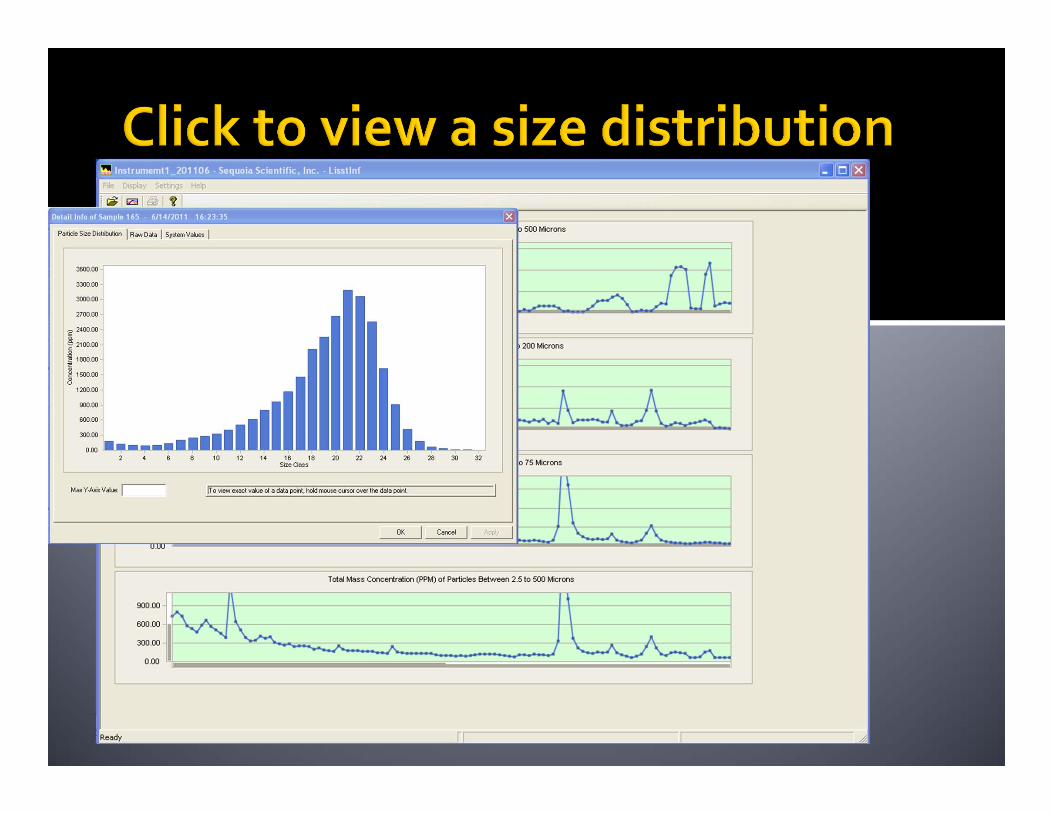
Derive:• Particle Size Distribution• Concentration
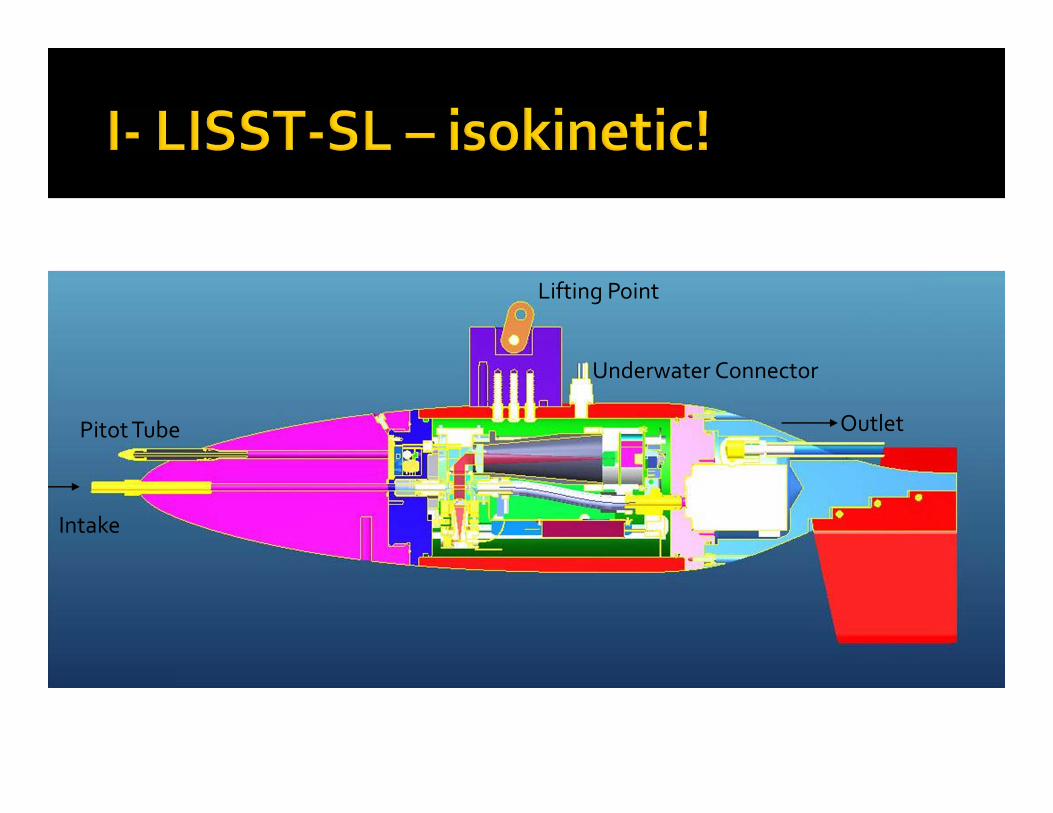
Lifting Point
Underwater Connector
Intake
Pitot Tube Outlet
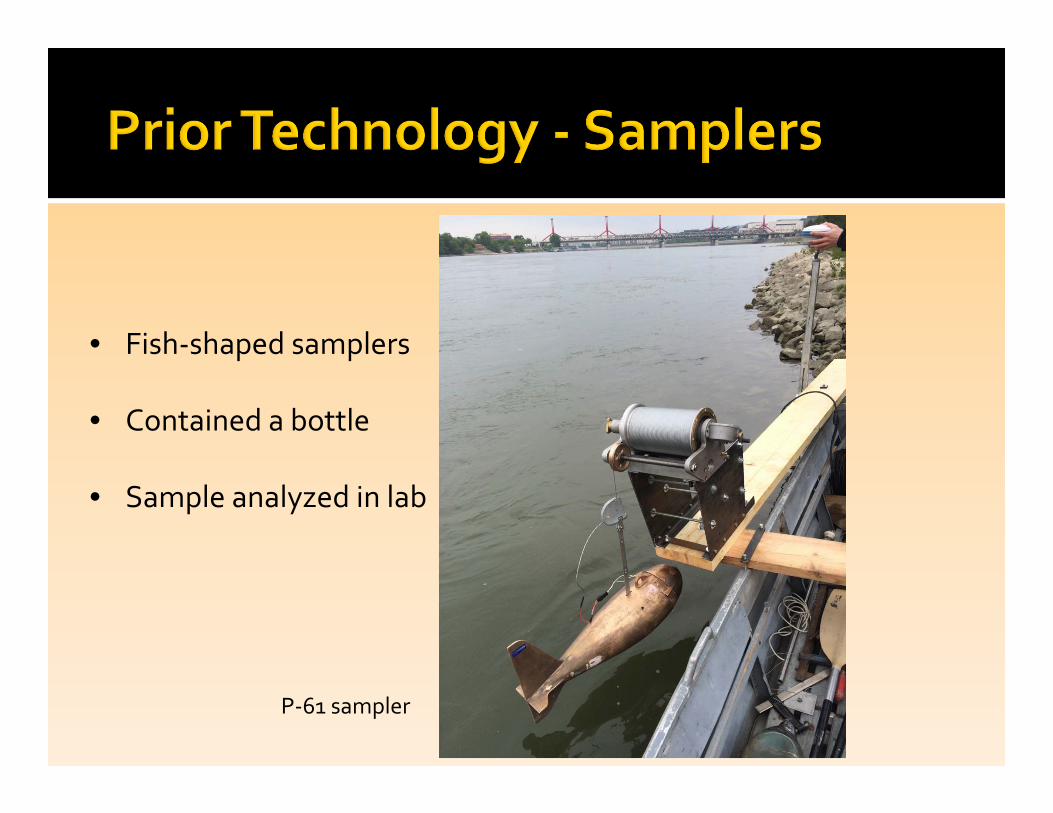
• Fish‐shaped samplers
• Contained a bottle
• Sample analyzed in lab
P‐61 sampler
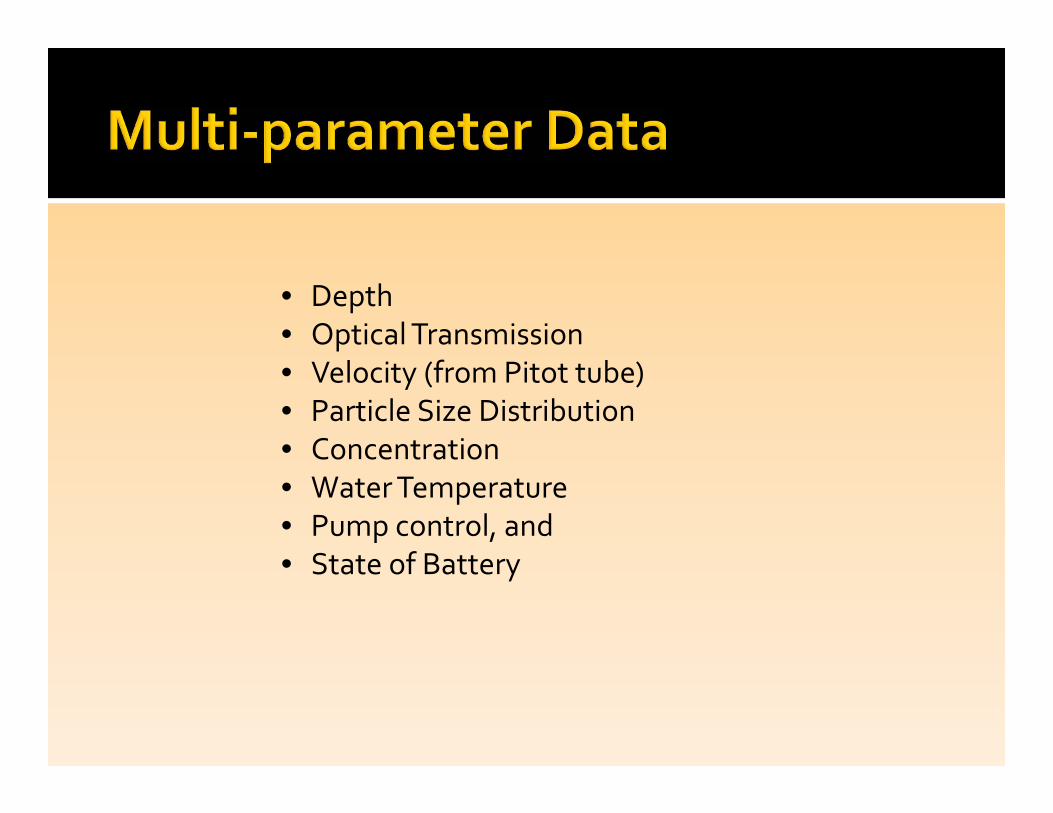
• Depth• Optical Transmission• Velocity (from Pitot tube)• Particle Size Distribution• Concentration• Water Temperature• Pump control, and • State of Battery
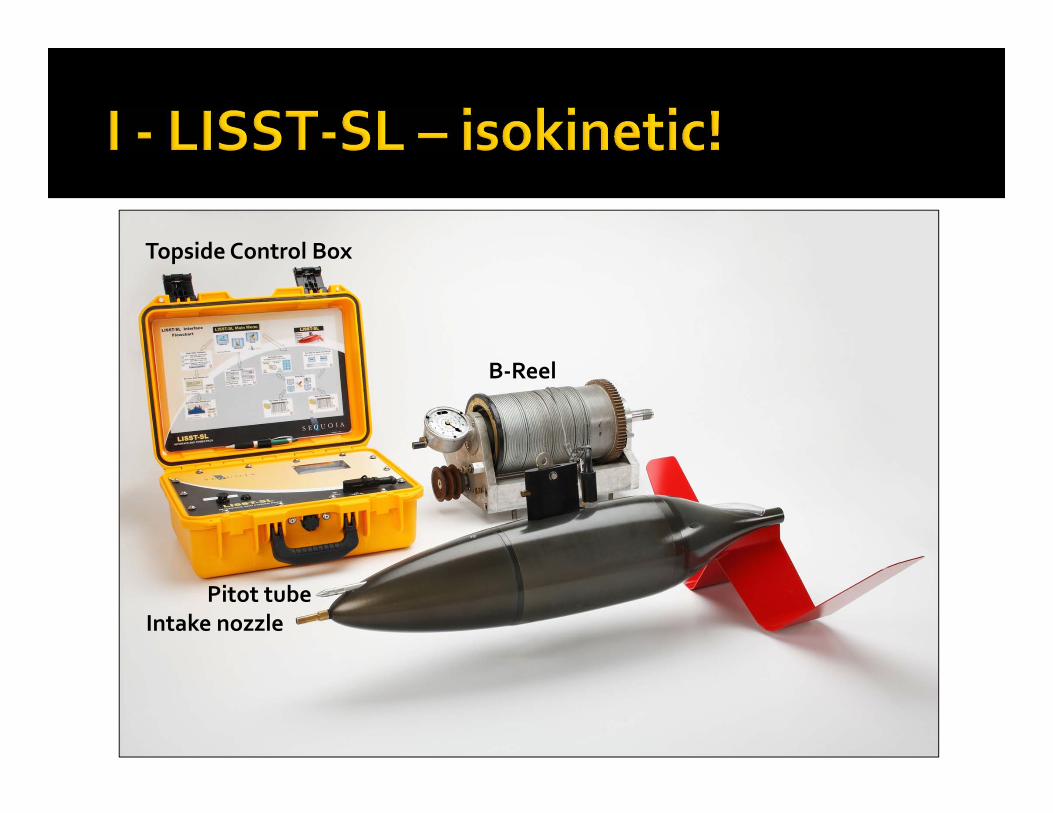
Topside Control Box
B‐Reel
Intake nozzlePitot tube
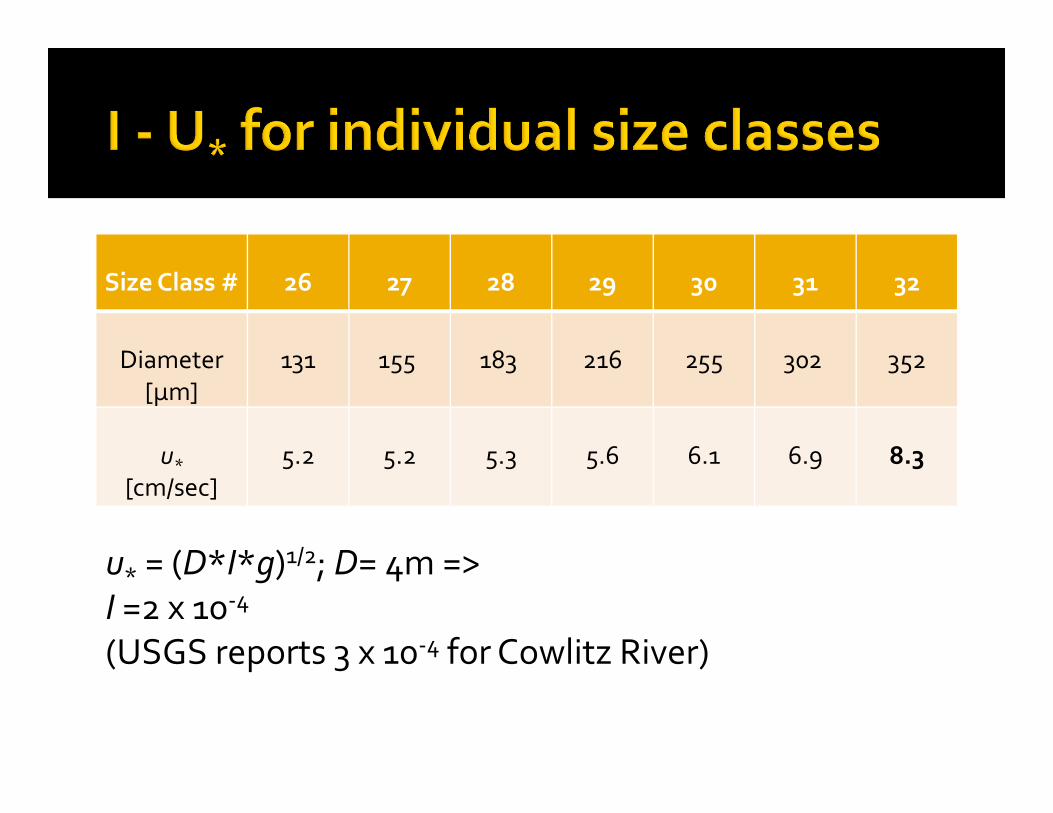
Size Class # 26 27 28 29 30 31 32
Diameter[µm]
131 155 183 216 255 302 352
u* [cm/sec]
5.2 5.2 5.3 5.6 6.1 6.9 8.3
u* = (D*I*g)1/2; D= 4m => I =2 x 10‐4
(USGS reports 3 x 10‐4 for Cowlitz River)
1234567890
10
20
30
40
50
60
70
80
90
100
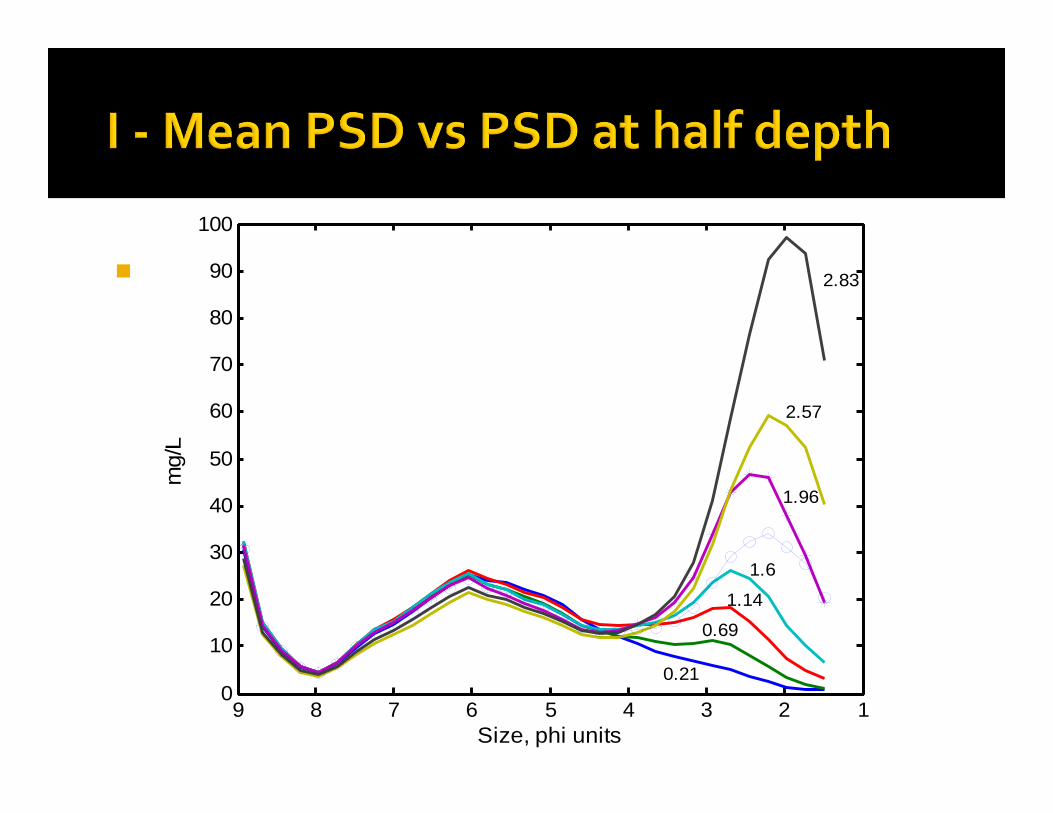
Size, phi units
mg/
L
0.21
0.69
1.14
1.6
1.96
2.57
2.83
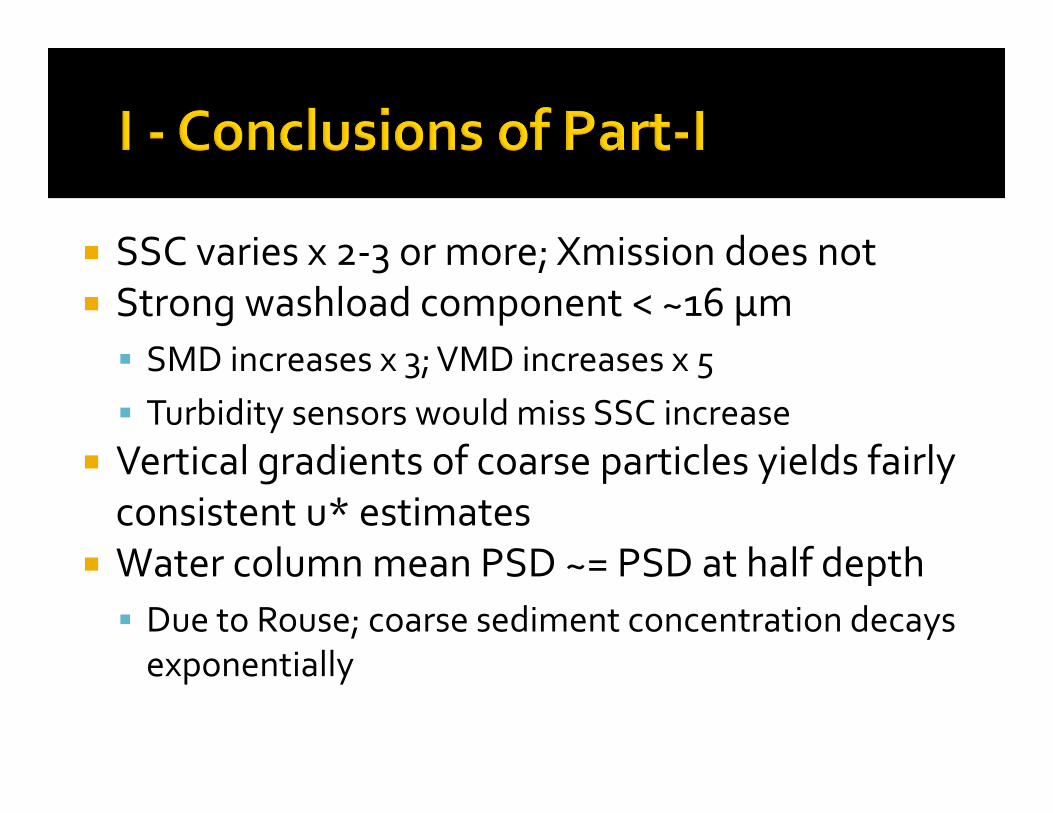
SSC varies x 2‐3 or more; Xmission does not Strong washload component < ~16 µm SMD increases x 3; VMD increases x 5 Turbidity sensors would miss SSC increase
Vertical gradients of coarse particles yields fairly consistent u* estimates
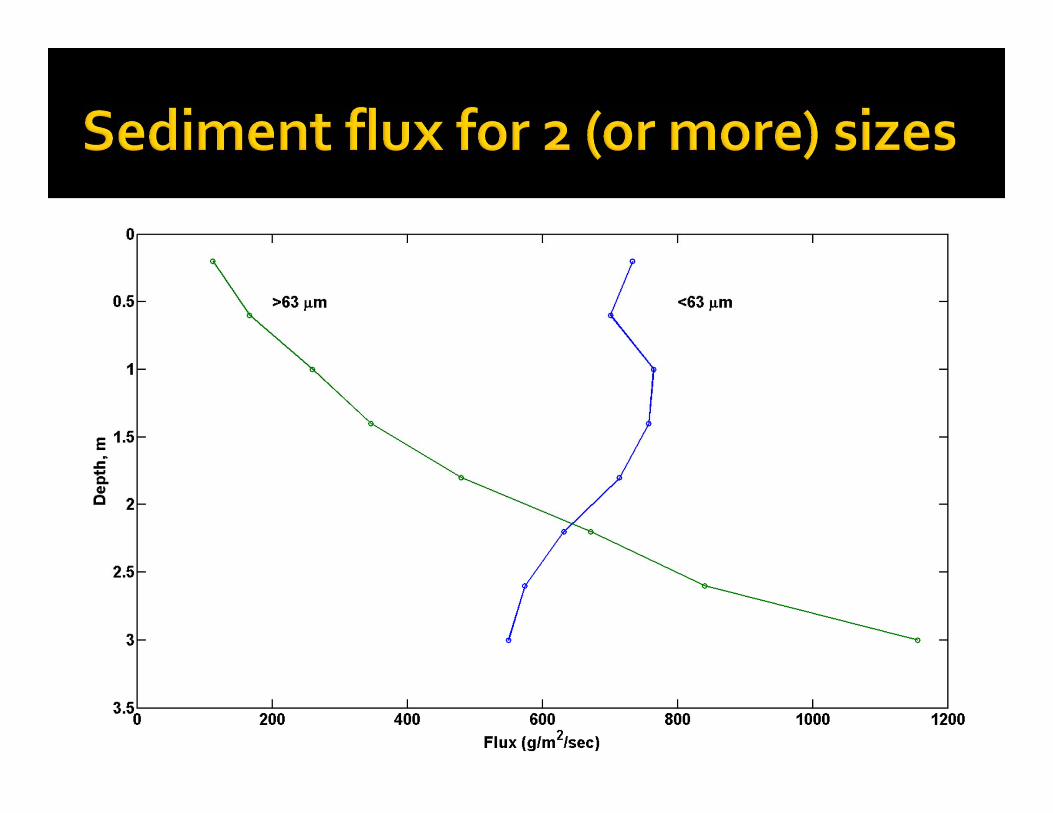
Water column mean PSD ~= PSD at half depth Due to Rouse; coarse sediment concentration decays exponentially
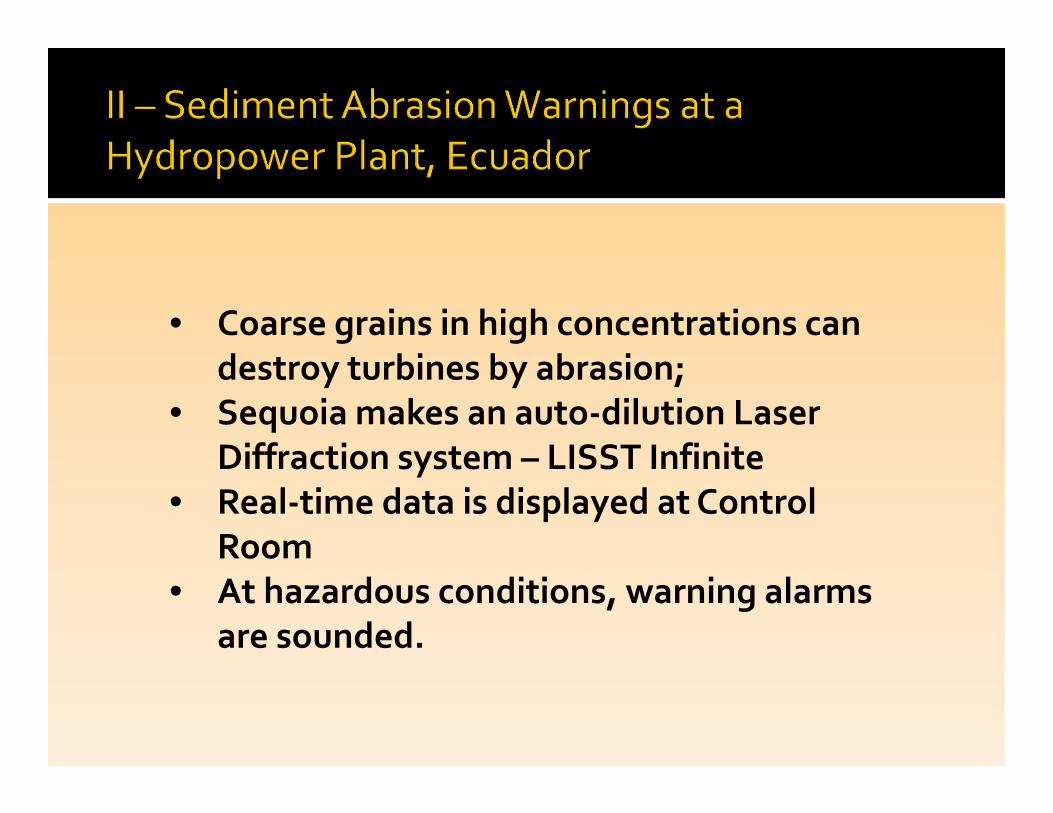
• Coarse grains in high concentrations can destroy turbines by abrasion;
• Sequoia makes an auto‐dilution Laser Diffraction system – LISST Infinite
• Real‐time data is displayed at Control Room
• At hazardous conditions, warning alarms are sounded.
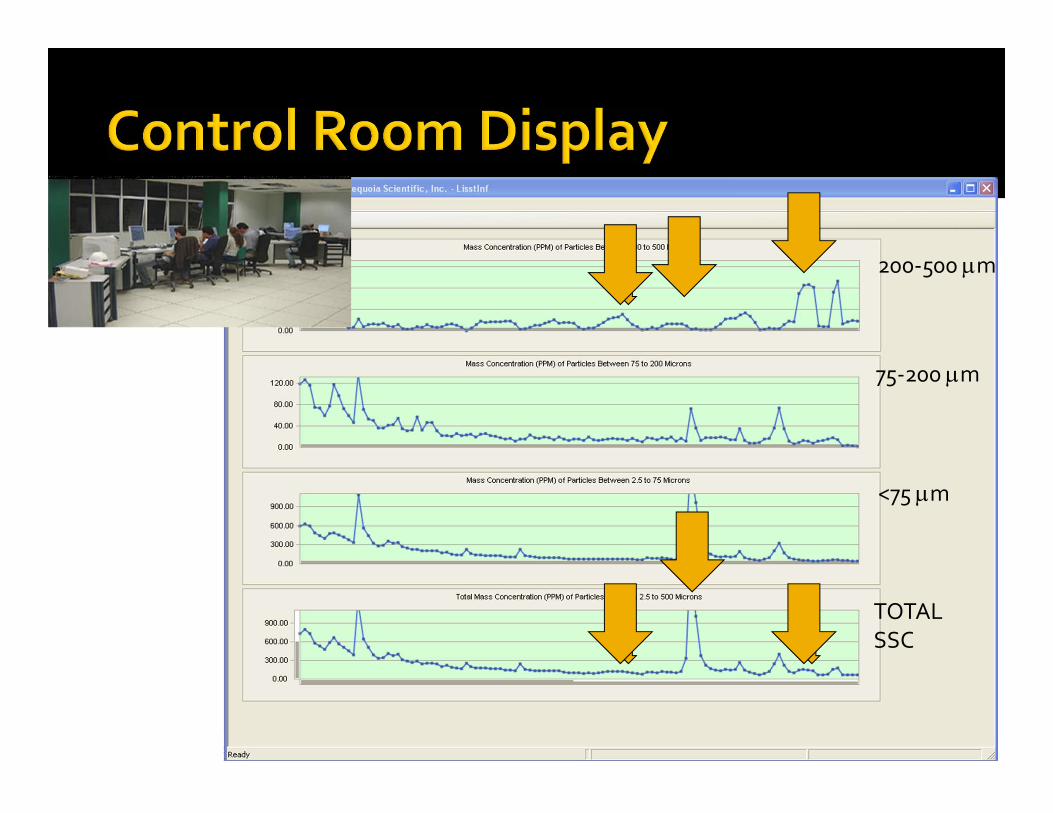
TOTALSSC
<75 m
75‐200 m
200‐500 m
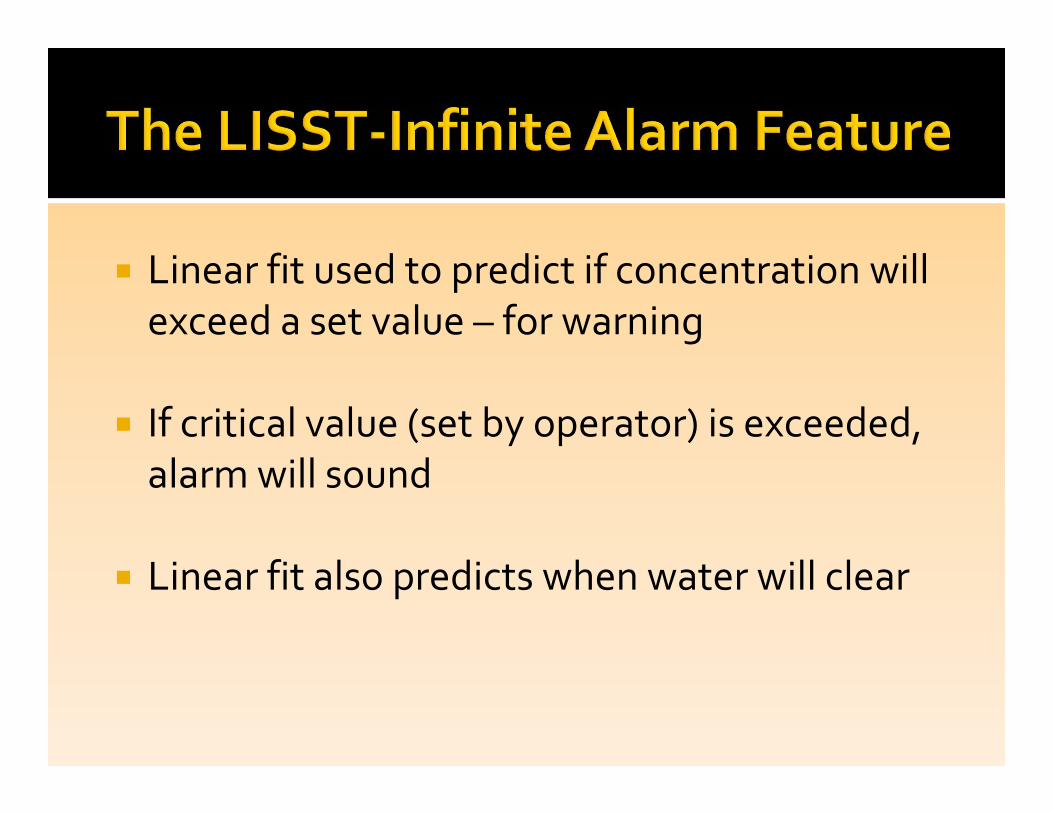
Linear fit used to predict if concentration will exceed a set value – for warning
If critical value (set by operator) is exceeded, alarm will sound
Linear fit also predicts when water will clear
25 26 27 28 29 30 31 01 02 030
1000
2000
3000
4000
5000
6000
7000
8000
May-Jun'11
Con
cent
ratio
n (m
g/l)
120 min interval
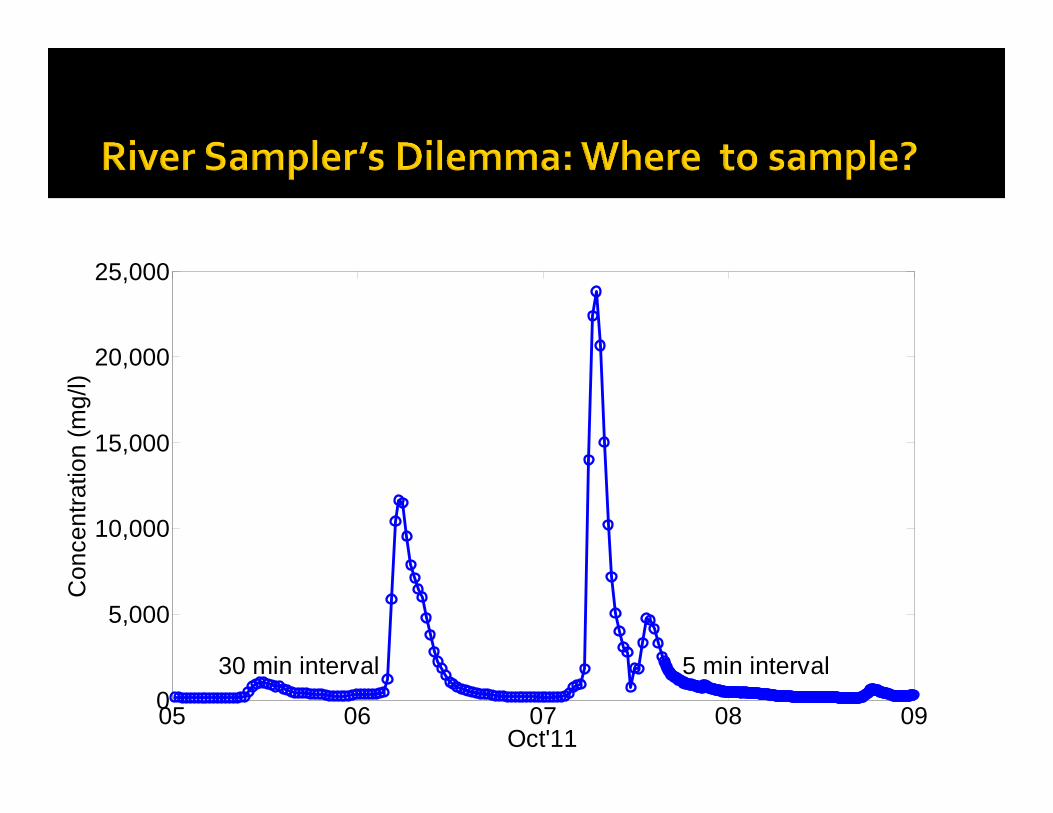
05 06 07 08 090
5,000
10,000
15,000
20,000
25,000
Oct'11
Con
cent
ratio
n (m
g/l)
30 min interval 5 min interval
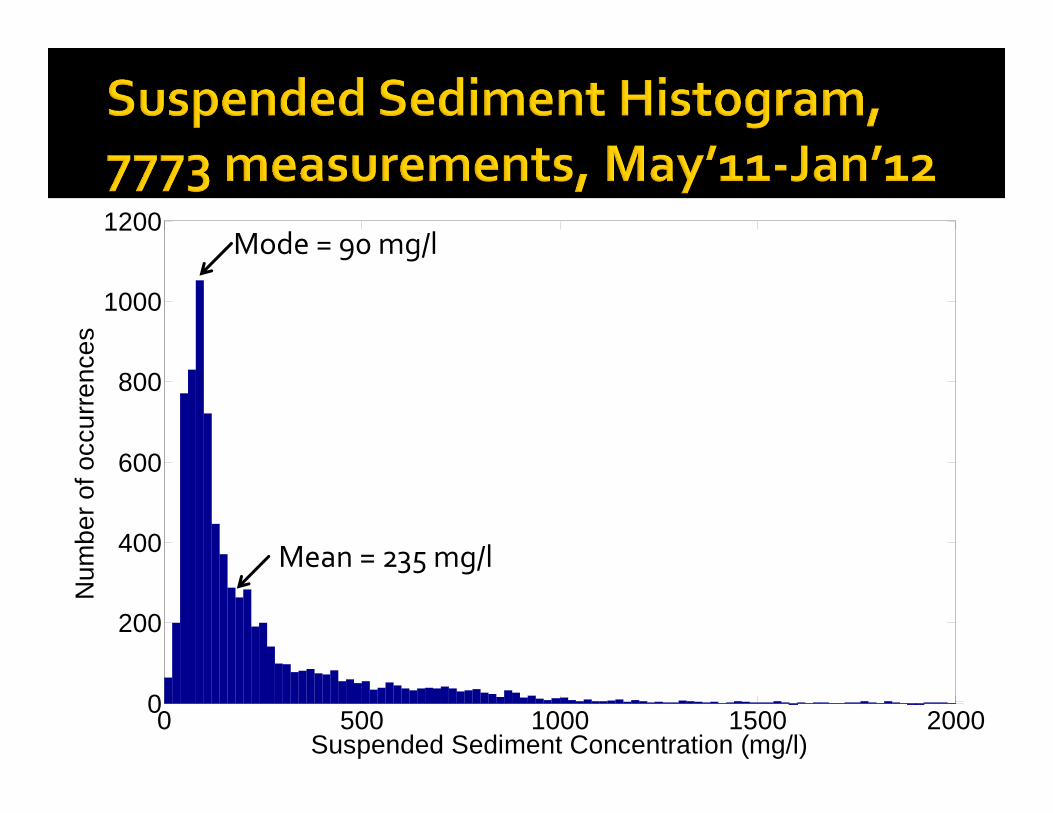
0 500 1000 1500 20000
200
400
600
800
1000
1200
Num
ber o
f occ
urre
nces
Suspended Sediment Concentration (mg/l)
Mode = 90 mg/l
Mean = 235 mg/l
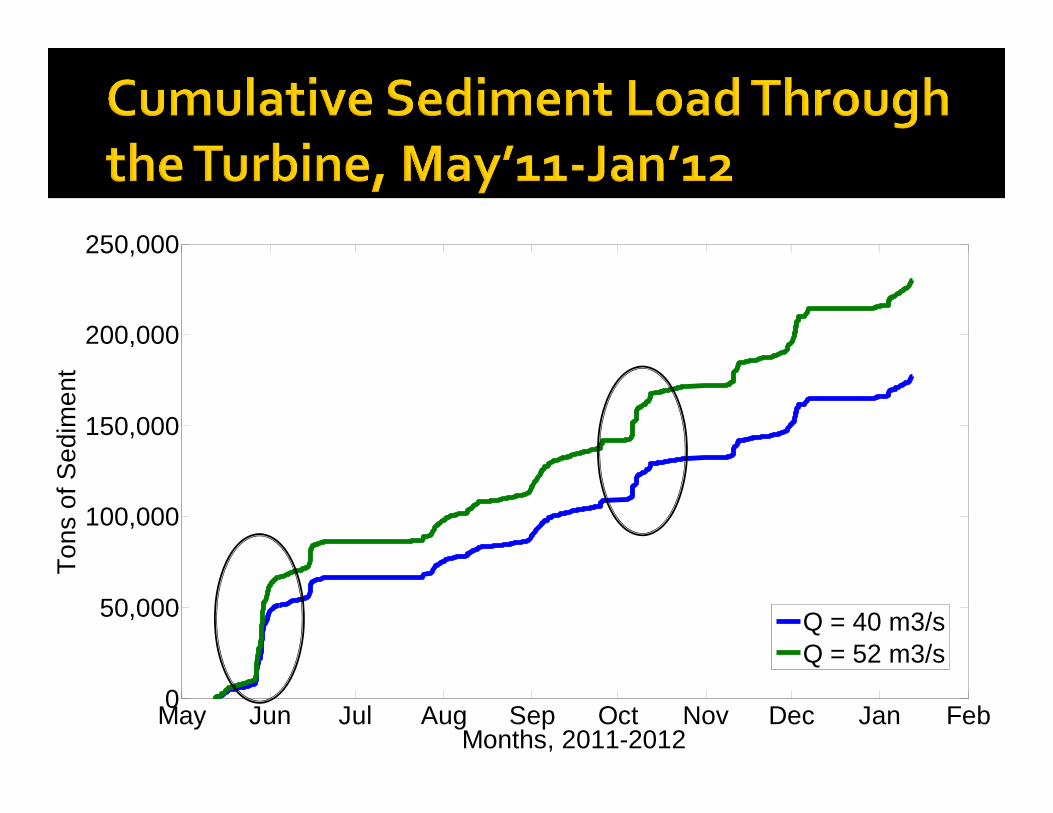
May Jun Jul Aug Sep Oct Nov Dec Jan Feb0
50,000
100,000
150,000
200,000
250,000
Months, 2011-2012
Tons
of S
edim
ent
Q = 40 m3/sQ = 52 m3/s
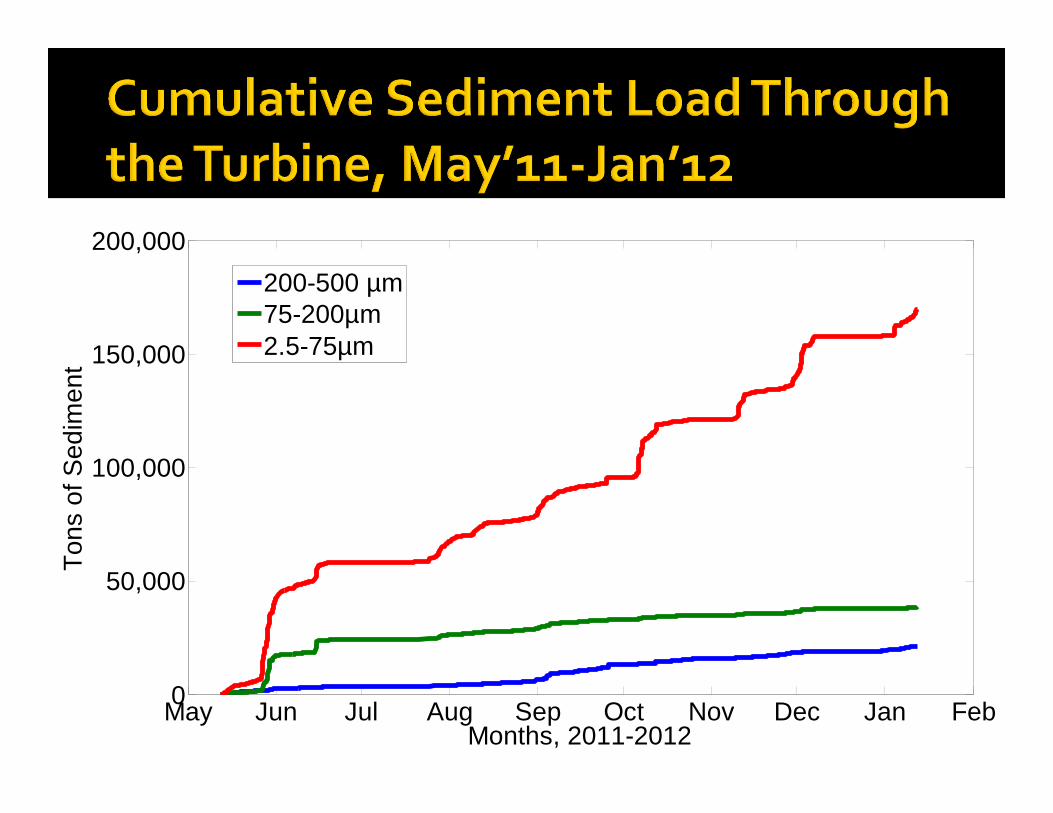
May Jun Jul Aug Sep Oct Nov Dec Jan Feb0
50,000
100,000
150,000
200,000
Months, 2011-2012
Tons
of S
edim
ent
200-500 µm75-200µm2.5-75µm
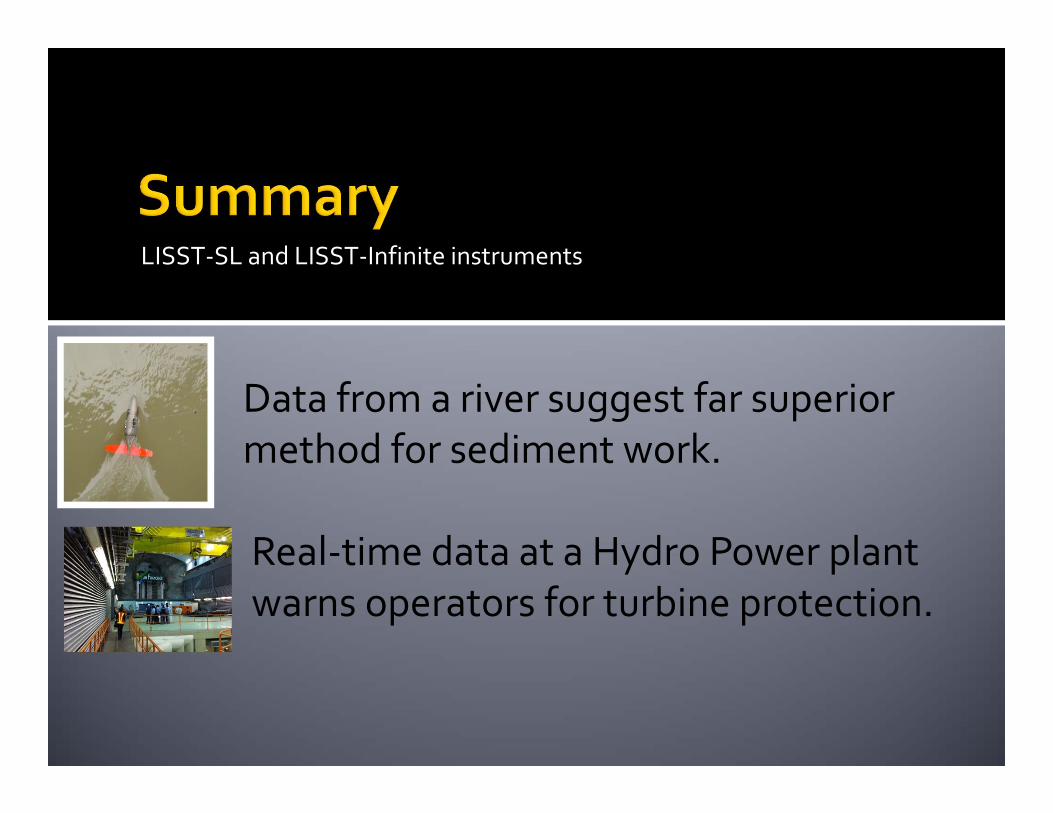
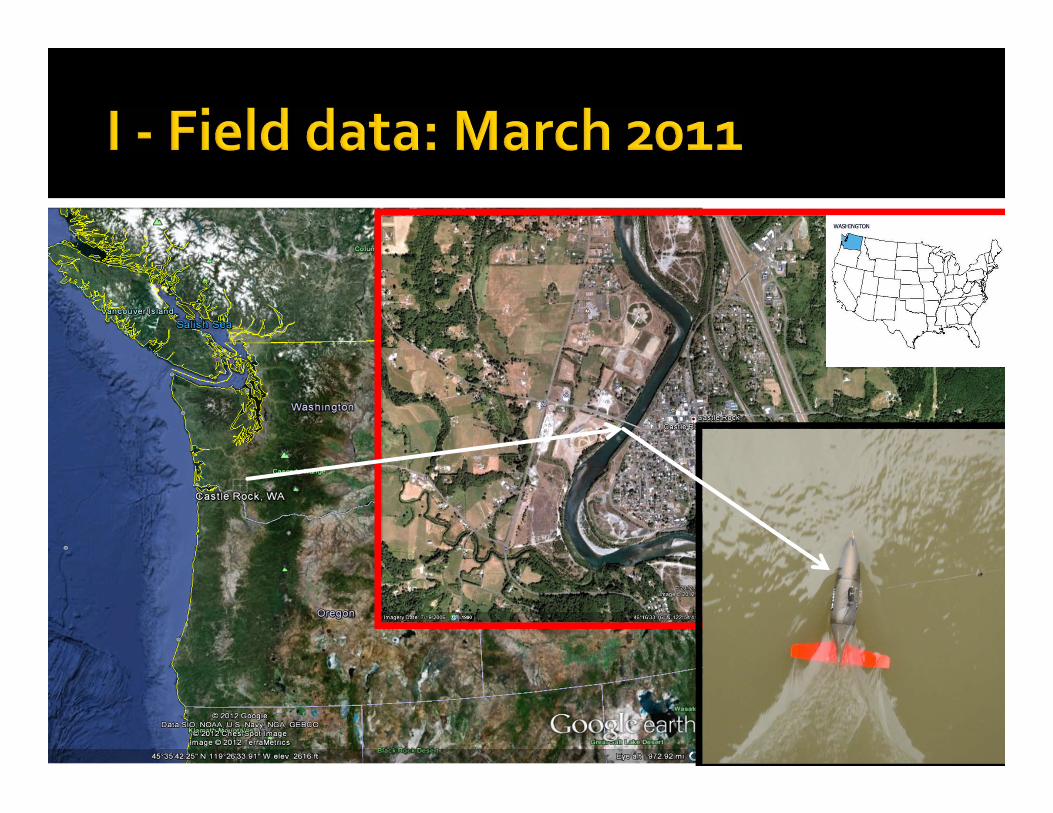
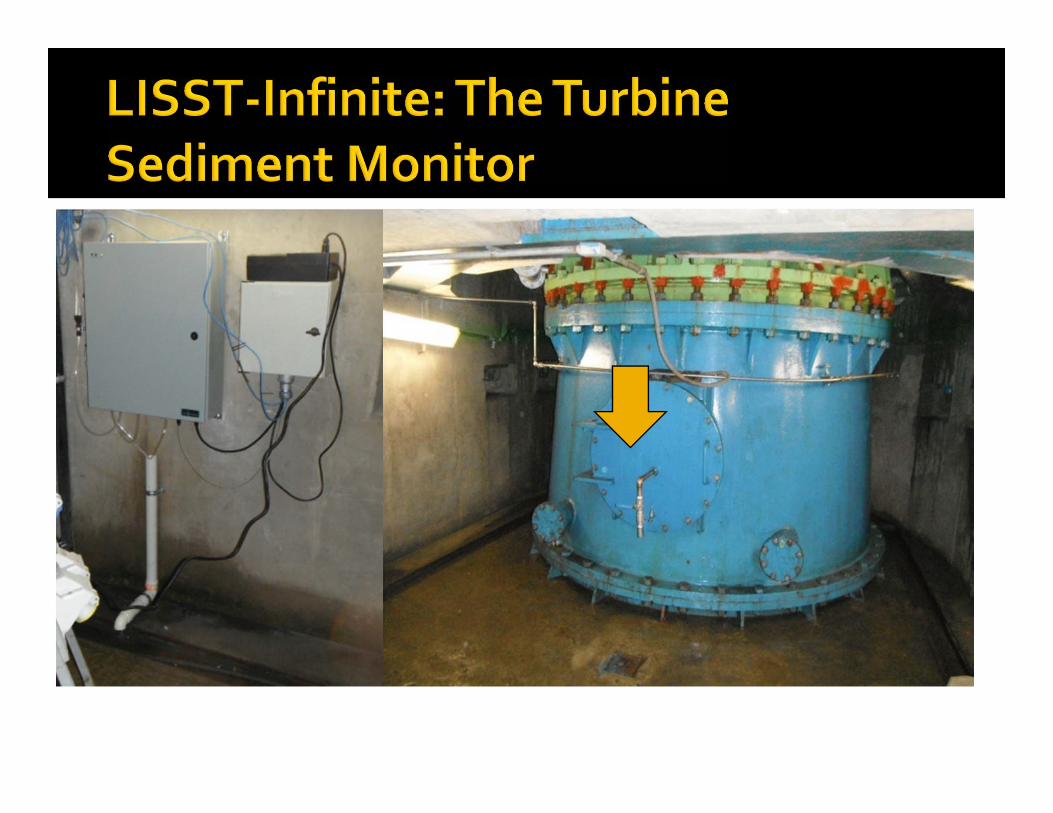
LISST‐SL and LISST‐Infinite instruments
Data from a river suggest far superior method for sediment work.
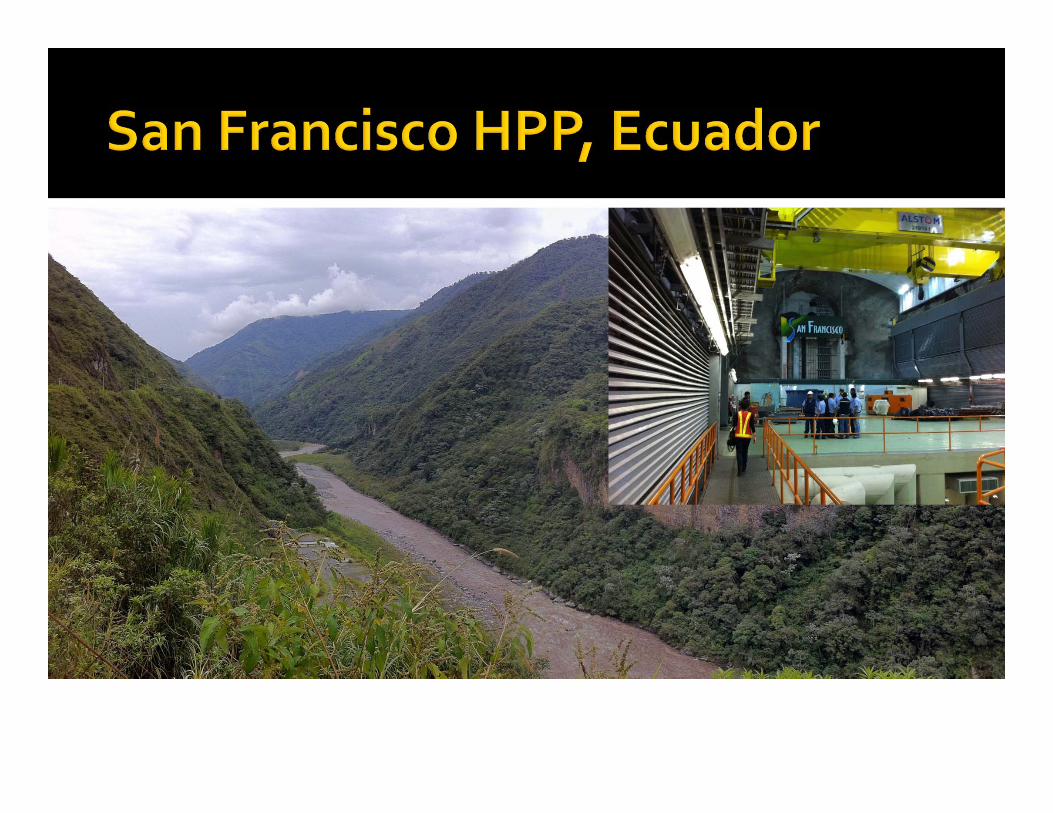
Real‐time data at a Hydro Power plant warns operators for turbine protection.