Embed Size (px)
Citation preview

Conquer CI Server! Re-establishment of Order and
Nurture of the Solid Organization
by Project Metrics and Automation Techniques
Apr/16/2015
Hiroyuki Ito, Kazuhisa Naoi
Rakuten, Inc.
http://www.rakuten.co.jp/

2
Hiroyuki Ito (The Hiro)
@hageyahhoo
Former Agile Coach
from Test-Driven
Development Group
Who are you? (1)

3
A speaker of Agile2014
Please check presentation and paper

4
Who are you? (2)
Kazuhisa Naoi
Travel Extranet Group
Travel Product Development Section
Travel Service Development Department
Rakuten, Inc.
Group Manager

5
This is a real Kaizen story of Rakuten Travel in 2014.

6
2. The importance of Strategy Formulation
3. Benefit of Infrastructure as Code
Theme
1. Project Metrics
4. Technology-Driven Development

7
Main theme
1. Project Metrics

8
Agenda
2. What should we show as accomplishments?
3. How could we reduce the load of CI server?
4. How could we nurture members and teams?
5. Conclusion
1. Challenges

9
Agenda
2. What should we show as accomplishments?
3. How could we reduce the load of CI server?
4. How could we nurture members and teams?
5. Conclusion
1. Challenges
The importance of Strategy Formulation
Benefit of Infrastructure as Code
Technology-Driven Development
Project Metrics
Project Metrics
Project Metrics
Project Metrics

10
2. What should we show as accomplishments?
3. How could we reduce the load of CI server?
4. How could we nurture members and teams?
5. Conclusion
1. Challenges at that time

11
The Hiro was just writing this paper
for Agile2014 at that time!
The end of June 2014

12
If we add jobs more,
CI server will stop and
we cannot provide services!
We couldn’t deliver
products on time
due to the overload of CI server!
Troubles came here!

13
Our status at that time
No responsibilities of CI server
to configure, monitor, and operate.
Leading automation at one QA project
• Implementing Build Pipeline
• Realizing Release Automation
• Introducing Smoke Testing
Leading a big project
as a manager
to make their systems multilingual

14
We decided to solve
these troubles!

15
Over 400 jobs (would increase more!)
Stand-alone server
Waiting queue often
became over 10
Load average often
became over 10
Often couldn’t open web pages of CI server.
• Even trying “Script Console” was gamble
Nobody monitored/maintained
Very slow…
Challenges at that time
16
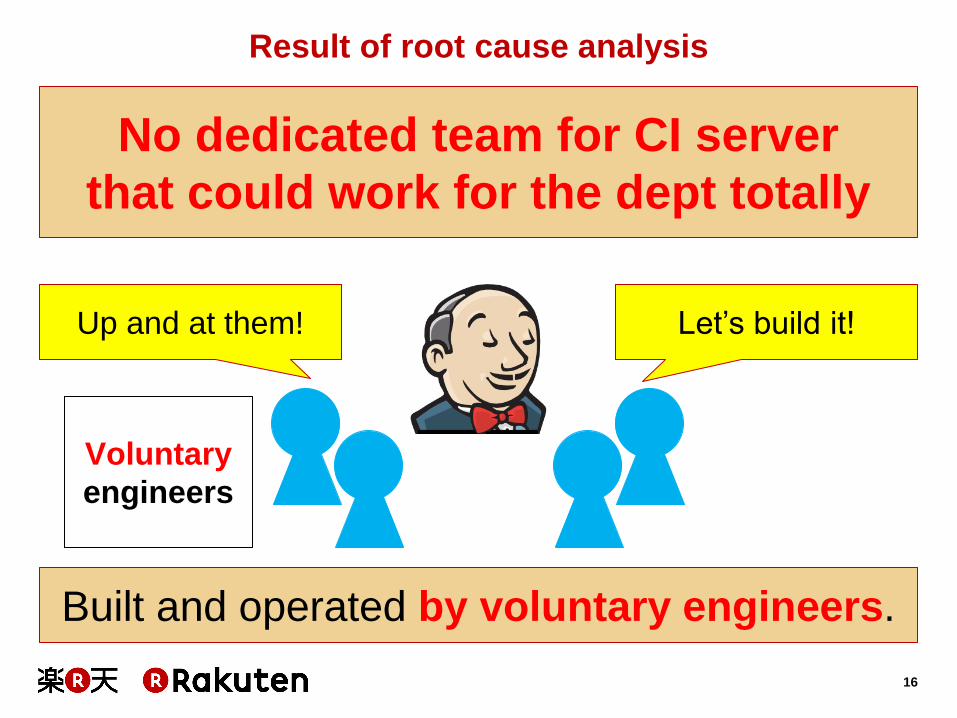
Built and operated by voluntary engineers.
Let’s build it! Up and at them!
Voluntary
engineers
Result of root cause analysis
No dedicated team for CI server
that could work for the dept totally

17
• Troubles had been left gradually.
• No monitoring mechanism for CI server.
Somebody can
solve it…! Tons of work
Voluntary
engineers
Result of root cause analysis
No dedicated team for CI server
that could work for the dept totally Ouch, ouch…

18
To avoid business loss anymore,
it was required to solve problems rationally.
Dedicated
team
Has the responsibility
to define vision
and achieve it.
Solves the overload
with long-term and
comprehensive view.
The first action
Proposed to organize the dedicated and
cross-functional team for CI server

19
This is an image.
Jenkins Consolidation Team was organized.

20
2. What should we show as accomplishments?
3. How could we reduce the load of CI server?
4. How could we nurture members and teams?
5. Conclusion
1. Challenges

21
What should we show as accomplishments?
Are we on the right path?
Where should we go?
Problems found

22
Challenges at that time
As a business, we needed
• to show managers/stakeholders progress
• to make managers/stakeholders happy
However, what and how should we show
as a result of improving CI server at all?
We needed to inspect and adapt
continuously through these activities
because they are totally new.

23
Especially look for the numerical numbers
which you can observe the transition.
Track them periodically and
focus on the transition before/after actions.
Always review the effect of them
and improve them if necessary.
Project Metrics: as a solution
Find the numerical numbers which can show
managers/stakeholders progress easily.

24
How can we reduce the load of CI server?
How can we scale up/out CI server?
How should we monitor CI server?
How should we nurture members?
A lot of things to do!

25
At first, clarified
• mission
• basic strategy
• roadmap

26
Define them that almost product members
and stakeholders can agree on. • e.g.) Can infrastructure team agree on them?
Define them not only from engineers’ view.
• It should cover the business value.
Make measures sustainable.
• Make the “Honeymoon Number” low.
• Include proper persons who can lead it.
The point of this phase

27
Find infrastructure and mechanism
for CI server to endure the increase of jobs. • It requires infrastructure team and others.
Deliver products on time without any delay
in every way.
• It is based on the business value.
1. Mission
Nurture new bloods
in addition to find and solve problems.
• It is for accomplishing sustainability.

28
2. Solve the bottlenecks of CI servers • Apply master/slave to balance loads easily.
• Refine CI servers by solving technical debts gradually.
3. Educate how to use them properly Nurture members/teams by teaching proper usage of
CI servers and reduce technical debts simultaneously.
2. Basic strategy
1. Hasten to reduce the load of CI server Purchase and set up additional servers to reduce loads
while we are stopping overloaded jobs temporarily.
4. Turn over the team to new bloods Accomplish sustainability of “Jenkins Consolidation”
activities by nurturing new bloods.

29
3. Roadmap

30
Candidates of Project Metrics (1)
Reduction of
system troubles Transition and frequency of
waiting/delaying delivery of the product
Status of
infrastructure
preparation
Difference between planned and actual
to prepare servers
• Measure waits and interruptions, too
Difference between planned and actual
to move all jobs on to each slave server
Transition of mean time
for server configuration and provisioning
Effect of
master/slave
adoption
Transition of migration ratio of jobs onto slaves
Transition of “availability ratio” and
“success ratio” of jobs on slaves
Status of
Inquiries
Transition of inquiries created and resolved
Transition of average mean time to solve

31
Candidates of Project Metrics (2)
Load information
Transition of the number of alert emails
Transition of load on each server
• Load average
• CPU %
• IO wait %
• Disk usage
Transition of “average execution time” and
“average wait time” for each job
Transition of waiting jobs to execute
Transition and frequency of slow jobs
How many persons do they feel that
CI server becomes lighter and faster?
(Gut feel)

32
Started the war for victory!

33
2. What should we show as accomplishments?
3. How could we reduce the load of CI server?
4. How could we nurture members and teams?
5. Conclusion
1. Challenges

34
Over 400 jobs (would increase more!)
Stand-alone server
Waiting queue often
became over 10
Load average often
became over 10
Nobody monitored/maintained
Very slow…
Challenges at that time
Solve them at first!

35
Improved step-by-step
We only measured/show Project Metrics
that were able to measure at that time.

36
Reduction of
system troubles Transition and frequency of
waiting/delaying delivery of the product
Status of
infrastructure
preparation
Difference between planned and actual
to prepare servers
• Measure waits and interruptions, too
Difference between planned and actual
to move all jobs on to each slave server
Transition of mean time
for server configuration and provisioning
Effect of
master/slave
adoption
Transition of migration ratio of jobs onto slaves
Transition of “availability ratio” and
“success ratio” of jobs on slaves
Status of
Inquiries
Transition of inquiries created and resolved
Transition of average mean time to solve
Project Metrics measured at first (1)

37
Load information
Transition of the number of alert emails
Transition of load on each server
• Load average
• CPU %
• IO wait %
• Disk usage
Transition of “average execution time” and
“average wait time” for each job
Transition of waiting jobs to execute
Transition and frequency of slow jobs
How many persons do they feel that
CI server becomes lighter and faster?
(Gut feel)
Project Metrics measured at first (2)

38
Measures

39
(1) Added servers simply
Added
4 servers
Main
2nd 3rd 4th 5th
Saved slow jobs
temporarily
Put off troubles
for next step
To reduce the load
of Main machine

40
(2) Adopted master/slave
Master
Slave-1 Slave-2 Slave-3 Slave-4
Ran jobs
concurrently
Added/enriched monitoring mechanism
Made it as
Master server
41
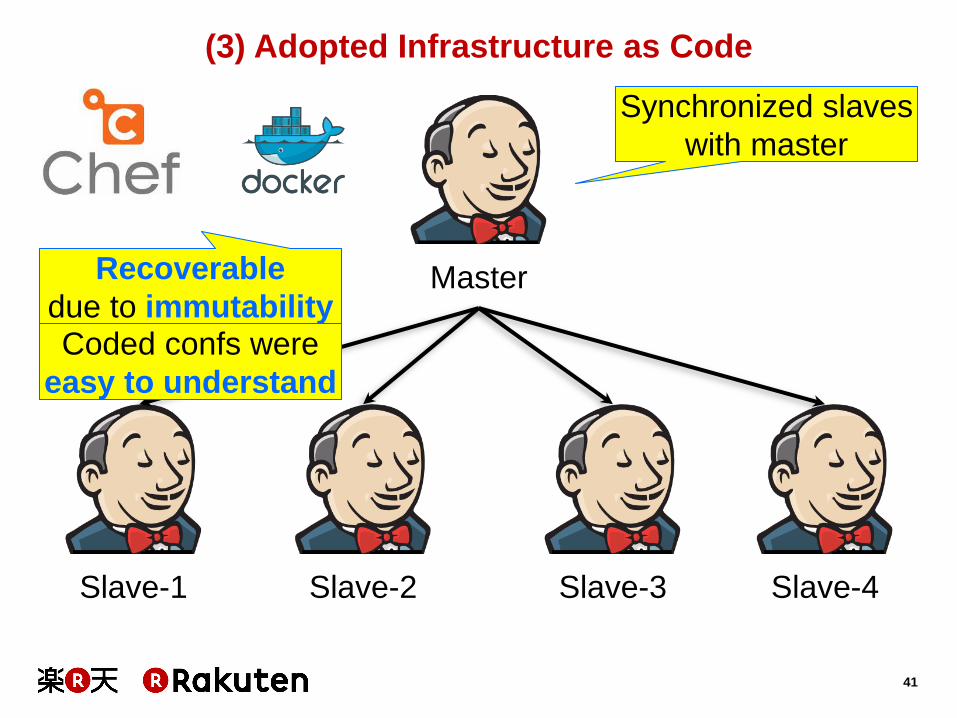
(3) Adopted Infrastructure as Code
Master
Slave-1 Slave-2 Slave-3 Slave-4
Synchronized slaves
with master
Coded confs were
easy to understand
Recoverable
due to immutability

42
Accomplishments

43
Result of preparing servers
Actions Expected Actual
Added servers simply 1 month 1 week
Adopted master/slave 1-2
month(s) 1 week
Adopted Infrastructure as Code 2 months 1 month
[Reasons]
• Prompt discussions with infrastructure team
led by Naoi-san
• Unexpected growth of young stars

44
The point of negotiation and measures
• We did just what we need
to achieve our target.
• We had already prepared for
next action at that time!

45
05
101520253035404550556065707580859095
100105110115120125130
Alert emails (08/01/2014 – 09/30/2014)
Reduction of loads by the transition of alert emails
August
241 emails
September
108 emails
Reduced
55.2%!
Loaded temporarily
due to the job increase.
But delivery troubles
didn’t occur again.
Utilized existing mechanism
which could notify
if load average exceeded 10

46
Before After
1 week 30 minutes
[Reasons]
• Eliminated miscommunications
by reducing exchanges
between infrastructure team and developers.
• Made works simpler and easier
because infrastructure team just have to run tests/recipes
created/validated by engineers beforehand.
• Could recover easily if trouble happened
due to Immutable Infrastructure.
Benefit of Infrastructure as Code (1)

47
Benefit of Infrastructure as Code (2)
Change mode of startup.sh
from 774 to 777, please!
Old regime
Developer
I want to start/stop Tomcat
as “homura” user
in “madoka” group
Cannot run shutdown.sh!
“homura” user does not belong to “madoka” group!
Done!
Infrastructure
Team

48
Benefit of Infrastructure as Code (3)
It was difficult to check all up-front
due to the differences of confs
on each servers.
They couldn’t feel easy
after validation.
It tended to include errors
on each request/configuration.
Old regime
Developer
They could configure
what they ordered basically.
It was difficult to know
intentions/objectives
of these requests.
They tended to be late
due to busyness.
Miscommunication
often occurred
It tended to take long
due to tons of exchanges Infrastructure
Team

49
In fact, we faced with communication troubles…
Let’s eliminate this mechanism
by applying
Infrastructure as Code!

50
Benefit of Infrastructure as Code (4)
New regime
They just have to run
tests and recipes!
It is risk-free
because they can recover easily.
They can express what they need
as tests and recipes.
It can reduce exchanges
by Pull Request of
tests and recipes.
They can try it easily
on their own PC beforehand.
Developer Infrastructure
Team

51
(Again) Result of preparing servers
Actions Expected Actual
Added servers simply 1 month 1 week
Adopted master/slave 1-2
month(s) 1 week
Adopted Infrastructure as Code 2 months 1 month

52
Additional improvements
53
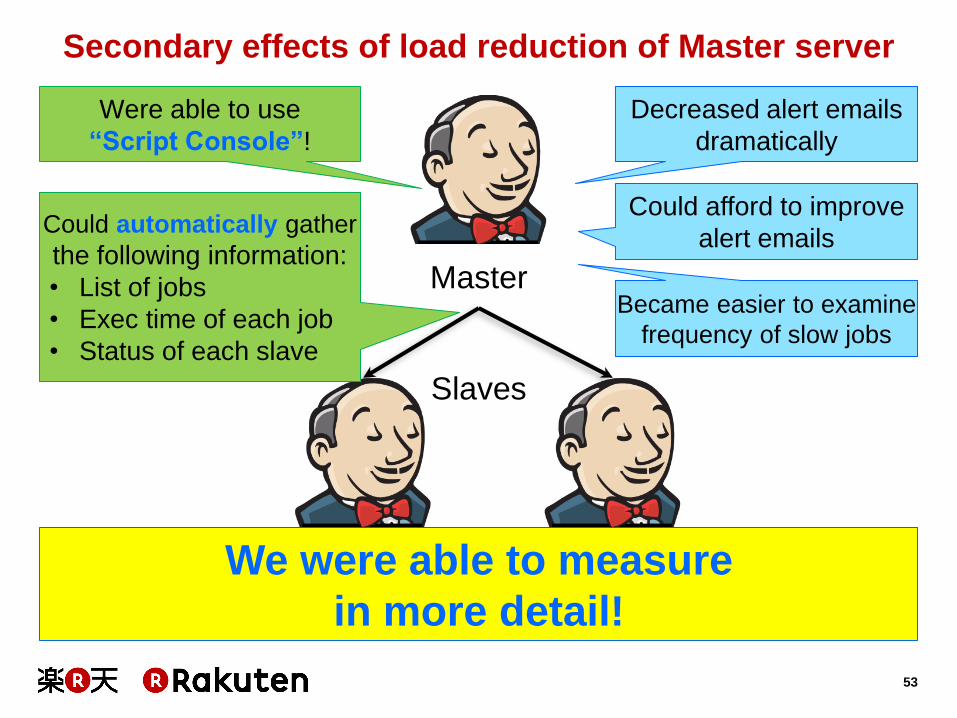
Secondary effects of load reduction of Master server
Master
Slaves
Could automatically gather
the following information:
• List of jobs
• Exec time of each job
• Status of each slave
Decreased alert emails
dramatically
Were able to use
“Script Console”!
Could afford to improve
alert emails
Became easier to examine
frequency of slow jobs
We were able to measure
in more detail!

54
Reduction of
system troubles Transition and frequency of
waiting/delaying delivery of the product
Status of
infrastructure
preparation
Difference between planned and actual
to prepare servers
• Measure waits and interruptions, too
Difference between planned and actual
to move all jobs on to each slave server
Transition of mean time
for server configuration and provisioning
Effect of
master/slave
adoption
Transition of migration ratio of jobs onto slaves
Transition of “availability ratio” and
“success ratio” of jobs on slaves
Status of
Inquiries
Transition of inquiries created and resolved
Transition of average mean time to solve
Project Metrics measured additionally (1)

55
Load information
Transition of the number of alert emails
Transition of load on each server
• Load average
• CPU %
• IO wait %
• Disk usage
Transition of “average execution time” and
“average wait time” for each job
Transition of waiting jobs to execute
Transition and frequency of slow jobs
How many persons do they feel that
CI server becomes lighter and faster?
(Gut feel)
Project Metrics measured additionally (2)

56
The importance of additional improvements
To continue improving steadily
becomes the foundation of
solid and high-performing
teams and organization!

57
09:40:04 up 154 days, 19:14, 2 users, load average: 11.59,
11.32, 7.16
[Heavy Process Top 10] CPU(%), Proccess
165 xxxxx
Alert emails (1) : Before improvement
• Verbose information by running “uptime” command.
• Unable to identify the user of CPU-consuming processes.
• Less information to identify the cause and
to find the solution.
• Unable to identify the memory-consuming processes.
• Unable to identify the job names
that caused the overload.
Typo!

58
• Focused only on load average as a result of “uptime” command.
• Started to gather/output the following information:
• the memory-consuming processes
• user of each process
• the job names that caused the overload
• It was necessary to scroll down to the bottom of
the notification because they were on the bottom.
Alert emails (2) : First improvement
Load average: (1.03, 1.05, 1.23)
--- Top 10 Heavy CPU consumers ---
tomcat xxxxx
--- Top 10 Heavy Memory consumers ---
ito xxxxx
--- Jobs currently running ---
- Sayaka

59
Output the job names on the top of the notification.
• Made identifying jobs very much easier.
(We could identify jobs at one view!)
• Made identifying the cause and finding the solution easier.
• To be honest, we could have done it since then.
Alert emails (3) : Additional improvement
Load average: 10.0, 5.2, 2.4
--- Jobs currently running ---
- Sayaka
--- Top 10 Heavy CPU consumers ---
tomcat xxxxx
--- Top 10 Heavy Memory consumers ---
ito xxxxx

60
Transition and frequency of slow jobs
Job name Frequency
Madoka 32
Homura 17
Sayaka 15
Anko 13
Mami 13
Charlotte 4
QB 3
Hitomi 2
Uro-Buchi 2
Solve the jobs
from the top of the list
preferentially.
Notify it weekly
to members/stakeholders
to urge self-running actions.

61
Agile as learnings from failures
Gather/measure information gradually.
• You don’t need to measure everything.
Need to review/improve Project Metrics
regularly/continuously.
Unexpected things often occur.
-> Utilize them aggressively
All information is not necessarily useful.
-> Measure only useful one.

62
Reduction of
system troubles Transition and frequency of
waiting/delaying delivery of the product
Status of
infrastructure
preparation
Difference between planned and actual
to prepare servers
• Measure waits and interruptions, too
Difference between planned and actual
to move all jobs on to each slave server
Transition of mean time
for server configuration and provisioning
Effect of
master/slave
adoption
Transition of migration ratio of jobs onto slaves
Transition of “availability ratio” and
“success ratio” of jobs on slaves
Status of
Inquiries
Transition of inquiries created and resolved
Transition of average mean time to solve
Retrospective of Project Metrics (1)

63
Reduction of
system troubles Transition and frequency of
waiting/delaying delivery of the product
Status of
infrastructure
preparation
Difference between planned and actual
to prepare servers
• Measure waits and interruptions, too
Difference between planned and actual
to move all jobs on to each slave server
Transition of mean time
for server configuration and provisioning
Effect of
master/slave
adoption
Transition of migration ratio of jobs onto slaves
Transition of “availability ratio” and
“success ratio” of jobs on slaves
Status of
Inquiries
Transition of inquiries created and resolved
Transition of average mean time to solve
Retrospective of Project Metrics (1)
Finished faster than we expected.
• Sufficient to show as accomplishments
• Already examined them for later actions
• Work finished -> Stopped measuring
• They were very useful to decide whether
we need to solve problems right now or not
when the overload was occurred.
• Sufficient to monitor if necessary.

64
Load information
Transition of the number of alert emails
Transition of load on each server
• Load average
• CPU %
• IO wait %
• Disk usage
Transition of “average execution time” and
“average wait time” for each job
Transition of waiting jobs to execute
Transition and frequency of slow jobs
How many persons do they feel that
CI server becomes lighter and faster?
(Gut feel)
Retrospective of Project Metrics (2)

65
Load information
Transition of the number of alert emails
Transition of load on each server
• Load average
• CPU %
• IO wait %
• Disk usage
Transition of “average execution time” and
“average wait time” for each job
Transition of waiting jobs to execute
Transition and frequency of slow jobs
How many persons do they feel that
CI server becomes lighter and faster?
(Gut feel)
Retrospective of Project Metrics (2)
• We found it was sufficient to gather/show
only the following 2 numerical numbers:
• Transition of the number of alert emails
• Transition and frequency of slow jobs
• It was sufficient to monitor
if it was necessary to investigate in detail.

66
※イメージです
Succeeded dramatically!

67
2. What should we show as accomplishments?
3. How could we reduce the load of CI server?
4. How could we nurture members and teams?
5. Conclusion
1. Challenges

68
At the end of September 2014
We Rakuten hold
Technology conference
this time of year

69
We decided to add it to our goal
because of load reduction of CI servers
and improvements faster than we expected!
Additional task as a reward of accomplishment
The dept. set a goal to achieve
over 65% of UT line coverage
for all their products by the end of 2014

70
The objective to set “UT Coverage” as a target
• To make UT a habit of
our organization.
• To motivate members
by numerical achievements.

71
Too many tools
• Cobertura
• Emma(JaCoCo)
• djUnit…
Lack of mechanisms
to measure
UT coverage
12.3%
05101520253035404550556065707580859095100105110115120125130
Lack of members
to lead this activity
Challenges about UT coverage at that time

72
Additional effects of load reduction of Master server
Master
Slaves
Chose only 2 tools
to measure coverage:
Cobertura/JaCoCo
Were able to use
“View”! Curious users
of CI servers were
increasing gradually.
Go to the NEXTSTAGE!!

73
(1) Created “view” to show everyone current status
Cobertura JaCoCo

74
Total target jobs 74
Jobs which
gather coverage 67
Jobs which
achieved the target 35
Achievement ratio 47.3%
(+18.9% WoW)
(2) Recorded/reported the transition weekly
Emphasized results
with weekly-basis
comparisons.

75
(3) Organized the “65% Team” to achieve the goal
Target groups:
about 10
Assigned curious users
of CI servers
preferentially.
Aimed to achieve a goal
with them collaboratively/effectively.

76
(3) Organized the “65% Team” to achieve the goal
Target groups:
about 10
Assigned curious users
of CI servers
preferentially.
Aimed to achieve a goal
with them collaboratively/effectively.
We need to tell the truth…!

77
At first and officially, we organized it
to compensate for the lack of workers.
The true objective of “65% Team”
The true objective was to turn over
Jenkins Consolidation Team and its tasks! • I needed to left the team at the end of the year.
The “65% Team” was the target
both to turn over tasks and to nurture.

78
Develop cooperative relationships
by sharing goals/problems/progress
with Project Metrics/automatic notifications.
Make the work efficient
by using Automation Techniques.
• e.g.) Infrastructure as Code
Drive learning by using
Automation Techniques/Project Metrics
with “inspect and adapt” style.
Technology-Driven Development: nurturing policy

79
Let them talk to each other honestly
about problems.
Held meetings regularly/weekly to share problems/knowledge face-to-face.
The early steering of the “65% Team”
Told them metrics in detail/preferentially
to make them act faster.
Let them share problems/knowledge/metrics
to each team.

80
Made them accustom to do
“inspect and adapt” with the latest metrics.
Let them hand off our work gradually
based on Infrastructure as Code and OJT.
Let them focus on how to solve problems,
rather than just reporting them.
Let them hand off steering the team.
• Urged their autonomy.
The late steering of the “65% Team” (to nurture)

81
※イメージです
One day on November 2014
Pay dirt…!
I built this mechanism.
So please try it.
Should we do it, too?
I’d like to help that team
to solve the problem.

82
Solved problems by themselves!
• With Infrastructure as Code and OJT
• Done about 10 tasks in December 2014
Improved UT coverage clearly!
• Improvement of UT coverage generated
additional motivation to improve it more!
Started helping other teams voluntarily
if they found problems.
Growth of the “65% Team”

83
Growth of the “65% Team” from Project Metrics
0.0%
10.0%
20.0%
30.0%
40.0%
50.0%
60.0%
70.0%
80.0%
90.0%
Transition of achievement ratio
84.1%
Narrowed down
target jobs
16.7%
Solid advance
with weekly measurements/reports
To be honest, we thought of over 30%
at the end of 2014 as a practical goal.

84
The impression of a series of improvements
Improvements never start
without measuring
current status and achievements
numerically!

85
※イメージです
Total victory!

86
2. What should we show as accomplishments?
3. How could we reduce the load of CI server?
4. How could we nurture members and teams?
5. Conclusion
1. Challenges

87
Final accomplishments
Delivered all products on time
and prevented recurrence of delay.
Scaled out CI servers (master/slave)
• Over 550 jobs are running
Turned over tasks to new bloods
by nurturing them.

88
Roadmap (planned)

89
Roadmap (actual)

90
Remaining issues
IT/ST automation is not yet sufficient.
Data collision often occurs
on test environment.
• Solve by Immutable Infrastructure?
Release automation is not yet sufficient.
• Blue-green deployment?

91
New issues
• Nearly gave some managers
an easy mirage that
they can improve quality by
only increasing UT coverage.
• Often misunderstood that
everyone can improve easily
due to the impact of
our activities.

92
Run the PDCA cycle faster by integrating
strategy and (automation) techniques.
Find/measure/review Project Metrics
to consolidate our PDCA cycle.
Agile for success
Nurture members/teams and develop cooperative relationship with above.

93
The point of Project Metrics
Find useful information to think over • Where is the current problem lurking?
• Was our action effective to solve problems?
Review and improve them continuously • Throw it away if it is useless.
• Create it if necessary.
Focus on the transition of numerical number • Intelligence is on the transition of numerical number.
• If you find transition, you will win!
Use them as a way of communication • You can get additional ideas
by talking members with Project Metrics.

94
0.0%
10.0%
20.0%
30.0%
40.0%
50.0%
60.0%
70.0%
80.0%
90.0%
Transition of achievement ratio
84.1%
Narrowed down
target jobs
16.7%
Solid advance
with weekly measurements/reports
It will start from measurement all.

Electrify your team!

96
Reference
“Useful Metrics in a Complex World” (Agile2014)
http://www.agilealliance.org/files/9814/0509/9343/Experienc
eReport.2014.Power.pdf
“Moneyball for Software Projects” (Agile2014)
http://schd.ws/hosted_files/agile2014/f0/1272_Agile_2014_-
_Software_Moneyball_%28Troy_Magennis%29.pdf
“Technology-Driven Development” (Agile2014)
http://www.agilealliance.org/files/5014/0509/9284/Experienc
eReport.2014.Ito.pdf
“Visualize it with Project Metrics”
http://www.slideshare.net/ssuser968fab/xp-matsuri-
2014ltthehiro