Embed Size (px)
Citation preview

Two Worlds of Business Intelligence: What You
Need to Know

2
Please send questions using the online interface
Attendees muted upon entry
Webinar Housekeeping

3
I. IntroductionII. The Two Worlds of Business IntelligenceIII. Birst: 2-tier BI and AnalyticsIV. Q&A
Agenda

4
Featured Speakers
Pedro ArellanoSenior Director, Product StrategyBirst
Wayne EckersonPrincipal ConsultantEckerson Group
© Eckerson Group LLC
Wayne EckersonHingham, MA
[email protected](781) 740-9504
Wayne Eckerson• 20+ year thought leader in BI and analytics• Sought-after speaker and consultant• Principal Consultant, Eckerson Group• Industry analyst, TechTarget• Former director of research at TDWI• Author of hundreds of articles and reports
Performance Management
BI/Analytics Data Governance

© Eckerson Group LLC
The Two Worlds of Business Intelligence: A New Model for BI and Analytic Success
Wayne EckersonFounder and Principal Consultant
Eckerson Group
© Eckerson Group LLC
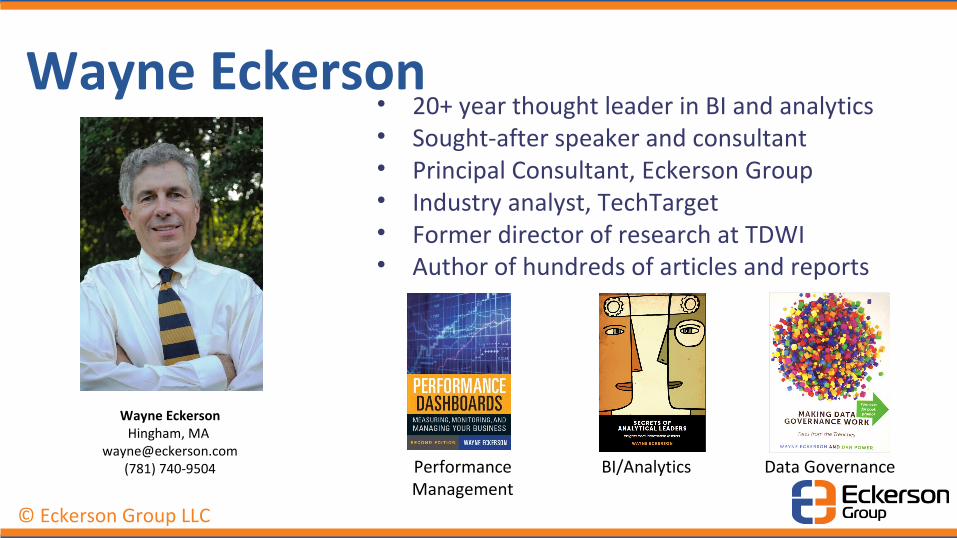
Waves of BI
Bu
sin
es
s V
alu
e
High
2010-20
Reporting
1980’s
Analysis
Prediction Monitoring
Query, Excel, OLAP, Visual
Discovery
Dashboards, scorecards
Statistics, data mining, optimization
Static & interactive reports
“What happened?”
“Why did it happen?”
“What’s happening?”
“What will happen?”
Low
= Reporting
= Analysis
1990’s 2000’s
All
user
sB
usin
ess
an
aly
sts
Exe
cs,
Mg
rs,
Wo
rke
rs
Sta
tistic
ian
s/D
ata
Sci
entis
ts
Tools
Use
rs

© Eckerson Group LLC
Business users who use information to do their jobs
Executives
Managers
Front-line workers
MonitorAnalyze
Casual Users 80% of employees
Detail
Interactive dashboards and reports
Data warehouse and data marts Text- and voice-based search tools
Built by IT Managed by IT
80% of time*
Power Users20% of employees
Report Analysts
Business analystsStatisticians
AnalyzeExplore
Mine
Business users who are hired to analyze information.
PublishData scientists
Data warehouse Hadoop
Operational systems
NoSQL Systems
External Data
Text/Documents
Mashup Tools Visualization Tools
Data Mining Tools
Programming tools
Managed by BUsSourced by BUs
100% of time*
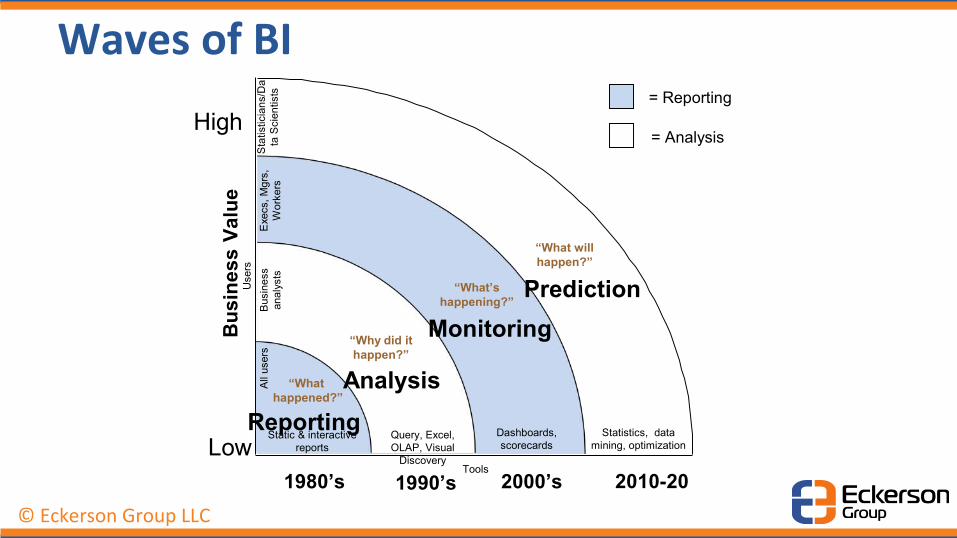
Two Worlds of Business Intelligence
Top-down BI
Bottom-up BI
Users Functions Data Architecture Tools
© Eckerson Group LLC
Reporting and Monitoring
Predefined Metrics
TOP-DOWN“IT-driven - Casual Users”
Analysis Begets
Reports
Reports Beget
Analysis
Pros:
- Data Consistency- Business AlignmentCons: - Hard to build- Hard to change- Expensive- Politically charged
Pros: - Quick to build- Easy to change- Low cost - Politically unchargedCons: - Data Consistency- Business Alignment
DW Architecture
Certified Data
Exploration and Prediction
Ad hoc queries
Sandbox Architecture
Non-certified
Data

© Eckerson Group LLC
Teams
Reporting & Monitoring
Predefined Metrics
IT-driven – Casual User“Business Intelligence”
DW Architecture
Certified Data
Business unit-driven – Power User
Exploration and Prediction
Ad Hoc Queries
Analytics Architecture
Non-certified data
Corporate BI Team (Centralized)
Dept Analysts(Decentralized)
Data architects, ETL developers, report developers, data administrators, DW administrators, technical architects,
requirements specialists, trainers, etc.
Report analysts, business analysts, statisticians, data scientists
TOP-DOWN
BOTTOM-UP
•Build data warehouse/data marts•Maintain BI “schema” and certified data•Create certified, production reports
•Create ad hoc reports•Conduct analyses •Research business unit issues
“Analytics Intelligence”

© Eckerson Group LLC
Enterprise BI
Managed by the corporate BI team
Divisional BIManaged by Business
Units
Top-down BIStandard reports and dashboards for casual users
Divisional Reports -Produced by embedded
BI staff &-BI relationship Mgrs
Divisional Analysis (ad hoc reports)
- Produced by embedded analysts
Enterprise Analytics (models/scores)
- Produced by statisticians/data
scientists
Enterprise Data and Reports- Produced by
corporate BI team
BI/IT Generated(with business help)
Business Generated(with BI help)
Han
doff TrainingSc
ores
Models
Data
Expertise
Requirements
Prototypes
Director of BI
Bottom-up BIAd hoc analysis and reports by power users

© Eckerson Group LLC
Create appropriate data structuresMAD DASHBOARD
ANALYST SANDBOXES
Staging (Hadoop)
Virtual sandbox (in DW)
Physical sandbox (outside DW)
BI sandbox (Server-based wrangling/analysis)
Top Down BIBuilt by IT
Around a data warehouseThat answers known questions
Using certified dataGeared to casual usersTo monitor processes
Bottom UpDriven by business unitDriven by power users
Who answer unanticipated questionsUsing any data and tools
To solve business problems
Dept Dashboard8-12 KPIs
20 dimensionsMonitors key processes
Tailored by role and userAnswers predefined questionsAnswers 50% of all questions
SandboxesUpload desktop data
Combine with corporate dataCollaborate w/ other analysts
IT monitorsReuse analysts
Detail
Analyze
Monitor Managers
Analysts
Front-line
Graphical Data
KPIs
Summary Data
Dimensional Analysis
Transaction AnalysisReport or DW Data

© Eckerson Group LLC
Power User
Casual User
IT-drivenCertified data
Predefined KPIs
Business-drivenAd hoc queriesNew insights
Source Data
Source Data
Staging Area and
Archive
Staging Area and
Archive
Business Intelligence (Reporting &
analysis - DW)
Business Intelligence (Reporting &
analysis - DW)
Analytics Intelligence
(Exploration & Discovery)
Analytics Intelligence
(Exploration & Discovery)
Ad hoc Query, Visualization, and Predictive
Tools
Ad hoc Query, Visualization, and Predictive
Tools
Corporate Dashboards &
Reports (Web and mobile)
Corporate Dashboards &
Reports (Web and mobile)
Continuous Intelligence
(Alerting)
Continuous Intelligence
(Alerting)
Analytics/Search
Streaming ETL QueryKey:
Rules
Conceptual Architecture – Analytical Ecosystem
Query Processing Systems
Intelligence Tools
Analytic Functions
Operational Reporting
Business Users
Data Capture and Pre-processing Systems
Operational Systems
Content In telligence
Sem
anti
c La
yer
Semantic Layer
Dat
a D
irec
tory
RelationalData (ERP, CRM,
Legacy)
Non-relational
Data(Files,
Images, Text, etc.)
On Premise, Cloud, or Hybrid

© Eckerson Group LLC
Governance
20
Models•Source data models•ETL/ELT models•DW/DM models•BI semantic models•DQ/validation rules
Data Warehouse
Data Warehouse
Data Marts
Data Marts
Certified Reports
Certified Reports
Data Mining MartData Mining Mart
BI/DW Team
Statistician Casual User
Data definitionsData policiesData standardsChange processes
Data Dictionary
Data Dictionary
MDM Hub
MDM Hub
Data Governance OfficeChief Data OfficerData ownersData stewardsData Custodians
Hadoop ClusterHadoop Cluster Hive TablesHive
TablesSQL
Tables SQL
Tables Tableau Server
WorkbooksTableau Server
WorkbooksHive
TablesHive
TablesHive/DW
TablesHive/DW
TablesHadoop ClusterHadoop ClusterHadoop ClusterHadoop Cluster Semantic LayerSemantic Layer
Data Scientist Business Analyst Report Analyst Casual+ User
Python/Java/Perl/MR
Data wrangling tools
Visual discovery tools
Top-down governance/modeling
Bottom-up governance/modeling

© Eckerson Group LLC
Governance
21
• Source data models• ETL/ELT models• DW/DM models• BI semantic models• DQ validation/cleansing
BI/DW Team
Data Scientist Business Analyst Report Analyst Casual+ User
Data definitionsData policiesData standardsChange processes
Data Governance OfficeChief Data OfficerData ownersData stewardsData Custodians
Top-down governance/modeling
Bottom-up governance/modelingPublish Insights
and Ad hoc Reports
Organizational Handoff
Technology Handoff
Data Governance
Check
DG Gate
Silver serviceSilver
service
Certified Reports
Self serviceSelf
serviceSpreadMarts
Self-service analytics Self-service integration Self-service BI

© Eckerson Group LLC
Key Challenges: Reconcile Opposites
Top-down
Bottom-up
Speed
Standards
Business IT Dept
Depar
tmen
t
Enterp
rise

© Eckerson Group LLC
Questions?
I’m listening!
The Two WorldsBirst 2-Tier BI and
Analytics
25
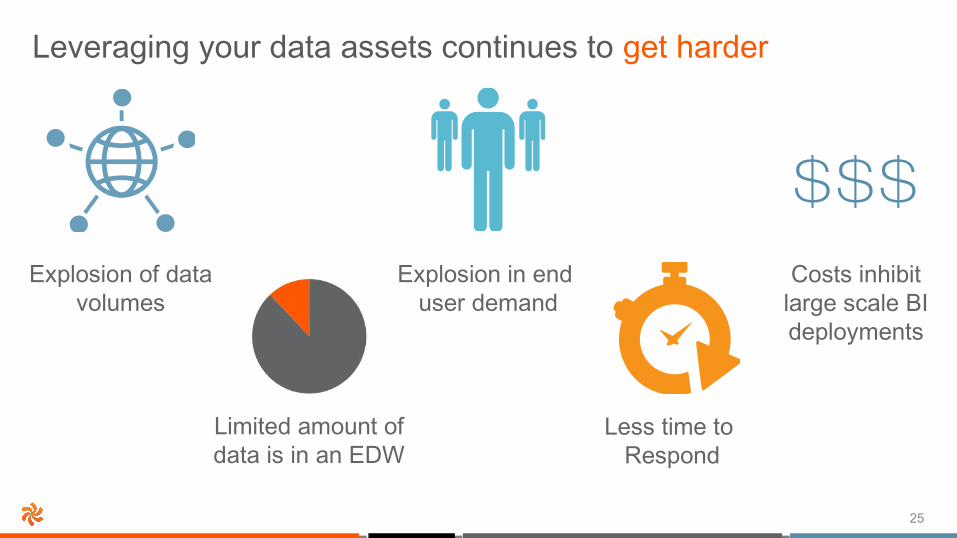
Less time to Respond
Explosion in end user demand
Explosion of data volumes
Costs inhibitlarge scale BIdeployments
$$$
Leveraging your data assets continues to get harder
Limited amount of data is in an EDW
26
Challenges facing IT Leaders
• Are you able to provide a consistent view of the business?
• Do your users have access to all the data they need?
• How many different BI technologies are you supporting today?
• How much time does your team spend developing reports?
• Are you satisfied with the user adoption rates of your BI tools?
• Are you worried users are downloading their own non-standard tools?

27
Discovery BI“Freedom”
• Leaves out non-technical users• Difficult to combine data from multiple sources• Data silos, no unified view• Many people in meetings with different numbers
CENTRALIZED DATAData Warehouse, traditional tools
“Control”
• Not all data available• No end-user self service• High costs and long turn-around timeframes• User frustration is growing
Traditional BI“Control”
The challenges with today’s BI landscape

28
Ente
rpris
eD
ata
Tier
Use
r Dat
a Ti
erBirst: 2-tier Analytics & Automated Data Refinement
Data Warehouse Existing Data Stores Apps + Big Data
User-ready Data Store
AutomatedData Refinement
Business Model and Data Navigator
ERP, CRM, SCM

29
Automated Data Refinement (ADR)*: Making data user ready
*Patent Pending

30
Business Data Gone Wild
En
terp
rise
BI
Exp
erie
nc
e
Enterprise report ing
Predictive analyt ics
Interactivedashboards
Visual discovery
Design studio
Mobile analyt ics
Open ClientInterface
Ente
rpris
eD
ata
Tier
Use
r Dat
a Ti
er
Data Warehouse Existing Data Stores Apps + Big Data
User-ready Data Store
AutomatedData Refinement
Business Model and Data Navigator
ERP, CRM, SCM
Birst: World class enterprise BI and Analytics
31
Plugs into and extends existing EDW, application and discovery investments.
Complete and consistent view of company data available to non technical users. Freedom to analyze all data.
Data is secure, stored cost effectively, and controlled centrally. Deployed in cloud or on premise.
Implement in weeks, not months or years. Significantly lower total cost of ownership.
Benefits of this new unified approach

32
Enter at business use case, deliver rapid resultsBirst ImpactInitiative
2X Increase in Assets under managementSales analytics
75% Uplift in Catalog SalesMarketing analytics
$2M increase in profitsOperational analytics
5X increase in inventory turnsSupply chain analytics
Financial analytics $7.5M increase in revenue
Digital marketing 10% increase in click-through rate
HR Analytics 80% reduction in reporting resources & time

33
Delivering value across multiple use cases

34
Who is Birst?
“Birst has defined the pioneering vision of what a set of cloud BI and analytics
capabilities should look like.”
2015 Business Intelligence and Analytics Magic Quadrant• Leader in Cloud Analytics
• 10,000+ organizations rely on Birst across all verticals
• Founded by Siebel Analytics veterans
• 80+ Strategic Partners

35
Proven results: Birst customers are the happiest
Gartner Group Survey of Business Intelligence Customers, Aug 2014
Product Evaluation Frequency(Number of Unique Quarterly Pageviews)
Full-Stack Business Intelligence Platforms TrustMap™
5.0
4.5
4.0
3.5
3.0
2.50 2,400 4,800 7,200 9,600 12,000
Aver
age
Use
r-R
atin
g
Trust Radius Survey of Full Suite BI Clients, December 2014
“ No. 1 in product functional ity and customer (that is, product qual ity, no problems with software, support) and sales experience.”

36
Our business value is different.Operationalizing more data, one business case at a time. Every person, every decision, made better.
Our technology is different .Cloud BI. 2-tier Analytics and BI.Unique Automated Data Refinement.
Our point of view is different.Not just about the front end -- the data is the critical piece. Agility and consistency of data are key.
In Conclusion: Birst is different!

37
Experience 2-tier Analytics
• Learn more about Birst– 866-940-1496 / 415-766-4800– [email protected]
• Join a live product demo– Tuesdays and Thursdays 11am PT/2pm ET– Wednesdays at 12:30pm BST
• Coming soon: Birst 2-tier whitepaper– How Birst enables a centralized and
decentralized model for BI

38
Thanks!