Embed Size (px)
Citation preview
© 2016, Amazon Web Services, Inc. or its Affiliates. All rights reserved.
Andre Dufour, AWS Auto Scaling
Hook Hua, Jet Propulsion Laboratory
December 2016
Auto ScalingCMP201
The Fleet Management Solution for Planet Earth
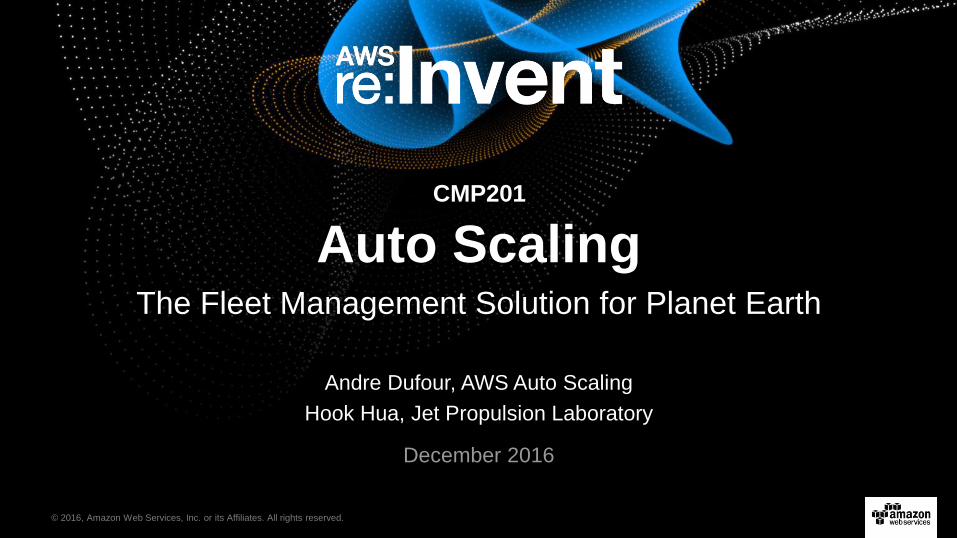
Availability with fleet management
Keeping up with demand with dynamic scaling
Future of Auto Scaling
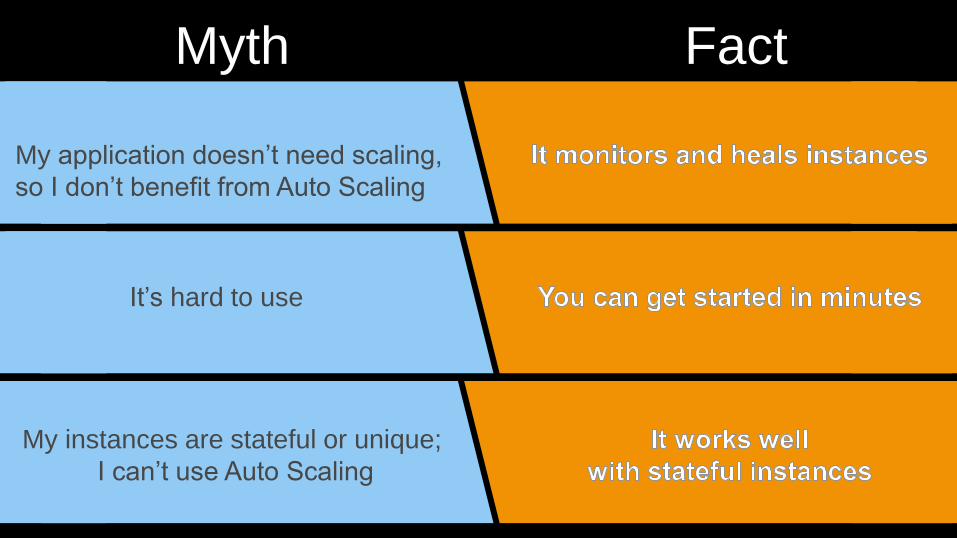
Myth Fact
My application doesn’t need scaling,
so I don’t benefit from Auto Scaling
It’s hard to use
My instances are stateful or unique;
I can’t use Auto Scaling
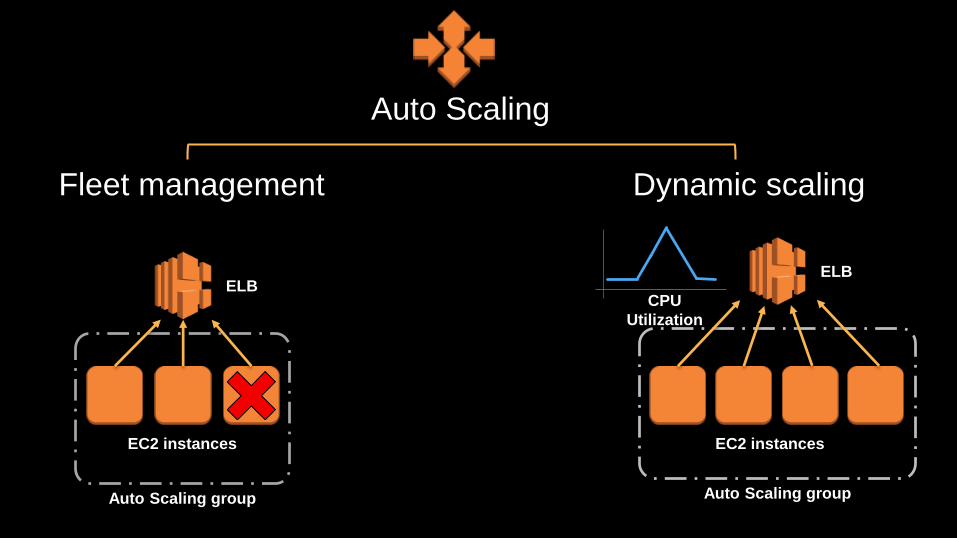
Auto Scaling groupAuto Scaling group
Auto Scaling
Fleet management Dynamic scaling
ELB
EC2 instances
ELB
CPU
Utilization
EC2 instances
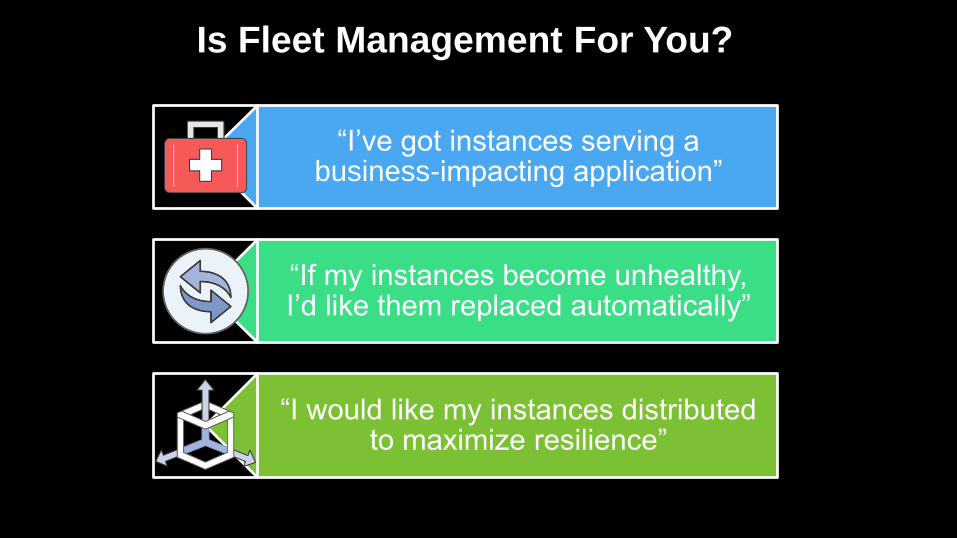
Is Fleet Management For You?
“I’ve got instances serving a business-impacting application”
“If my instances become unhealthy, I’d like them replaced automatically”
“I would like my instances distributed to maximize resilience”

Demo
Dynamic Scaling
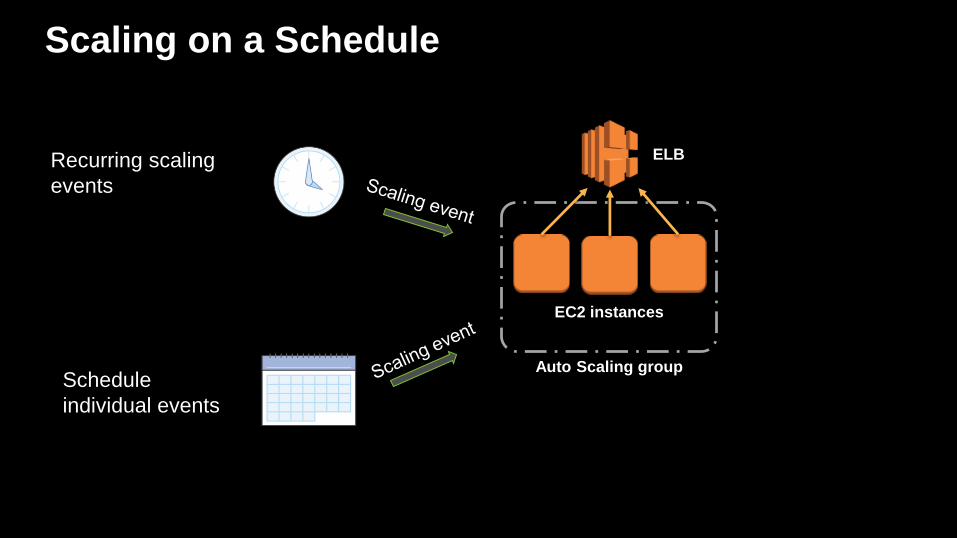
Scaling on a Schedule
Recurring scaling
events
Schedule
individual events
Auto Scaling group
ELB
EC2 instances
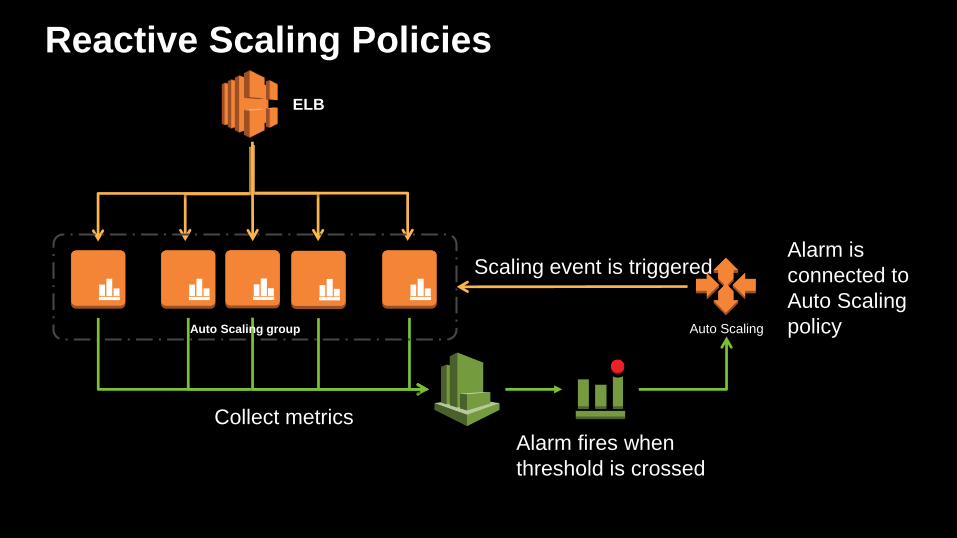
Reactive Scaling Policies
Collect metrics
Alarm fires when
threshold is crossed
Auto Scaling
Alarm is
connected to
Auto Scaling
policy
Scaling event is triggered
ELB
Auto Scaling group
© 2016, Amazon Web Services, Inc. or its Affiliates. All rights reserved.
JPL: Auto Scaling Advantage Advanced Rapid Imaging and Analysis
© 2016 California Institute of Technology. Government sponsorship acknowledged.
Reference herein to any specific commercial product, or service by trade name, trademark, manufacturer, or otherwise, does not constitute or
imply its endorsement by the United States Government or the Jet Propulsion Laboratory, California Institute of Technology.
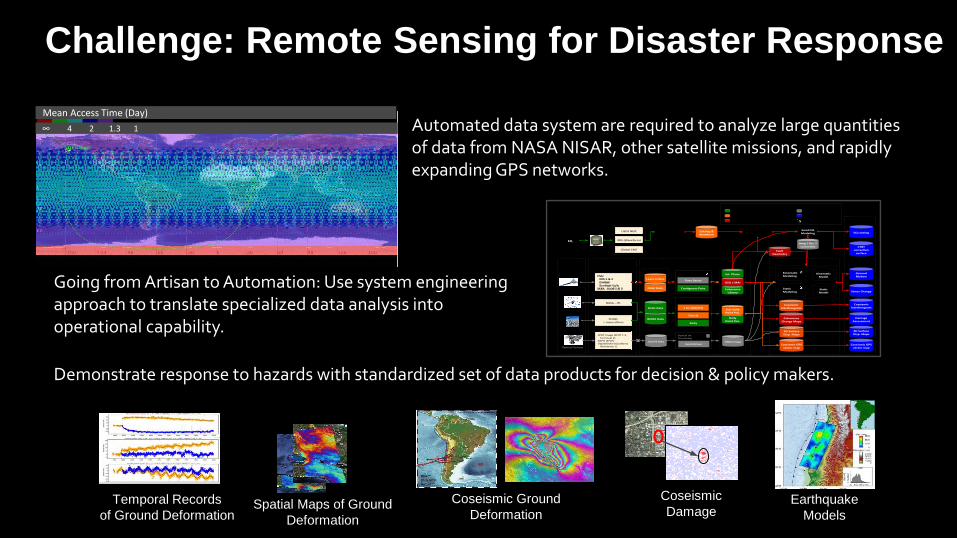
Challenge: Remote Sensing for Disaster Response
Automated data system are required to analyze large quantities of data from NASA NISAR, other satellite missions, and rapidly expanding GPS networks.
Mean Access Time (Day)
∞ 4 2 1.3 1
Going from Artisan to Automation: Use system engineering approach to translate specialized data analysis into operational capability.
OrbitData CoherenceLibrary
AZO/MAI
EQ
Kinema cModeling
Level-0Data
Kinema cModel
Catalog&Waveform
Sta cModel
InSARProcessing
TimeSeries
Con guousPairs Sta cModeling
Int.Phase
StressChange
III.Rou neDataProcessing
CoherenceChangeMaps
Seismometer
RadarSensor
I.Geode cSensors
II.DataProviders/Archives
GlobalCMT
USGSNEIC
IRIS(Waveform)
FaultGeometry
Mw>5.5 Mw>6.5Yes
Yes
No SmallEQModeling
Amp/Arr.Tcorrec on
IV.Triggered
Legend
Readytobeused(>70%readiness)
Needmodifica on(30–70%readiness)
Doesn’texist(<30%readiness) Latency/Bo leneck
OutofscopeofR&TD
CustomerProducts
Level-0Data
Op calIm.Processing
OffsetImageEventDriven
Op calSensor
SPOTImage(SPOT1-5,Formosat2)
NSPO(SPOT)DigitalGlobe(Quickbird,Worldview1)
RINEXData
GPSProcessing
DailyPointPos.
1Hz(GDGPS)
Hourly
Daily
GPSSta on
OrbitDataSub-dailyPointPos.
SOPAC+manyothers
GPSConstella on
NASA-JPL
V.CustomerProducts
DamageAssessment
3DSurfaceDisp.Maps
GroundMo on
3DSurfaceDisp.Maps
EQcatalog
CTBTcorrec onsurface
CoseismicInterferogram
CoseismicGPSvectormap
CoseismicInterferogram
CoseismicGPSvectormap
Temporal Records
of Ground DeformationSpatial Maps of Ground
Deformation
Earthquake
Models
Coseismic Ground
Deformation
Demonstrate response to hazards with standardized set of data products for decision & policy makers.
Coseismic
Damage
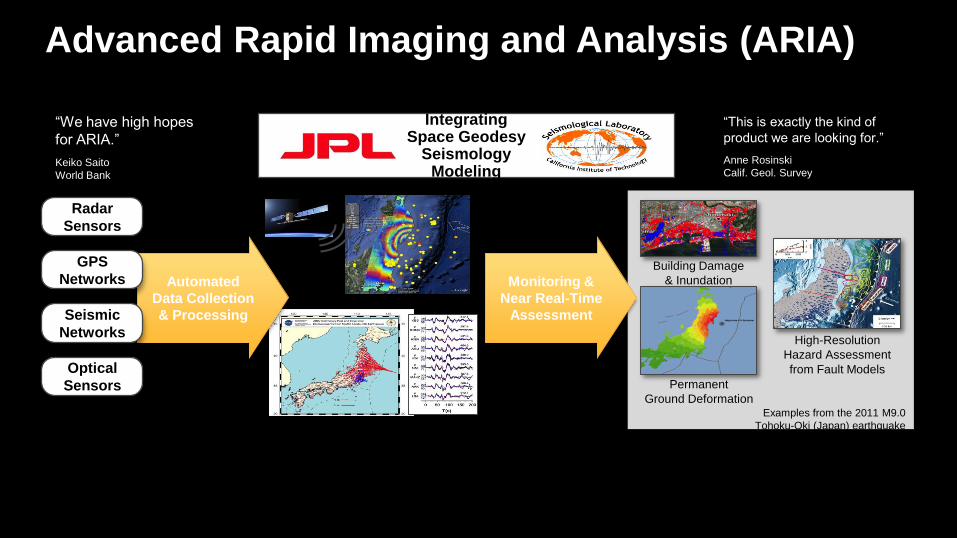
Automated
Data Collection
& Processing
IntegratingSpace Geodesy
SeismologyModeling
Radar
Sensors
Building Damage
& Inundation
Radar
GPS Seismology
Permanent
Ground Deformation
High-Resolution
Hazard Assessment
from Fault Models
Monitoring &
Near Real-Time
Assessment
“We have high hopes
for ARIA.”
Keiko Saito
World Bank
“This is exactly the kind of
product we are looking for.”
Anne Rosinski
Calif. Geol. Survey
Examples from the 2011 M9.0
Tohoku-Oki (Japan) earthquake
GPS
Networks
Seismic
Networks
Optical
Sensors
Advanced Rapid Imaging and Analysis (ARIA)
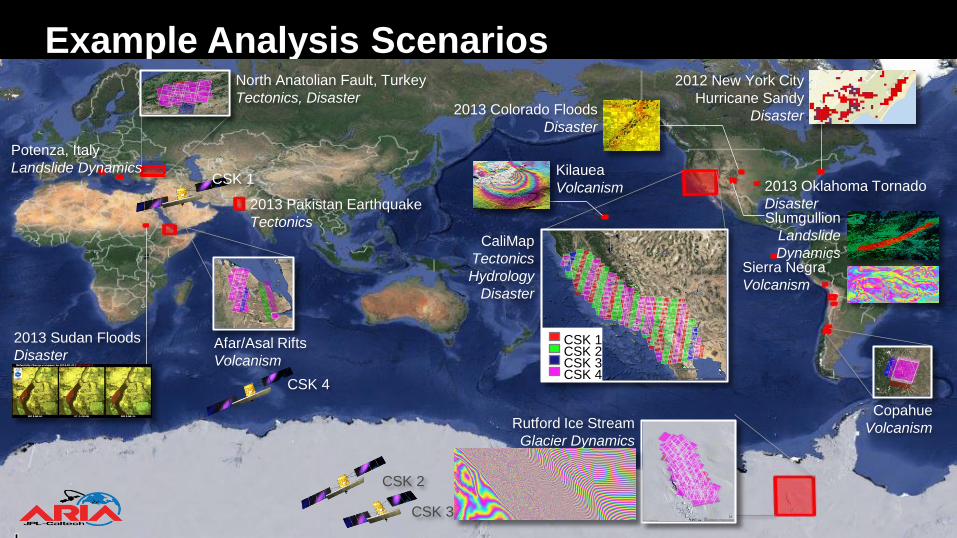
Example Analysis Scenarios
Afar/Asal Rifts
Volcanism
2013 Sudan Floods
Disaster
CaliMap
Tectonics
Hydrology
Disaster
Copahue
VolcanismRutford Ice Stream
Glacier Dynamics
2013 Oklahoma Tornado
Disaster
2012 New York City
Hurricane Sandy
Disaster2013 Colorado Floods
Disaster
2013 Pakistan Earthquake
Tectonics
Sierra Negra
Volcanism
CSK 1CSK 2CSK 3CSK 4
North Anatolian Fault, Turkey
Tectonics, Disaster
Kilauea
Volcanism
Potenza, Italy
Landslide Dynamics
Slumgullion
Landslide
Dynamics
CSK 1
CSK 4
CSK 3
CSK 2
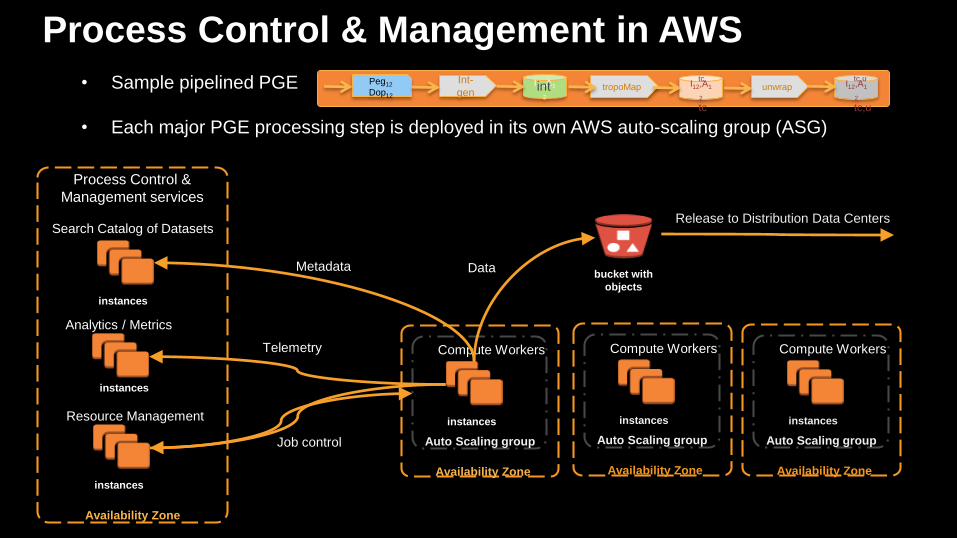
• Sample pipelined PGE
• Each major PGE processing step is deployed in its own AWS auto-scaling group (ASG)
Process Control & Management in AWS
Availability Zone
Auto Scaling group
instances
Compute Workers
Availability Zone
Auto Scaling group
instances
Compute Workers
Availability Zone
Auto Scaling group
instances
Compute Workers
bucket with
objects
Metadata Data
Availability Zone
instances
Process Control &
Management services
Search Catalog of Datasets
instances
Resource Management
instances
Analytics / Metrics
Release to Distribution Data Centers
Peg12
Dop12
Int-
genI12,A1
2
tropoMap I12,A1
2
tc
tc
unwrap I12,A1
2
tc,u
tc,u
int
Telemetry
Job control
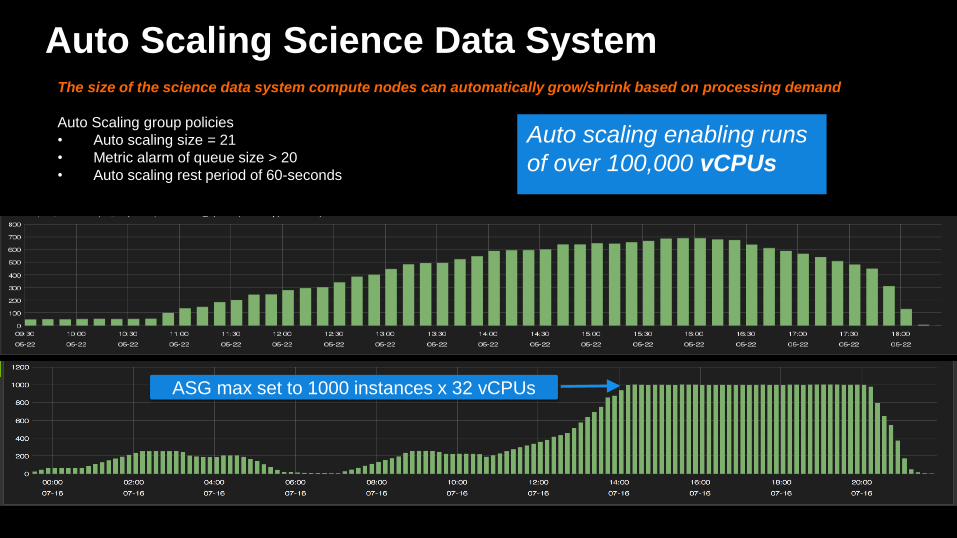
Auto Scaling Science Data SystemThe size of the science data system compute nodes can automatically grow/shrink based on processing demand
Auto Scaling group policies
• Auto scaling size = 21
• Metric alarm of queue size > 20
• Auto scaling rest period of 60-seconds
ASG max set to 1000 instances x 32 vCPUs
Auto scaling enabling runs
of over 100,000 vCPUs
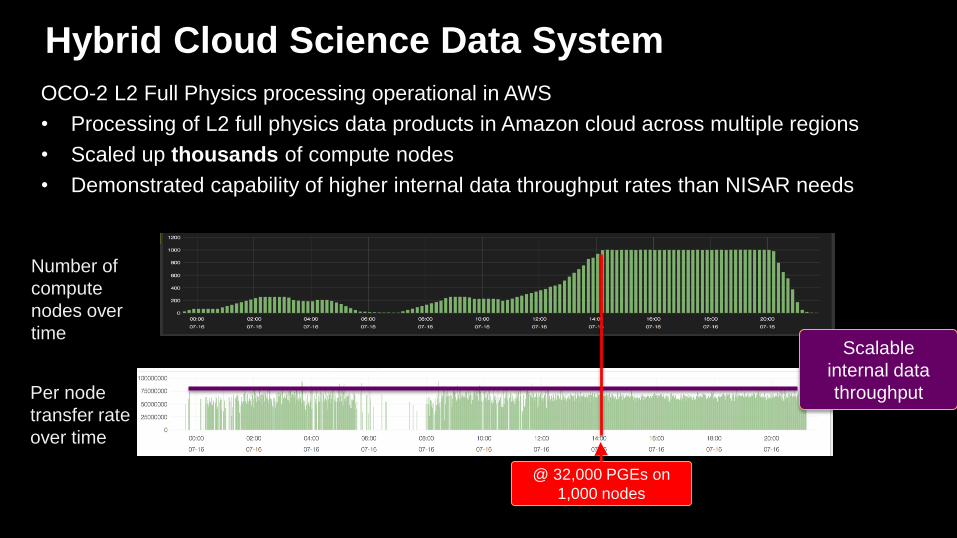
Hybrid Cloud Science Data System
OCO-2 L2 Full Physics processing operational in AWS
• Processing of L2 full physics data products in Amazon cloud across multiple regions
• Scaled up thousands of compute nodes
• Demonstrated capability of higher internal data throughput rates than NISAR needs
Number of
compute
nodes over
time
Per node
transfer rate
over time
Scalable
internal data
throughput
@ 32,000 PGEs on
1,000 nodes
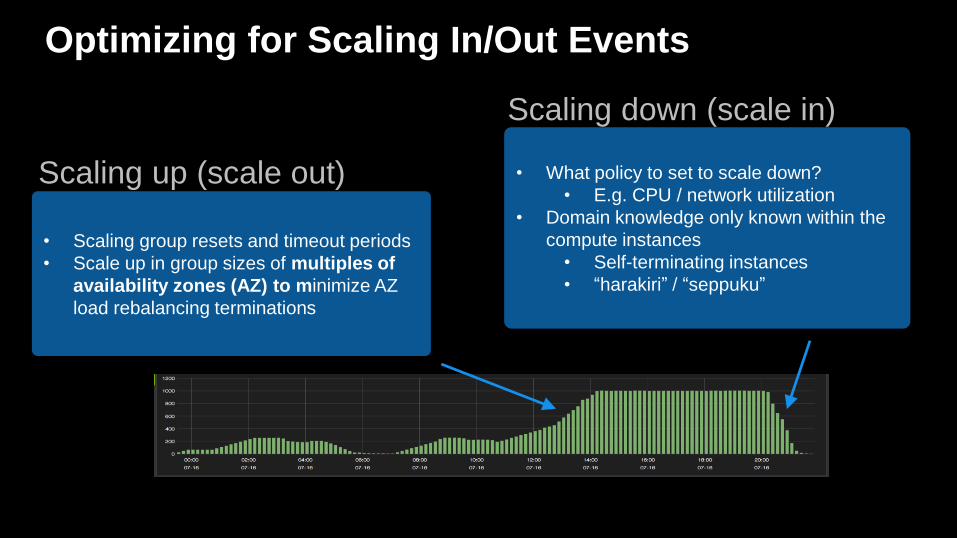
Optimizing for Scaling In/Out Events
• Scaling group resets and timeout periods
• Scale up in group sizes of multiples of
availability zones (AZ) to minimize AZ
load rebalancing terminations
Scaling up (scale out) • What policy to set to scale down?
• E.g. CPU / network utilization
• Domain knowledge only known within the
compute instances
• Self-terminating instances
• “harakiri” / “seppuku”
Scaling down (scale in)
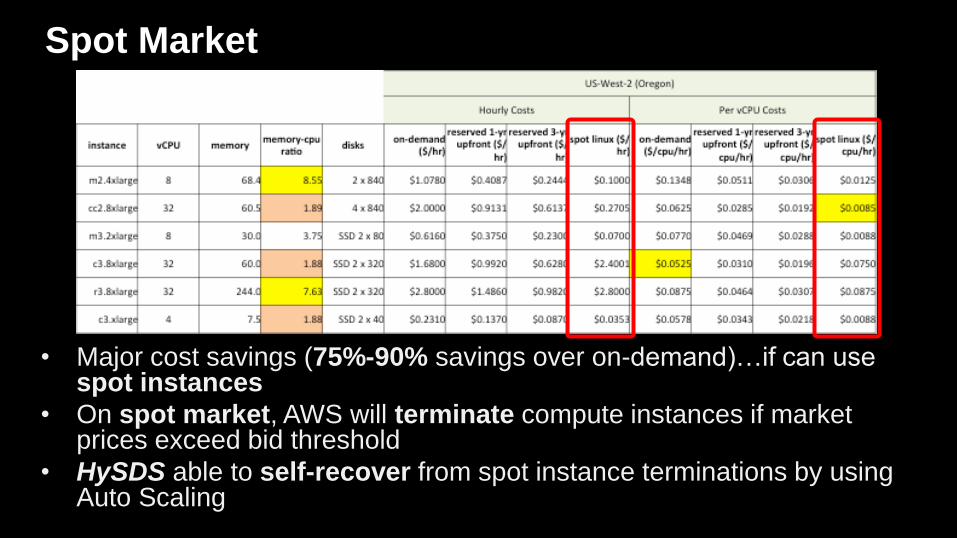
Spot Market
• Major cost savings (75%-90% savings over on-demand)…if can use spot instances
• On spot market, AWS will terminate compute instances if market prices exceed bid threshold
• HySDS able to self-recover from spot instance terminations by using Auto Scaling
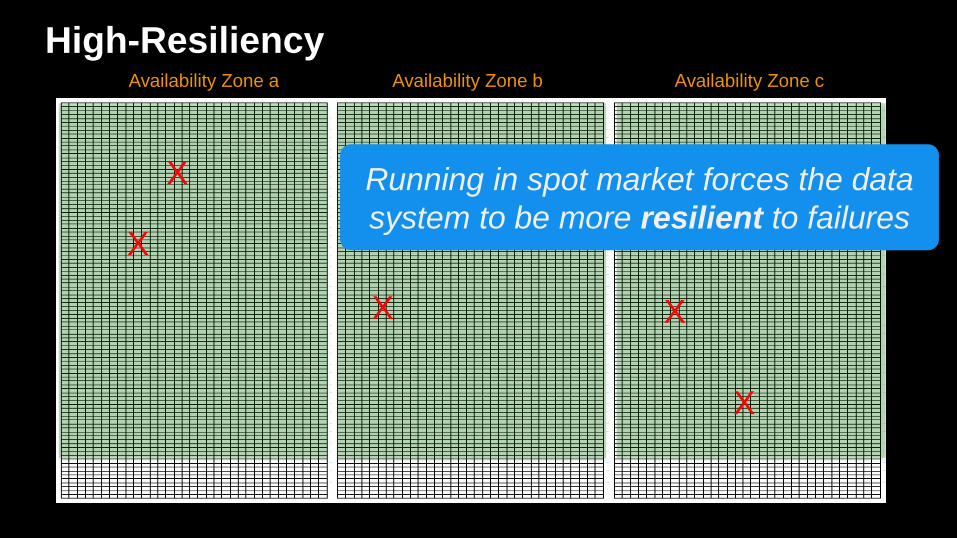
High-Resiliency
X
X
X X
X
Availability Zone a Availability Zone b Availability Zone c
Running in spot market forces the data
system to be more resilient to failures
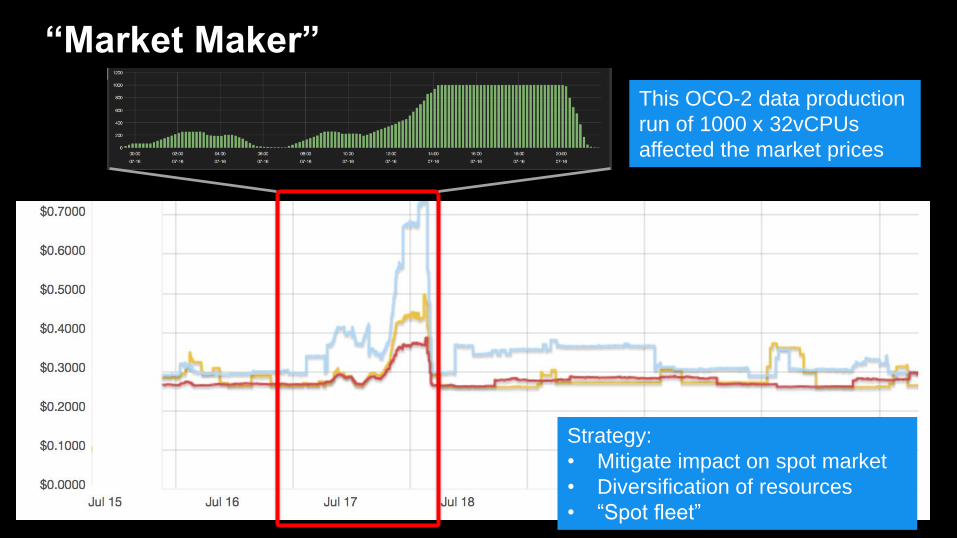
“Market Maker”
This OCO-2 data production
run of 1000 x 32vCPUs
affected the market prices
Strategy:
• Mitigate impact on spot market
• Diversification of resources
• “Spot fleet”
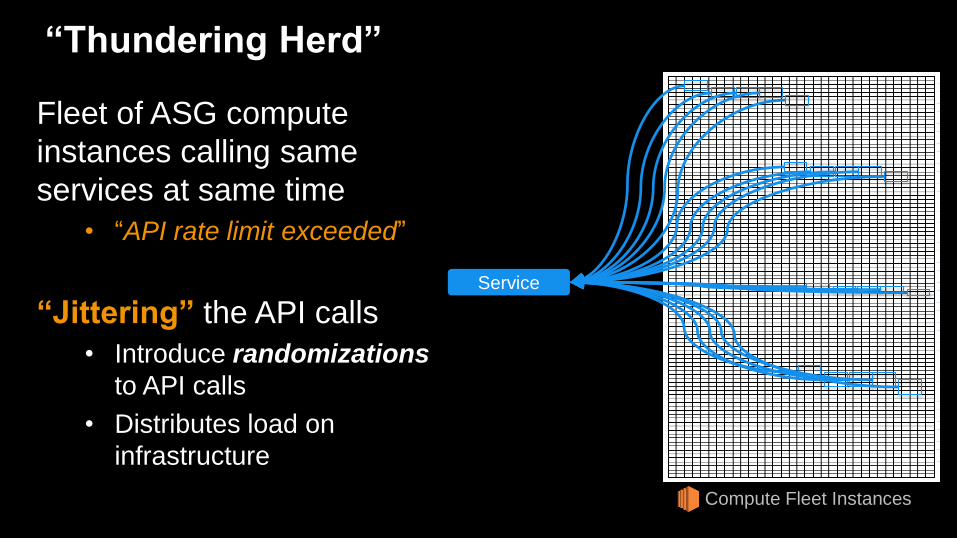
“Thundering Herd”
Fleet of ASG compute
instances calling same
services at same time
• “API rate limit exceeded”
“Jittering” the API calls
• Introduce randomizations
to API calls
• Distributes load on
infrastructure
Service
Compute Fleet Instances
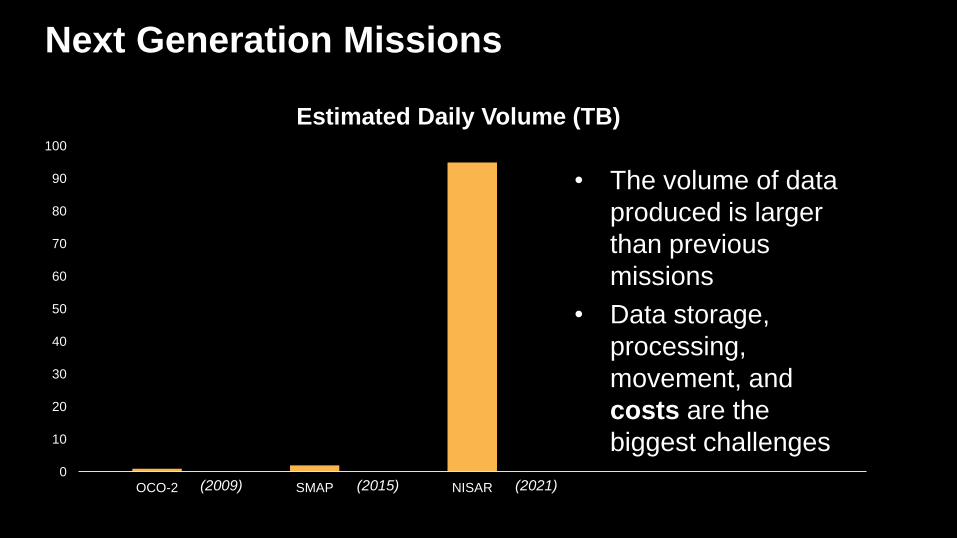
Next Generation Missions
0
10
20
30
40
50
60
70
80
90
100
OCO-2 SMAP NISAR
Estimated Daily Volume (TB)
• The volume of data
produced is larger
than previous
missions
• Data storage,
processing,
movement, and
costs are the
biggest challenges
(2021)(2009) (2015)
Future of Auto Scaling:
Application Auto Scaling
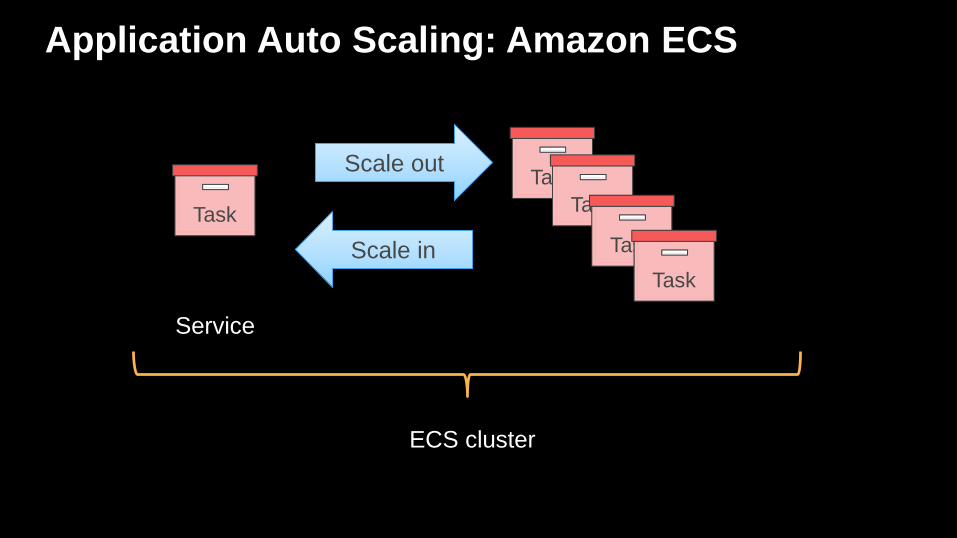
Application Auto Scaling: Amazon ECS
Scale out
Scale in
Service
ECS cluster
Task
Task
Task
Task
Task
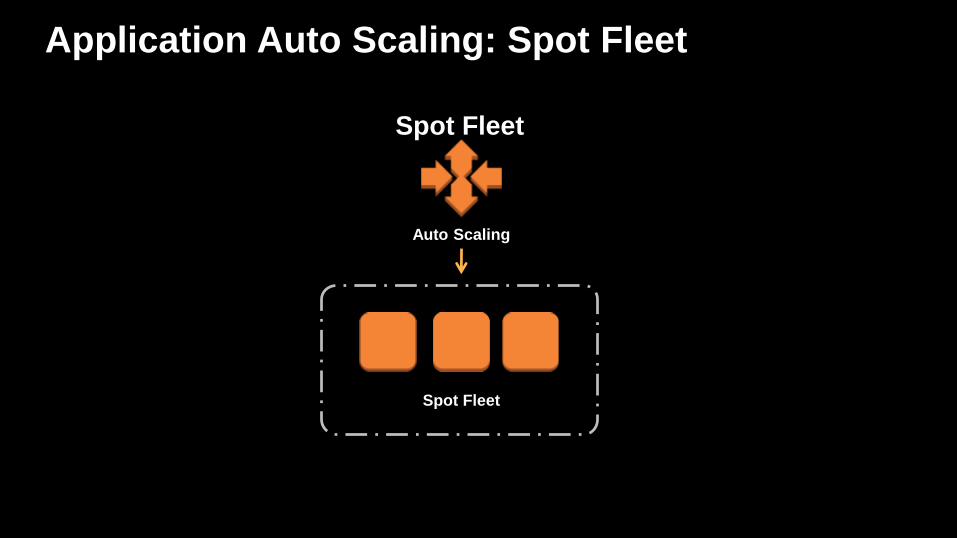
Application Auto Scaling: Spot Fleet
Spot Fleet
Spot Fleet
Auto Scaling
Application Auto Scaling: Amazon EMR
EMR Cluster
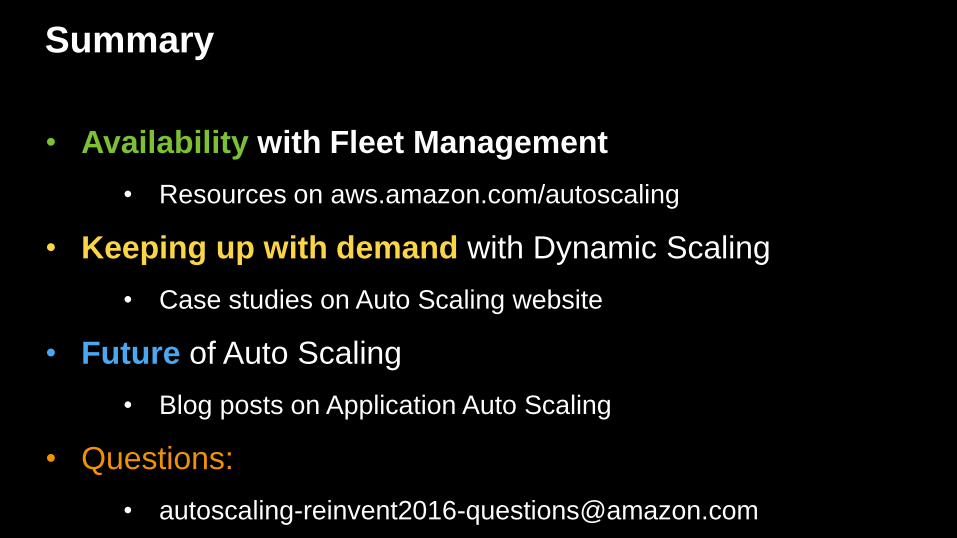
Summary
• Availability with Fleet Management
• Resources on aws.amazon.com/autoscaling
• Keeping up with demand with Dynamic Scaling
• Case studies on Auto Scaling website
• Future of Auto Scaling
• Blog posts on Application Auto Scaling
• Questions:
Thank you!
Additional authors: Hook Hua1, Gerald Manipon1, Michael Starch1, Lan Dang1, Justin Linick1, Sang-Ho Yun1, Gian
Franco Sacco1, Piyush Agram1, Susan Owen1, Brian Bue1,, Eric Fielding1, Paul Lundgren1, Angelyn Moore1, Paul
Rosen1, Zhen Liu1, Eric Gurrola1, Tom Farr1, Vincent Realmuto1, Frank Webb1, Mark Simons2, Pietro Milillo1
1 Jet Propulsion Laboratory2 California Institute of Technology
Remember to complete
your evaluations!


![[AWS re:invent 2013 Report] Amazon WorkSpaces](https://img.pdfslide.tips/doc/110x75/5565fe62d8b42a2a4d8b4cca/aws-reinvent-2013-report-amazon-workspaces.jpg)


![[AWS re:invent 2013 Report] Amazon AppStream](https://img.pdfslide.tips/doc/110x75/5565fd22d8b42aa6628b45b3/aws-reinvent-2013-report-amazon-appstream.jpg)