Embed Size (px)
Citation preview

Facing the climate challenge: Implica0ons of the 2 degree limit
Jonathan Koomey Research Fellow, Steyer-‐Taylor Center for Energy Policy
and Finance, Stanford University [email protected] hJp://www.koomey.com
Engineering and Climate Change, Professor Leslie Field Stanford University September 24, 2013
1 Copyright Jonathan Koomey 2013
The world is warming and humans are responsible
“A strong, credible body of scien0fic evidence shows that climate change is occurring, is caused largely by human ac0vi0es, and poses significant risks for a broad range of human and natural systems. . . . Some scien0fic conclusions or theories have been so thoroughly examined and tested, and supported by so many independent observa0ons and results, that their likelihood of subsequently being found to be wrong is vanishingly small. Such conclusions and theories are then regarded as seJled facts. This is the case for the conclusions that the Earth system is warming and that much of this warming is very likely due to human ac0vi0es.”
US Na0onal Academy of Sciences. 2010. Advancing the Science of Climate Change
2 Copyright Jonathan Koomey 2013

Historical global C emissions
Sources: Carbon Dioxide Information Analysis Center (CDIAC), plotted in Cold Cash, Cool Climate.
Copyright Jonathan Koomey 2013 3
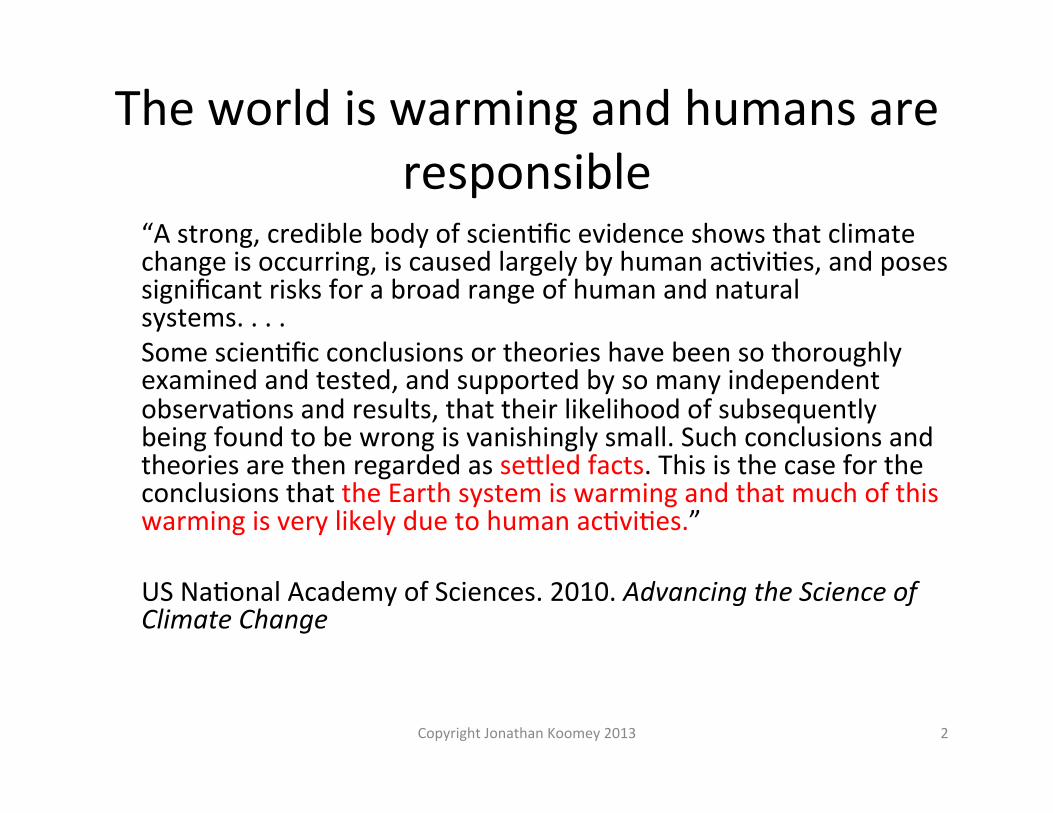
Big jump in CO2 concentra0ons from fossil fuels and land use changes
Sources: Vostok and Lawdome ice core data, plus measured concentrations from the Carbon Dioxide Information Analysis Center, plotted in Cold Cash, Cool Climate
Copyright Jonathan Koomey 2013 4

A closer look at the last 12,000 years Sources: Vostok and Lawdome ice core data, plus measured concentrations from the Carbon Dioxide Information Analysis Center, plotted in Cold Cash, Cool Climate
Copyright Jonathan Koomey 2013 5

Global surface temperatures have risen in the last century
Source: The Copenhagen Diagnosis 2009 Copyright Jonathan Koomey 2013 6
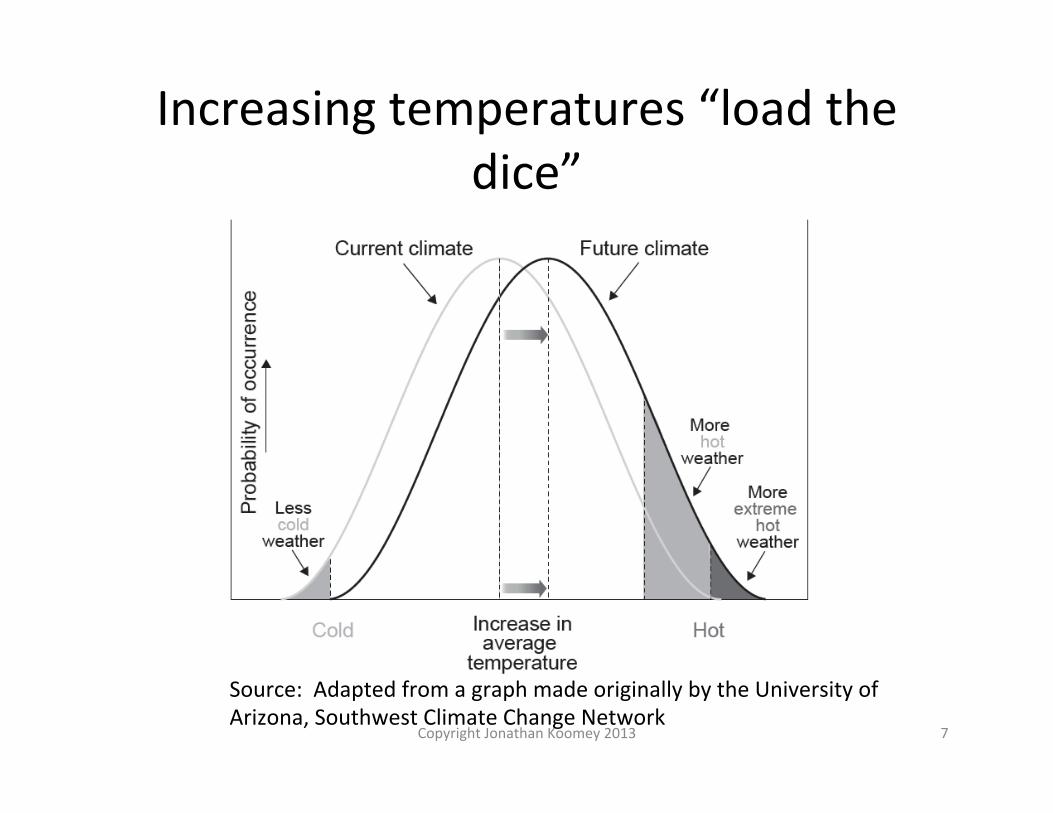
Increasing temperatures “load the dice”
Source: Adapted from a graph made originally by the University of Arizona, Southwest Climate Change Network
Copyright Jonathan Koomey 2013 7

What the data show
8
Source: The New Climate Dice: Public Percep=on of Climate Change. James Hansen, Makiko Sato, and Reto Ruedy. August 2012. hJp://www.giss.nasa.gov/research/briefs/hansen_17/. Data are for Northern Hemisphere. X-‐axes in graphs below are in standard devia0ons, not degrees C.
Copyright Jonathan Koomey 2013

Percent of US land area subject to 1 day precipita0on extremes
Source: NCDC/NOAA 2011 Copyright Jonathan Koomey 2013 9

No-‐policy case carbon dioxide concentra0ons to 2100
Source: Sokolov et al. 2009 for projected concentrations and ice core and directly measured data for historical numbers.
Copyright Jonathan Koomey 2013 10

No-‐policy case greenhouse gas concentra0ons to 2100 (all gases)
Copyright Jonathan Koomey 2013 11
Source: Sokolov et al. 2009 for projected concentrations and ice core and directly measured data for historical numbers.
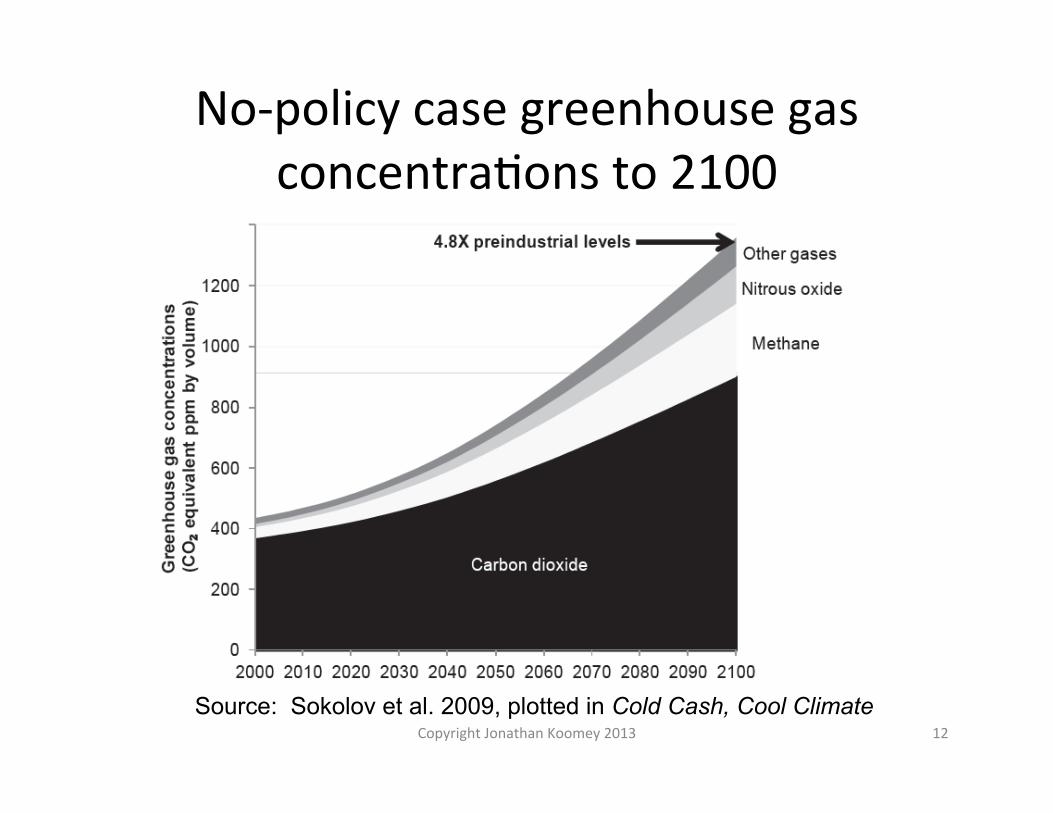
No-‐policy case greenhouse gas concentra0ons to 2100
Source: Sokolov et al. 2009, plotted in Cold Cash, Cool Climate Copyright Jonathan Koomey 2013 12

Current trends = 5 C degrees by 2100, with no end in sight
Adapted from Copenhagen Diagnosis 2009, with MIT data taken from Sokolov et al. 2009. MIT climate sensitivity is 2.9 degrees C, but warming by 2100 doesn’t reflect the full warming impact because full equilibration takes centuries.
13 Copyright Jonathan Koomey 2013

Fossil fuel scarcity will not constrain carbon emissions
Source: Lower bound resource estimates from the IIASA Global Energy Assessment 2012 + Sokolov et al. 2009 (fossil emissions only).
14 Copyright Jonathan Koomey 2013

What can we do?
15 Copyright Jonathan Koomey 2013

Our options
• Adapt–modify human systems to make them more flexible and resilient
• Suffer–accept what comes (but what comes is likely to be costly in lives, ecosystem damage, and economic disruption)
• Mitigate–reduce emissions
16 Copyright Jonathan Koomey 2013

Questions about mitigation options • How much carbon will they save? • How much will they cost? • Are they feasible
– technically? (science and technology) – logistically? (implementation and
policy) – politically? (social will and equity)
17 Copyright Jonathan Koomey 2013

18
Cost-‐benefit analysis: the standard approach
Copyright Jonathan Koomey 2013

The forecas0ng quandary
• Economics ≠ physics: we need to act, but it’s impossible to calculate costs and benefits in an accurate way
• Implica0on: the conven0onal model of full benefit-‐cost analysis before ac0ng is not adequate to address this problem
19 Copyright Jonathan Koomey 2013

An evolu0onary, path-‐dependent view
• There is no “op0mal path”, but there are many possible alterna0ve paths – We can’t plan or know everything about the path ahead but the warming limit defines the broad outlines of success
• Our choices now affect our op0ons later • Need to
– invest in a broad pornolio of op0ons – fail fast – modify plans dynamically – learn as fast as we can
20 Copyright Jonathan Koomey 2013
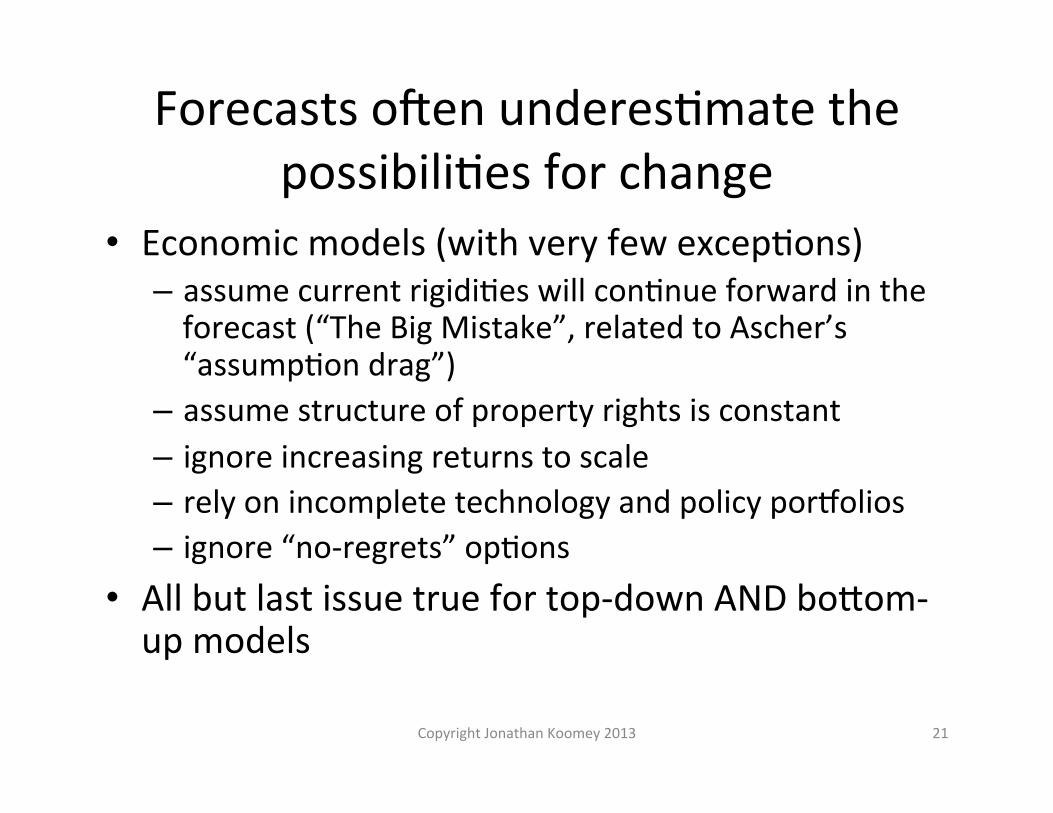
Forecasts ooen underes0mate the possibili0es for change
• Economic models (with very few excep0ons) – assume current rigidi0es will con0nue forward in the forecast (“The Big Mistake”, related to Ascher’s “assump0on drag”)
– assume structure of property rights is constant – ignore increasing returns to scale – rely on incomplete technology and policy pornolios – ignore “no-‐regrets” op0ons
• All but last issue true for top-‐down AND boJom-‐up models
21 Copyright Jonathan Koomey 2013

An alterna0ve approach
• Define a warming limit (e.g. 2 C degrees above preindustrial levels)
• Determine the total greenhouse gases we can then emit to stay under that limit
• Define pathways that meet that constraint • Assess what we’d need to do achieve that pathway (# of power plants, rate of improvement in energy efficiency, etc)
• Try op0ons, fail fast, alter course as needed
22 Copyright Jonathan Koomey 2013

2 C degree warming limit • Keeps global T within humanity’s experience • Likely avoids the worst of the posi0ve feedbacks • Implies cumula0ve GHG emissions “budget” • Limit itself now widely accepted (e.g., G8 in 2009), but implica0ons s0ll not well known – Global emissions must turn down this decade, down 50% by 2050, more soon aoerwards
– Wai0ng has a real cost – We must act quickly on many fronts
• It’s Sputnik, not Apollo – We can’t burn it all
• C Storage not prac0cally relevant for decades, if ever
23 Copyright Jonathan Koomey 2013

Delaying makes no sense in the warming limit context
• When we act makes a difference • Delaying ac0on on climate
– eats up the budget – makes required reduc0ons more difficult and costly later
– sacrifices learning and reduces possibili0es for future ac0on
• Remember, energy techs don’t ∆ fast
24 Copyright Jonathan Koomey 2013

There’s no 0me to waste
25
Source: The Copenhagen Diagnosis, 2009 Copyright Jonathan Koomey 2013

Most 2050 infrastructure built between now and 2050
26 Copyright Jonathan Koomey 2013

Working toward the limit • Like strategic planning, not forecas0ng • e.g., to meet some frac0on of the target
– how many emission-‐free power plants would we have to build and how much capital would that require?
– how fast would efficiency need to improve given expected rates of economic growth?
– what ins0tu0onal changes would be needed to accelerate the rate of implementa0on?
• A way to organize our thinking about solu0ons to the problem
27 Copyright Jonathan Koomey 2013

Mee0ng constraints of the safer climate case won’t be easy
Source: Lower bound resource estimates from the IIASA Global Energy Assessment 2012 + calcs in Cold Cash, Cool Climate (fossil emissions only). 28 Copyright Jonathan Koomey 2013

Summary • Warming limit approach is similar to how businesses make big strategic decisions
• Focus is on risk reduc0on, experimenta0on, evalua0on, innova0on and cost effec0veness, not on knowing “op0mal” path in advance (impossible!)
• Science points to 2 deg C limit but ul0mate choice is a poli0cal judgment – Declare value judgment up front (not buried in black box models, as is customary)
• Implies rapid reduc0ons and keeping most fossil fuels in the ground (requires rapid innova0ons in technologies AND behavior/ins0tu0ons)
29 Copyright Jonathan Koomey 2013

Summary (con0nued)
• Immediate implementa0on is essen0al (can’t just wait and see while doing R&D) – Learning by doing only happens if we do!
• Exis0ng low carbon resources are plen0ful but we’ll need new innova0ons in later decades to keep reduc0ons on track
• Start small. Think big. Get going!
30 Copyright Jonathan Koomey 2013

“The best way to predict the future is to invent it.” –Alan Kay
31 Copyright Jonathan Koomey 2013

References • Allison, et al. 2009. The Copenhagen Diagnosis, 2009: Upda=ng the World on the Latest Climate Science. Sydney, Australia: The
University of New South Wales Climate Change Research Centre (CCRC). • Caldeira, Ken, Atul K. Jain, and Mar0n I. Hoffert. 2003. "Climate Sensi0vity Uncertainty and the Need for Energy Without CO2 Emission "
Science. vol. 299, no. 5615. pp. 2052-‐2054. <hJp://www.sciencemag.org/cgi/content/abstract/299/5615/2052> • DeCanio, Stephen J. 2003. Economic Models of Climate Change: A Cri=que. Basingstoke, UK: Palgrave-‐Macmillan. • Brown, Marilyn A., Mark D. Levine, Walter Short, and Jonathan G. Koomey. 2001. "Scenarios for a Clean Energy Future." Energy Policy
(Also LBNL-‐48031). vol. 29, no. 14. November. pp. 1179-‐1196. • Gritsevskyi, Andrii, and Nebojsa Nakicenovic. 2000. "Modeling uncertainty of induced technological change." Energy Policy. vol. 28, no.
13. November. pp. 907-‐921. • Koomey, Jonathan. Tes0mony of Jonathan Koomey, Ph.D. for a hearing on "Efficiency: The Hidden Secret to Solving Our Energy Crisis".
Joint Economic CommiJee of the U.S. Congress. U.S. Congress. Washington, DC: U.S. Congress. July 30, 2008. <hJp://www.jec.senate.gov/index.cfm?FuseAc0on=Hearings.HearingsCalendar&ContentRecord_id=6fc51d63-‐e7e2-‐82b7-‐10c3-‐3faa2c150115>
• Koomey, Jonathan G. Cold Cash, Cool Climate: Science-‐Based Advice for Ecological Entrepreneurs. Burlingame, CA: Analy0cs Press, 2012.
• Krause, Floren0n, Wilfred Bach, and Jonathan G. Koomey. 1992. Energy Policy in the Greenhouse. NY, NY: John Wiley and Sons. (1989 edi0on of this book downloadable at <hJp://files.me.com/jgkoomey/9jzwgj>)
• Meinshausen, Malte, Nicolai Meinshausen, William Hare, Sarah C. B. Raper, Katja Frieler, Reto Knu|, David J. Frame, and Myles R. Allen. 2009. "Greenhouse-‐gas emission targets for limi0ng global warming to 2 degrees C." Nature. vol. 458, April 30. pp. 1158-‐1162. <hJp://www.nature.com/nature/journal/v458/n7242/full/nature08017.html>
• Pacala, S., and Rob Socolow. 2004. "Stabiliza0on Wedges: Solving the Climate Problem for the Next 50 Years with Current Technologies " Science. vol. 305, no. 5686. August 13. pp. 968-‐972. [hJp://www.sciencemag.org/cgi/content/abstract/305/5686/968]
• Williams, James H., Andrew DeBenedic0s, Rebecca Ghanadan, Amber Mahone, Jack Moore, William R. Morrow, Snuller Price, and Margaret S. Torn. 2011. "The Technology Path to Deep Greenhouse Gas Emissions Cuts by 2050: The Pivotal Role of Electricity." Science. November 24. [hJp://www.sciencemag.org/content/early/2011/11/22/science.1208365.abstract]
32 Copyright Jonathan Koomey 2013

Extra slides
33 Copyright Jonathan Koomey 2013

Contributors to climate change through 2005
Source: IPCC 2007 (Working Group 1, the Physical Science Basis) Copyright Jonathan Koomey 2013 34

Impacts of Uncertainty, Learning, and Spillovers (IPCC AR4 , 2007)
Figure 2.2. Emissions impacts of exploring the full spectrum of technological uncertainty in a given scenario without climate policies. Rela=ve frequency (percent) of 130,000 scenarios of full technological uncertainty regrouped into 520 sets of technology dynamics with their corresponding carbon emissions (GtC) by 2100 obtained through numerical model simula=ons for a given scenario of intermediary popula=on, economic output, and energy demand growth. Also shown is a subset of 13,000 scenarios grouped into 53 sets of technology dynamics that are all "op=mal" in the sense of sa=sfying a cost minimiza=on criterion in the objec=ve func=on. The corresponding distribu=on func=on is bi-‐modal, illustra=ng "technological lock-‐in" into low or high emissions futures respec=vely that arise from technological interdependence and spillover effects. Baseline emissions are an important determinant for the feasibility and costs of achieving par=cular climate targets that are ceteris paribus cheaper with lower baseline emissions. Adapted from Gritsevskyi and Nakicenovic, 2000.
35 Copyright Jonathan Koomey 2013

Decanio concludes…
“The applica0on of general equilibrium analysis to climate policy has produced a kind of specious precision, a situa0on in which the assump0ons of the analysts masquerade as results that are solidly grounded in theory and the data. This leads to a tremendous amount of confusion and mischief, not least of which is the no0on that although the physical science of the climate is plagued by uncertain0es, it is possible to know with a high degree of certainty just what the economic consequences of alterna0ve policy ac0ons will be.” (italics in original)
36 Copyright Jonathan Koomey 2013

Fossil fuel resources are huge
37 Source: Table A-‐1 from Cold Cash, Cool Climate, mainly using GEA data 2012
Note: Current annual global primary energy use is 0.6 ZJ (1 ZJ = 1000 EJ or 10e21 J), which is about 30 TW.
Copyright Jonathan Koomey 2013

MIT level 1 case = 1 doubling of CO2 equivalent concentra0ons
38 Copyright Jonathan Koomey 2013

Probability of < 2 C increase in 2100 rela0ve to preindustrial 0mes
39
Source: Meinshausen et al. 2009 and calcula0ons in Cold Cash, Cool Climate.
Copyright Jonathan Koomey 2013

Wedges: A useful heuris0c
• Originally proposed in Pacala and Socolow 2004
• One wedge = 25 GtC over 50 years • Allows simple quan0ta0ve characteriza0on of efforts needed to reduce emissions
• Pile up wedges to reach emissions target
40 Copyright Jonathan Koomey 2013
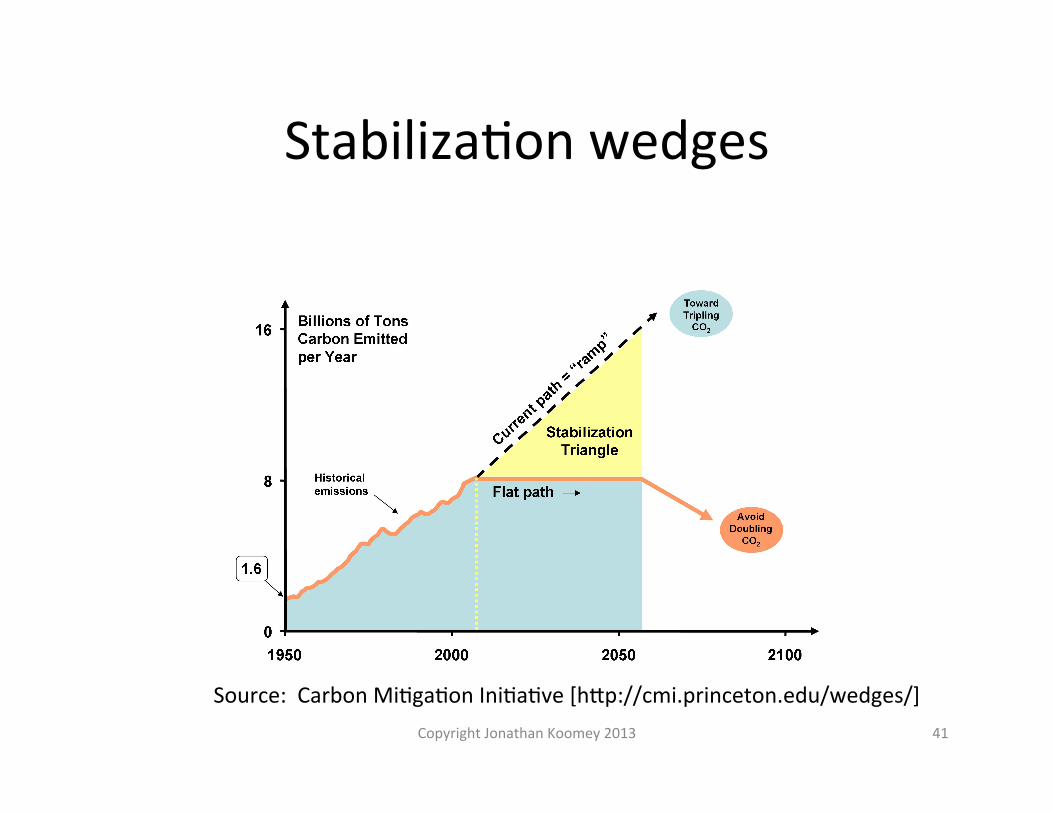
Stabiliza0on wedges
41
Source: Carbon Mi0ga0on Ini0a0ve [hJp://cmi.princeton.edu/wedges/] Copyright Jonathan Koomey 2013

Individual wedges = 25 GtC saved over 50 years
42
Source: Carbon Mi0ga0on Ini0a0ve [hJp://cmi.princeton.edu/wedges/] Copyright Jonathan Koomey 2013

Simple to explain, but limited
• Straighnorward method – Create a business-‐as-‐usual baseline – Analyze how much each op0on will save rela0ve to the baseline
• Dependent on the baseline and on accurate assessments of the cost effec0veness of op0ons (as are all conven0onal forecas0ng assessments)
• Doesn’t tell you how many wedges you need!
43 Copyright Jonathan Koomey 2013