Embed Size (px)
Citation preview

Slide 1 -- April 12, 2010
April 12, 2010
Tim Marklein
Executive VP, Measurement & Strategy
Twitter: @tmarklein
Evaluating Online Media
Coverage + Getting “Inline”Canada Media Marketplace, SF

Audience poll
• How many of you are currently monitoring online media for your brand, city, resort, province, etc.?
Slide 2 -- March 23, 2010

Audience poll
• How many of you are as comfortable engaging online media as you are traditional media?
Slide 3 -- March 23, 2010

Audience poll
• How many of you are engaged in social media channels, including Facebook, Twitter, LinkedIn and/or others?
Slide 4 -- March 23, 2010

Audience poll
• How many of you have clearly defined goals for your online and social media engagement?
Slide 5 -- March 23, 2010

Slide 6 – March 23, 2010
2009/2010 = Transformational time
Economy : Cold Measurement : Hot

Current state of PR/comms measurement
Everyone agrees: Measurement is important
Basic standards, tools in place for measuring media
CMOs, CFOs and CEOs are asking for more
TH
E G
OO
D
Still lots of lip service without investment
“What tool should I use?” – that’s the wrong question
Quarterly reports are shelfware, don’t drive decisionsTH
E B
AD
Comms. metrics aren’t translated into executive terms
Not enough definition or accountability for outcomes
“Random acts of measurement” – not enough integration
TH
E U
GLY
Slide 7 -- March 23, 2010Source: Weber Shandwick
Measurement & Strategy practice

Watershed moment: Moving beyond AVE
• Oct’09: IPR Measurement Commission “condemns the name, concept and practice of ad value equivalencies”
• No evidence that earned media space = paid media space
• Simply measures media “cost,” doesn’t measure the “value”
• Misused as a cheap proxy for ROI – distracts from outcomes
• IPR and AMEC working on alternatives, transition plans
• Shift focus to business outcomes – awareness, understanding, attitudes, behaviors, engagement, sales, market share, etc.
• Always evaluate media quality and message, not just quantity
• Options for comparative “cost” evaluation: CPM, targeted reach, “weighted media cost,” engagement/CPE, market mix analysis
Slide 8 -- March 23, 2010

Traditional/digital integration:
New metrics, data sources and concepts
measures: Assess how content is accessed, shared, adapted, amplified across various sites and media properties
measures: Assess the volume, engagement, sentiment and reach of content shared via the web.
measures: Assess the paid and organic search rankings for company content, brands and keyword associations
measures: Assess the volume, engagement, feedback and reach of content shared via company’s web properties
measures: Analyze volume, content, sentiment of conversations about company/brands across sites, media
measures: Assess audience, reach and “touch points” of company content/conversations across sites, media
• Outcome measures: Assess how the content, conversation and community measures correlate with desired outcomes
Slide 9 -- March 23, 2010Source: Weber Shandwick Measurement & Strategy
practice, “Inline” measurement framework

Traditional/digital integration:
Media cross-over effects, in both directions
Slide 10 -- March 23, 2010

Traditional/digital integration:
The challenge of “scale” and how to adapt
• What’s more valuable?
• Chicago Tribune print story
• WSJ.com online story
• Industry blog post
• Key considerations
• Total impressions vs. targeted impressions
• Total engagement vs. targeted engagement
• Earned Media Value – consistency of source data
• CPM vs. CPE – very different scales
Slide 11 -- March 23, 2010

Online media: The integration challenge
• Old world, meet new world
• Integration of traditional, digital and social media
• Integrating WOM and other new influence patterns
• Silo #1, meet silo #2, silo #3, etc.
• Integration of PR with other communication disciplines
• Integration of PR with other marketing disciplines
• Integration across business units, products, geographies
• Measurement, meet strategy
• Integration of metrics, data sources, tools, dashboards
• Integration of data and insights into decision-making flow
Slide 12 -- March 23, 2010

MediaAnalysis
(traditional)
MediaAnalysis(social)
WebAnalytics
(site)
KeywordAnalysis(search)
WOMAnalysis(surveys)
BrandTracking(surveys)
CustomerSatisfaction(surveys)
EmployeeSatisfaction(surveys)
Lead Gen& Sales data
(CRM)
Events &DM data(CRM)
Analyst Data & Reports
(third party)
Ind. Awards& Scorecards(third party)
Source: Weber Shandwick Measurement & Strategy practice –
ARROW Measurement Suite, February 2009
Measurement, meet strategy:
“Insight” doesn’t live in silos, aggregation is key
Slide 13 -- March 23, 2010

Integrating new influence patterns:
Advocacy takes center stage
Sharing advice
Making recommendations
Making their loyalty visible
Reaching out broadly
Making fast decisions
Taking action
More than justword-of-mouth…
ADVOCATES
INFLUENTIALS
OPINION ELITES
BADVOCATES
45%
20%
High intensity (9%)Low intensity (36%)
Slide 14 -- March 23, 2010 Source: Weber Shandwick’s New Wave of
Advocacy™ with KRC Research, March 2007
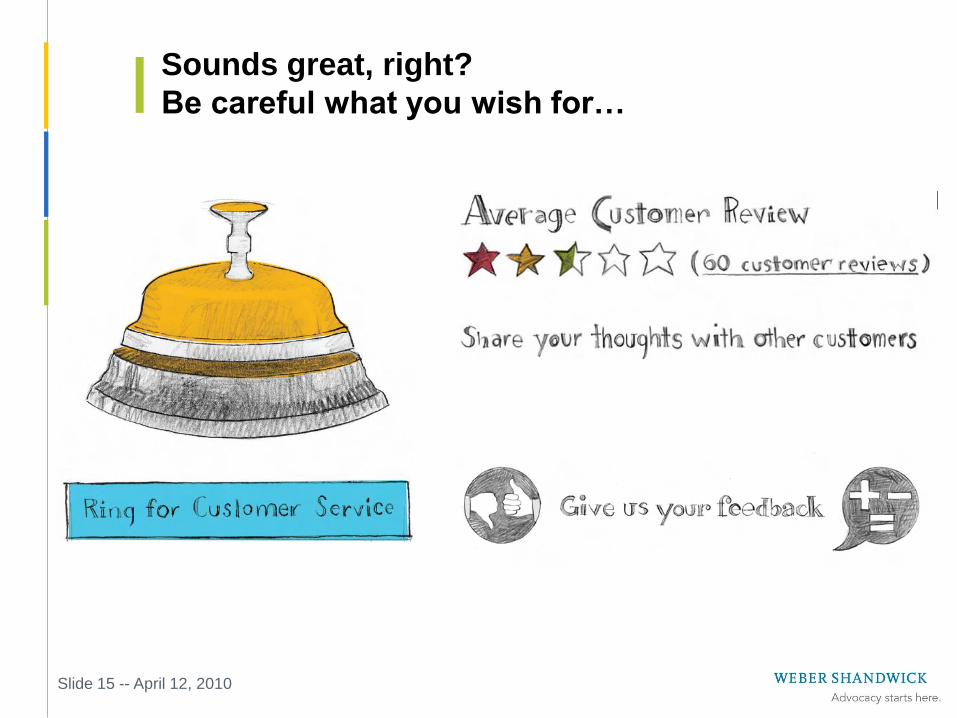
Sounds great, right?
Be careful what you wish for…
Slide 15 -- April 12, 2010

…“badvocates” are everywhere, too…
Slide 16 -- April 12, 2010

…and they wield significant influence
Slide 17 -- April 12, 2010 Source: Weber Shandwick’s New Wave of
Advocacy™ with KRC Research, March 2007

Integrating new influence patterns:
Re-thinking channels, reach, influence
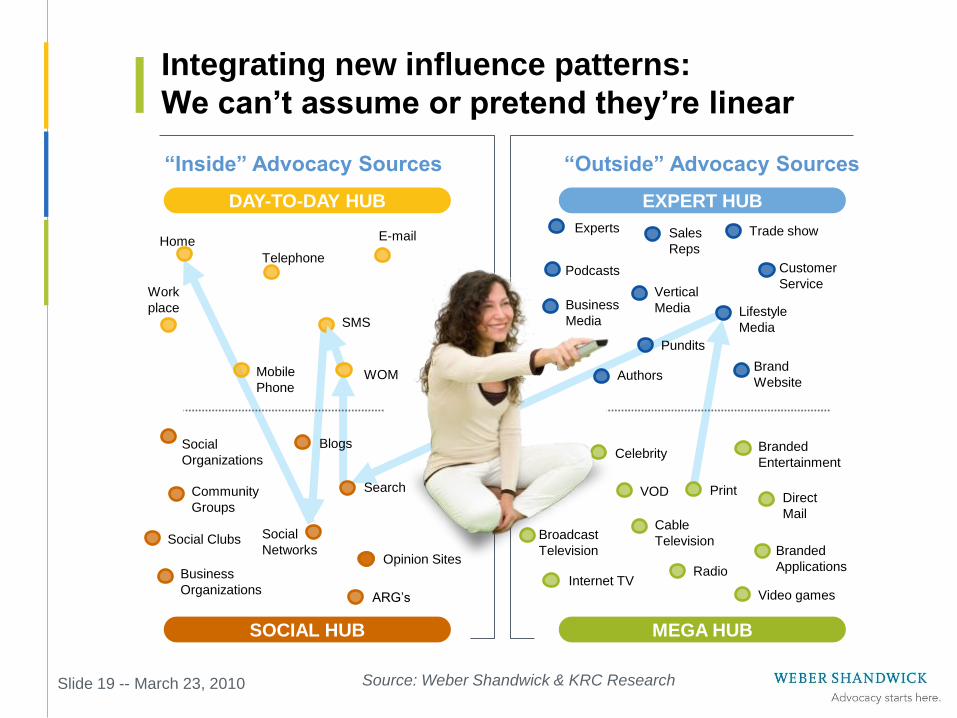
SOCIAL HUB MEGA HUB
“Inside” Advocacy Sources “Outside” Advocacy Sources
EXPERT HUBDAY-TO-DAY HUB
Who in their personal or work lives does
your audience trust for information and
advice?
Who in turn do they contact and
influence?
What kinds of experts (specific people,
categories of people, or specialized
publications) does your audience
seek out when they want information
and advice?
How does this contribute to their
decision-making?
What groups, clubs or networks
(online or offline) does your
audience turn to for information
and advice?
Who do they in turn communicate with?
What brands, celebrities or
cultural trends have caught
the attention of your audience
and are most influential in
their decision-making?
Slide 18 -- March 23, 2010 Source: Weber Shandwick & KRC Research
SOCIAL HUB MEGA HUB
EXPERT HUBDAY-TO-DAY HUB
Integrating new influence patterns:
We can’t assume or pretend they’re linear
Social
Networks
Blogs
HomeTrade show
Podcasts
VODDirect
Internet TV
Authors
Opinion Sites
Branded
Entertainment
Radio
Broadcast
Television
Cable
Television
Branded
Applications
Brand
Website
Business
Media
Vertical
Media Lifestyle
Media
Social
Organizations
Community
Groups
Business
Organizations
Social Clubs
Celebrity
Work
placeSMS
WOMMobile
Phone
Telephone
Search
Video gamesARG’s
Pundits
Experts Sales
Reps
Customer
Service
“Inside” Advocacy Sources “Outside” Advocacy Sources
Slide 19 -- March 23, 2010 Source: Weber Shandwick & KRC Research

Integrating new influence patterns:
Customers aren’t necessarily who they seem
SALES THOUGHT:
Eric = $500K IT budget
$500,000
IT Budget
THE REALITY:
Eric = $76M IT impact inside,
$200M total in 40 companies
Slide 20 -- March 23, 2010

Integrating new influence patterns:
Tracking WOM conversation volume, quality
Source: Weber Shandwick Measurement & Strategy analysis,
based on Keller Fay TalkTrackTM survey data Jan’08-Dec’08
AIG
Industry
Average
State Farm
All State
Prudential
Nationwide
High Volume / High QualityLow Volume / High Quality
High Volume / Low QualityLow Volume / Low Quality
Share of Conversation (%)
Qu
alit
y o
f A
dvo
ca
cy (
%)
Metric Score Industry
Share of Conversation 10% 4%
Net Favorability -62% 18%
Net Recommendation -24% 29%
Propensity to Relay 31% 50%
Slide 21 -- March 23, 2010

Slide 22 -- March 23, 2010
Putting the data into context:
An integrated measurement model
Source: Weber Shandwick Measurement &
Strategy practice, “ARROW” measurement model
activities reach relevance outcomes worth
What activities
were performed
to achieve
results?
Did you reach
your audience?
How many
impressions,
web visits,
reports,
attendees, etc.
were
generated?
Were you
relevant to your
audience? Were
you credible?
Did your ideas
and messages
resonate? Did
you drive
conversation?
What business
results did you
achieve?
Awareness?
Engagement?
Reputation?
Leads? Sales?
Loyalty?
Advocacy?
What is the
estimated dollar
value of your
communication
efforts? What
was the ROI?
Communications Team Marketing Team Executive Team
Quantity/Output Quality/Outtakes Business Impact Value/Efficiency

Proving communications value:
Focus on outcomes
• Start by defining clear, precise, measurable goals
• Even if you don’t think you can measure PR’s impact on the outcome, start with the assumption that you can – and then work backwards to figure out how to measure it
• Anecdotal evidence
• Data-based evidence
• Correlation
• Contribution
• Causation
• Read and internalizeoutcomes definitionsfrom PRSA and IPR’sMeasurementCommission
Slide 23 -- March 23, 2010
http://comprehension.prsa.org/?p=628

- 24 -
Thank You!!!
Email:
Blog:
www.allaboutadvocacy.com
Twitter:
twitter.com/tmarklein