Embed Size (px)
Citation preview

The Changing World of Graphics
Alejandro Mata Economist, European Forest Products
November 2015
1 © Copyright 2015 RISI, Inc. | Proprietary Information

Alejandro Mata, Economist European Forest Products
• Bachelor’s degree in Engineering, MBA degree earned in 2007
• Worked in business and market intelligence functions for one of Europe’s leading paper producers
• Have been analyzing and forecasting the industry since 2009
• Author of the Paper Trader and Paper Packaging Monitor Europe, the European Graphic and Packaging Paper 5-Year and 15-Year Forecasts
© Copyright 2015 RISI, Inc. | Proprietary Information 2

3 © Copyright 2015 RISI, Inc. | Proprietary Information
• Europe has averted Grexit
• But challenges remain
• Brexit is next….
• How will all of this impact the graphics industry?

European Graphic Paper Demand… Is the Market in Decline?
-15%
-10%
-5%
0%
5%
10%
15%
-
10.0
20.0
30.0
40.0
50.0
97 99 01 03 05 07 09 11 13 15
Mill
ion
Tonn
es
Volume (L)
Percent Change (R)
© Copyright 2015 RISI, Inc. | Proprietary Information 4

The Decline Is Mainly in Western Europe
-15%
-10%
-5%
0%
5%
10%
15%
-
10.0
20.0
30.0
40.0
50.0
97 99 01 03 05 07 09 11 13 15
Mill
ion
Tonn
es
Western Europe Emerging Europe Percent Change (R)
© Copyright 2015 RISI, Inc. | Proprietary Information 5

Newsprint Is Declining Everywhere
© Copyright 2015 RISI, Inc. | Proprietary Information
0
2
4
6
8
10
12
97 99 01 03 05 07 09 11 13 15
Mill
ions
Western Europe
UWF Umec CWF Cmec Newsprint
0.0
0.5
1.0
1.5
2.0
2.5
3.0
3.5
97 99 01 03 05 07 09 11 13 15 17
Emerging Europe
6

7 © Copyright 2015 RISI, Inc. | Proprietary Information
Current Conditions
Demand
Trade
S&D Balance
Profitability
Newsprint
Uncoated Mechanical
Coated Mechanical
Coated Woodfree
• US duties • Industry cost
curve • Cut size study
Uncoated Woodfree

4,000
5,000
6,000
7,000
8,000
9,000
10,000
11,000
2010 2011 2012 2013 2014 2015 2016 2017
Capacity Demand Production
8 © Copyright 2015 RISI, Inc. | Proprietary Information
New
sprin
t – W
este
rn E
urop
e

9 © Copyright 2015 RISI, Inc. | Proprietary Information
New
sprin
t – W
este
rn E
urop
e
70%
75%
80%
85%
90%
95%
100%
€ 200
€ 300
€ 400
€ 500
€ 600
€ 700
2010 2011 2012 2013 2014 2015 2016 2017
Production Cost Operating Rate

10 © Copyright 2015 RISI, Inc. | Proprietary Information
New
sprin
t – W
este
rn E
urop
e • Worse than originally thought; significantly
down this year (-8%), and not expected to improve in the near future
• Exports rising (strong US dollar impacting North America)
• Flat during the next two years due to capacity closures and anemic demand in the world
• Strong demand drops and fewer capacity closures
• Flat exports not helping to offset EU market
• Profitability at historical lows

© Copyright 2015 RISI, Inc. | Proprietary Information
Newsprint – Europe
Major Expansions in European Newsprint Industry, 2014-2016
Company Mill Country Capacity Year Comments Stora Enso Kvarnsveden Sweden -200,000 2014 Shift to uncoated mechanical
SCA Ortviken Sweden -140,000 2015 Shut PM2
Martland Holdings
Aylesford UK -400,000 2015 Mill closure
UPM Shotton UK -215,000 2015 PM1 shut
Norske Skog Bruck Austria -125,000 2016 Shift to tissue
Volga Balakhna Russia -295,000 2015
11

3,000
4,000
5,000
6,000
7,000
8,000
9,000
2010 2011 2012 2013 2014 2015 2016 2017
Capacity Demand Production
12 © Copyright 2015 RISI, Inc. | Proprietary Information
Unc
oate
d M
echa
nica
l – W
este
rn E
urop
e

13 © Copyright 2015 RISI, Inc. | Proprietary Information
Unc
oate
d M
echa
nica
l – W
este
rn E
urop
e
70%
75%
80%
85%
90%
95%
100%
€ 200
€ 300
€ 400
€ 500
€ 600
€ 700
2010 2011 2012 2013 2014 2015 2016 2017
Production Cost Operating Rate
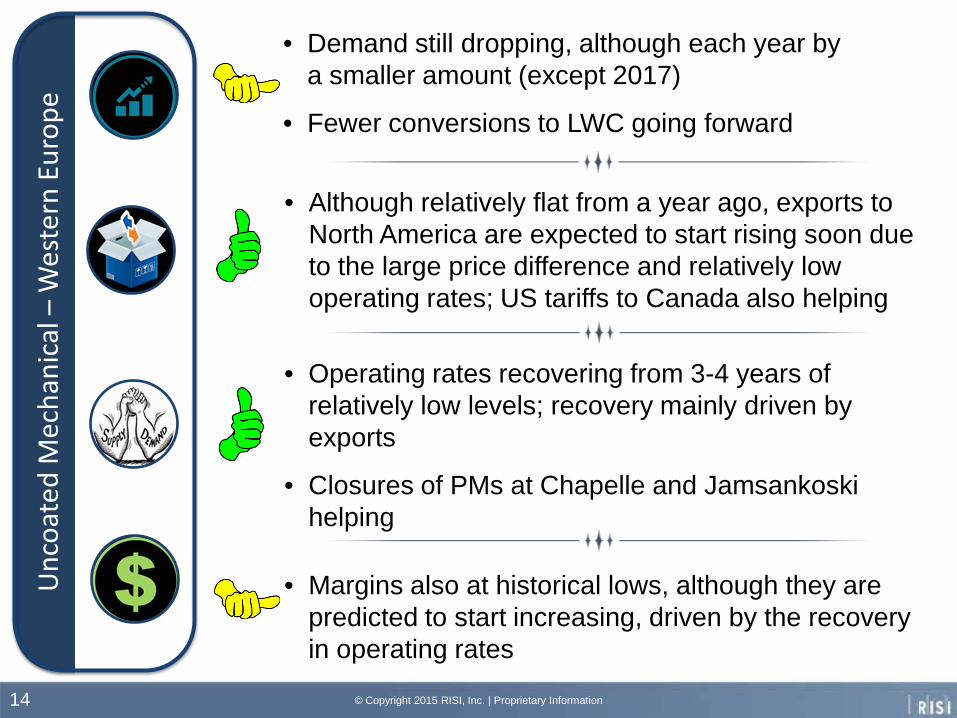
14 © Copyright 2015 RISI, Inc. | Proprietary Information
Unc
oate
d M
echa
nica
l – W
este
rn E
urop
e • Demand still dropping, although each year by
a smaller amount (except 2017)
• Fewer conversions to LWC going forward
• Although relatively flat from a year ago, exports to North America are expected to start rising soon due to the large price difference and relatively low operating rates; US tariffs to Canada also helping
• Operating rates recovering from 3-4 years of relatively low levels; recovery mainly driven by exports
• Closures of PMs at Chapelle and Jamsankoski helping
• Margins also at historical lows, although they are predicted to start increasing, driven by the recovery in operating rates

© Copyright 2015 RISI, Inc. | Proprietary Information
Uncoated Mechanical – Europe
Major Expansions in European Uncoated Mechanical Industry, 2014-2016
Company Mill Country Capacity Year Comments Kama Krasnokamsk Russia -29,000 2014 Shut PM1
Stora Enso Kvarnsveden Sweden 200,000 2014 Shift to uncoated mechanical
UPM Jamsankoski Finland -235,000 2015 Shut PM5
UPM Chapelle France -130,000 2015 Shut PM3
Arctic Paper Mochenwangen Germany -40,000 2015-2016 PM3 shift to packaging
Heinzel Laakirchen Austria -260,000 2017 Shift PM10 to packaging
15

3,000
4,000
5,000
6,000
7,000
8,000
9,000
10,000
11,000
2010 2011 2012 2013 2014 2015 2016 2017
Capacity Demand Production
16 © Copyright 2015 RISI, Inc. | Proprietary Information
Coat
ed M
echa
nica
l – W
este
rn E
urop
e

17 © Copyright 2015 RISI, Inc. | Proprietary Information
Coat
ed M
echa
nica
l – W
este
rn E
urop
e
70%
75%
80%
85%
90%
95%
100%
€ 300
€ 400
€ 500
€ 600
€ 700
2010 2011 2012 2013 2014 2015 2016 2017
Production Cost Operating Rate
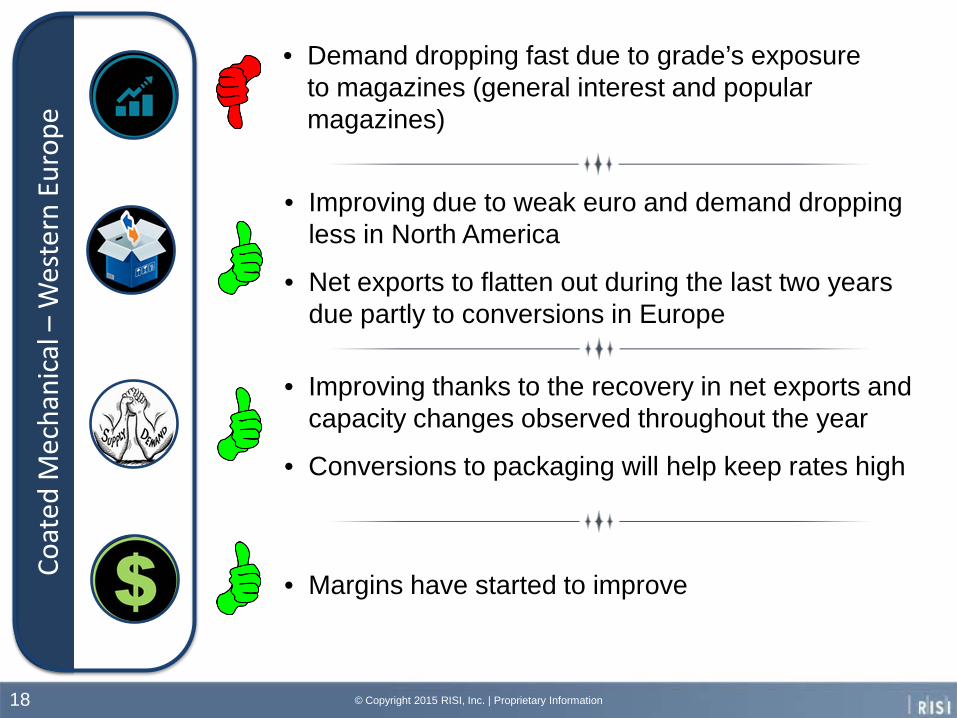
18 © Copyright 2015 RISI, Inc. | Proprietary Information
Coat
ed M
echa
nica
l – W
este
rn E
urop
e • Demand dropping fast due to grade’s exposure
to magazines (general interest and popular magazines)
• Improving due to weak euro and demand dropping less in North America
• Net exports to flatten out during the last two years due partly to conversions in Europe
• Improving thanks to the recovery in net exports and capacity changes observed throughout the year
• Conversions to packaging will help keep rates high
• Margins have started to improve

© Copyright 2015 RISI, Inc. | Proprietary Information
Coated Mechanical – Europe Major Expansions in European Coated Mechanical Industry,
2013-2016 Company Mill Country Capacity Year Comments Metsa-Board Husum Sweden -120,000 2013-2014 Shift to packaging grades
Stora Enso Corbehem France -330,000 2014 Mill closure
Stora Enso Veitsiluoto Finland -190,000 2014 PM1 closure
UPM Kaukas Finland -225,000 2015 PM2 closure
Metsa-Board Husum Sweden -200,000 2015 Shift to packaging
Kotkamills Kotka Finland -180,000 2016 Shift to packaging
Burgo Duino & Verzuolo
Italy -200,000 2015 Shift reduction (Verzuolo) Shut PM2 (Duino)
19

3,000
4,000
5,000
6,000
7,000
8,000
9,000
10,000
11,000
2010 2011 2012 2013 2014 2015 2016 2017
Capacity Demand Production
20 © Copyright 2015 RISI, Inc. | Proprietary Information
Coat
ed W
oodf
ree
– W
este
rn E
urop
e

21 © Copyright 2015 RISI, Inc. | Proprietary Information
Coat
ed W
oodf
ree
– W
este
rn E
urop
e
70%
75%
80%
85%
90%
95%
100%
€ 300
€ 400
€ 500
€ 600
€ 700
2010 2011 2012 2013 2014 2015 2016 2017
Production Cost Operating Rate

22 © Copyright 2015 RISI, Inc. | Proprietary Information
Coat
ed W
oodf
ree
– W
este
rn E
urop
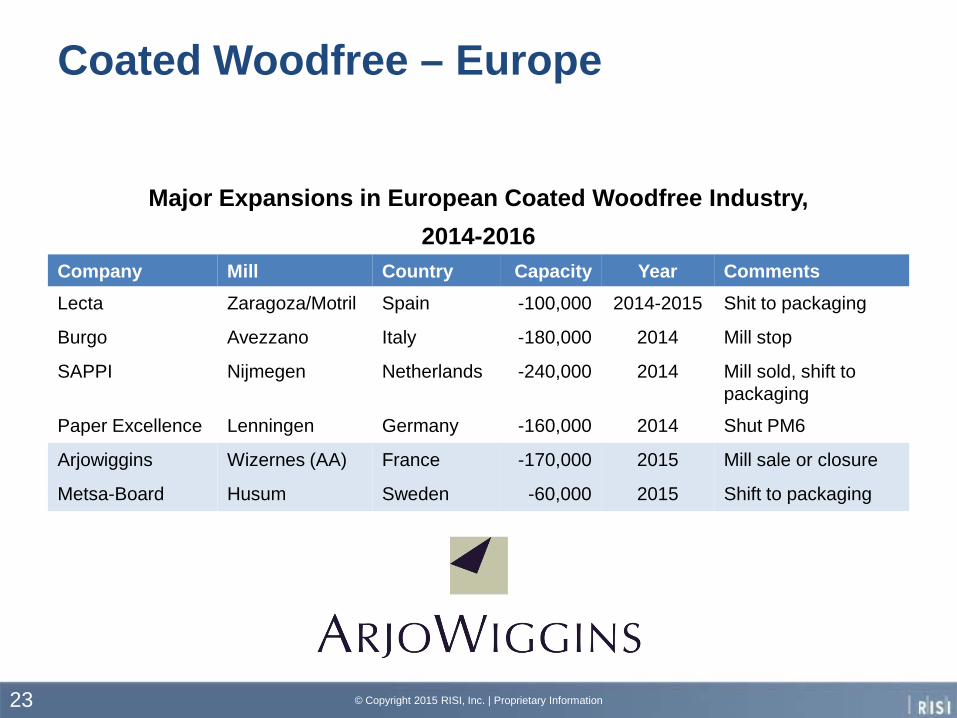
e • Demand dropping twice as fast as last year.
However, demand drivers not showing a significant deterioration.
• Overall net exports stable. Gains in North America and Latin America offset by fewer exports to Emerging Europe.
• Increased competition from Asian producers
• Still rising due to previous closures (Avezzano, Nijmegen, Lenningen, etc.)
• Lack of further closures and stagnating demand will bring operating rates down in 2017
• Margins are recovering thanks to the improved market supply and demand balances
© Copyright 2015 RISI, Inc. | Proprietary Information
Coated Woodfree – Europe
Major Expansions in European Coated Woodfree Industry, 2014-2016
Company Mill Country Capacity Year Comments Lecta Zaragoza/Motril Spain -100,000 2014-2015 Shit to packaging
Burgo Avezzano Italy -180,000 2014 Mill stop
SAPPI Nijmegen Netherlands -240,000 2014 Mill sold, shift to packaging
Paper Excellence Lenningen Germany -160,000 2014 Shut PM6
Arjowiggins Wizernes (AA) France -170,000 2015 Mill sale or closure
Metsa-Board Husum Sweden -60,000 2015 Shift to packaging
23

6,000
7,000
8,000
9,000
10,000
2010 2011 2012 2013 2014 2015 2016 2017
Capacity Demand Production
24 © Copyright 2015 RISI, Inc. | Proprietary Information
Unc
oate
d W
oodf
ree
– W
este
rn E
urop
e
25 © Copyright 2015 RISI, Inc. | Proprietary Information
Unc
oate
d W
oodf
ree
– W
este
rn E
urop
e
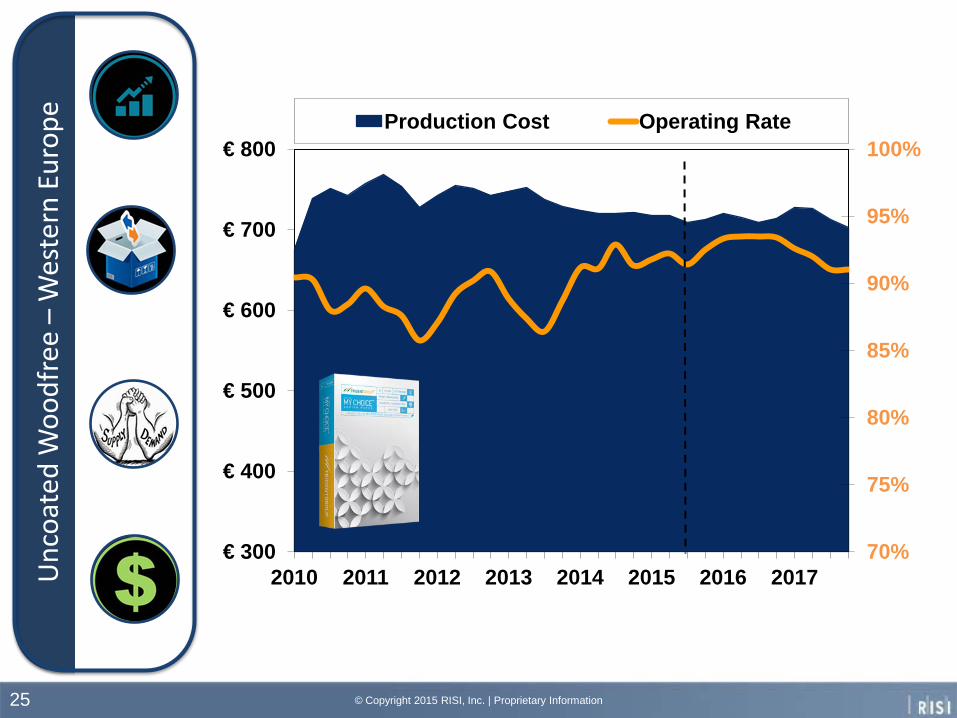
70%
75%
80%
85%
90%
95%
100%
€ 300
€ 400
€ 500
€ 600
€ 700
€ 800
2010 2011 2012 2013 2014 2015 2016 2017
Production Cost Operating Rate

26 © Copyright 2015 RISI, Inc. | Proprietary Information
Unc
oate
d W
oodf
ree
– W
este
rn E
urop
e • Demand dropping again after a surprisingly
strong 2014.
• High unemployment and next economical downturn in 2017 bringing demand down
• Exports booming, mainly to North America due to capacity closures and positive exchange rate effects
• Net exports to come down again with the conversion of Husum and Varkaus during the next two years
• Operating rates high due to healthy demand
• Conversions to packaging to push operating rates further up next year
• Profitability improving

© Copyright 2015 RISI, Inc. | Proprietary Information
Uncoated Woodfree – Europe Major Expansions in European Uncoated Woodfree Industry,
2014-2016 Company Mill Country Capacity Year Comments Lecta Several Spain 15,000 2014 New PM7 & some mill closures
Radece Papir Radece Slovenia 36,000 2014 Mill restart
Pabianicka Pabianicka Poland 53,000 2014 Start second-hand PM
UPM Docelles France -160,000 2014 Mill closure
Meerssen Meerssen NL -32,000 2015 Mill closure
Papeteries des Chatelles
Raon France -45,000 2015 Mill closure
Tullis Russell Markinich UK -60,000 2015 Mill closure
Stora Enso Varkaus Finland -285,000 2015 Shift to containerboard
Metsa-Board Husum Sweden -420,000 2015-2016 Shift to packaging
27

28 © Copyright 2015 RISI, Inc. | Proprietary Information
Import Duties in North America Offshore imports to the USA declining
• To almost zero from China and Hong Kong • Less than 90% from Indonesia
USA remains a very attractive market…
• For overseas suppliers, due to strong US dollar
Imports from Europe increase • Except Portugal
European exports at risk due to displaced Asian exports • Emerging Europe,
Africa, Middle East

29 © Copyright 2015 RISI, Inc. | Proprietary Information
7,000
8,000
9,000
10,000
11,000
2010 2011 2012 2013 2014 2015 2016 2017
Capacity Demand Production
North America
Asia
20,000
22,000
24,000
26,000
28,000
30,000
32,000
34,000
36,000
2010 2011 2012 2013 2014 2015 2016 2017
Capacity Demand Production
• North America became a net importer in 2014
• Latin America also runs a trade deficit
• China remains the largest threat to European exports due to: Asian Overcapacity
Cost positioning
US ADD duties

Conversions
© Copyright 2015 RISI, Inc. | Proprietary Information 30
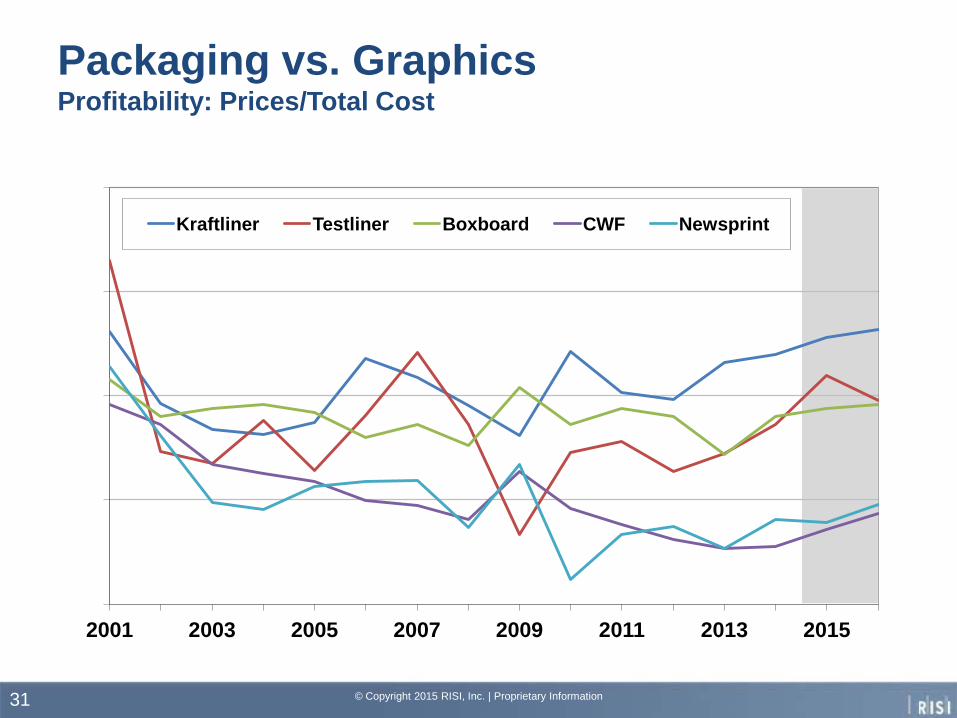
0.75
1.00
1.25
1.50
1.75
2001 2003 2005 2007 2009 2011 2013 2015
Kraftliner Testliner Boxboard CWF Newsprint
Packaging vs. Graphics Profitability: Prices/Total Cost
© Copyright 2015 RISI, Inc. | Proprietary Information 31

© Copyright 2015 RISI, Inc. | Proprietary Information 32
“Significant overcapacity in the newsprint market”
400,000 tonnes of newsprint
UK, Benelux and Austrian operations down
Issues with liquidity and credit risks
• Demand in secular decline
• Margins at historically low levels
• Despite capacity closures, supply and demand balances are not improving

© Copyright 2015 RISI, Inc. | Proprietary Information 33
Is the Grass Greener on the Other Side?
• Margins are higher • Demand for packaging grades is still growing
• Capacity management is important in packaging too • That is why virgin grades have higher margins • Global markets are more competitive • Conversions need to be done properly

Questions
© Copyright 2015 RISI, Inc. | Proprietary Information 34

World Graphic Paper 5-Year Forecast www.risi.com/worldgraphic Global Woodfree Risk of Closure Study www.risi.com/woodfreerisk China’s Influence on World Graphic Paper Markets in the Coming Decade www.risi.com/chinagraphic
Thank you for your attention! For more information:
© Copyright 2015 RISI, Inc. | Proprietary Information 35