Embed Size (px)
Citation preview

시뮬레이션과 공급사슬
2004 년 2 월 21 일임 동 준
제조 통합 자동화 연구실

2/27
논 문
• Supply chain modeling: past, present and future– Hokey Min, Gengui Zhou, 2002
• Simulation in the supply chain context: a survey– Sergio Terzi, Sergio Cavalieri, 2004
• Dynamic simulation of the supply chain for a short life cycle product-Lessons from the Tamagotchi case– Toru Higuchi, Marvin D. Troutt, 2004
3/27
Supply chain modeling: past, present and future
Computers & Industrial Engineering 43 (2002) 231-249
1)Hokey Min, 2)Gengui Zhou
1) Logistics and Distribution Institute, University of Lousville, Suite 437, Luts Hall, Lousiville, KY 40292, USA
2) College of Business Administration, Zhejiand University of Technology, Hangzhou, People’s republic of China

4/27
연구 목표
• 공급사슬 모델에 대한 핵심 이슈들을 정리한다 .
• 공급사슬 모델에 포함되어야 할 핵심 요소들을 결정한다 .
• 공급사슬 모델링에 대한 앞으로의 연구방향을 정리한다 .
5/27
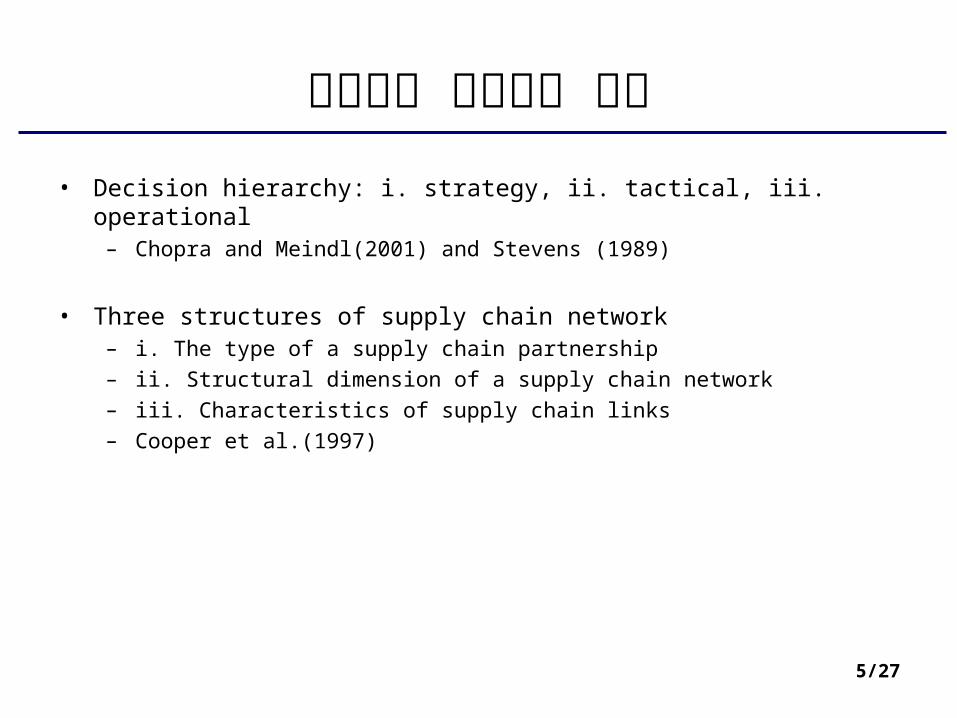
공급사슬 모델링의 범위
• Decision hierarchy: i. strategy, ii. tactical, iii. operational– Chopra and Meindl(2001) and Stevens (1989)
• Three structures of supply chain network– i. The type of a supply chain partnership– ii. Structural dimension of a supply chain network– iii. Characteristics of supply chain links– Cooper et al.(1997)

6/27
공급사슬 모델링의 핵심요소
• Supply chain driver– Customer service initiatives: Product availability, Response time– Monetary value: Asset utilization, ROI*, Cost behavior– Information/knowledge transaction: Real-time communication, Technology
Transfer– Risk elements: Risk of quality failure, Risk of informational failure
• Supply chain constraints: capacity, service constraints, extent of demand
• Supply chain decision variables– Location, Allocation, Network structuring, …
ROI*: Return of Investment
7/27
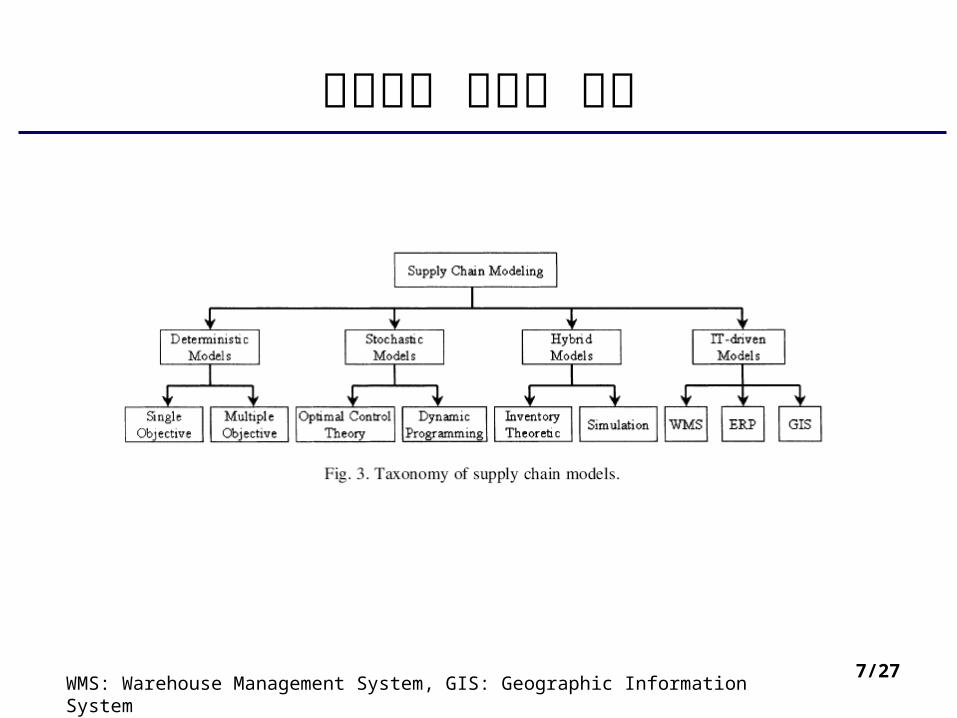
공급사슬 모델의 분류
WMS: Warehouse Management System, GIS: Geographic Information System
8/27
추후 연구 방향
• The application of traditional mathematical programming techniques.
• New problems associated soft issue.
• Multi-object treatment
• Resurgence of simulation model
• New methodology such as the theory of constraints
• Development of IT-driven model
9/27
Simulation in the supply chain context: a survey
Computers in Industry 53 (2004) 3-16
1)Sergio Terzi, 2)Sergio Cavalieri
1)Politecnino di Milano, Department of Economics, Industrial and Management Engineering, Piazza Leonardo da Vinci 32, 20133 Milan, Italy
2)Department of Industrial Engineering, Università di Bergamo, Viale Marconi 5, 24044 Dalmine, Italy
10/27
연구 목표
• 공급사슬 문제에서 시뮬레이션을 이용하는 목적 (Objective) 을 파악한다 .
• 어떤 패러다임과 시뮬레이션 툴이 적절한지 고찰한다 .
• 공급사슬 문제에 시뮬레이션 기법을 적용할 때 , 기업이나 학계 모두에게 유용한 지침 (Prescription) 을 제안한다 .

11/27
PDS* 패러다임 I
PDS*: Parallel and distributed simulation
12/27
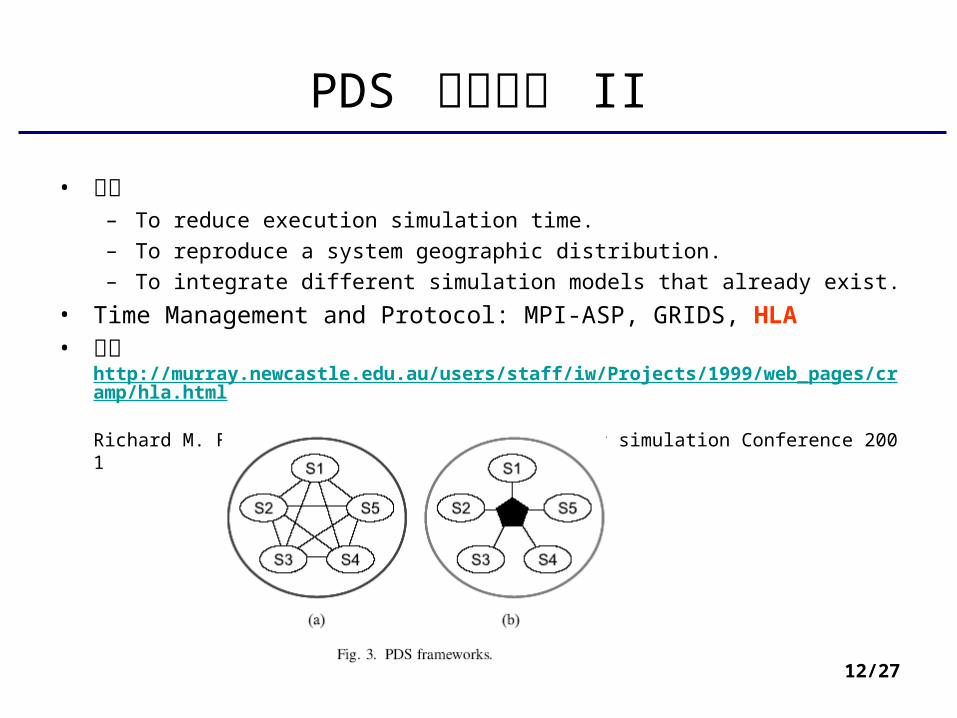
PDS 패러다임 II
• 장점– To reduce execution simulation time.– To reproduce a system geographic distribution.– To integrate different simulation models that already exist.
• Time Management and Protocol: MPI-ASP, GRIDS, HLA• 참고
http://murray.newcastle.edu.au/users/staff/iw/Projects/1999/web_pages/cramp/hla.htmlRichard M. Fujimoto, Proceedings of the Winter simulation Conference 2001
13/27
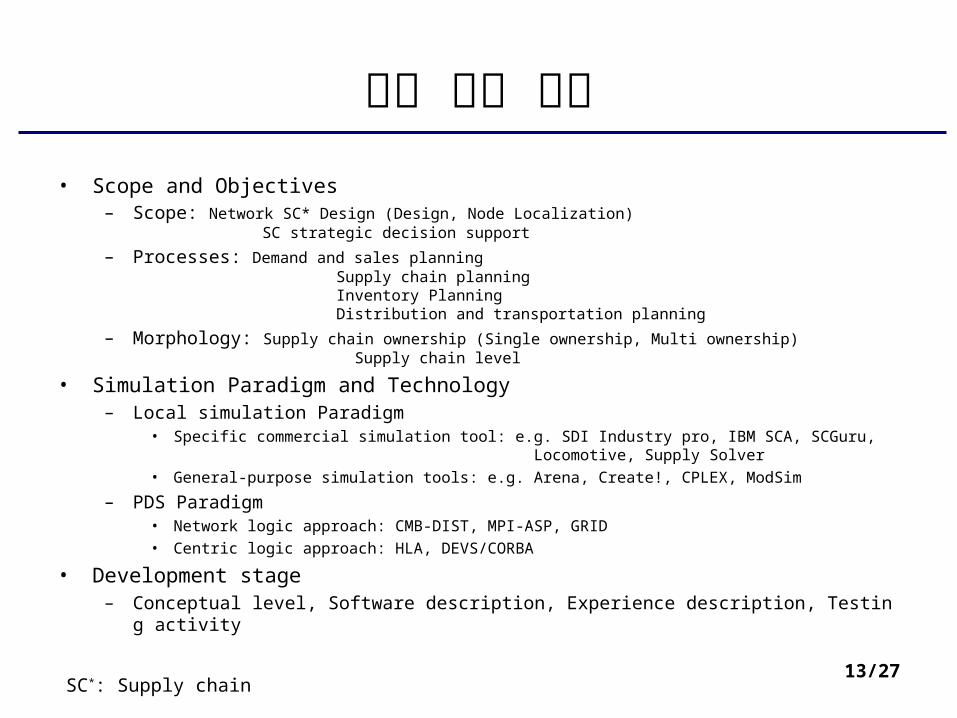
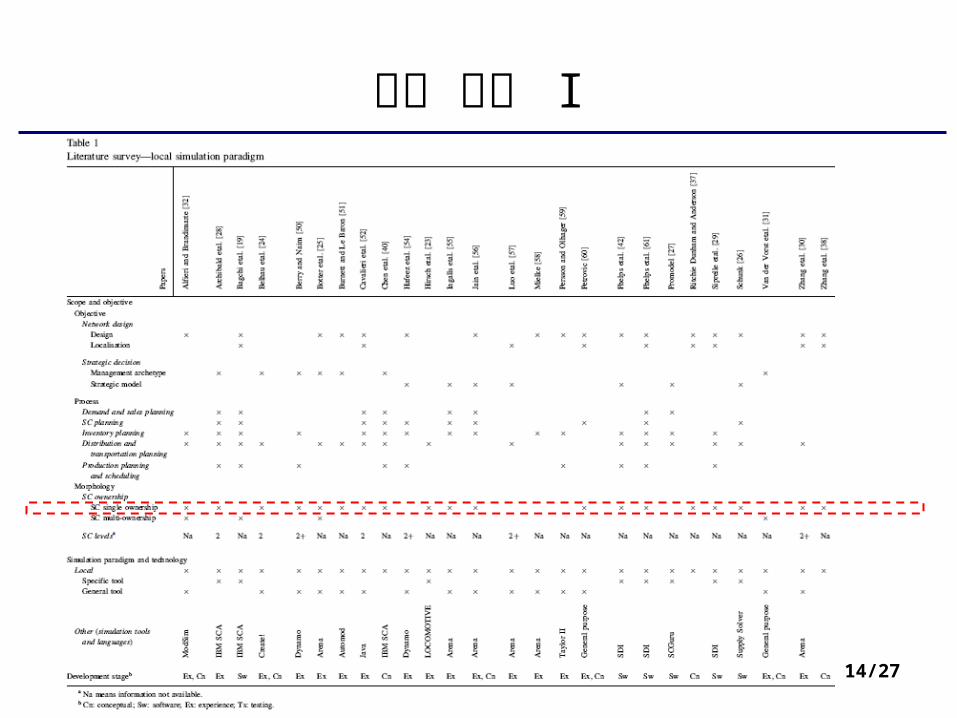
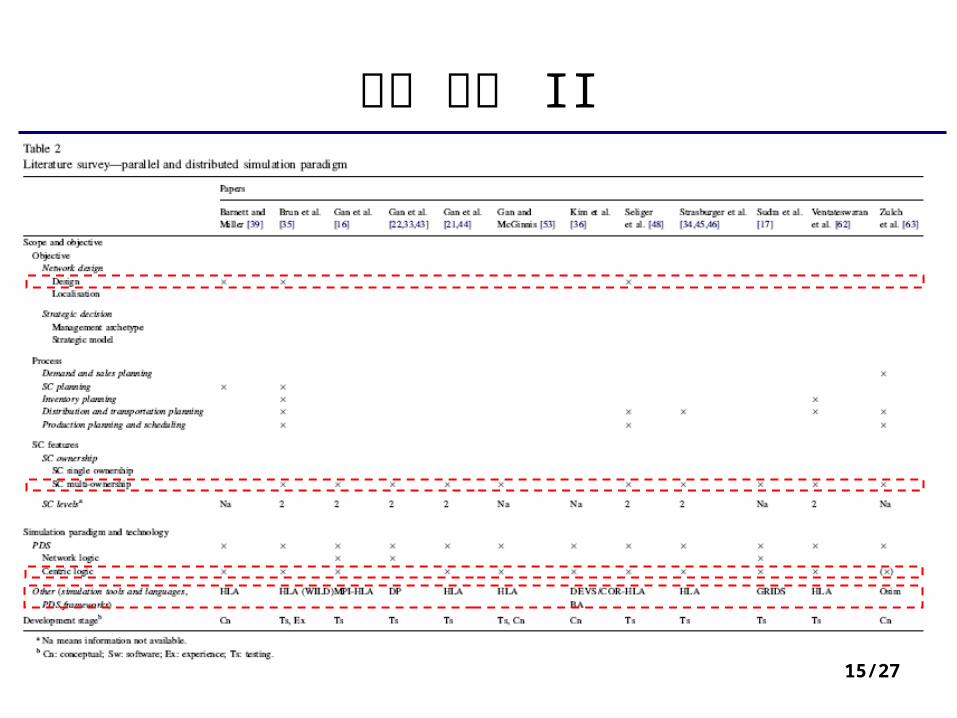
논문 분류 기준
• Scope and Objectives– Scope: Network SC* Design (Design, Node Localization)
SC strategic decision support
– Processes: Demand and sales planning Supply chain planning Inventory Planning Distribution and transportation planning
– Morphology: Supply chain ownership (Single ownership, Multi ownership) Supply chain level
• Simulation Paradigm and Technology– Local simulation Paradigm
• Specific commercial simulation tool: e.g. SDI Industry pro, IBM SCA, SCGuru, Locomotive, Supply Solver
• General-purpose simulation tools: e.g. Arena, Create!, CPLEX, ModSim
– PDS Paradigm• Network logic approach: CMB-DIST, MPI-ASP, GRID• Centric logic approach: HLA, DEVS/CORBA
• Development stage– Conceptual level, Software description, Experience description, Testing activity
SC*: Supply chain
14/27
분류 결과 I
15/27
분류 결과 II
16/27
결과 해석
• Local simulation paradigm– 가장 빈번하게 사용되는 기법이다 .
– 산업응용인 경우 , 전용 모델 툴을 사용하여 구현된 경우가 많다 .
– 학계에서는 범용언어를 더 많이 사용한다 .
– Single-ownership 공급사슬에 사용되는 경우가 많다 .
• PDS paradigms– PDS 패러다임에 관해서는 유용한 툴이 제안되지 못했다 .
– 자주 적용되는 기법은 아니다 .
– Multi-ownership 공급사슬에 사용되는 경우가 많다 .
– WILD(Web integrated Logistics Designer) Projecthttp://st.itim.unige.it/wild/
17/27
Dynamic simulation of the supply chain for a short life cycle product – Lessons from the Tamagotchi case
Computers and Operations Research 31 (2004) 1097-1114
1)Toru Higuchi and 2)Marvin D. Troutt
1)Faculty of Community Development, Sakushin Gakuin University, Utsunomiya, 908 Takeshita-machi Utnomiya, Tochigi, 321-3295 Japan
2) Graduate School of Management at Kent State University, OH, USA
18/27
연구 목표
• 다마고찌 사례를 중심으로 시뮬레이션 모델을 구축한다 .• 다양한 실험을 바탕으로 짧은 수명 주기를 갖는 제품의 supply chain
을 파악한다 .• 실험 결과는 짧은 수명 주기를 갖는 유사제품에 대한 의사결정에
도움이 되도록 한다 .
19/27
배경 이론
• Bullwhip effect
• Shortage game
• Phantom demand
• Boom and bust
• System dynamics– 한국 시스템 다이내믹스 학회 , http://www.ksds.net
– System Dynamics Society, http://www.albany.edu/cpr/sds/index.html/
20/27
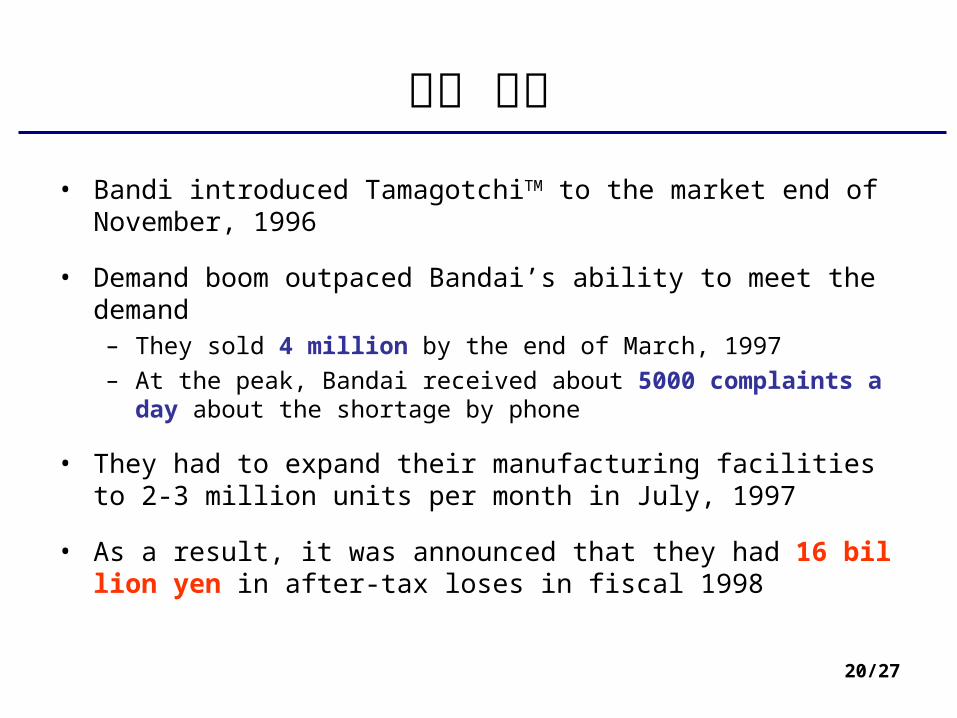
사례 소개
• Bandi introduced TamagotchiTM to the market end of November, 1996
• Demand boom outpaced Bandai’s ability to meet the demand– They sold 4 million by the end of March, 1997
– At the peak, Bandai received about 5000 complaints a day about the shortage by phone
• They had to expand their manufacturing facilities to 2-3 million units per month in July, 1997
• As a result, it was announced that they had 16 billion yen in after-tax loses in fiscal 1998
21/27
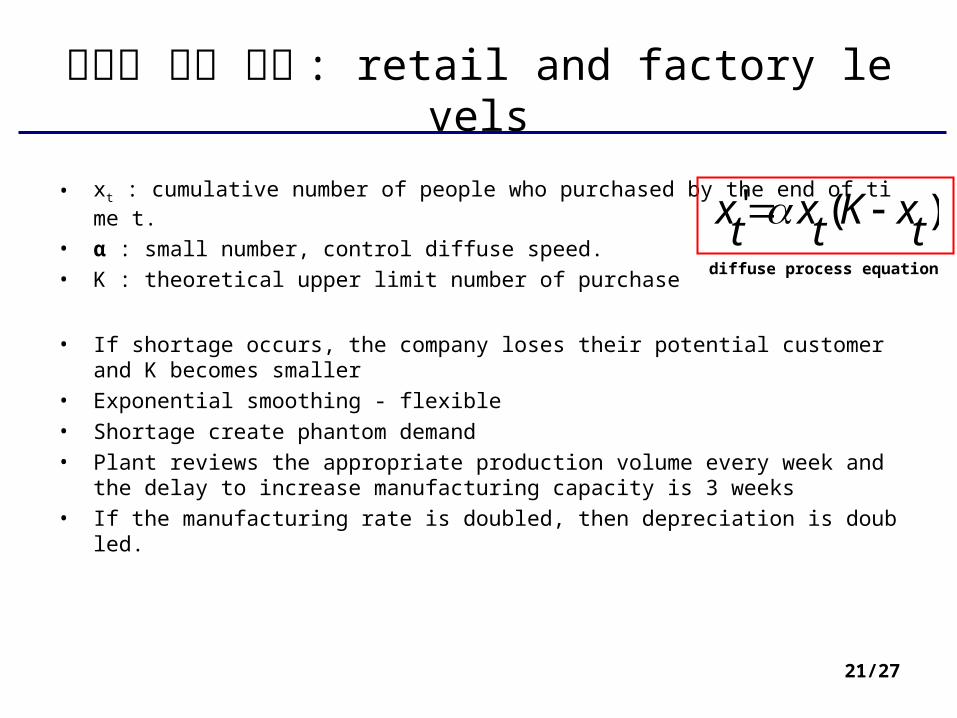
시장에 대한 가정 : retail and factory levels
• xt : cumulative number of people who purchased by the end of time t.
• α : small number, control diffuse speed.• K : theoretical upper limit number of purchase
• If shortage occurs, the company loses their potential customer and K becomes smaller
• Exponential smoothing - flexible• Shortage create phantom demand• Plant reviews the appropriate production volume every week and the delay to increas
e manufacturing capacity is 3 weeks• If the manufacturing rate is doubled, then depreciation is doubled.
)('txKtxtx
diffuse process equation
22/27
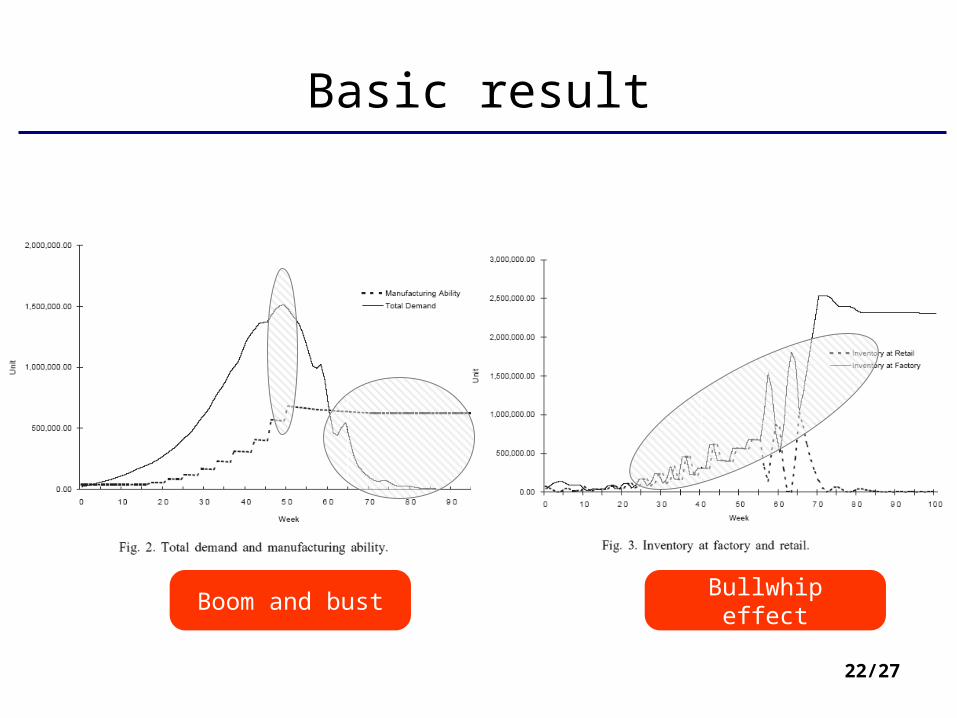
Basic result
Boom and bust Bullwhip effect

23/27
Diffusion speed
• Sensitivity analysis on α
Faster diffusion speed= Shaper and high peak demand
Faster diffusion speed= Bigger risk than long life cycles
24/27
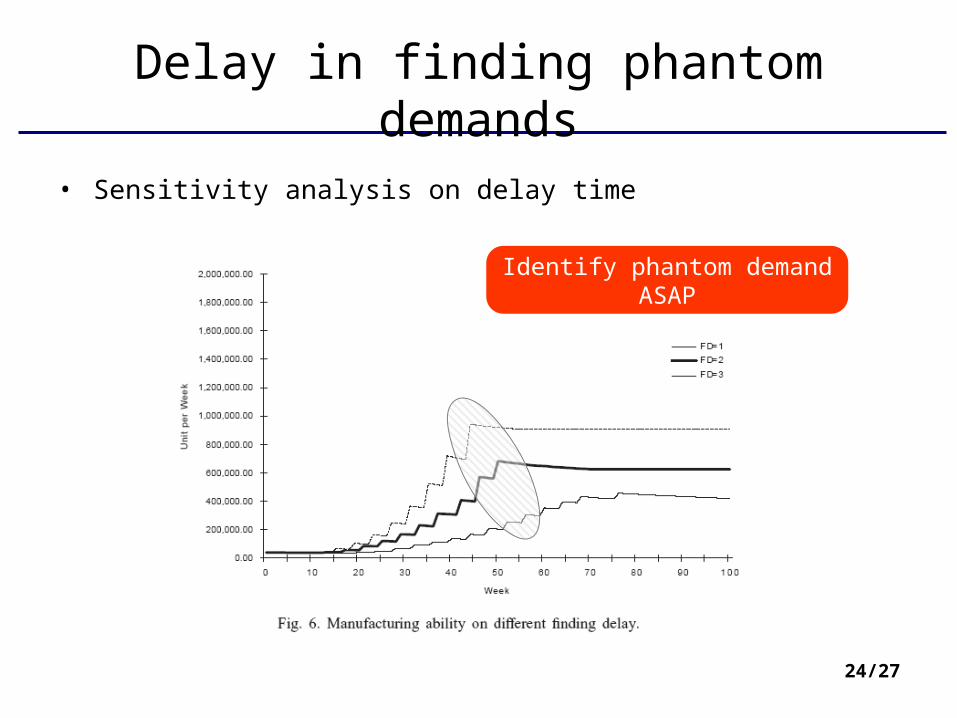
Delay in finding phantom demands
• Sensitivity analysis on delay time
Identify phantom demand ASAP
25/27
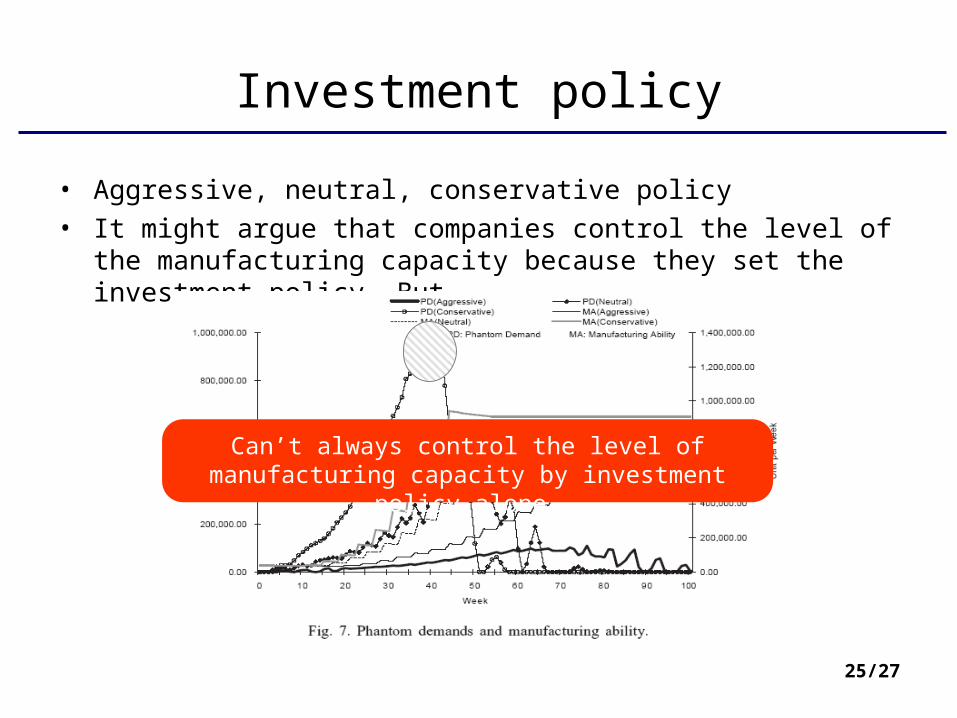
Investment policy
• Aggressive, neutral, conservative policy• It might argue that companies control the level of the manufacturing
capacity because they set the investment policy. But,
Can’t always control the level of manufacturing capacity by investment policy alone.
26/27
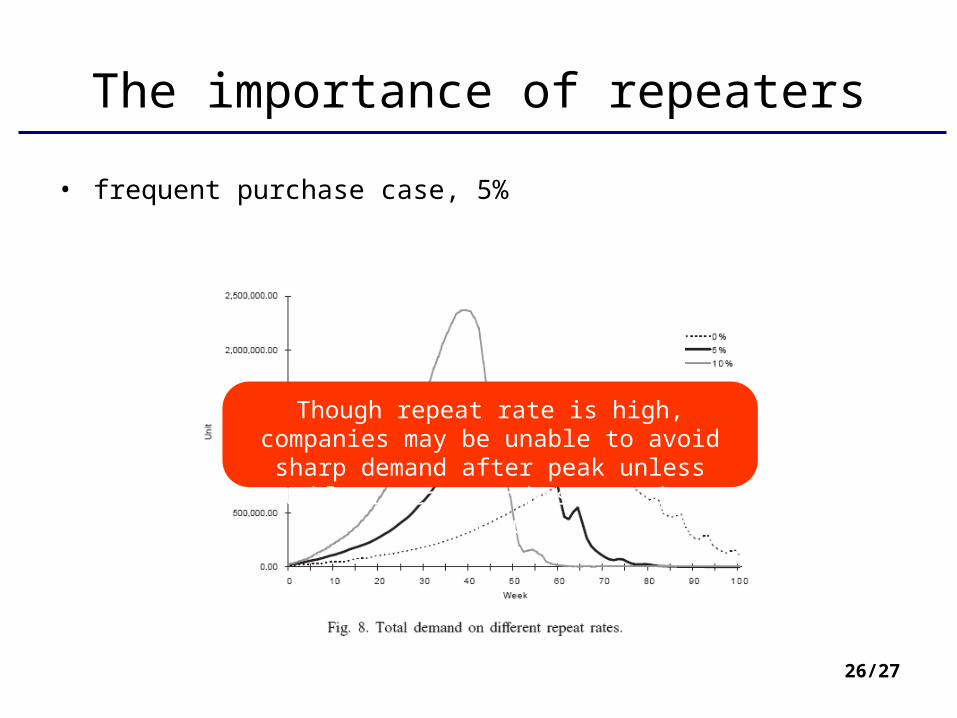
The importance of repeaters
• frequent purchase case, 5%
Though repeat rate is high, companies may be unable to avoid sharp demand after peak unless
stable repeat purchase continue long run.
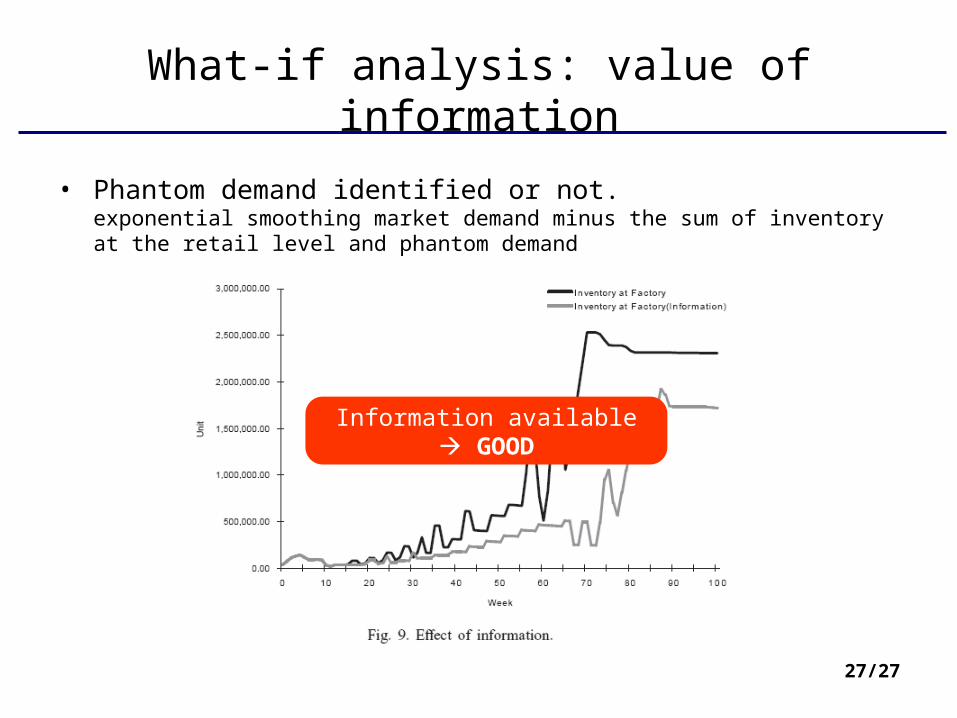
27/27
What-if analysis: value of information
• Phantom demand identified or not.exponential smoothing market demand minus the sum of inventory at the retail level and phantom demand
Information available GOOD
28/27
한 계
• 다마고찌 사례에서 정확한 파라미터 값을 얻을 수 없었다 .• 모델의 단순성을 위해 재정적 요소 (Financial component) 를
고려하지 못했다 .


![[Metni yazın] - pinokyococuk.com · August Ağustos [Metni yazın] 8 SONGS-ûARKILAR Hokey pokey Action Song KITCHEN STUFF ... Wie ist dein name Senin adın ne? Mein name ist Fatma](https://img.pdfslide.tips/doc/110x75/5b7abb517f8b9ae7368c520b/metni-yazin-august-agustos-metni-yazin-8-songs-uarkilar-hokey-pokey.jpg)


![포스터 발표ecl.snu.ac.kr/NFUpload/nfupload_down.php?tmp_name=20150616161916.6080… · 포스터 발표 5 28 ( ) 15:10~15:40 [2 ] 월 일목 층 로비 번호 논 문 제 목](https://img.pdfslide.tips/doc/110x75/5e37925a0308ab6d3d405b69/-eoeoeeclsnuackrnfuploadnfuploaddownphptmpname201506161619166080.jpg)