Embed Size (px)
DESCRIPTION
財政問題與國家經濟建設研習營 國家經濟建設中的科技發展. 2004.09.03. 報告人 朱雲鵬 中央大學管理學院教授兼台經中心主任. 國立中央大學 台灣經濟發展研究中心. Table of Contents. The Trajectory of Taiwan’s Industrial Development R&D Inputs in Taiwan Room for Improvement in Industry-University Collaboration - PowerPoint PPT Presentation
Citation preview

1
財政問題與國家經濟建設研習營
國家經濟建設中的科技發展
2004.09.03

2
報告人 朱雲鵬
中央大學管理學院教授兼台經中心主任國立中央大學
台灣經濟發展研究中心

3
Table of ContentsTable of Contents
I. The Trajectory of Taiwan’s Industrial Development
II. R&D Inputs in Taiwan III. Room for Improvement in Industry-
University Collaboration IV. The Promotion of Industry-University
Collaboration in Taiwan V. Conclusions and Recommendations

4
I. The Trajectory of Taiwan’s Industrial Development
• From 1992 to 1999, the share of manufacturing in GDP reversed its falling trend of peaking-off. The main contributing factor was the rise of the IT industry.
Actual and Trend Index of Manufacturing Production in Taiwan
40
60
80
100
120
140
82 84 86 88 90 92 94 96 98 00
¹ê»ÚÈ ÁͶÕÈPeriod of radical currency appreciation
Actual Index -----Trend Index

5
• The success during the 1990s owed a lot to the increases in mass production of computers and other information-technology related industries. However, facing the rise of the PRC as a main hardware production base and that of India as a main software development base, as well as the rise of other developing nations aiming at catching up with the NIEs, this pattern of industrial development has to change. What worked for Taiwan during the 1990s will no longer work if Taiwan does not change.

6
• In the next 10 years, the manufacturing industry in Taiwan has to develop toward the direction of high value-added industries, give first priority to R&D and innovation, constantly develop new products to increase the profit margins, and broaden its niche through planning and management. Such viewpoints have become a consensus at several national conferences.

7
• In 2002 during the 23rd STAG year-end meeting, it was suggested that Taiwan’s economic base should be upgraded from the previous “incremental improvement” stage to the “breakthrough by inventions” stage.
• During the new stage, it is crucial that the R&D personnel inside the universities and research institutes are fully involved in the process. During the incremental improvement stage, it was sufficient for Taiwanese manufacturers to base their technologies on personal experiences, reverse engineering, or technological transfers from abroad.

8
II. R&D Inputs in Taiwan
* : Defence excluded** : Excluding R&D in the social sciences and humanitiesp : provisionalSource : Main Science and Technology Indicators, 2003/01,OECD
Country Yr. 1998 1999 2000 2001 2002Taiwan 1.97* 2.05* 2.05* 2.16* 2.30France 2.17 2.18 2.18 2.20Germany 2.31 2.44 2.49 2.49 2.50Japan 2.94 2.94 2.98 3.09Korea ** 2.55 2.47 2.65 2.96PRC 0.70 0.83 1.00 1.09United Kingdom 1.80 1.88 1.85 1.90
United States 2.60 2.65 2.72 2.82p 2.82p
Table 1 R&D Expenditure as a Percentage of GDP

9
Table 2 R&D Expenditures by Sector of Performance
Sector of PerformanceCountry
BusinessEnterprise
GovernmentHigher
EductionPrivate
Non-profit
Taiwan ('02) 62.2 24.8 12.3 0.7France ('01) 62.4 17.7 18.5 1.4Germany ('02) 70.0 13.5 16.5 ..*Japan ('01) 73.7 9.5 14.5 2.3Korea** ('01) 76.2 12.4 10.4 1.1PRC ('01) 60.4 29.7 9.8 ..*United Kingdom ('01) 67.4 9.7 21.4 1.4United States ('02) 72.9 7.6h
14.9 4.6
* : Included elsewhere** : Excluding R&D in the social sciences and humanitiesSource : Main Science and Technology Indictors,2003/01,OECD

10
Table 3 R&D Expenditures(‘02) by Type of Work
Type of work
4,156 10 748 3,398
191 0.3 50 1413,965 9.5 698 3,257
1,817 306 753 7591,016 235 492 290
801 71 261 469828 434 330 65
647 338 257 51181 96 73 14
6,801 750(11.0%)
1,831(26.9%)
4,222(62.1%)
Sector of performance
Total
Private
S&T Research Institutes
Public
Private & Non-profit
(unit:million US$)
Universities & Colleges
Public
Private
Experimentaldevelopment
Total
Industry
Public
Basic researchAppliedresearch
Source : Indicators of Science and Technology, NSC, 2003

11
III. Room for Improvement in Industry-University Collaboration
• Technological and vocational education institutes have provided the essential manpower to the industry in Taiwan for the past 40 years successfully.
• Graduates from the technological and vocational schools strongly supported manufacturing industries development particularly during the labor-intensive stage.
• However, as indicated above, the days of cheap labor are gone, and Taiwan must move on to the next stage, where high-caliber researchers must play vital roles.

12
3.1 Distribution of R&D Manpower
Table 4 R&D Manpower
Researchers
Techniciansand
Supportingpersonnel
Researcherper 10,000
employment
ROC 90('01) 59656 48100 63.6
91('02) 64384 49912 68.1
Japan 90('01) 675898 216159 102
Sweden 90('01) 45995 26194 91.8
United States 88('99) 1261227 - 85.8
Singapore 90('01) 16740 2712 81.8
Norway 90('01) 19752 6953 79.7
Russian Federation 90('01) 505778 502313 78.5
New Zealand 88('99) 8768 4317 76.3
Belgium 88('99) 30219 19258 75.3
Australia 89('00) 65805 29450 72.1
France 89('00) 172070 155396 71.3
Denmark 88('99) 18944 17507 68.4
Germany 90('01) 259597 227781 66.7
Researchers
Techniciansand
Supportingpersonnel
Researcherper 10,000
employment
Korea 90('01) 136337 29378 63.9
Canada 88('99) 90810 49630 61.1
United Kingdom 87('98) 157662 - 55.2
Netherlands 89('00) 42085 46377 51.8
Ireland 89('00) 8516 4245 50.3
Spain 90('01) 80081 45669 49.8
Austria 87('98) 18 715 12593 47.2
Hungary 90('01) 14666 8276 38.2
Poland 90('01) 56919 21108 38.1
Greece 88('99) 14748 11635 37.4
Portugal 90('01) 17584 5148 35.1
Italy 89('00) 66110 83956 28.6
Finland 90('01) 36889 16536 15.8
PRC 90('01) 742700 213800 10.2
Mexico 88('99) 21879 17857 5.6
Switzerland 89('00) 25755 26475 -
Source: Main Science and Technology Indicators, 2003/1, OECD。

13
• This ratio of R&D employees to the number of overall employees was higher than many other countries such as Canada, UK, and Norway; and much higher than the PRC in 2001.

14
Table 5 TOTAL R&D PERSONNEL BY SECTOR OF EMPLOYMENT AND FORMAL QUALIFICATION ( 1 )
2000 2001 2002 2002(%)
BUSINESS ENTERPRISE SECTOR
SCIENTIFIC FIELDS
1. SECOND STAGE TERTIARY EDUCATION (ISCED 6) 2349 2411 2631 1.8
2. FIRST STAGE TERTIARY EDUCATION - THEORETICAL (ISCED 5A) 44313 46554 53612 35.7
3. SUB TOTAL UNIVERSITY LEVEL DEGREES (ISCED 5A + 6) 46662 48965 56243 37.4
4. FIRST STAGE TERTIARY EDUCATION - PRACTICAL (ISCED 5B) 31838 30588 29064 19.3
5. POST-SECONDARY NON TERTIARY EDUCATION (ISCED 4) .. .. ..
6. UPPER SECONDARY EDUCATION (ISCED 3) 11346 9264 8646 5.8
7. OTHER .. .. ..
8. TOTAL BEMP 89846 88818 93952 62.6
GOVERNMENT SECTOR
SCIENTIFIC FIELDS
9. SECOND STAGE TERTIARY EDUCATION (ISCED 6) 3428 3510 3874 2.58
10. FIRST STAGE TERTIARY EDUCATION - THEORETICAL (ISCED 5A) 13965 14860 17543 11.68
11. SUB TOTAL UNIVERSITY LEVEL DEGREES (ISCED 5A + 6) 17393 18370 21417 14.26
12. FIRST STAGE TERTIARY EDUCATION - PRACTICAL (ISCED 5B) 4509 4359 5230 3.48
13. POST-SECONDARY NON TERTIARY EDUCATION (ISCED 4) .. .. ..
14. UPPER SECONDARY EDUCATION (ISCED 3) 3238 3117 3981 2.65
15. OTHER .. .. ..
16. TOTAL GOVEMP 25140 25846 30628 20.39

15
Table 5 TOTAL R&D PERSONNEL BY SECTOR OF EMPLOYMENT AND FORMAL QUALIFICATION ( 2 )
2000 2001 2002 2002(%)
HIGHER EDUCATION SECTOR
SCIENTIFIC FIELDS
17. SECOND STAGE TERTIARY EDUCATION (ISCED 6) 12556 13350 14588 9.71
18. FIRST STAGE TERTIARY EDUCATION - THEORETICAL (ISCED 5A) 7735 8123 8670 5.77
19. SUB TOTAL UNIVERSITY LEVEL DEGREES (ISCED 5A + 6) 20291 21473 23258 15.48
20. FIRST STAGE TERTIARY EDUCATION - PRACTICAL (ISCED 5B) 885 934 854 0.57
21. POST-SECONDARY NON TERTIARY EDUCATION (ISCED 4) .. .. ..
22. UPPER SECONDARY EDUCATION (ISCED 3) 134 162 211 0.14
23. OTHER .. .. ..
24. TOTAL HEMP 21310 22569 24323 16.19
PRIVATE NON-PROFIT SECTOR
SCIENTIFIC FIELDS
25. SECOND STAGE TERTIARY EDUCATION (ISCED 6) 301 289 276 0.18
26. FIRST STAGE TERTIARY EDUCATION - THEORETICAL (ISCED 5A) 713 604 720 0.48
27. SUB TOTAL UNIVERSITY LEVEL DEGREES (ISCED 5A + 6) 1014 893 996 0.66
28. FIRST STAGE TERTIARY EDUCATION - PRACTICAL (ISCED 5B) 166 143 181 0.12
29. POST-SECONDARY NON TERTIARY EDUCATION (ISCED 4) .. .. ..
30. UPPER SECONDARY EDUCATION (ISCED 3) 146 140 120 0.08
31. OTHER .. .. ..
32. TOTAL PNP R&D PERSONNEL 1326 1176 1297 0.86
GERD TOTAL
SCIENTIFIC FIELDS
33. SECOND STAGE TERTIARY EDUCATION (ISCED 6) 18634 19560 21369 14.23
34. FIRST STAGE TERTIARY EDUCATION - THEORETICAL (ISCED 5A) 66726 70141 80545 53.63
35. SUB TOTAL UNIVERSITY LEVEL DEGREES (ISCED 5A + 6) 85360 89701 101914 67.85
36. FIRST STAGE TERTIARY EDUCATION - PRACTICAL (ISCED 5B) 37398 36024 35329 23.52
37. POST-SECONDARY NON TERTIARY EDUCATION (ISCED 4) .. .. ..
38. UPPER SECONDARY EDUCATION (ISCED 3) 14864 12683 12958 8.63
39. OTHER .. .. ..
40. TOTAL R&D PERSONNEL 137622 138409 150200 100.00

16
• It is true that 62.6% of R&D talents are employed by business enterprises, 20.39% by government, 16.19% by universities or colleges, and only 0.86% of R&D employees work for private nonprofit institutes.
• However, when we talk about R&D employees with a master’s or Ph.D. degree, the percentage of these people working for universities or colleges becomes 68%, and only 13% of these worked for business enterprises.

17
• As for doctoral researchers, they increased by 1,131 persons in 2001. Among them, 886 (78.3%) are in universities or colleges, 102 (9%) in S&T research institutes (including Academia Sinica), and 143 (12%) in business enterprises.
• So doctoral researchers still prefer working in universities or research institutions.

18
Table 6 Researchers with a Ph. D. Degree
Yr 1998 1999 2000 2001
Universities and
Colleges10,346 11,508 12,353 13,239
Total 15,947 17,063 18,069 19,200
Percent (%)
64.9% 67.5% 68.4% 68.9%
Source: Indicators of Science and Technology, Republic of China (2003)

19
10
15
20
25
30
35
40
1993 1994 1995 1996 1997 1998 1999 2000 2001 2002
%
Ph.D Master Bachelor College or under
Figure 2 Researchers by Degree
Source : Indicators of Science and Technology, NSC,2003

20
• The situation is especially serious during recent years: as higher education capacities increased sharply in Taiwan, the demand for researchers with a Ph.D. degree increased tremendously (see table 7).

21
Table 7 Number of Universities and Assistant or Higher-Rank Professors
Yr 1998 1999 2000 2001 2002
Universities 137 141 150 154 154
Assistant or Higher-rank Professors
18,513 19,979 21,486 23,072 24,708
Growth Rate of the Above (%)
6.2% 7.9% 7.5% 7.4% 7.1%
Source: Ministry of Education, Taiwan, ROC

22
3.2 With insufficient collaborative efforts, universities’ focuses are on producing academic papers and business enterprises on producing defensive patents
• Academic R&D performs well in Taiwan.• A total of 563.88 engineering papers (EI) per
million people were published and Taiwan was ranked the 7th globally in 2002. In addition, a total of 480.93 SCI papers were published per million people and Taiwan was ranked the 20th in the world.

23
Table 8 Number of Papers and Ranking by Nationality in EI (per million population)
Country 1998 1999 2000 2001 2002
Singapore 309.2 508.6 560.48 544.9 563.88
Hong Kong 226.62 269.71 286.12 302.9 298.81
Sweden 286.15 310.83 302.74 272.54 297.4
Finland 214.24 239.3 273.4 260.79 291.59
Switzerland 236.29 266.81 288.44 257.09 276.41
Israel 240.5 256.33 262.2 245.85 268.81
ROC 183.6 212.29 218.97 227.76 237.56
Canada 206.2 210.7 200.58 174.67 217.56
United States 190.32 201.22 182.1 176.43 200.28
United Kingdom 192.5 198.72 205.26 173.26 194.43
Netherlands 164.48 176.91 173.88 170.83 194.07
Japan 151.32 181.89 179.62 179.24 190.9
Belgium 21.07 151.38 167.19 159.52 181.84
Demark 156.95 153.22 177.72 163.46 179.75
Australia 169.38 184.79 172.97 162.87 165.64
France 126.13 141.49 147.44 143.33 160.17
Germany 120.13 138.99 144.86 140.42 156.88
Austria 95.52 112.61 123.07 129.98 149.73
Korea 78.75 113.24 124.4 138.06 146.73
PRC 10.13 9.44 10.67 15.08 18.95
India 3.68 4.55 4.32 4.24 5.18

24
Table 9 Number of Papers and Ranking by Nationality in SCI (per million population)
Country 1998 1999 2000 2001 2002
Switzerland 1828.69 1903.08 1889.69 1857.14 1809.6
Sweden 1622.12 1658.8 1621.83 1720.37 1663.6
Israel 1476.8 1421.06 1463.19 1447.9 1418.37
Denmark 1395.59 1389.92 1411.05 1446.54 1396.54
Finland 1277.51 1339.4 1372.78 1425.02 1390.46
Netherlands 1156.33 1142.8 1149.26 1171.52 1165.94
United Kingdom 1119.38 1143.55 1161.04 1148.4 1104.1
Norway 1059.12 1071.08 1046.98 1102.59 1084.84
Australia 1070.13 1090.26 1054.84 1084.48 1071.96
Canada 1047.57 1072.3 1039.49 1035.71 1037.34
Singapore 646.19 783.15 859.13 935.37 1032.9
Belgium 914.44 945.04 927.14 963.25 977.74
Austria 800.68 826.2 831 912.72 888.17
United States 890 881.6 861.97 876.66 851.61
Germany 764.45 770.18 765.61 788.99 768.87
France 772.77 787.79 767.73 784.49 756.48
Spain 487.62 513.93 514.74 545.49 559.69
Italy 499.25 509.04 511.04 544.77 547.1
Japan 529.29 543.3 536.35 555.54 544.11
Greece 402.38 408.05 430.21 494.76 501.83
ROC 392.41 404.85 413.12 474.66 480.93
Czech Republic 365.52 371.97 378.86 420.29 438.98
Korea 206.21 237 259.91 309.25 328.36
PRC 15.68 18.14 19.74 23.1 26.21
India 15.21 16.08 14.92 16.1 16.52

25
• On the business fronts, Taiwan patents were ranked the 4th in the world among all US patents as table 10 indicates.
• Total number of patents per million population in Taiwan were ranked the 2nd globally and utility patents were ranked the 3rd.
• Ranked by field, the number of semiconductor process technical patents was the 3rd, medical equipment was the 9th, communication technology was the 11th, biotech and medicine technology were the 17th and the 18th in the world.

26
Table 10 Number of U.S. Patents Granted and Ranking by Nationality
2001 1990-2001 2001 1990-2001
Growth% Growth% Growth% Growth%
1 USA 52977 98663 1.7 5.82 1 USA 47391 87607 2.98 5.74
2 Japan 20743 34890 5.97 4.84 2 Japan 19525 33223 6.16 4.95
3 Germany 7862 11894 9.91 3.84 3 Germany 7614 11260 10.03 3.62
4 Taiwan 861 6545 12.73 20.25 4 Taiwan 732 5371 15.08 19.86
5 France 3093 4456 6.78 3.37 5 France 2866 4041 5.81 3.17
6 U.K. 3017 4356 6.5 3.4 6 U.K. 2789 3965 8.13 3.25
7 Canada 2087 4063 3.52 6.24 7 Canada 1859 3606 5.47 6.21
8 Korea 290 3763 8.38 26.24 8 Korea 225 3538 6.76 28.46
9 Italy 1498 1978 0.56 2.56 9 Sweden 768 1743 10.53 7.74
10 Sweden 885 1935 11.33 7.37 10 Italy 1259 1709 -0.29 2.82
All Patents Utility Patents
Rank Country 1990 2001 Rank Country 1990 2001

27
Table 11 U.S. Patents Held Per Million of Population
Rank Country cases/per million population Rank Country cases/per million population
1 USA 347 1 USA 308
2 Taiwan 292 2 Japan 261
3 Japan 274 3 Taiwan 240
4 Sweden 218 4 Swiss 196
5 Swiss 215 5 Sweden 196
6 Israel 161 6 Israel 152
7 Finland 148 7 Finland 141
8 Germany 145 8 Germany 137
9 Canada 131 9 Canada 116
10 Denmark 116 10 Denmark 89
11 Netherlands 93 11 Netherlands 83
12 Hong Kong 81 12 Korea 75
13 Korea 79 13 Austria 72
14 Austria 78 14 Singapore 72
15 Belgium 78 15 Belgium 70
All Patents Utility Patents

28
• So it seems Taiwan’s performance has been shining both in the number of patents and in academic publication.
• Upon closer examination, however, several puzzles arise.

29
• The first puzzle is that Taiwan’s patents are not closely associated with scientific discoveries.
• Our US patents cited academic papers only 0.21 times per patent, far below US’s (4.46), UK’s (3.2), Japan’s (0.99), or South Korea’s (0.76) in 2002.
• Most patents are focused on process technology and only few technology patents are based on scientific basic research.

30
Table 12 Patent Citation
Rank CountryUS Patents in
2002Average Number of
Papers Cited
1 USA 97,188 4.462 Japan 36,363 0.993 Germany 11,959 1.474 Taiwan 6,730 0.215 France 4,421 2.116 U. K. 4,197 3.27 Korea 4,009 0.768 Canada 3,859 4.129 Italy 1,961 1.4910 Sweden 1,824 2.311 Netherlands 1,680 1.7412 Swiss 1,533 2.4713 Israel 1,104 4.0914 Australia 993 3.3315 Finland 855 2.36
Source: Taiwan Institute for Economic Research

31
• Table 13 illustrates the proportion of academic paper publication in each field. Physics, Clinical Medicine, Chemistry, Electrical Science, and Electronics Engineering, Biomedical Science, Material Science, Basic Life Science, Computer Science, and Mechanical Engineering. Unfortunately, these papers are in general not closely associated with the demands from the enterprises.

32
PhysicsClinical
Medicine Chemistry
ElectricalScience andElectronicsEngineering
MaterialScience
ComputerScience
MechanicalEngineering
Taiwan 12.70% 11.40% 11.00% 6.70% 6.40% 5.60% 5.50%
Korea 16.30% 7.90% 15.20% 6.10% 9.90% 3.30% 4.70%
PRC 17.80% 5% 22.40% 2.70% 11.00% 2.40% 3.60%
US 7% 16.80% 5.80% 2.10% 2.30% 2.30% 1.70%
Japan 15% 15% 13.50% 2.80% 7.30% 1.60% 1.50%
U.K. 7.40% 18.90% 6.50% 1.60% 3.20% 2.30% 1.80%
Source:National Science Council
Table 13 Paper Publication by Field: Various Countries during 1995-2001

33
• This brings us to the second puzzle or problem, namely, the lack of industry-university collaboration, and the associated lack of Taiwan’s receipts from patens licensing.
• Actually, most patents filed by Taiwanese business are “defensive” ones, which will be used in court when required.
• Taiwan’s technical trade export was only 3% of import in 1999. Although it rose to 10% in 2000, the ratio is still far below those in advanced countries.

34
Table 14 Coverage Ratio of Technology Balance of Payments (Receipts/Payments)(%) 1997 1998 1999 2000 2001
Taiwan 0.05 0.02 0.03 0.1 ..
Australia .. 0.46 .. .. ..
Austria 0.78 0.79 0.87 1 ..
Belgium 1.3 1.23 1.27 1.33 ..
Canada 1.2 1.58 1.43 1.99 ..
Czech Republic 0.73 0.56 0.5 .. ..
Denmark .. .. 1.57 .. ..
Finland 0.19 0.26 .. .. ..
France 0.71 0.83 0.87 1.04 1.19
Germany 0.83 0.83 0.75 0.75 0.67
Hungary 0.63 0.44 0.43 .. ..
Italy 0.94 0.84 0.79 0.8 0.78
Japan 1.9 2.13 2.34 2.39
Mexico 0.26 0.31 0.08 0.11 0.1
New Zealand 0.59 .. 2.14 ..
Norway 0.66 0.68 0.74 0.82
Poland 0.48 0.35 0.19 0.17
Portugal 0.39 0.34 0.38 0.43 0.47
Spain 0.15 0.19 .. ..
Switzerland 2.45 2.23 1.3 1.49 1.67
United Kingdom 1.72 1.81 2 2.07 2.22
United States 3.63 3.17 2.93 2.46 2.36

35
23298
18856
22359
13338
25801
8142
10652
14066 14802
16192
5142
3218 4009
7280
4950
1422 1801
5079
2447 2587
0
3000
6000
9000
12000
15000
18000
21000
24000
27000
1999 2000 2001 2002 2003
yr.
K U
S$
Licensing Fee (R&D project,MOEA) Licensing Fee(ITRI)
Royalty (R&D project,MOEA) Royalty(ITRI)
Figure 3 Licensing Fee and Royalty coming from R&D Project of MOEA

36
• The NSC tried hard to promote patents filings in previous years, but the numbers were still limited as tables 15 and 16 indicates. Nowadays, the responsibility of such efforts has been shifted back to the universities.

37
Table 15 Number and Royalties of Technology-Transfer by NSC Grants
Yr. 0'98 0'99 0'00 0'01 0'02 0'03 0'04-2ndQNumbers 35 25 44 40 45 90 40Royalty(thousandU.S.$) 429.0 473.7 985.8 1,512.2 1,646.4 3,696.6 2,423.8
Table 16 Number of Patents Applied and Issued through NSC Grants
Yr. ‘98 ‘99 ‘00* ‘01 ‘02 ‘03 ‘04-2ndQ
total 227 199 283 161 149 295 115 Applied
Domestic/Foreign 121/106 114/85 171/112 135/26 96/53 216/79 84/31
total 182 217 288 271 222 137 57 Issued
Domestic/Foreign 90/92 119/98 171/117 174/97 139/83 103/34 41/16
※ Applied Patents:Total number of patents applied.
※ Issued Patents:Total number of patents issued
*:Data from July 1,1999 to Dec.31,2000

38
3.3 Insufficient motivation for collaboration
• Economists and regional scientists have long identified the contribution of university research to industrial innovation as one of the key factors driving the US economy.
• Knowledge spillovers from the academic sector are thought to have had positive effects upon nearby industrial firms, especially for those operating in technology-intensive domains, even before the passage of the Bayh-Dole Act in 1980.
• Additionally, the ratio of US patents filed by academic institution rose from 1% in 1980 to 1.5% in 1991, and to 3% in 1998.

39
• Due to faster technological development, shorter product life cycle, and more intense global competition, most firms have transformed themselves in the current competitive environment.
• The ability of a firm to continually acquire knowledge in order to create a competitive advantage depends upon such organizational factors as the firm’s absorptive capacity, the firm’s ability to institutionalize the knowledge acquisition process and the characteristics of the knowledge.
• Some firms are better able to absorb knowledge from external sources.

40
• University research centers and industrial firms have thus complementary resources and skills. The notion of complementary is therefore key to industry-university collaboration.
• According to the National Research Council, the factors affecting competitive advantages have changed since the 1990s: interaction between researchers and users become more important than before.
• Transferring knowledge between industrial firms and university research centers is important since industry is relying more heavily on these types of relationships to broaden and enhance their existing knowledge base.

41
• Therefore, industrial firms transfer their R&D from Pasteur’s quadrant (basic research stimulated from applications) to short term, practical, application research.
• University increases the research on Pasteur’s quadrant (basic research stimulated from applications) instead of Bohr’s quadrant (basic science research).
• The Bayh-Dole Act passed in 1980 also helped.

42
• For Taiwanese firms, a move from OEM to ODM or even to OBM requires spillovers from university in order to create innovative products.
• However, currently there are incentive problems for university teachers to engage in industry-relevant research.
• For promotion, professors prefer devoting themselves to working on readily publishable papers, which could have little to do with the practical problems of business enterprises.

43
IV. The Promotion of Industry-University Collaboration in Taiwan
• The government has taken various measures to try to correct the problem.

44
4.1 The National Science Council
• Large-Size Grants (average amount is 8 million, minimum is 4 million NT dollars) to industry-university (or research institutions) for collaborative research. Each year the participating enterprise is required to contribute 25%-50% to total budget, not including advanced technology licensing fee. In 2002, total application of such projects amounted to 25, of which 12 were approved. These projects resulted in patent application of 21 cases, 9 of which have been approved. Total budget amounted to 147 million NT dollars.

45
• Small-size Grants: Between 0.5 million to 1.5 million. During 2002, a total of 1,293 applications were received, and 927 of them were approved. Total NSC funding amounted to 344 million NT dollars.
• Outstanding Awards for Industry-University Collaboration: the award was designed to encourage university professors to do more in this aspect.

46
• The NSC also encouraged schools to establish technology transfer centers/offices. A total of 20 centers were established, and during 2002 ten of them received grants at the amount of 2.5 to 5 million NT dollars each. Until February 2003, a total of 266 patents were filed and seven have been approved.

47
4.2 Ministry of Education
• The Ministry adopted various measures, financial as well as administrative, to promote university-industry collaborations.
• Six “University-Industry Collaboration Centers” were established around six main S&T universities (vocational schools, not general universities) in different areas throughout Taiwan. Preliminary results are shown in the following table 17.

48
Table 17 Results of Efforts to Promote University-Industry Collaboration by Ministry of Education, Jan.-
July 2003
Name of S&TUniversities
Taiwan S&T Taipei S&T Yun-LinS&T
KaohsiungFirst
Kaohsiung U. ofApplied S&T
Pin-TongS&T
Cases 40 6 11 8 25 13
Amount (NT$1,000) 26470 4040 3380 9570 12090 2850
NeighboringSchools/TeachersInvolved 27/62 NA/50 12/182 16/63 3/NA 4/7Enterprises Involved 56 6 40 37 9 8
Cases of Consultingand Visits 61 40 40 37 6 95
PatentsApplied/Granted 19/0 1 0 0 5/0 3
Explanatory Seminars 15 8 5 4 8 8
Training Courses andConferences 40 11 18 10 23 14
49
4.3 Ministry of Economic Affairs (MOEA)
• The Small and Medium-Sized Enterprises Bureau has helped schools to establish Incubating Centers since 1996. More than 60 such centers were established island-wide by 2002.
• Under the Department of Technology, MOEA, there are three Science and Technology Special Programs, applicable to the universities, industry, and non-profit research institutions respectively.

50
• The aim of these programs is to grant funding to those projects that cultivate advanced technologies, including development and application of research results as well as the development of key technologies and components.
• In order to promote university-industry collaboration, an increasing (though still small) share of the budget has been allocated to the first category, namely those applicable to the universities.
• In addition, the MOEA in 2001 promulgated the National Science and Technology Development Plan.
51
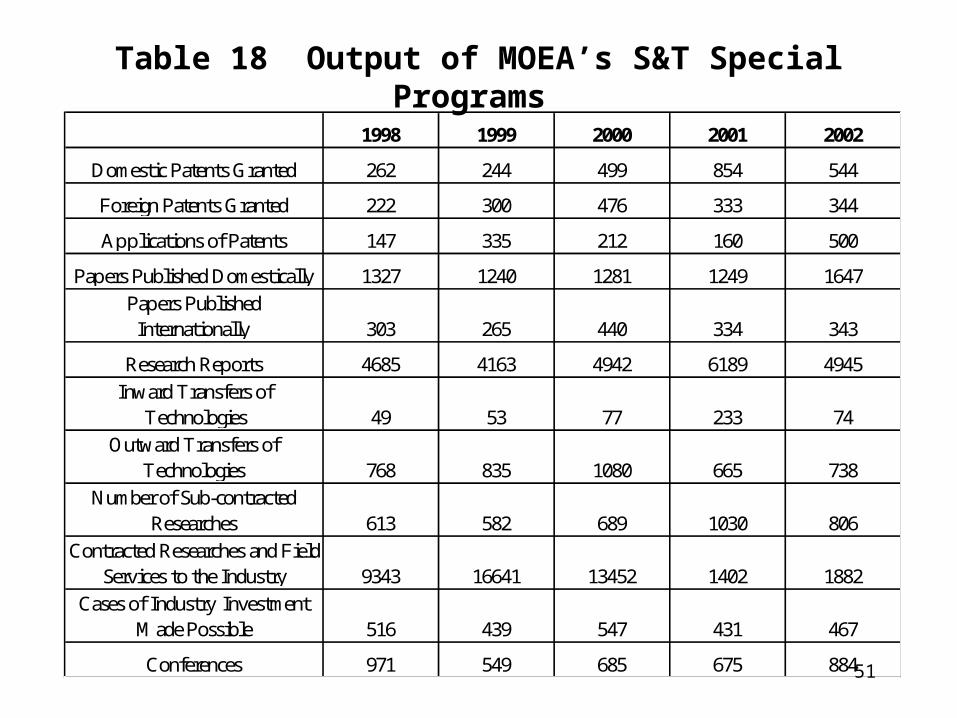
Table 18 Output of MOEA’s S&T Special Programs
1998 1999 2000 2001 2002
Domestic Patents Granted 262 244 499 854 544
Foreign Patents Granted 222 300 476 333 344
Applications of Patents 147 335 212 160 500
Papers Published Domestically 1327 1240 1281 1249 1647
Papers PublishedInternationally 303 265 440 334 343
Research Reports 4685 4163 4942 6189 4945
Inward Transfers ofTechnologies 49 53 77 233 74
Outward Transfers ofTechnologies 768 835 1080 665 738
Number of Sub-contractedResearches 613 582 689 1030 806
Contracted Researches and FieldServices to the Industry 9343 16641 13452 1402 1882
Cases of Industry InvestmentMade Possible 516 439 547 431 467
Conferences 971 549 685 675 884

52
• The Department of Industry, MOEA funded projects to help the industry upgrade their technologies and to develop “Key New Products.”
• These projects belonged to one of the three categories: National, Main, and General Projects. In 2002, NT$68.68 million was allocated to the first, NT$643.06 million to the second, and NT$2.76067 billion to the third category.
• For all these projects, particularly those in the National Category, university-industry collaboration is encouraged.

53
Table 19 Projects Funded by Dept. of Industry, MOEA
Project Category Number of Cases Budget (NT$1,000)
National 5 68,680
Main 11 643,059
General 105 2,760,674
合計 121 3,472,413

54
• The main division of labor with regard to government’s efforts to upgrade industrial technologies is described in the following graph.

55

56
V. Conclusions and Recommendations
• Academic knowledge spillovers can be defined as formal or informal movements of new science-based ideas, concepts or technical procedures from university research units to the private sector.
• Under the collaboration, universities obtain research expenditure grant, absorb industrial experiences, and promote industrial technology development.

57
• Solving problems is the major goal of industrial firms which have to recruit talents from and obtain technology resources by collaborating with universities and research institutes.
• Research institutes raise their capacity for basic science research, promote industrial technology development, and recruit talents by collaborating with universities and industrial firms.
• University should response to the needs of the industry. It has its own main mission: to educate the students. But it can also serve as an important source of innovation for the industry. In order to achieve this, several measures should be strengthened.

58
5.1 Personal Motivation
• We suggest reducing professors’ teaching hours, recognizing working years while temperately transferred to industrial firms, loosing the limitation of the project number and sideline of professors, flexible transferring from universities to industrial firms or other research institutes.
• This article also suggests NSC to establish motivation mechanism for outstanding research relevant to industrial development. Meanwhile, teamwork research projects should be encouraged and evaluation standard for that should be established.

59
5.2 Motivating Universities
• Modifying university funding regulations: it is necessary to introduce enterprise management concepts to universities.
• It is beneficial to both the university and industry: while university assists business enterprises to earn profits, university also obtain financial support from industrial firms, which is win-win solution.

60
• In addition, universities and colleges should be classified and positioned by their characteristics.
• As the development objectives of each higher education institute should be respected, it is necessary to apply different indicators to the evaluation of different types of universities or colleges.
• For those aimed at developing industry-relevant skills for the students, promotion of industry-university collaboration and effectiveness of technology spillover should definitely be part of the evaluation.

61
5.3 Motivating Industrial Firms
• Industries’ passive participation also causes ineffectiveness of the industry-university collaboration.
• Industrial firms have their own research teams, how to encourage them actively participate the collaboration is a serious problem.
• This article recommends industry-university collaborations start from industrial firms proposing research problems and be involved in project evaluation and auditing.

62
• Traditionally, the primary functions of a university have included the triad of teaching, research, and service. These functions have historically been tightly coupled with the research component driving the advancement of basic knowledge for integration into the overall learning experience.
• Accordingly, the university’s generation and diffusion of knowledge as its key mission has provided the necessary foundation for the effective training of future academic, government, and industry professionals.

63
• However, the research conducted in universities has been largely based upon the personal interests, skills, and expertise of its resident faculty.
• Moreover, the faculty’s research agenda was often highly influenced by the academic calendar, the availability of graduate assistants and their own current teaching schedules.
• With respect to publications, faculty viewed them as the critical output of their research—placed in scholarly journals by academics for academics.

64
• The generation and diffusion of knowledge therefore was to scholars. As such, university reward systems were severely tilted toward satisfying the academic community.
• Thus, the traditional university embodied a myriad loosely connected autonomous professionals intent on satisfying one another and not sensitive to those outside the academic community.

65
• With respect to those outside the academic community; industrial firms are concerned with employing knowledge to solve immediate problems in order to maximize earnings and stockholder wealth.
• This disparity in focus between universities and industry has made for a tenuous backdrop for industry-university collaboration.
• Industry’s focus is much more problem centered, as firms actively seek inputs from constituents outside the organization. Industrial firms normally maintain or acquire specific competencies as they are needed, and they expect tangible results within a much shorter time horizon.

66
• With the substantial decrease in government support, research-oriented universities have to rely more heavily on industrial funding and modified their focus, strategies, and structures to encourage and facilitate effective liaisons with industry.

67
• An intense global marketplace, rapid technological change, speedier progression of technological development and commercialization, and increasing complexity of new technologies also mean that industry must be looking for new ways to compete effectively.
• Moreover, very few firms have the complete array of expertise and facilities needed for successful technological development and commercialization.

68
• As a result, the university’s redirected mission and focus, which includes developing and commercializing applied technologies, has opened the door for greater industry interaction.
• This will be the new view of university’s mission and provides a fertile backdrop for greater industry partnership.

69
THANK YOU


![經 濟 問 題經 濟 問 題 經 濟 問 題 Part 1 Chapter 2 瞭解經濟學的範疇 Economics, 6th, Parkin, 2004, Chapter 2: 經濟問題 [ 第 1 頁 ]](https://img.pdfslide.tips/doc/110x75/56649d485503460f94a23dda/-part-1-chapter-2-.jpg)