Embed Size (px)
Citation preview

アジア諸国の高齢化の現状とActive Agingにおける国際協力の方向性について
資料2
2013.6.14厚生労働省第1回「国際的なActive Agingにおける日本の貢献に関する検討会」
(https://www.asean.or.jp/ja/asean/know/country/)
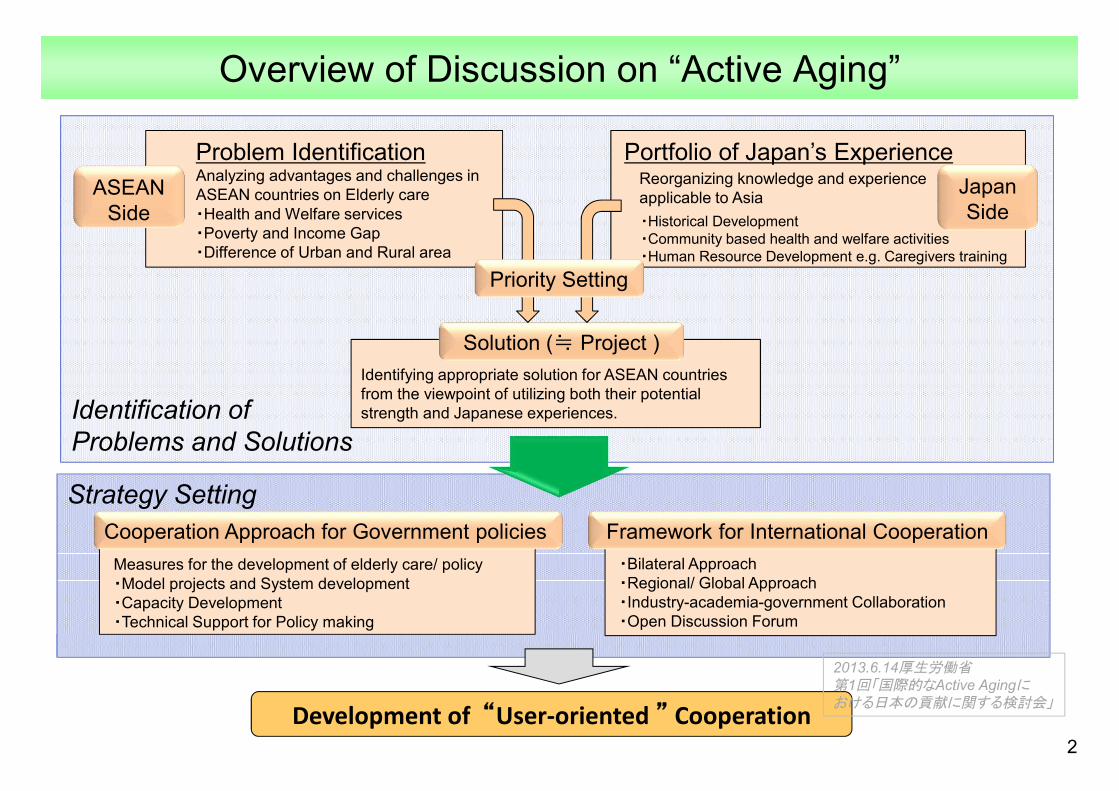
Overview of Discussion on “Active Aging”
2Development of “User-oriented ” Cooperation
JapanSide
ASEANSide
Solution (≒ Project )
Problem IdentificationAnalyzing advantages and challenges in ASEAN countries on Elderly care・Health and Welfare services・Poverty and Income Gap・Difference of Urban and Rural area
Portfolio of Japan’s Experience
Identifying appropriate solution for ASEAN countries from the viewpoint of utilizing both their potential strength and Japanese experiences.
Strategy Setting
Identification ofProblems and Solutions
Framework for International Cooperation・Bilateral Approach・Regional/ Global Approach・Industry-academia-government Collaboration・Open Discussion Forum
Cooperation Approach for Government policies Measures for the development of elderly care/ policy・Model projects and System development・Capacity Development・Technical Support for Policy making
Priority Setting
Reorganizing knowledge and experience applicable to Asia・Historical Development・Community based health and welfare activities・Human Resource Development e.g. Caregivers training
2013.6.14厚生労働省第1回「国際的なActive Agingにおける日本の貢献に関する検討会」
Global Trend on “Active Aging”
3
“Active Aging” by UN and WHO2002: UN, Madrid International Plan of Action on Aging (http://social.un.org/index/Portals/0/ageing/documents/Fulltext-E.pdf)
The document addresses four major areas of concern: older persons and development; health and well-being into old age; enabling and supportive environments for ageing; and implementation and follow-up. While MIPAA asks governments to integrate the rights and needs of older persons into national and international economic and social development policies, the plan is not legally binding.
2002: WHO, Active Aging: Policy Framework (http://whqlibdoc.who.int/hq/2002/who_nmh_nph_02.8.pdf)
Definition of Active Aging: “Active aging is the process of optimizing opportunities for health, participation, and security in order to enhance quality of life as people age”.
2012: WHO, Strategy and Action Plan for Healthy Aging in Europe, 2012-2020 (http://www.euro.who.int/__data/assets/pdf_file/0008/175544/RC62wd10Rev1-Eng.pdf)
Allowing more people to lead active and healthy lives in later age requires investing in a broad range of policies for healthy ageing, from prevention and control of non-communicable diseases (NCDs) over the life-course to strengthening health systems, in order to increase older people’s access to affordable, high-quality health and social services. Four strategic priority areas for action; (i) healthy ageing over the life-course(ii) supportive environments(iii) health and long-term care systems fit for ageing populations(iv) strengthening the evidence base and research.
2013.6.14厚生労働省第1回「国際的なActive Agingにおける日本の貢献に関する検討会」

Global Trend on “Active Aging”
4
Active Aging in European Countries2012: European Year for Active Ageing and Solidarity between Generations (http://europa.eu/ey2012/)
“It (Active Aging) implies optimizing opportunities for physical, social and mental health to enable older people to take an active part in society without discrimination and to enjoy an independent and good quality of life.”
2012: UN, Active Aging and Quality of Life in Old Age (http://www.dza.de/fileadmin/dza/pdf/2012_Active_Ageing_UNECE.pdf)
The report proposed the “Hypothecal representations of three types of investments in active ageing”; (a) early investments, (b) late investments, (c) investments in societal framework for active ageing.
2013: EU summit on Active and Healthy Aging in Dublin (June 2013) (http://www.ahaconference2013.ie/)
Mayors across European countries are expected to sign “Dublin Declaration” in the Summit.
Active Aging in Japan2012: MHLW(Ministry of Health, Labour and Welfare) , National Health Promotion in the 21st
Century “Healthy Japan 21(1st revision)” (http://www.mhlw.go.jp/bunya/kenkou/kenkounippon21.html)
The increase of healthy elderly people not only activates community but increases participants of social activities. Thus Japan can announce to the world one solution for super aged society that “Active elderly support population-decreasing society”. (tentative translation)
2013: MHLW Research Report (Health and Welfare Bureau for the Elderly)・“International comparative research of Productive Aging and health promotion” ( http://www.nenrin.or.jp/center/profile/pdf/shiryou24_6.pdf)
・“Study Group on the community based integrated care”(http://www.murc.jp/uploads/2013/04/koukai130423_01.pdf)The final report emphasized the importance of participation of the elderly to the society which they belong to, even more actively as provider of service for other dependent elderly.
2013.6.14厚生労働省第1回「国際的なActive Agingにおける日本の貢献に関する検討会」
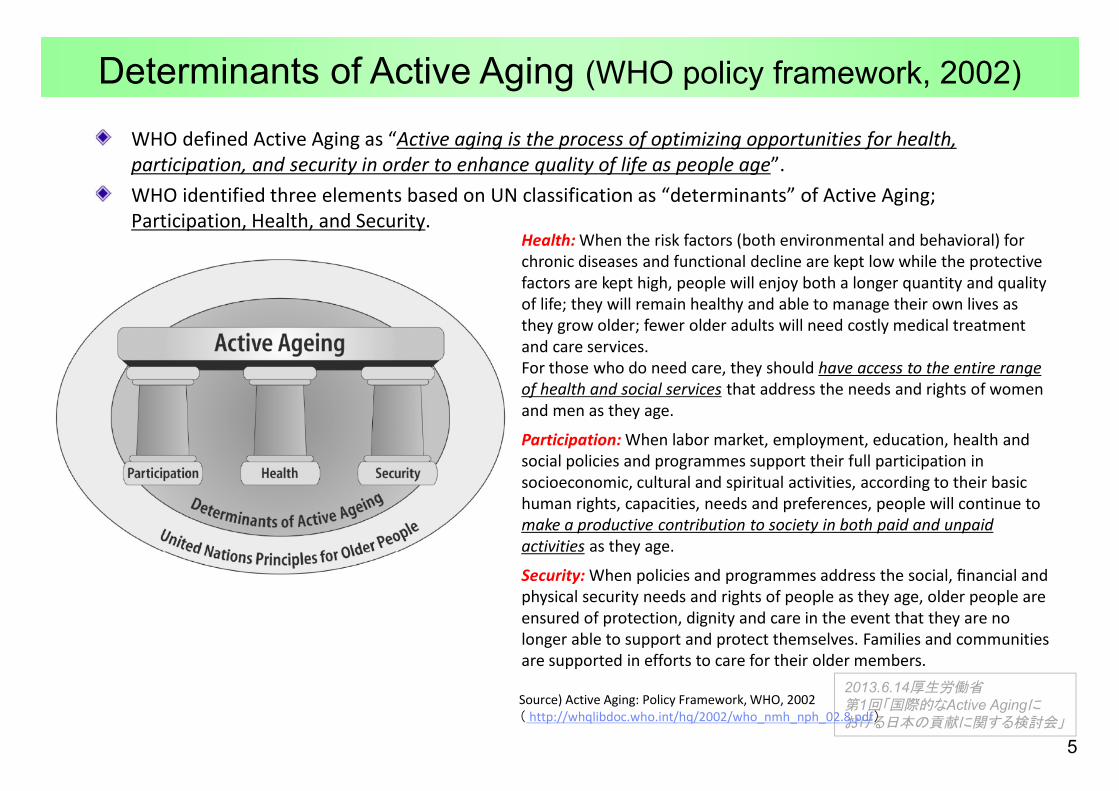
WHO defined Active Aging as “Active aging is the process of optimizing opportunities for health, participation, and security in order to enhance quality of life as people age”.WHO identified three elements based on UN classification as “determinants” of Active Aging; Participation, Health, and Security.
Health: When the risk factors (both environmental and behavioral) for chronic diseases and functional decline are kept low while the protective factors are kept high, people will enjoy both a longer quantity and quality of life; they will remain healthy and able to manage their own lives as they grow older; fewer older adults will need costly medical treatment and care services. For those who do need care, they should have access to the entire range of health and social services that address the needs and rights of women and men as they age.
Participation: When labor market, employment, education, health and social policies and programmes support their full participation in socioeconomic, cultural and spiritual activities, according to their basic human rights, capacities, needs and preferences, people will continue to make a productive contribution to society in both paid and unpaid activities as they age.
Security: When policies and programmes address the social, financial and physical security needs and rights of people as they age, older people are ensured of protection, dignity and care in the event that they are no longer able to support and protect themselves. Families and communities are supported in efforts to care for their older members.
Determinants of Active Aging (WHO policy framework, 2002)
5
2013.6.14厚生労働省第1回「国際的なActive Agingにおける日本の貢献に関する検討会」
Source) Active Aging: Policy Framework, WHO, 2002( http://whqlibdoc.who.int/hq/2002/who_nmh_nph_02.8.pdf)
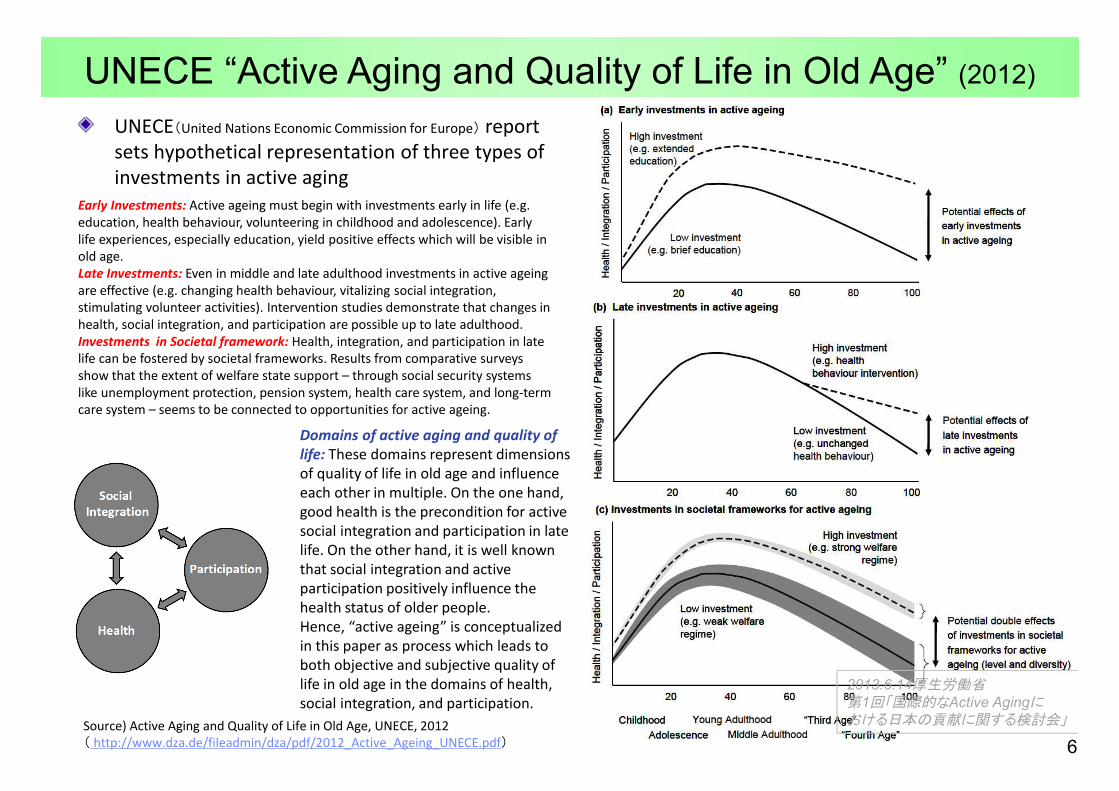
UNECE(United Nations Economic Commission for Europe) report sets hypothetical representation of three types of investments in active aging
UNECE “Active Aging and Quality of Life in Old Age” (2012)
Early Investments: Active ageing must begin with investments early in life (e.g. education, health behaviour, volunteering in childhood and adolescence). Early life experiences, especially education, yield positive effects which will be visible in old age.Late Investments: Even in middle and late adulthood investments in active ageing are effective (e.g. changing health behaviour, vitalizing social integration, stimulating volunteer activities). Intervention studies demonstrate that changes in health, social integration, and participation are possible up to late adulthood.Investments in Societal framework: Health, integration, and participation in late life can be fostered by societal frameworks. Results from comparative surveys show that the extent of welfare state support – through social security systems like unemployment protection, pension system, health care system, and long-term care system – seems to be connected to opportunities for active ageing.
Domains of active aging and quality of life: These domains represent dimensions of quality of life in old age and influence each other in multiple. On the one hand, good health is the precondition for active social integration and participation in late life. On the other hand, it is well known that social integration and active participation positively influence the health status of older people.Hence, “active ageing” is conceptualized in this paper as process which leads to both objective and subjective quality of life in old age in the domains of health, social integration, and participation.
6
2013.6.14厚生労働省第1回「国際的なActive Agingにおける日本の貢献に関する検討会」Source) Active Aging and Quality of Life in Old Age, UNECE, 2012
( http://www.dza.de/fileadmin/dza/pdf/2012_Active_Ageing_UNECE.pdf)

Measures Applied to “Active Aging” based on WHO Description (selected)
7
Health Participation SecurityPrevent and reduce the burden of excess disabilities, chronic disease and premature mortality.
Prevention and effective treatmentAge friendly, safe environmentHearing and VisionBarrier free livingRehabilitation, community support for family, assistive device, eyeglasses.Social Support reducing risks for loneliness or isolationHIV/AIDSMental Health servicesClean environment (clean water, safe food and so on)
Reduce risk factors associated with major diseases and increase factors that protect health throughout the life course.
Physical Activity (safe guidance, safe walking area, and supporting leaders)Nutrition (including children)Healthy eatingOral HealthPsychological factorAlcohol and drugsMedicationAdherence (e.g. correct ing poor adherence to therapies)
Develop a continuum of affordable, accessible, high quality and age-friendly health and social services that address the needs and rights of women and men as they age.
A continuum of care throughout the life course (collaboration between private and public and formal and informal, aging at home and in the community)Affordable, equitable access to primary care
Provide training and education to caregivers.Informal caregivers and Formal caregivers
Provide education and learning opportunities throughout the life course.
Basic education and health literacyLifelong learning
Recognize and enable the active participation of people in economic development activities, formal and informal work and voluntary activities as they age, according to their individual needs, preferences and capacities.
Poverty reduction and income generationFormal Work and Informal WorkVoluntary activities
Encourage people to participate fully in family community life, as they grow older.
TransportationLeadershipSociety for all agePositive image of agingReduce inequalities in participation by womanSupport organization representing older people
Ensure the protection, safety and dignity of older people by addressing the social, financial and physical security rights and needs of people as they age.
Social SecurityHIV/AIDSConsumer protection (e.g. unsafe medicine)Social JusticeShelterCrises (elderly people in emergency situation)Elder Abuse
Reduce inequities in the security rights and needs of older women.
2013.6.14厚生労働省第1回「国際的なActive Agingにおける日本の貢献に関する検討会」

Examples in Japan
8
Health Participation Security
Appropriate medical treatment for the elderlyTechnical assistance for the appropriate consultation for the patients of chronic disease
Human Resource for Health/LTC service Training for caregivers, social workers, and other related specialist in elderly care (care managers) on the care skills and assessment.Training for public health and LTC related local government officersTraining for occupational therapist or physical therapists for rehabilitation
Health Promotion Activities for NCD preventionRegular Health CheckupDisease prevention activity at community level
Environmental SupportLTC facility regulation and operation Heart Bill Act (Barrier free) / Universal Design
Community and Service DevelopmentCommunity activities (watch over) for isolated elderlyCommunity based integrated service systemOral Care, Eating, Nutrition for the elderlySupporting to caregiversMedical care at home
Public AwarenessDementia Supporter Caravan
Social Participation (employed)Silver Human Resource CenterExtension of employmentPromotion of employment after retirement ageImprovement of pension scheme for diversity of retirement
Social Participation (as peer provider in community)
Social Entrepreneur/ Community business developmentSupport for NPOVolunteer
Social Participation (peer support/ neighborhood)
Peer CounselingFormation of informal groupLife long education (Elderly University)
Environmental SupportTransportation service (e.g. community bus)
Social Security [income]Pension Scheme (including informal sector)Arrangement for woman in the pension schemePublic Assistance
Health SecurityHealth InsuranceHealth service for the poorFinancial control over health security system at the macro level
LTC SecurityService Development for home careLong term care insurance (financing mechanism for elderly care)Care Management SystemLTCI accreditation system
Life SupportElderly AbuseAdult GuardianshipAdvocacy for the elderly program
Shelter and Elderly housing policy
2013.6.14厚生労働省第1回「国際的なActive Agingにおける日本の貢献に関する検討会」

9
Aging rate1990(60+)(%)1)
Aging rate2010(60+)(%)1)
Prospect of aging
rate2025 (60+)(%)1)
Prospect of aging
rate2050(60+)(%)1)
Total fertility rate1)
Life expectancy at birth 1)
Labor-force participation ratio(60-64year-old)2)
Per capita GDP
(US$)3)
Income disparity(Richest 10% to poorest 10%)4)
Male Female Male Female
Japan 17.4 30.5 35.5 41.5 1.32 79.3 86.1 76.0 45.7 45,903 4.5
Republic of Korea 7.7 15.7 27.2 38.9 1.29 76.5 83.3 70.2 41.5 22,424 7.8
Singapore 8.4 14.0 27.1 37.8 1.25 78.5 82.7 67.5 35.4 46,241 17.7
Thailand 7.3 12.9 21.3 31.8 1.63 70.2 77.1 50.1(60-)
29.5(60-)
4,972 12.6
China 8.9 12.3 20.2 33.9 1.64 71.1 74.5 58.3 40.6 5,445 21.6
Vietnam 7.3 8.4 15.3 30.8 1.89 72.3 76.2 69.4 58.2 1,407 6.9
Indonesia 6.1 8.2 13.2 25.5 2.19 66.3 69.4 78.9 47.3 3,495 7.8
Malaysia 5.6 7.7 13.1 20.4 2.72 71.2 75.7 52.3 17.1 9,977 22.1
Myanmar 7.0 7.9 13.0 24.5 2.08 62.1 65.0 - - 880 -
Brunei Darussalam 4.4 5.7 12.1 23.1 2.11 75.3 80.0 45.5 11.2 40,301 -
Cambodia 4.5 6.2 9.5 19.0 2.80 60.2 62.6 69.5 33.0 897 12.2
Philippines 4.7 5.7 8.9 15.3 3.27 64.5 71.3 79.0(55-64)
54.8(55-64)
2,370 15.5
Lao PDR 5.7 5.9 8.4 18.9 3.02 64.8 67.3 - - 1,320 8.3
Source 1) UN: World Population Prospects: The 2010 Revision Population Database2) Statistical data of respective countries. 3) World Bank Search 2011 (Myanmar ; National Accounts Estimates of Main Aggregates, 2010, United Nations Statistics Division)4) Human Development Report 2007/2008:Published for the United Nations Development Programme (UNDP)
Comparison of Aging-Related Indicators (ASEAN+3)
2013.6.14厚生労働省第1回「国際的なActive Agingにおける日本の貢献に関する検討会」

Target Countries
Rapid Aging2025 aging rate ≧20%(60+)
Moderate Aging10% ≦2025 aging rate < 20% (60+)
Young2025 aging rate < 10%(60+)
High Income CountryGDP per Capita: >10,000$
JapanSingaporeRepublic of Korea
Brunei Darussalam
Middle Income CountryGDP per Capita: >1,000$
ThailandChina
MalaysiaIndonesiaVietnam
PhilippinesLao PDR
Low Income CountryGDP per Capita: <1,000$
Myanmar Cambodia
10
ODA countriesSource ・UN: World Population Prospects: The 2010 Revision Population Database
・ World Bank Search 2011 (Myanmar ; National Accounts Estimates of Main Aggregates, 2010, United Nations Statistics Division)
2013.6.14厚生労働省第1回「国際的なActive Agingにおける日本の貢献に関する検討会」

International Cooperation in the field of the Elderly Persons between Thailand and Japan
Project on the Development of a Community Based Integrated Health
Care and Social Welfare Services Model for Thai Older Persons (CTOP)
(Nov. 2007~ Nov. 2011)
Health and welfare community-based service models were developed at 4 project sites in accordance with the needs of the sites, for example, 1) One-stop service such as
health-check and welfare registration for the elderly people
2) Community rehabilitation3) Prevention activities of high
blood pressureOwnership of the communities was strengthened based on “user-oriented principles”.Guideline of developed services was disseminated nation-wide.
Project on Long-term Care Service Development for the Frail Elderly
and Other Vulnerable People (LTOP)(Jan. 2013~Aug. 2017)
Thai Service models of long-term care will be developed, taking Japanese models into consideration. Service models will be tested both in urban and rural areas and improved.Policy development of the sustainable care system in Thai society will be discussed.Human resource development will support the to-be developed models.
11
2013.6.14厚生労働省第1回「国際的なActive Agingにおける日本の貢献に関する検討会」

社会保障制度の整備状況 高齢化に関する課題等
Thailand 2002年にUC制度が創設され、プライマリケアの整備が全国的に進んでいる。インフォーマルセクター向けの
医療の保障水準はプライマリケアを中心にアセアン諸国では比較的高く、自己負担率も低い。
アセアン諸国の中でも高齢化の進展が最も早い国の一つ。普遍化が進んだ医療保障において、高齢者の透析を保険適用とするかなど、高齢化にかかる政策議論が進んでいる。また、地域では、高齢者ケアのためのボランティアの養成が進んでいるが、専門職の養成も課題となっている。
Indonesia 中央政府・地方政府それぞれが構築していた医療保険・年金保険の統合が進められ、新たな社会保障運営機関として2013年にBPJSが創設された。島嶼部が多いことから、医療資源の適正配置などに課題が残っている。
No information
Malaysia 全国民を対象とした公的医療制度が整備されているが、富裕層は、民間医療機関を受診することが多く、公的医療機関と民間医療機関に二分している。政府は、両者の格差是正のため、公的医療保障に対する公的支出の増大を目指している。
高齢者介護については、インフォーマルセクターを中心に、在宅ケアを進展させることをターゲットとしているが、資源開発には、時間を要する。高所得国を目指す中、中間層以上をターゲットとした民間施設が増加しているが、規制が不十分であり、高齢者のQOLを確保するための取組が必要。
Philippine PhilHealthが全国的な統一機関として医療保険を運用しており、カバレッジも人口の半数を超えているとされるが、給付水準が低く、医療費支払いにおいては、自己負担が約8割に達するとも言われている。島嶼部においては、医療供給にも課題を残している。
アセアン諸国の中では、最も時間をかけて高齢化が進むと予想されており、高齢化は、政策課題としては優先順位が低い。
Cambodia かつての内戦の影響もあり、保健医療の人材・資源不足が顕著である。社会保障制度の整備においては、後発国であり、近年、公務員・被用者向けの所得保障制度が創設されたが、加入者はごく一部の国民に限定されている。
No information
Lao PDR 1990年代より都市部を中心に社会保障制度の整備が進むものの、保健医療資源は乏しい状況にあり。都市部以外の地域では、カバレッジの低く、プライマリヘルスケアにも多くの課題を残す。
インフォーマルセクターの医療保障など、基本的な医療保障の普遍化が優先されるべき段階にある。ただし、2040年代後半から始まる高齢化は、急速に進むことが予想されている。
Vietnam 医療保険と年金保険がベトナム社会保障(VSS)で統合的に運営されている。医療保障については、インフォーマルセクターへのカバレッジを進めている段階。自己負担率が極めて高い点が問題になっている他、医療機関と患者による不正受給も問題となっている。
高齢者協会などが全国的に組織化されている点に特徴があるが、社会サービスとしての公的サービスはほとんど存在しない。地方自治体が運営する高齢者施設は、身寄りのない高齢者に限定されており、質の水準も低い。
Myanmar No information No information
Brunei Darussalam
No information No information
Singapore No information No information
(出典)JICA(2012)「アジア地域社会保障セクター基礎情報収集・確認調査報告書」等を基に作成
各国の社会保障制度の整備状況と高齢化に関する課題等 (未定稿)
12
2013.6.14厚生労働省第1回「国際的なActive Agingにおける日本の貢献に関する検討会」
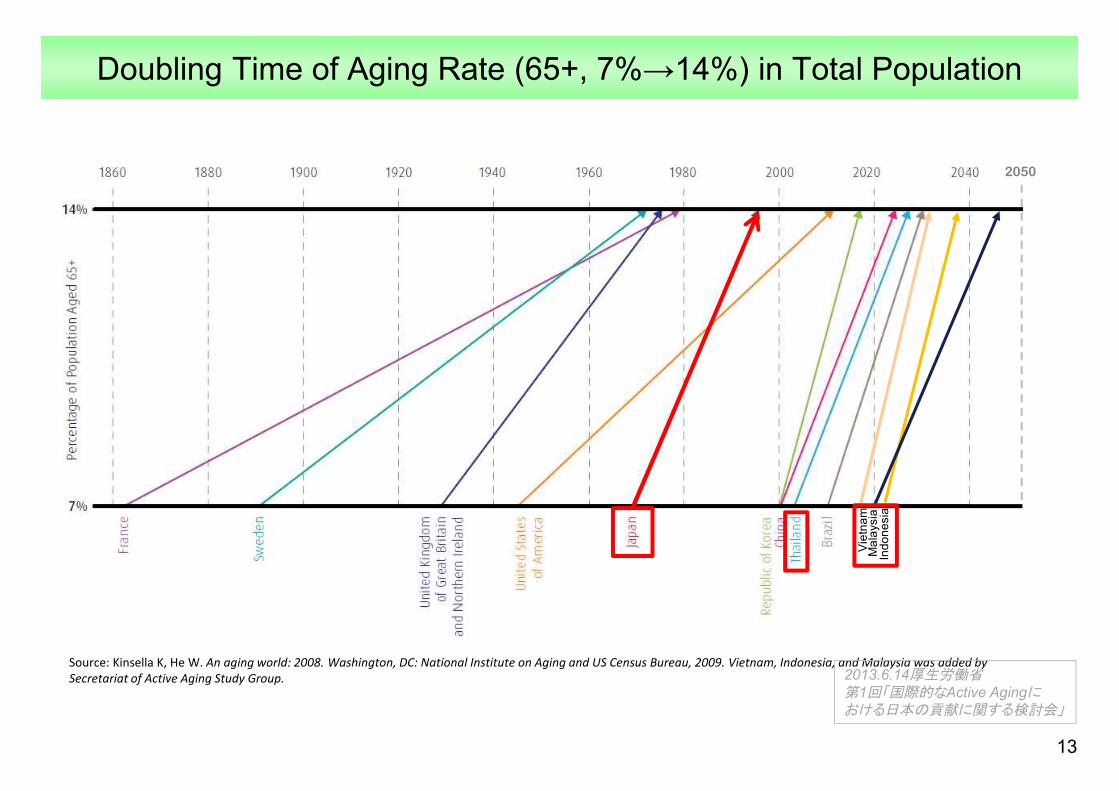
Doubling Time of Aging Rate (65+, 7%→14%) in Total Population
13
Source: Kinsella K, He W. An aging world: 2008. Washington, DC: National Institute on Aging and US Census Bureau, 2009. Vietnam, Indonesia, and Malaysia was added by Secretariat of Active Aging Study Group.
Vie
tnam
Indo
nesi
aM
alay
sia
2050
2013.6.14厚生労働省第1回「国際的なActive Agingにおける日本の貢献に関する検討会」
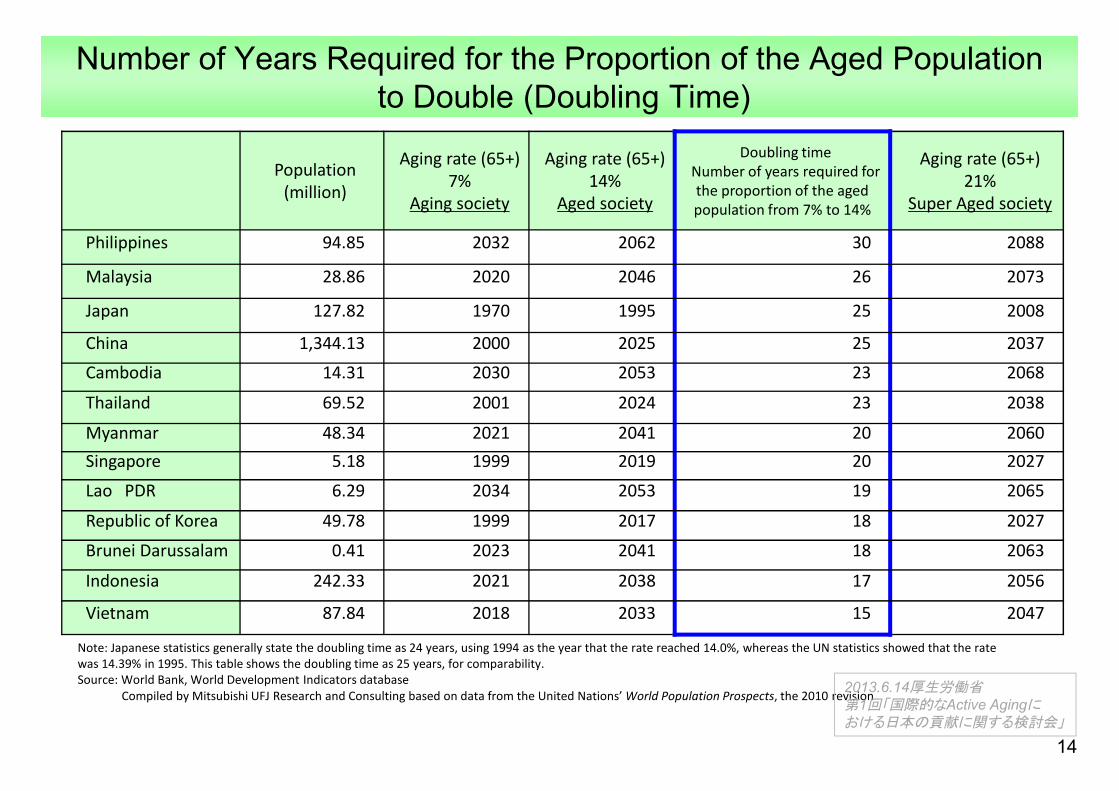
Number of Years Required for the Proportion of the Aged Populationto Double (Doubling Time)
Population(million)
Aging rate (65+)7%
Aging society
Aging rate (65+)14%
Aged society
Doubling timeNumber of years required for the proportion of the aged population from 7% to 14%
Aging rate (65+)21%
Super Aged society
Philippines 94.85 2032 2062 30 2088
Malaysia 28.86 2020 2046 26 2073
Japan 127.82 1970 1995 25 2008
China 1,344.13 2000 2025 25 2037Cambodia 14.31 2030 2053 23 2068
Thailand 69.52 2001 2024 23 2038
Myanmar 48.34 2021 2041 20 2060Singapore 5.18 1999 2019 20 2027Lao PDR 6.29 2034 2053 19 2065
Republic of Korea 49.78 1999 2017 18 2027
Brunei Darussalam 0.41 2023 2041 18 2063
Indonesia 242.33 2021 2038 17 2056
Vietnam 87.84 2018 2033 15 2047
14
Note: Japanese statistics generally state the doubling time as 24 years, using 1994 as the year that the rate reached 14.0%, whereas the UN statistics showed that the rate was 14.39% in 1995. This table shows the doubling time as 25 years, for comparability.Source: World Bank, World Development Indicators database
Compiled by Mitsubishi UFJ Research and Consulting based on data from the United Nations’ World Population Prospects, the 2010 revision2013.6.14厚生労働省第1回「国際的なActive Agingにおける日本の貢献に関する検討会」

Milestone Elderly Policies in Japan
15
Rate of 65+ in total pop. Policies and Schemes
1960sBeginning of Elderly Welfare
5.7%(1960)
1961: Universal Pension System1961: Universal Health Care1963: Elderly Welfare Law (start of Special Nursing Home; SNH)
1970sExpansion of Expenditure for Elderly healthcare
7.1%(1970)
1973: Free Health Care for Elderly
1980sHospitalization and Bedridden elderly Elderly issues recognized as Social Problem
9.1%(1980)
1982: Elderly Health Act1983: Partial Co-payment for Elderly1988: Municipalities to make health and welfare plans for Elderly1989: Gold Plan (National Strategy to secure Elderly services)
1990sImplementation of Gold Plan
12.0%(1990)
1994: New Gold Plan1995: Aging Society Basic Law
2000sLong Term Care Insurance
17.3%(2000)
2000: Long Term Care Insurance 2006: Elderly Abuse Prevention Law
2013.6.14厚生労働省第1回「国際的なActive Agingにおける日本の貢献に関する検討会」
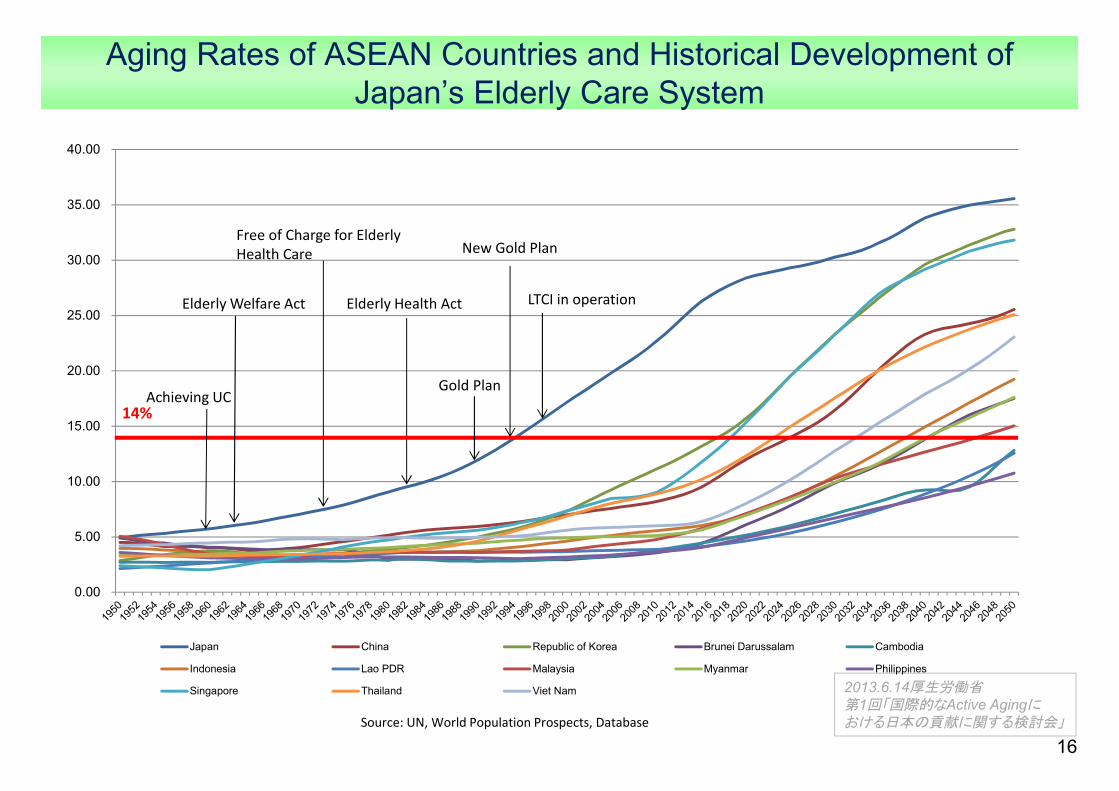
Aging Rates of ASEAN Countries and Historical Development of Japan’s Elderly Care System
16Source: UN, World Population Prospects, Database
2013.6.14厚生労働省第1回「国際的なActive Agingにおける日本の貢献に関する検討会」
0.00
5.00
10.00
15.00
20.00
25.00
30.00
35.00
40.00
Japan China Republic of Korea Brunei Darussalam Cambodia
Indonesia Lao PDR Malaysia Myanmar Philippines
Singapore Thailand Viet Nam
Free of Charge for Elderly Health Care
Elderly Health Act
New Gold Plan
LTCI in operation
14%Achieving UC
Elderly Welfare Act
Gold Plan

Appendix
17

18
International Comparison of Healthcare Facilities[OECD Health Data 2012, OECD Health at a Glance: Asia / Pacific 2012]
CountryAverage length of
stays for acute care in hospitals
Doctor consultations per
capita
Hospital beds per 1,000 population
Doctors per 1,000 population
Nurses per 1,000 population
Japan 18.2 13.1 13.7 2.2 10.1(2010) (2009) (2008) (2010) (2010)
Malaysia 4.4 3.5 1.9 1.2 2.4(2006) (2010) (2010) (2010) (2010)
Thailand 4.2 2.1 2.1 0.3 1.7(2005) (2005) (2010) (2010) (2010)
Indonesia 4.3 - 0.6 0.3 2.0 (2009) (2010) (2011) (2007)
Vietnam 6.7 2.3 3.1 1.2 0.9(2003) (2010) (2009) (2008) (2009)
Singapore 4.7 - 2.0 1.7 5.2(2006) (2010) (2011) (2011)
Brunei Darussalam 4.8 3.9 2.7 1.4 6.5(2010) (2008) (2009) (2010) (2011)
Republic of Korea 10.6 12.9 8.8 2.0 4.7(2003) (2010) (2010) (2011) (2011)
China 8.6 4.7 4.2 1.8 1.7(2009) (2011) (2010) (2011) (2011)
Philippines - - 0.5 1.1 4.3(2010) (2004) (2004)
Cambodia 5.0 0.7 0.7 0.2 0.6(2011) (2011) (2011) (2010) (2010)
Lao PDR - - 0.7 0.2 1.0 (2010) (2005) (2005)
Myanmar 6.3 - 0.6 0.6 0.6(2008) (2006) (2011) (2011)
2013.6.14厚生労働省第1回「国際的なActive Agingにおける日本の貢献に関する検討会」

Elderly Situation of ASEAN+3 (60+)60 or over 1990
(thousands)1995
(thousands)2000
(thousands)2005
(thousands)2010
(thousands)2015
(thousands)2025
(thousands)2050
(thousands)
Brunei Darussalam 11 4.4% 13 4.5% 14 4.4% 17 4.8% 23 5.7% 33 7.7% 60 12.1% 139 23.1%
Cambodia 431 4.5% 510 4.6% 591 4.7% 719 5.4% 880 6.2% 1,072 7.1% 1,587 9.5% 3,612 19.0%
Indonesia 11,157 6.1% 13,176 6.6% 15,473 7.3% 17,633 7.8% 19,585 8.2% 23,164 9.2% 35,774 13.2% 74,703 25.5%
Lao PDR 239 5.7% 267 5.6% 296 5.6% 324 5.6% 364 5.9% 428 6.5% 622 8.4% 1,581 18.9%
Malaysia 1,025 5.6% 1,188 5.7% 1,443 6.2% 1,727 6.6% 2,191 7.7% 2,861 9.3% 4,622 13.1% 8,850 20.4%
Myanmar 2,734 7.0% 3,019 7.2% 3,222 7.2% 3,404 7.3% 3,801 7.9% 4,706 9.4% 6,897 13.0% 13,566 24.5%
Philippines 2,884 4.7% 3,333 4.8% 3,870 5.0% 4,528 5.3% 5,350 5.7% 6,859 6.8% 10,528 8.9% 23,633 15.3%
Singapore 254 8.4% 326 9.4% 422 10.8% 522 12.2% 713 14.0% 971 18.1% 1,575 27.1% 2,308 37.8%
Thailand 4,176 7.3% 5,247 8.8% 6,487 10.3% 7,594 11.4% 8,902 12.9% 10,842 15.3% 15,529 21.3% 22,620 31.8%
Vietnam 4,874 7.3% 5,602 7.6% 6,148 7.8% 6,641 8.0% 7,350 8.4% 9,359 10.1% 15,218 15.3% 32,037 30.8%
China 101,862 8.9% 116,398 9.6% 129,706 10.2% 142,159 10.9% 165,151 12.3% 206,399 15.1% 281,597 20.2% 439,206 33.9%
Japan 21,269 17.4%
25,312 20.3% 29,275 23.3% 33,486 26.5% 38,542 30.5% 41,533 33.0% 43,599 35.5% 45,005 41.5%
Republic of Korea
3,302 7.7% 4,137 9.3% 5,163 11.2% 6,257 13.3% 7,574 15.7% 9,177 18.7% 13,679 27.2% 18,320 38.9%
Source: UN: World Population Prospects: The 2010 Revision Population Database 19
2013.6.14厚生労働省第1回「国際的なActive Agingにおける日本の貢献に関する検討会」

Elderly Situation of ASEAN+3 (65+)60 or over 1990
(thousands)1995
(thousands)2000
(thousands)2005
(thousands)2010
(thousands)2015
(thousands)2025
(thousands)2050
(thousands)Brunei
Darussalam7 2.8
%9 3.0% 10 2.9% 12 3.2% 14 3.6% 19 4.4% 39 7.8% 105 17.5
%
Cambodia 266 2.8%
317 2.8% 377 3.0% 435 3.3% 538 3.8% 667 4.4% 1,006 6.0% 2,432 12.8%
Indonesia 6,932 3.8%
8,238 4.1% 9,849 4.6% 11,662 5.1% 13,318 5.6% 15,153 6.0% 23,265 8.6% 56,482 19.2%
Lao PDR 151 3.6%
173 3.6% 195 3.7% 217 3.8% 240 3.9% 273 4.1% 398 5.4% 1,054 12.6%
Malaysia 655 3.6%
767 3.7% 894 3.8% 1,122 4.3% 1,355 4.8% 1,765 5.7% 3,038 8.6% 6,532 15.0%
Myanmar 1,743 4.4%
1,989 4.7% 2,209 4.9% 2,322 5.0% 2,459 5.1% 2,810 5.6% 4,467 8.4% 9,741 17.6%
Philippines 1,919 3.1%
2,113 3.1% 2,462 3.2% 2,877 3.4% 3,390 3.6% 4,104 4.0% 6,861 5.8% 16,678 10.8%
Singapore 169 5.6%
220 6.3% 289 7.4% 362 8.5% 458 9.0% 631 11.7% 1,133 19.5% 1,943 31.8%
Thailand 2,640 4.6%
3,428 5.7% 4,352 6.9% 5,362 8.0% 6,143 8.9% 7,221 10.1% 10,910 15.0 %
17,816 25.1%
Vietnam 3,330 5.0%
3,780 5.1% 4,411 5.6% 4,874 5.9% 5,274 6.0% 5,900 6.4% 10,107 10.2% 23,976 23.1%
China 68,050 5.9%
77,576 6.4% 88,912 7.0% 99,087 7.6% 109,845 8.2% 129,928 9.5% 195,500 14.0% 331,204 25.6%
Japan 14,607 12.0%
17,919 14.4% 21,602 17.2% 25,091 20.0% 28,707 22.7% 33,109 26.3% 36,006 29.3% 38,599 35.6%
Republic of Korea
2,140 5.0 2,639 5.9% 3,374 7.3% 4,368 9.3% 5,369 11.1% 6,469 13.2% 9,833 19.6% 15,433 32.8%
Source: UN: World Population Prospects: The 2010 Revision Population Database
20
2013.6.14厚生労働省第1回「国際的なActive Agingにおける日本の貢献に関する検討会」
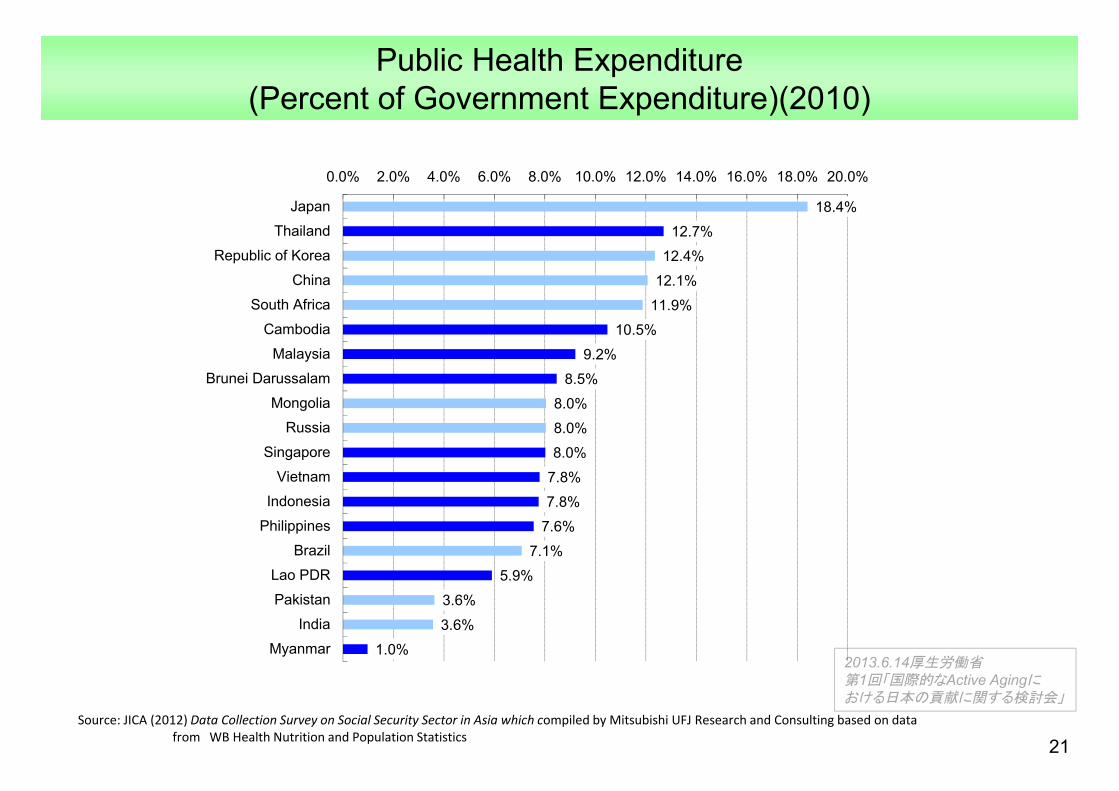
Public Health Expenditure(Percent of Government Expenditure)(2010)
21Source: JICA (2012) Data Collection Survey on Social Security Sector in Asia which compiled by Mitsubishi UFJ Research and Consulting based on data
from WB Health Nutrition and Population Statistics
2013.6.14厚生労働省第1回「国際的なActive Agingにおける日本の貢献に関する検討会」
18.4%
12.7%
12.4%
12.1%
11.9%
10.5%
9.2%
8.5%
8.0%
8.0%
8.0%
7.8%
7.8%
7.6%
7.1%
5.9%
3.6%
3.6%
1.0%
0.0% 2.0% 4.0% 6.0% 8.0% 10.0% 12.0% 14.0% 16.0% 18.0% 20.0%
Japan
Thailand
Republic of Korea
China
South Africa
Cambodia
Malaysia
Brunei Darussalam
Mongolia
Russia
Singapore
Vietnam
Indonesia
Philippines
Brazil
Lao PDR
Pakistan
India
Myanmar

Health Expenditure per Capita (current US$)(2010)
22Source: JICA (2012) Data Collection Survey on Social Security Sector in Asia which compiled by Mitsubishi UFJ Research and Consulting based on data
from WB Health Nutrition and Population Statistics
2013.6.14厚生労働省第1回「国際的なActive Agingにおける日本の貢献に関する検討会」
4,065
1,733
1,439
990
882
649
525
368
221
179
120
83
77
77
54
46
45
22
17
0 500 1,000 1,500 2,000 2,500 3,000 3,500 4,000 4,500
Japan
Singapore
Republic of Korea
Brazil
Brunei Darussalam
South Africa
Russia
Malaysia
China
Thailand
Mongolia
Vietnam
Philippines
Indonesia
India
Lao PDR
Cambodia
Pakistan
Myanmar
(US$)

Overview of Health Security 1/2Japan Malaysia Thailand Indonesia Vietnam
Population 120 million 28 million 65.5 million 240 million 87 millionOut of pocket rate to
health expenditure 14.3% 34.2% 13.9% 38.3% 57.6%
Universal Coverage[Achieved or target
year]
Yes1961 Yes Yes
2002No
[expected in 2014]
NoTarget year is not set
*6
Health Security for Civil Servants
Government official mutual association
Local Government official mutual association
Tax based health service provision CSMBS ASKES SHI
Contributory /Non-Contributory Contrributory Non-Contributory Non-Contributory Contributory Contributory
Beneficiaries 9 million ― 5.9 million 16.5 million 2.3 million
Health Security for private employees
Society Managed Health Insurance
Association Managed Health Insurance
Tax based health service provision SSS JAMSOSTEK SHI
Contributory /Non-Contributory Contrributory
Non-Contributory Contributory Contributory Contributory
Beneficiaries 30 mil/35mil ― 9 million 5 million 6.6 millionHealth Security for
informal sector andothers
National Health Insurance/ Medical System
for Aged 75 and over
Tax based health service provision UC
SSS(voluntary)JAMKESDA
JAMKESMAS SHI
Contributory /Non-Contributory Contrributory Non-Contributory Non-Contributory
ContributoryNon-ContributoryNon-Contributory Contributory
Beneficiaries 39 mil/14mil ― 47 million1.65 million
50 million76 million 46 million
Entire Coverage Almost 100% 100% Almost 100% 65% 63.71%Service ProvisionPrivate:Public *1
Mainly Private75:25
Mainly Private *562:38
Mainly Public n.a.
Mainly Public40:60
Mainly Publicn.a
23
2013.6.14厚生労働省第1回「国際的なActive Agingにおける日本の貢献に関する検討会」
(未定稿)

Overview of Health Security 2/2
24
Philippines Lao PDR Cambodia China Rep. of Korea Singapore BruneiDarussalam Myanmar
Population 94 million 6.2 million 14 millionOut of pocket rate to
health expenditure 54.0% 51.2% 40.4%
UC[Achieved or target year] No No
2020 No
Health Security forcivil servants
PhilHealth(Paying program)
SASS NSSF-C(Planning)
Contributory /Non-Contributory Contributory Contributory -
Beneficiaries 5.94 million 0.45 million -Health Security for
EmployeesPhilHealth
(Paying program)SSS NSS
(Planning)Contributory/Non-Contributory Contributory Contributory -
Beneficiaries 17.79 million 0.12 million -Health Security for
informal sectorPhilHealth
(Sponsored program)
CHBIHEF
CHBIHEF
Contributory /Non-Contributory Non-Contributory Contributory
Non-ContributoryContributory
Non-Contributory
Beneficiaries 38.94 million 0.14 million0.50 million
0.14 million3.3 million
Entire Coverage 82 or 50%*7 19.5% 24.6%Service ProvisionPrivate:Public *1
Mainly Private*860:40
Mainly Publicn.a.
Mainly Public n.a.
*1 Ratio of the number of hospitals*2 The enrollment figures for each scheme do not add up to the total population due to the rounding of figures.*3 The enrollment figures are the actual number including dependents and other beneficiaries (except JAMSOSTEK).*4 The total coverage figures are actual numbers, in principle.*5 There are more private hospitals than public ones, but 75% of all patients seek services at public hospitals (Malaysia).*6 A target of 73% is set for 2015 (Vietnam).*7 The official figure of 82% was reportedly calculated by multiplying the number of insured by the average number of household members, and PhilHealth, who published this figure, admits this figure to be questionable. Some researchers suggest the coverage to be around 50%.*8 Compared by the number of beds, however, the proportion of public hospitals is higher, at 60:40 (the Philippines).Source: Compiled by Mitsubishi UFJ Research & Consulting based on data from various sourcesSource: JICA (2012) Data Collection Survey on Social Security Sector in Asia and various sources
to be added
2013.6.14厚生労働省第1回「国際的なActive Agingにおける日本の貢献に関する検討会」
(未定稿)
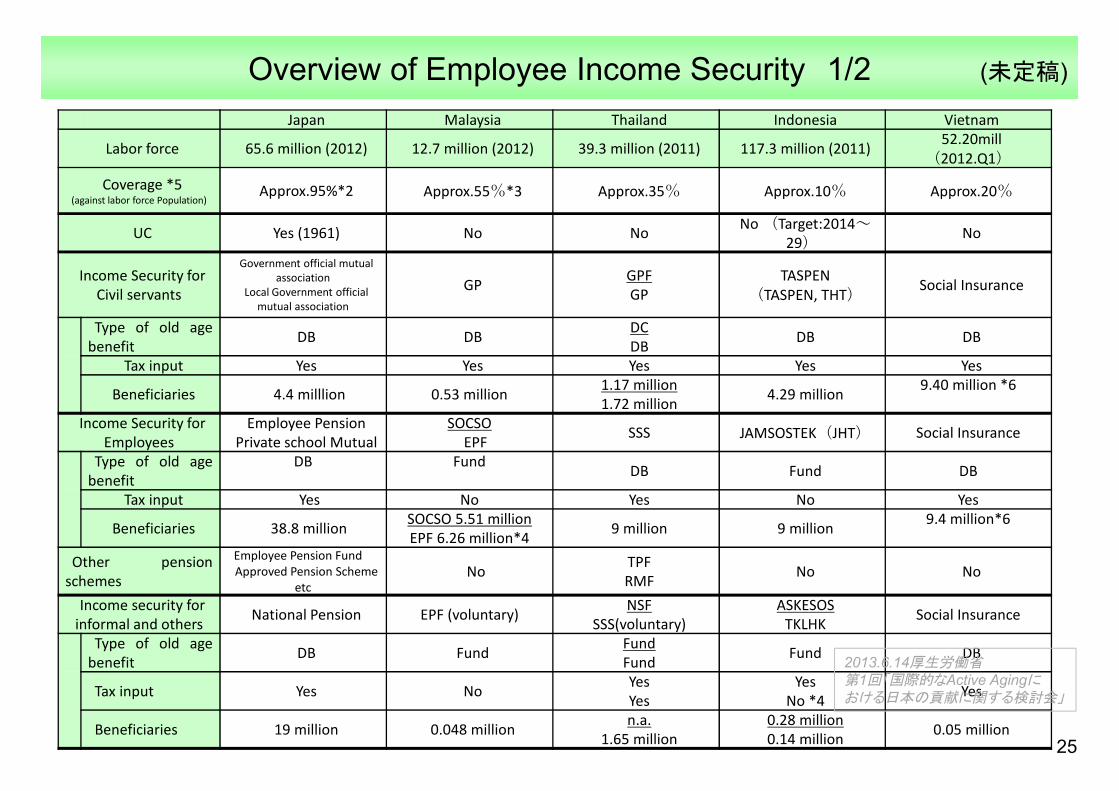
Overview of Employee Income Security 1/2Japan Malaysia Thailand Indonesia Vietnam
Labor force 65.6 million (2012) 12.7 million (2012) 39.3 million (2011) 117.3 million (2011) 52.20mill(2012.Q1)
Coverage *5(against labor force Population)
Approx.95%*2 Approx.55%*3 Approx.35% Approx.10% Approx.20%
UC Yes (1961) No No No (Target:2014~29) No
Income Security for Civil servants
Government official mutual association
Local Government official mutual association
GP GPFGP
TASPEN(TASPEN, THT) Social Insurance
Type of old agebenefit DB DB DC
DB DB DB
Tax input Yes Yes Yes Yes Yes
Beneficiaries 4.4 milllion 0.53 million 1.17 million1.72 million 4.29 million 9.40 million *6
Income Security for Employees
Employee PensionPrivate school Mutual
SOCSOEPF SSS JAMSOSTEK(JHT) Social Insurance
Type of old agebenefit
DB Fund DB Fund DB
Tax input Yes No Yes No Yes
Beneficiaries 38.8 million SOCSO 5.51 millionEPF 6.26 million*4 9 million 9 million 9.4 million*6
Other pensionschemes
Employee Pension FundApproved Pension Scheme
etcNo TPF
RMF No No
Income security for informal and others National Pension EPF (voluntary) NSF
SSS(voluntary)ASKESOS
TKLHK Social Insurance
Type of old agebenefit DB Fund Fund
Fund Fund DB
Tax input Yes No YesYes
YesNo *4 Yes
Beneficiaries 19 million 0.048 million n.a.1.65 million
0.28 million0.14 million 0.05 million
25
2013.6.14厚生労働省第1回「国際的なActive Agingにおける日本の貢献に関する検討会」
(未定稿)
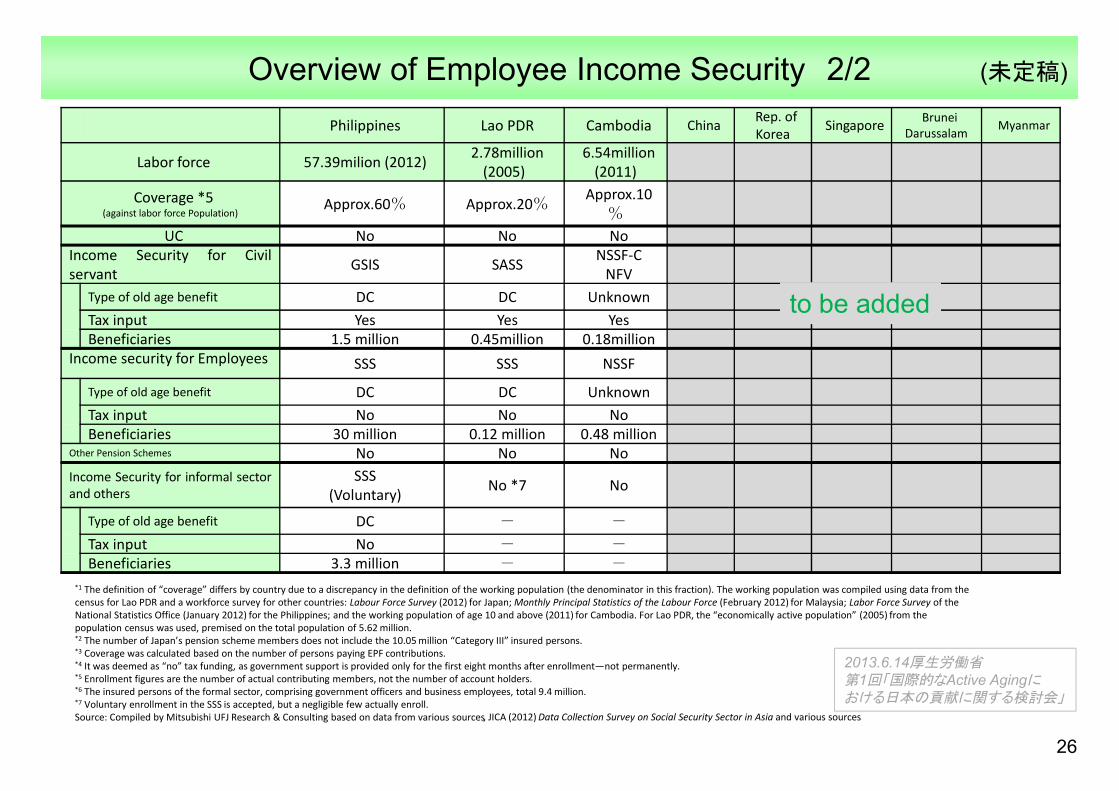
Overview of Employee Income Security 2/2
26
Philippines Lao PDR Cambodia China Rep. of Korea Singapore Brunei
Darussalam Myanmar
Labor force 57.39milion (2012) 2.78million (2005)
6.54million (2011)
Coverage *5(against labor force Population)
Approx.60% Approx.20% Approx.10%
UC No No NoIncome Security for Civilservant GSIS SASS NSSF-C
NFVType of old age benefit DC DC UnknownTax input Yes Yes YesBeneficiaries 1.5 million 0.45million 0.18million
Income security for Employees SSS SSS NSSF
Type of old age benefit DC DC UnknownTax input No No NoBeneficiaries 30 million 0.12 million 0.48 million
Other Pension Schemes No No NoIncome Security for informal sectorand others
SSS(Voluntary) No *7 No
Type of old age benefit DC - -
Tax input No - -Beneficiaries 3.3 million - -
*1 The definition of “coverage” differs by country due to a discrepancy in the definition of the working population (the denominator in this fraction). The working population was compiled using data from the census for Lao PDR and a workforce survey for other countries: Labour Force Survey (2012) for Japan; Monthly Principal Statistics of the Labour Force (February 2012) for Malaysia; Labor Force Survey of the National Statistics Office (January 2012) for the Philippines; and the working population of age 10 and above (2011) for Cambodia. For Lao PDR, the “economically active population” (2005) from the population census was used, premised on the total population of 5.62 million.*2 The number of Japan’s pension scheme members does not include the 10.05 million “Category III” insured persons.*3 Coverage was calculated based on the number of persons paying EPF contributions. *4 It was deemed as “no” tax funding, as government support is provided only for the first eight months after enrollment—not permanently.*5 Enrollment figures are the number of actual contributing members, not the number of account holders.*6 The insured persons of the formal sector, comprising government officers and business employees, total 9.4 million.*7 Voluntary enrollment in the SSS is accepted, but a negligible few actually enroll.Source: Compiled by Mitsubishi UFJ Research & Consulting based on data from various sources, JICA (2012) Data Collection Survey on Social Security Sector in Asia and various sources
to be added
2013.6.14厚生労働省第1回「国際的なActive Agingにおける日本の貢献に関する検討会」
(未定稿)

Outline of Measures Related to Social Welfare
27
Japan Malaysia Thailand Indonesia Vietnam PhilippinesLao PDR
Cambodia China Rep. of Korea
Singapore BruneiDarussalam
Myanmar
Implementation ofCCT
No No No PKH No 4P No JFPR・ESSP
Community based welfare activity
No CWCSML
projectNHIF
PNPM
National program of
poverty production
KALAHI-CIDSS No No
Database for poverty reduction
No E-Kasih BMN PBI
NTPPR(National Targeted
Program for Poverty
Reduction)
NHTS-PR No*1 ID-Poor
Public assistance
Public Assista
nce
Cash benefit scheme
for needy dependen
t
Cash benefit scheme for
needy dependent
JSPACA, JSLU,PKSA
Cash benefit scheme for
needy dependent
No No No
Cash benefit for elderly except pension scheme
Social Welfare Pension
Elderly allowance
Elderly allowance JSLU
Welfare allowance for
the elderlySocial
Welfareallowance
No No No
*1 Identification of the poor is covered in the household budget survey, expenditure survey, the census, and other surveys, but the results are not compiled as a database.
Source: JICA (2012) Data Collection Survey on Social Security Sector in Asia and various sources
to be added
2013.6.14厚生労働省第1回「国際的なActive Agingにおける日本の貢献に関する検討会」
(未定稿)