Embed Size (px)
Citation preview

Community Health Assessment Report & Action Plan
2011-2012

Community Health Assessment Report
Contents
I. Executive Summary 2
II. Focus Areas- Health Service Actions 4- Demographics 7- Income and Employment 9- Insurance Status 13- Vital Statistics 15- Health Statistics 17- Child-related issues 27- Aging Population 37- Healthcare Access 43- Health Behaviors and Risk 46- Social, Economic, and Environmental Factors 48
III. Community Health Council Stakeholder Survey Results 52
IV. Community Health Council Action Plan 55
V. Memorial Health System Action Plan 57
VI. Reference List/Data Sources 59
Note: All years in report represent year of data collection.
2

Executive Summary
Purpose The purpose of this report was to collect and analyze relevant data to prioritize community needs so that the Community Health Council, and its members, can develop and implement action plans to meet those needs and improve current programs and systems.
Data SourcesMultiple data sources were used to construct this report with varied data collection time periods and methodologies. All were chosen based on data integrity, sponsoring agency, and repetition of study. The one source that differs somewhat is the Local Public Health System Performance Assessment from the National Public Health Performance Standards Program. The results are based on local health experts’ completion of the assessment. Every effort was made to cross reference data points and integrate findings in the present report. All sources are listed in the reference list on page 59.
Focus AreasWithin the 11 focus areas the following trends, or notable findings, emerged:
Monitoring Health Status and Evaluating Services presented the greatest opportunities for community health service actions
Washington County population is declining and aging Per capita income in Washington County has increased although a segment of the
population lives below the poverty level with the poorest group being children under the age of 5 and a larger percentage of those under age 18 living in poverty than at the state and federal levels
OWF and TANF assistance to children increased while it has decreased to adults in Washington County
Food assistance has trended upward The number of uninsured adults and children has increased Washington County has a higher infant mortality rate than the state Leading causes of death in Washington County include cancer and heart disease with
the highest cancer site incidents and mortality rates being lung, breast, and prostate; Washington County residents lag the state in PAP tests, mammography and colonoscopies (but not PSA testing)
Washington County residents are more likely to have had a heart attack, heart diseases or a stroke than the state average and less than 50% recognize symptoms of heart attack and stroke
There has been an increase in maternal smoking during pregnancy Child custody rates have risen and reunification with parents has simultaneously
decreased somewhat Washington County has higher rates of abuse and neglect of children of all ages than
the state Our population is aging and the incidence and severity of their disabilities is
increasing with the largest area being physical disability
3

Due to the lower educational attainment by Washington County’s older population they may be more economically vulnerable
Preventable hospitalizations are higher for residents with uncontrolled diabetes pneumonia and COPD than the state
Washington County’s ratio of physicians to population is higher than the state (more residents per physician)
Washington County health risk behaviors include a higher incidence of smoking and less exercise than the state
Washington County ranks 82nd out of 88 counties in Ohio for physical environmental (quality and built environment).
Washington County ranks 72nd out of 88 counties in Ohio for clinical care (quality and access).
Washington County ranks 62nd out of 88 counties in Ohio for health behaviors (tobacco use, diet/exercise, alcohol use, unsafe sex).
Washington County ranks 22nd out of 88 counties in Ohio for social/economic factors (education, employment, income, family/social support, community safety).
4

Focus Areas
Health Service Actions1
Purpose of National Public Health Performance Standards Program (NPHPSP):
To improve the practice of public health and performance of public health systems
Guide state and local jurisdictions in evaluating current performance against optimal standards
Essential Public Health Services (EPHS) – include 2-4 model standardsModel Standards – describe key aspects of optimally performing health system
Ten EPHS and the respective model standards:
1. Monitor Health Status to Identify Community Health Problems Population-Based Community Health Profile (CHP) Access to and Utilization of Current Technology Maintenance of Population Health Registries
2. Diagnose and Investigate Health Problems and Health Hazards Identification and Surveillance of Health Threats Investigation and Response to Public Health Threats and Emergencies Laboratory Support for Investigation of Health Threats
3. Inform, Educate and Empower People about Health Issues Health Education and Promotion Health Communication Risk Communication
4. Mobilize Community Partnerships to Identify and Solve Health Problems Constituency Development Community Partnerships
5. Develop Policies and Plans that Support Individual and Community Health Efforts
Government Presence at Local Level Public Health Policy Development Community Health Improvement Process Plan for Public Health Emergencies
5

6. Enforce Laws and Regulations that Protect Health and Ensure Safety Review and Evaluate Laws, Regulations, and Ordinances Involvement in the Improvement of Laws, Regulations, and Ordinances Enforce Laws, Regulations, and Ordinances
7. Link People to Needed Personal Health Services and Assure the Provision of Health Care when Otherwise Unavailable
Identification of Populations with Barriers to Personal Health Services Assuring the Linkage of People to Personal Health Services
8. Assure a Competent Public and Personal Health Care Workforce Workforce Assessment Planning, and Development Public Health Workforce Standards Life-Long Learning Through Continuing Education, Training, and Mentoring Public Health Leadership Development
9. Evaluate Effectiveness, Accessibility, and Quality of Personal and Population-Based Health Services
Evaluation of Population-Based Health Services Evaluation of Personal Health Care Services Evaluation of the Local Public Health System
10. Research for New Insights and Innovative Solutions to Health Problems Fostering Innovation Linkage with Institutions of Higher Learning and/or Research Capacity to Initiate or Participate in Research
6

Overall
2. Diagnose/Investigate
6. Enforce Laws
3. Educate/Empower
7. Link to Health Services
10. Research/Innovations
8. Assure Workforce
5. Develop Policies/Plans
4. Mobilize Partnerships
9. Evaluate Services
1. Monitor Health Status
0 10 20 30 40 50 60 70 80 90 100
Ranked Summary of EPHS Performance Scores, 2009*
*Bar graph represents overall performance scores for each EPHS on 100-point scale.
Evaluation of EPHS ActivityNO ACTIVITY 0% or absolutely no activity.MINIMAL Greater than zero, but no more than 25% of the activityACTIVITY described within the question is met.MODERATE Greater than 25%, but no more than 50% of the activityACTIVITY described within the question is met.SIGNIFICANT Greater than 50%, but no more than 75% of the activityACTIVITY described within the question is met.OPTIMAL Greater than 75% of the activity described within theACTIVITY question is met.
7

Demographics
Population2,3,4,5
- Washington County is the 39th most populous of the 88 counties in Ohio. The residents of Washington County account for 0.6% of Ohio’s total population.
Washington County Population 2000 2002 2009Total population 63,251 62,561 61,048
Gender2
Gender by Age Group in Washington County, 2000* Male Female<19 years 8,623 8,06820-39 years 7,690 8,04140-59 years 8,968 9,22660-79 years 4,664 5,47580+ years 786 1,646All ages 30,731 32,456
*Estimates
Age2,3,5
Population by Age in Washington County 2000Number Percent
Under 6 years 4,570 7.2%6-17 years 10,301 16.3%18-24 years 5,610 8.9%25-44 years 17,498 27.7%45-64 years 15,831 25.0%65+ years 9,441 14.9%Total population 63,251 100.0%
Population by Age in Washington County 2000 2009Number Percent Number Percent
Under 17 years 14,871 23.5% 12,792 21.0%65+ years 9,441 14.9% 11,859 19.4%
Median Age in Washington County 2000 2006-2008**Median age 39.1 41.1
**Between 2006-2008, the median age in Ohio was 37.9.
8

Race/Ethnicity2,4,5,6
Population of Washington County by Race 2000 2002-2005Number Percent Number Percent
White 61,403 97.1% 60,747 97.1%African-American 481 0.8% 563 0.9%American Indian/Alaska Native 159 0.3% 125 0.2%Asian 256 0.4% 313 0.5%Native Hawaiian/Pacific Islander 13 0.0002% 19 0.03%Hispanic (any race) 263 0.4% 319 0.05%Two or more races 805 1.3% 438 0.7%Total Minority Population 2,028 3.2% 1814 2.9%
Education5,7
Education Attainment, 2000* Washington Co Ohio U.S.No high school diploma 15.5% 17.0% 19.6%High school diploma or GED 43.0% 36.1% 28.6%Some college, no degree 19.4% 19.9% 21.1%Associate’s degree 7.1% 5.9% 6.3%Bachelor’s degree 9.4% 13.7% 15.5%Master’s/professional degree or higher 5.6% 7.5% 8.9%
*Percent of residents ages 25+ attaining indicated level of education.
9

10

Income and Employment
Income2,3,5
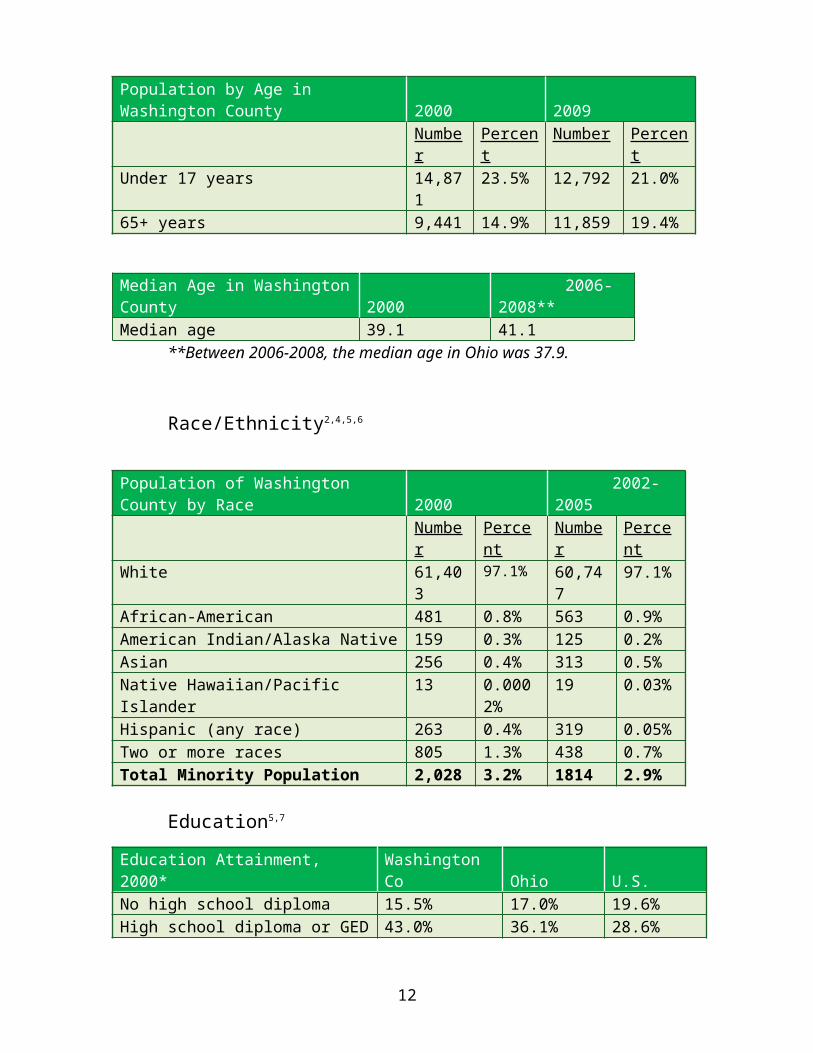
- The per capita income of a region provides a good barometer of its economic health. Over the last decade, per capita income growth in Ohio has been highly correlated with employment growth.
Per Capita Income Comparisons Washington Co Ohio U.S.Per capita income, 2000 $22,733 $28,206 $29,845Per capita income, 2008 $32,225 $35,889 $40,166
1999 2000 2001 2002 2003 2004 2005 2006 2007 2008$15,000
$20,000
$25,000
$30,000
$35,000
Per Capita Personal Income
Washington County
Household Income, 2000 Washington CountyNumber Percent
Total households 25,162 100.0%Less than $10,000 2,502 9.9%$10,000 - $19,999 4,184 16.6%$20,000 - $29,999 4,192 16.7%$30,000 - $39,999 3,518 14.0%$40,000 - $49,999 2,748 10.9%$50,000 - $59,000 2,273 9.0%$60,000 - $74,999 2,384 9.5%$75,000 - $99,999 1,891 7.5%$100,000 - $149,999 981 3.9%$150,000 - $199,999 215 0.9%$200,000 or more 274 1.1%Median Household Income* $34,275
*In 2000, the median household income for residents of Ohio was $40,956 and the median household income for all U.S. residents was $41,994.
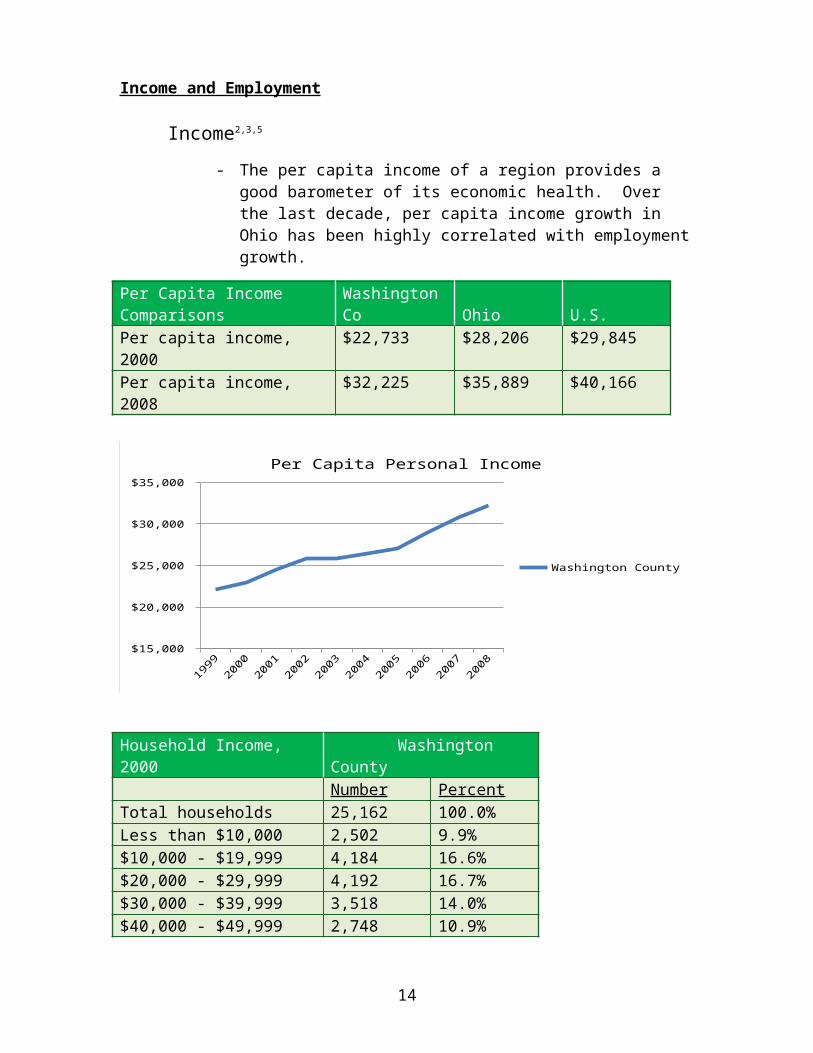
Poverty2,3,4,5,6
11
Percent of Residents in Poverty, 2002-2005* Washington Co OhioPopulation <100% federal poverty level 11.4% 10.6%Population <200% federal poverty level 33.1% 26.4%
*Federal Poverty Level as issued by the U.S. Department of Health and Human Services, and published in the Federal Register.
2000 2005 2008**0%
5%
10%
15%
20%
25%
30%
Percentage of Washington County Residents Living in Poverty
All AgesChildren
**In 2008, a family of 3 was considered at or below 100% of poverty with an annual household income of $16,600.
Residents Living Below Federal Poverty Level, 2008* Washington Co. Ohio U.S.<18 Years of age in poverty 24.3% 18.5% 18.2%All ages in poverty 16.9% 13.3% 13.2%
- The poorest group of Ohioans is young children under the age of five living in single headed households, followed by single female-headed families and African Americans.
12

Labor Force/Employment3,5,6
Major Employers in Washington County, 2008 TypeAmerican Electric Power Co UtilityAmericas Styrenics MfgEnergizer Battery MfgEramet Marietta Inc MfgEvonik Degussa MfgGlobe Metallurgical MfgKRATON Polymers LLC MfgMarietta City Schools GovtMarietta College ServMarietta Memorial Health System ServPioneer Pipe MfgRJF International Corp MfgSolvay Advanced Polymers MfgTata Enterprises ServThermo Fisher Scientific Inc Mfg
The size of a county’s labor force is an indication of economic health. It is influenced both by the economy and the size and composition of the population.
Civilian Labor Force in Washington County 2005 2006 2007 2008 2009Civilian labor force Employed Unemployed
32,500 30,600 1,900
33,000 31,300 1,700
33,100 31,400 1,700
33,100 31,300 1,800
33,500 30,400 3,100
Unemployment rate 5.9% 5.2% 5.1% 5.5% 9.4%
Ohio Works First (OWF)3,6
Ohio Works First (OWF) is the financial-assistance portion of the state’s Temporary Assistance to Needy Families (TANF) program, which provides cash benefits to needy families for up to 36 months.
Cash Assistance (CA) CY 2008 CY 2009Washington County
Ohio Washington County
Ohio
Average monthly adult recipients 5 44,998 7 59,600Average monthly child recipients 202 132,601 201 154,499Total number of recipients 349 368,211 343 429,404Percent of population 0.6% 3.0% 0.6% 3.7%Net expenditures $458,780 $328,588,993 $471,258 $410,769,562
13
Average annual CA payment per recipient
$1,315 $892 $1,374 $957
6 out of every 1,000 residents in Washington County received cash benefits through OWF during CY 2009.
Trend in OWF/TANF in Washington County Jan. 2000 Jan. 2005 Jan. 2008 Jan. 2010Total number of OWF/TANF recipients 252 251 193 204Number of children receiving “Child Only” TANF
171 213 188 192
- The total number of Washington County recipients of OWF/TANF decreased by 19% between January 2000 and January 2010.
- The number of children living with relative caregivers and receiving “Child Only” TANF increased by 12% between January 2000 and January 2010.
Food Assistance (FA)3,6
- The Food Assistance program is designed to raise nutritional levels, to expand buying power, and to safeguard the health and well-being of individuals and families whose gross monthly income is within 130 percent of the federal poverty guideline.
- Half of all recipients are children.
Food Assistance (FA) CY 2008 CY 2009Washington County
Ohio Washington County
Ohio
Average monthly adult residents
3,624 672,065 4,318 843,420
Average monthly child residents
2,634 587,273 3,116 691,148
Total number of recipients 9,362 1,825,865 10,726 2,142,502Percent of population 15.3% 15.8% 17.6% 18.6%Net expenditures $7,172,969 $1,603,760,076 $10,734,23
9$2,367,566,809
Average annual FA payment per recipient
$766 $878 $1,001 $1,105
Ohio Direction Card* Jan. 2000 Jan. 2005 Jan. 2008 Jan. 2010Total number of Ohio Direction Card recipients in Washington County
3,555 5,590 5,513 7,959
*Formerly food stamps- The number of county residents who received Ohio Direction Cards increased by 224% between January 2000 and January 2010.
14

- The average card value in Washington County was $101 per month in 2008 and $120 in 2009.
15

Insurance
Insurance Status2,5,7
Employer-Based Insurance in Washington County 2000Percent of adults with employer-based insurance 59.0%Percent of children with employer-based insurance 59.2%
Uninsured Residents 2004 2007Washington Co. Ohio Washington Co.
Percent children uninsured (<17 years)
0.4% 5.4% 2.7%
Percent adults uninsured (18+ years)
17.1% 12.5% 18.2%
Medicaid Enrollment3,4,6,7
Medicaid is the state and federally funded program that pays for health care services for eligible low-income people of all ages, including children, pregnant women, families, older adults, and Ohioans with disabilities. Medicaid services are delivered via contracted health care providers, ensuring that Medicaid consumers get access to needed services, such as physician visits, hospital inpatient care, prescription drugs, and home health services.
Medicaid Enrollment and Expenditures SFY 2009*Washington Co. Ohio
Residents enrolled in Medicaid 13,057 2,407,572Average members per year** 9.991 1,883,288Percent of members enrolled*** 21.2% 21.0%Residents enrolled in Medicaid (Ages 0-17) 6,059 1,218,390Average members per years (Ages 0-17) 4,796 982,283Percent of members enrolled (Ages 0-17) 46.8% 44.6%Annual Medicaid expenditures+ $64,812,420 $13,162,469,167Total cost of coverage per member per year $6,487 $6,989
* SFY stands for State Fiscal Year (July 1st to June 30th)**Average members per year = Member months/12**8Percent of members enrolled = Members/population enrolled+Expenditures reflect payments made directly to providers as well as capitation payments to HMOs.
Medicaid Eligibility 2002-2005Washington Co. Ohio
Number of persons eligible for Medicaid 11,665 1,786,440
16

Percent of persons eligible for Medicaid 18.4% 15.7%
17

Medicaid and Children in Washington County 2007Percent of all births paid by Medicaid 42.9%Percent of mothers receiving Medicaid who had two or more risk factors for poor birth outcomes
48.0%
Percent of children enrolled in Medicaid 36.6%
Children Insured by Medicaid in Washington County SFY 2005 SFY 2007 SFY 2009# of Children Insured by Medicaid 6,187 6,029 6,056
- The number of children insured by Medicaid in Washington County decreased by 2% between 2005 and 2009.
18

Vital Statistics
Vital Statistics3,5
Births and Deaths, 2008 Washington County OhioNumber Rate* Number Rate
All births 658 10.8 148,592 12.9Teen births <15 years of age 15-17 years of age 18-19 years of age
1 17 52
0.6 14.4 59.3
201 4,717 11,467
0.5 19.7 73.7
Deaths 645 1,047.5 --------------- ---------------*Birth rates per 1,000 population and death rate per 100,000 population.
Marriages/Divorces, 2007 Washington County OhioNumber Rate** Number Rate
Marriages 459 7.4 70,704 6.2Divorces 251 4.1 39,305 3.4
**Marriage and divorces rates per 1,000 population.
Mortality2,4,8,9
One main component:
- Premature death (National Center for Health Statistics, 2004-2006)
Rank of Washington County in Mortality among 88 counties in Ohio (2010): 47
Infant Mortality:
2006 2007 20080
2
4
6
8
10
12
9.310.1
10.6
7.8 7.7 7.7
Infant Mortality***
Washington CountyOhio
***Infant mortality reported as a rate per 1,000 live births. Infant mortality = (Infant deaths/Live births) x 1,000.
19

Adult Mortality:
Mortality Rates per 100,000 Age-adjusted Population 2002-2005
Washington County OhioCoronary heart disease 211.3 210.2Cancer 196.4 212.7Stroke 50.7 62.4Unintentional injury 46.8 30.7Suicide 7.7 10.1
Leading Causes of Death:
Leading causes of death may differ in a population depending on the age, sex, race, and socioeconomic status of individuals within a
population.
Causes of Death* Washington Co. Ohio U.S.Number Rate Number Rate Number Rank
All deaths 660 849.5 107,217 855.0 2,447,910 798.8Cancer 164 210.0 24,825 198.8 559,300 183.8Diseases of the heart 155 194.7 28,617 225.3 649,399 210.3Chronic lower respiratory disease
41 51.3 6,170 49.2 130,957 43.2
Diabetes mellitus 35 44.6 3,717 29.7 74,817 24.5Stroke 31 38.9 6,183 48.6 143,497 46.6Unintentional injury 26 38.9 4,473 37.6 114,876 38.1Influenza and pneumonia 15 18.9 2,191 17.2 62,804 20.3Nephritis, nephritic syndrome, and nephrosis
14 17.9 1,834 14.5 43,679 14.3
Alzheimer’s disease 10 12.9 3,321 25.6 71,696 22.9Septicemia 10 12.6 1,388 11.2 34,142 11.2
*Average annual number of deaths and average annual age-adjusted mortality rates (per 100,000 population) among Washington County Residents with comparison to Ohio, 2004-2006, and to the United States, 2005.
Morbidity8
Four main components:
1. Poor or fair health (Behavioral Risk Factor Surveillance System, 2002-2008)2. Poor physical health days (Behavioral Risk Factor Surveillance System, 2002-
2008)3. Poor mental health days (Behavioral Risk Factor Surveillance System, 2002-
2008)4. Low birth weight (National Center for Health Statistics, 2002-2006)
20

Rank of Washington County in Morbidity among 88 counties in Ohio (2010): 44
21

Health Statistics
Cancer Rates2,7
Cancer Screening Behaviors, 2004-2007* Washington County Ohio
Male Female All Male Female AllPAP test in past 3 years (Age 18+, Intact Cervix)
N/A 79.9% N/A N/A 88.8% N/A
Mammography in past 2 years (Age 40+)
N/A 71.8% N/A N/A 79.1% N/A
Colonoscopy/Sigmoidoscopy in past 5 years (Age 50+)
34.7% 47.4% 41.6% 59.2% 52.6% 55.7%
Prostate-specific antigen (PSA) test in past year (Age 50+)
57.4% N/A N/A 57.5% N/A N/A
DRE in past year (Age 50+) 49.8% N/A N/A 57.5% N/A N/A*Estimated prevalence (percent) of selected cancer screening behaviors among adult residents in Washington County and Ohio
Cancer Site/Type, 2001-2005** Incidence Mortality
Washington County
Ohio WashingtonCounty
Ohio
Cases Rate Rate Cases Rate RateAll Sites 381 509.3 465.1 157 207.4 203.3Breast (Female) 44 112.1 121.9 13 33.7 27.5Cervix 3 8.3 7.9 1 2.9 2.4Colon and Rectum 43 57.3 52.9 16 20.9 20.6Lung and Bronchus 63 81.9 75.0 47 60.5 60.3Melanoma of the Skin 16 22.9 17.0 3 4.0 2.6Prostate 58 168.3 145.7 9 29.9 27.8
**Average annual number and age-adjusted rates (per 100,000 population) of invasive cancer cases and cancer deaths among Washington County and
Ohio residents
22

Cancer Incidence, 2001-2005* Washington County
Male Female TotalCase Rate Cases Rate Cases Rate
All Sites 203 606.0 178 442.4 381 509.3Breast 1 2.9 44 112.1 45 N/ACervix N/A N/A 3 8.3 3 N/AColon and Rectum 24 73.1 19 44.5 43 57.3Lung and Bronchus 36 105.9 27 65.0 63 81.9Melanoma of the Skin 9 25.6 7 21.4 16 22.9Prostate 58 168.3 N/A N/A 58 N/A
*Average annual number and age-adjusted rates (per 100,000 population)
Cancer Rate Incidence** 2000 2001-2005Washington Co. Ohio Washington Co. Ohio
Breast 117.7 117.7 112.1 121.9Cervical ------------------- 7.5 8.3 7.9Lung and Bronchus 91.9 71.0 81.9 75.0
**Rates per 100,000 population
Cancer Mortality, 2001-2005* Washington County
Male Female TotalCase Rate Cases Rate Cases Rate
All Sites 81 251.5 77 180.8 157 207.4Breast <1 -------- 13 33.7 14 N/ACervix N/A N/A 1 2.9 1 N/AColon and Rectum 9 27.1 7 16.4 16 20.9Lung and Bronchus 26 76.7 21 48.9 47 60.5Melanoma of the Skin 2 4.5 1 2.8 3 4.0Prostate 9 29.9 N/A N/A 9 N/A
STD Rates/HIV/AIDS4,7
Communicable Diseases** 2002-2005Washington Co. Ohio
Persons living with HIV/AIDS 53.8 121.5Chlamydia 114.9 315.1Gonorrhea 13.7 184.2Syphilis 0.0 2.8
23

Heart Disease/Stroke2
- In both the United States and Ohio, heart disease and stroke are the first- and third- leading causes of death respectively (CDC, 2007).
Cholesterol and Blood Pressure Awareness:- High cholesterol and high blood pressure are modifiable risk factors for
heart disease and stroke.
Cholesterol and Blood Pressure Awareness*
Washington County/Southeast Region OhioMale Female All Male Femal
eAll
Cholesterol checked within last 5 years 46.2% 37.6% 41.7% 71.0% 75.3% 73.2%Ever told cholesterol was high 69.6% 73.5% 71.6% 39.9% 36.2% 37.9%Ever told blood pressure was high 37.6% 31.6% 34.6% 27.9% 27.4% 27.6%
*Estimated prevalence (percentage) among adult Washington County residents with comparison to Ohio, 2004, 2006, 2007.
Prevalence of Heart Disease and Stroke:
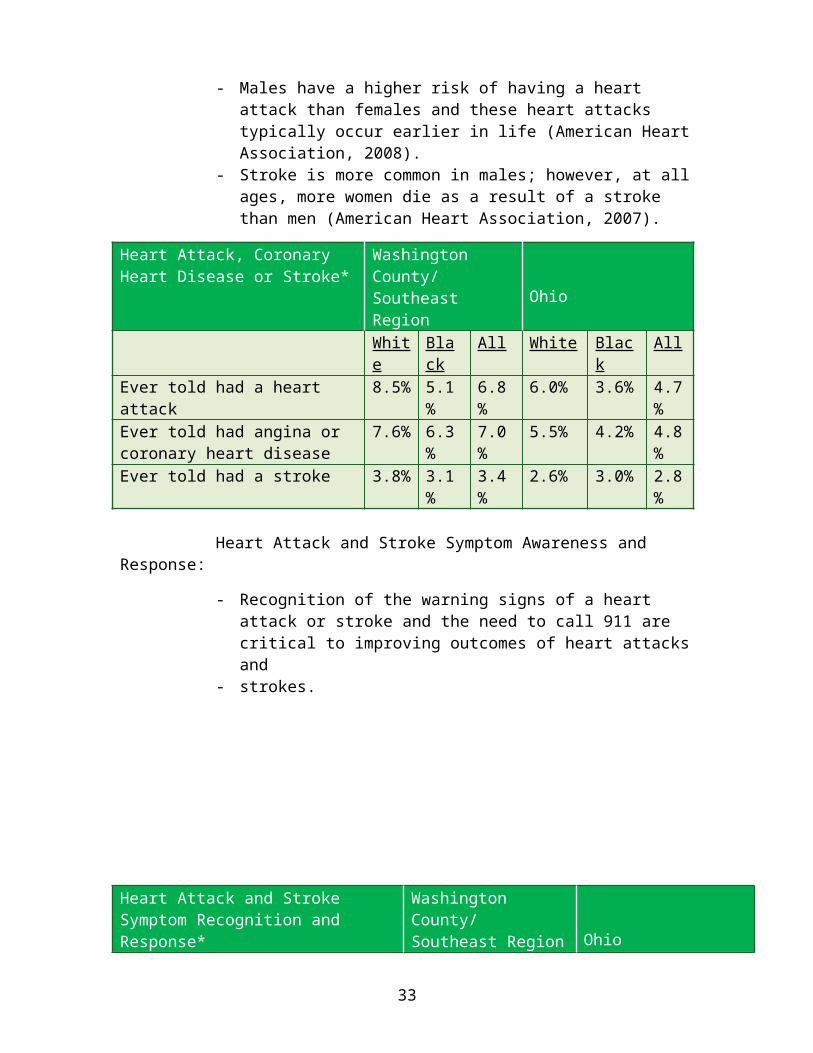
- Males have a higher risk of having a heart attack than females and these heart attacks typically occur earlier in life (American Heart Association, 2008).
- Stroke is more common in males; however, at all ages, more women die as a result of a stroke than men (American Heart Association, 2007).
Heart Attack, Coronary Heart Disease or Stroke*
Washington County/ Southeast Region OhioWhite Black All White Black All
Ever told had a heart attack 8.5% 5.1% 6.8% 6.0% 3.6% 4.7%Ever told had angina or coronary heart disease
7.6% 6.3% 7.0% 5.5% 4.2% 4.8%
Ever told had a stroke 3.8% 3.1% 3.4% 2.6% 3.0% 2.8%
Heart Attack and Stroke Symptom Awareness and Response:
- Recognition of the warning signs of a heart attack or stroke and the need to call 911 are critical to improving outcomes of heart attacks and
- strokes.
24

Heart Attack and Stroke Symptom Recognition and Response*
Washington County/Southeast Region OhioMale Female All Male Femal
eAll
Recognize all 5 symptoms of heart attacks 30.2%
42.2% 36.4%
31.0% 42.6% 37.0%
Recognized all 5 symptoms of strokes 46.7%
45.3% 46.0%
41.1% 48.2% 44.6%
Know to call 911 in response to someone having a heart attack or stroke
83.9%
85.4% 84.7%
88.4% 91.2% 89.9%
*Estimated prevalence (percentage) among adult Washington County residents with comparison to Ohio, 2004, 2006, 2007.
- Five heart attack warning signs:1. Pain or discomfort in areas of the upper body such as the shoulder,
back, neck, jaw, stomach, or in one or both arms.2. Chest discomfort that may or may not be accompanied by
lightheadedness or shortness of breath.3. Cold sweats4. Nausea5. Pressure or pain in the center of the chest that lasts more than a few
minutes
- Five stroke warning signs:1. Sudden weakness or numbness in the face, arm, leg or on one side of
the body.2. Sudden trouble seeing in one or both eyes, dimness or loss of vision,
particularly in one eye.3. Sudden confusion, trouble speaking or understanding, and loss of
speech.4. Sudden, sever headache with no apparent cause.5. Sudden dizziness, trouble walking, loss of balance or coordination or
sudden falls, especially along with any of the previous symptoms.
Heart Disease and Stroke Mortality:
Heart Disease Mortality** Washington County Ohio# of Deaths Rates # of Deaths Rates
Age-adjusted
25

Males Females All
7580155
236.3163.4194.7
14,02914,58828,617
282.4182.6225.3
Age-specific (years) <24 25-49 50-64 65+
0421130
0.020.9172.81,307.9
721,3993,82923,317
1.934.9188.81,526.4
**Average annual number of death and age-adjusted and age-specific mortality rates (per 100,000 population), 2004-2006.
Stroke Mortality* Washington County Ohio# of Deaths Rates # of Deaths Rates
Age-adjusted Males Females All
141831
42.835.138.9
2,3503,8336,183
48.847.848.6
Age-specific (years) <24 25-49 50-64 65+
01327
0.04.825.1275.0
212085525,403
0.55.227.2353.7
*Average annual number of death and age-adjusted and age-specific mortality rates (per 100,000 population), 2004-2006.
Diabetes2
- Diabetes was the sixth-leading cause of death in Ohio and in the United States in 2004-2006.
- Two types of diabetes:1. Type 1 diabetes typically strikes children and young adults. It
accounts for 5 to 10 percent of all diagnosed cases of diabetes. Risk factors for type 1 diabetes include autoimmune, environmental, and genetic factors.
2. Type 2 diabetes usually strikes adults and accounts to 90 to 95 percent of all diagnosed diabetes cases. Risk factors for type 2 diabetes include older age, obesity, family history of diabetes, impaired glucose metabolism or pre-diabetes, history of gestational diabetes, and physical inactivity.
Diabetes Prevalence:
26

Male Female All6.50%
7.00%
7.50%
8.00%
8.50%
9.00%
9.50%
Estimated Prevalence (Percent) of Diabetes by Gender, 2004-2007
Washington CountyOhio
18-34 35-44 45-54 55-64 65+0.00%
2.00%
4.00%
6.00%
8.00%
10.00%
12.00%
14.00%
16.00%
18.00%
20.00%
Estimated Prevalence (Percent) of Diabetes by Age, 2004-2007
Washington CountyOhio
Diabetes Management Practices:
Diabetes Management Behaviors, 2004-2007 Washington Co. Ohio U.S.Annual dilated-eye exam 51.5% 70.3% 69.4%Daily self-monitoring of blood glucose 63.6% 63.0% 63.0%Annual foot exam 51.3% 67.4% 68.7%Annual doctor visit 88.5% 89.4% 88.9%Daily self-exam of feet 67.4% 66.0% 67.9%2+ A1c tests past year 63.9% 72.9% 68.7%Attended diabetes self-management class 47.6% 55.0% 53.1%Annual influenza vaccine 44.7% 57.5% 49.8%Ever had pneumonia vaccine 40.6% 52.0% 49.0%
Diabetes Mortality:
Diabetes Mortality, 2004-2006* Washington County Ohio# of Deaths Rates # of Deaths Rates
27

Age-adjusted Males Females All
142035
43.945.244.6
1,8121,9053,717
35.325.629.7
Age-specific (years) <24 25-49 50-64 65+
<12726
1.78.055.7261.6
92226872,799
0.25.533.9183.2
*Average annual number of deaths and average annual age-adjusted age-specific diabetes mortality rates (per 100,000 population).
Arthritis2
- Arthritis is the nation’s most common cause of disability (CDC, 2008).- Arthritis is not just one disease, but more than 100 different diseases
and conditions. The most frequently occurring is osteoarthritis. Other common forms include rheumatoid arthritis, lupus, fibromyalgia, and gout (CDC, 2008).
Male Female All0.00%
5.00%
10.00%
15.00%
20.00%
25.00%
30.00%
35.00%
40.00%
Estimated Prevalence (Percent) of Arthritis among Adult Res-idents, 2004-2007
Washington CountyOhio
28

18-34 35-44 45-54 55-64 65+0.00%
10.00%
20.00%
30.00%
40.00%
50.00%
60.00%
70.00%
Estimated Prevalence (Percent) of Arthritis among Ohio Res-idents by Age, 2004-2007
MaleFemaleAll
Unintentional and Intentional Injuries2
- For Ohioans of all ages, the leading causes of injury-related death include unintentional motor vehicle traffic crashes, suicide, unintentional poisonings, unintentional falls, and homicides.
All Fatal Unintentional Injuries:- Unintentional injury is the leading cause of death for Ohioans aged 1-34,
and the fifth-leading cause of death for all age groups in Ohio.
Unintentional Fatal Injury: All* Washington County Ohio# of Deaths Rates # of Deaths Rates
Age-adjusted Males Females All
161026
52.127.538.9
2,7751,6984,473
51.325.237.6
Age-specific (years) <24 25-49 50-64 65+
5957
25.643.439.070.4
7141,5247111,524
18.338.035.099.8
*Rates per 100,000 population, 2004-2006.
Unintentional Fatal Falls:- Fatal falls among older adults are expected to rise as Ohio’s population continues to age.
Unintentional Injury Mortality: Falls* Washington County Ohio# of Deaths Rates # of Deaths Rates
Age-adjusted
29

Males Females All
2<12
6.50.83.1
421400821
8.65.06.5
Age-specific (years) <24 25-49 50-64 65+
0<111
0.01.65.613.4
115199661
0.31.34.943.3
Unintentional Fatal Poisonings:-Rates of unintentional fatal poisonings have been increasing at alarming
rates in Ohio due largely to unintentional drug overdoses and medication errors.
Unintentional Injury Mortality: Poisonings* Washington County Ohio
# of Deaths Rates # of Deaths RatesAge-adjusted Males Females All
415
13.83.38.4
7333791,112
13.06.59.7
Age-specific (years) <24 25-49 50-64 65+
13<10
6.816.12.80.0
11573522141
3.018.310.92.7
*Rates per 100,000 population, 2004-2006.
Unintentional Motor Vehicle Traffic Crashes:- Motor vehicle traffic crashes among older adults will continue to be a
growing concern as Ohio’s population ages.
Unintentional Injury Mortality: Motor Vehicle Traffic Crashes* Washington County Ohio
# of Deaths Rates # of Deaths RatesAge-adjusted Males 6 18.2 904 16.2
30

Females All
611
17.617.7
4161,321
6.811.4
Age-specific (years) <24 25-49 50-64 65+
3531
13.622.525.110.1
370506217228
9.512.610.714.9
Homicide:- Homicide is the leading cause of death for young, black Ohioans.
Intentional Fatal Injury: Homicide* Washington County Ohio
# of Deaths Rates # of Deaths RatesAge-adjusted Males Females All
011
0.02.01.0
------------------------------150
5.58.42.6
Age-specific (years) <24 25-49 50-64 65+
0<1<10
0.01.62.80.0
2113156331
5.47.83.12.0
Suicide:- Although females attempt suicide at higher rates, males take their lives
four times more often than females (CDC, 2007) and white adults males are at the greatest risk of committing suicide in Ohio.
Intentional Fatal Injury: Suicide* Washington County Ohio# of Deaths Rates # of Deaths Rates
Age-adjusted Males Females All
516
151.62.48.9
1,0532661,319
18.84.411.3
Age-specific (years) <24 25-49 50-64 65+
<141<1
1.717.711.13.4
192616312200
4.915.315.413.1
*Rates per 100,000 population, 2004-2006.
31

Child-Related Issues
Child Health2,4,7
Vital Statistics, 2008 Washington County OhioTotal Births 658 148,592% Low Birth Weight 7.0% 8.6%% Very Low Birth Weight 2.3%(15) 1.6%% Preterm 14.0% 12.3%% Very Preterm 3.2% 2.1%% Late Prenatal Care 14.5% 27.3%% Unmarried 36.9% 43.2%Teen Birth Rate (15-17) 14.4(17) 19.7
Vital Statistics Comparison 2002-2005 2004-2006 2008
Washington County
Ohio Washington County
Ohio Washington County
Ohio
32
% Low Birth Weight
7.8% 8.0% 8.4% 8.6% 7.0% 8.6%
% Maternal Smoking
19.3% 18.9% 23% 18.1% 28.3% 19.2%
% Infant Mortality
0.0057% 0.0078% 0.0064% ------- 0.011% -------
Lead Testing, 2008 Washington County Ohio# Children Lead Screened 629 159,239% Elevated Blood Lead Level 0.6% 1.6%
Overweight, 3rd Grade 2004-2006Washington Co. Ohio
% Children Overweight 19.6% 18.9%
Overweight, 2-5 Years 2008Washington Co. Ohio
% Children Overweight 26.6% 28.0%
Child Support3,6
The Washington County Child Support Enforcement Agency establishes paternities and obtains, enforces, and collects child
support funds for children.
Child Support Cases FFY 2008 FFY 2009Wash. Co. Ohio Wash. Co. Ohio
Number of Cases 4,049 978,385 4,212 985,863Paternity Establishment Rate* 105.0% 91.6% 106.4% 93.6%Cases with Support Orders 3,516 739,995 3,637 754,903% of Cases with Support Orders 86.8% 75.6% 86.4% 76.6%Collection Rate on Current Support Due 74.1% 68.8% 72.8% 67.4%Rate of Cases Paying on Arrears 74.3% 68.2% 73.1% 66.5%
*Paternity Establishment Rate is the total number of children born out-of-wedlock who had active child support cases, for whom paternity was
established or acknowledged as of the end of the reporting period, divided by the total number of children born out-of-wedlock who had
33

active child support cases, as reported 12 months prior to the reporting period. Rate can exceed 100%.
Child Support Collections in Washington County FFY 2005 FFY 2007 FFY 2009Total amount of child support collections $9.4 mil $9.3 mil $9.7 mil
- Child support collections in Washington County increased by 3% between FFY 2005 and FFY 2007.
- The number of paternities established for non-marital births in Washington County increased by 28% between FFY 2005 and FFY 2007.
Child Safety and Care Placement3,6
Of Ohio’s 88 children services agencies, Washington County’s is one of 25 agencies accreditd by the Council on Accrediation (2011).
The Washington County Public Children Services Agency administers local adoption assistance, foster care services, and child welfare
intervention programs.
Custody Issues FFY 2008 FFY 2009Wash. Co. Ohio Wash. Co. Ohio
Children Entering Custody 7 8,279 19 7,743Children Reentering Custody 1 1,261 6 952# of Children Reunified 14 4,678 17 5,847# of Children Reunified within 12 mo. 13 3,206 16 4,008% of Child Reunifications <12 mo. 92.9% 68.5% 94.1% 68.5%
Tracking Children in Custody in Washington County 2005 2007 2009Total number of children reunified with parents or legal guardian
22 15 17
Total awards of legal custody to relatives 9 7 --------Total number of adoptions finalized 0 3 3Total number of children waiting to be adopted 11 2 2Total number of youth who aged out of care 2 1 4
34

Total number of children placed out of county 11 10 6Average number of days a child stays in placement 160 244 291
2001 2003 2005 20070
10
20
30
40
50
60
70
5550
61
51
Total Number of Children in Custody During the Year
Washington County
Child and Custody Profiles in Washington County
TemporaryCustody
PermanentCustody
PlannedPermanentLivingArrangement
Total
Children in custody 1/1/10 31 5 6 42Age 0-5 years 6-11 years 12-18 years
29%26%45%
--------80%20%
----------------100%
21%29%50%
Race White Af/Am Other
71%--------29%
100%----------------
83%--------17%
76%--------24%
Total years in custody 0-2 years 2-4 years 4+ years
94%6%--------
40%40%20%
67%33%--------
83%14%3%
35

Court Rationale for Placement Neglect Dependency Physical abuse Sexual abuse Delinquency/unruly Multiple safety issues
6%19%----------------10%65%
20%20%------------------------60%
--------17%17%----------------66%
7%20%2%--------7%64%
Placement Type Licensed foster home Approved relative/kinship
home Group/residential care Adoptive placement Independent living
placement/other
94%--------
6%----------------
40%--------
20%40%--------
66%--------
17%--------17%
83%--------
10%5%2%
Foster Care/Custody 2008 (Snapshot 9/30/2008) 2009 (Snapshot 9/30/2009)Washington County
Ohio Washington County
Ohio
Children in Licensed/Certified Foster Homes
31 9,057 39 8,161
Children in Permanent Custody
9 5,200 10 4,907
Child Deaths FFY 2008 FFY 2009Wash. Co. Ohio Wash. Co. Ohio
# of Child Deaths 0 74 0 91# of Child Deaths in Substitute Care 0 22 0 14
Public Expenditures on Child Services:
36

Public Expenditures on Child Services in Washington County, 2009
FederalStateLocal
Federal $1,233,209 43%State $419,542 15%Local* $1,192,548 42%----------------------------------------------------Total 2,845,299 100%
*Of Ohio’s 88 counties, Washington County was not among the 45 that maintained a children services levy in 2009.
Adoption3
Ohio counties provide comprehensive services to birth parents, adoptive parents, and adoptive children, particularly those involved in foster
care.
Adoption FFY 2008 FFY 2009Wash. Co. Ohio Wash. Co. Ohio
# of Children Adopted 1 1,390 4 1,452# of Adoptions Completed within 24 mo.
1 426 2 497
Kinship Permanency Incentive (KIP)3
KIP provides time-limited incentive payments to relatives caring for
minors who would be at risk of harm if they remained in their own homes.
KIP (Unduplicated Counts) CY 2008 CY 2009Wash. Co. Ohio Wash. Co. Ohio
Children Approved for Initial KPI Funding 5 3,074 7 2,586Children Receiving KPI Payment Redeterminations -------- 3,705 4 5,366
37

Total # of Children Receiving KPI Payments 5 6,779 11 7,952
Child Care3,6
Through state and federal funding, families whose income is at or below 150% of the federal poverty guideline can receive payment for all
or part of their monthly childcare expenses while parents work or attend job training/educational activities. A family may remain eligible until income increase to 200% of the federal poverty guideline.
Children Served and Providers of Child Care CY 2008 CY 2009
Wash. Co. Ohio Wash. Co. Ohio# of Children Using Publicly Funded Child Care
785 198,244 693 192,697
Public Funds Used for Child Care Expenditures
$986,605 $558,762,587 $904,852 $569,657,458
Annual Average Expenditure per Child
$1,257 $2,819 $1,306 $2,956
# of Licensed Child Care Centers*
31 3,683 32 4,483
*Includes licensed full-time, part-time, Head Start, school-based and combination centers with 7 or more children.
Subsidized Child Care in Washington County Jan. 2000 Jan. 2005 Jan. 2008 Jan. 2010# of children whose families received subsidized child care
292 309 376 278
- The number of children whose families received subsidized child care decreased by 5% between January 2000 and January 2010.
Step Up to Quality3
The Step Up to Quality Program (SUTQ) is Ohio’s voluntary quality rating system for childcare programs. SUTQ is designed to
increase the number of high-quality programs, recognize and support programs that achieve higher quality standards, and provide parents with an easy-to-use tool to assist them in making more informed choices on behalf of their children. Programs with the highest ratings qualify for monetary awards.
Number of Licensed Child Care Centers in Washington County Earning Quality Ratings as of June 30, 2010: 9
Child Abuse and Neglect3,6,9
38

*The Ohio Department of Job and Family Services (ODJFS) defines the following statistics as the rate of infants/children
with substantiated abuse or neglect.
The statistics are expressed as the rate per 1,000 infants/children.
Infant Child Abuse and Neglect: Infants are children ages zero to one year old.
2007 2008 20090
5
10
15
20
25
30
35
40
45
50
24.5
38.28 36.75
18.7216.1
19.96
Infant Child Abuse and Neglect
Washington CountyOhio
Toddler Child Abuse and Neglect: Toddlers are children ages one to three years old.
2007 2008 20090
5
10
15
20
25
30
35
40
45
50
25.9722.54
33.81
9.33 8.1310.57
Toddler Child Abuse and Neglect
Washington CountyOhio
Preschool Child Abuse and Neglect: Preschoolers are children ages four to five years old.
39

2007 2008 20090
5
10
15
20
25
30
35
40
45
50
21.818.9 20.35
8.3 6.988.51
Preschool Child Abuse and Neglect
Washington CountyOhio
School-Age Child Abuse and Neglect: School-aged children are children ages 6 to 12 years old.
2007 2008 20090
5
10
15
20
25
30
35
40
45
50
13.14
20.29
13.14
6.52 5.55 6.3
School-Age Child Abuse and Neglect
Washington CountyOhio
Adolescent Child Abuse and Neglect: Adolescents are children ages 13 to 18 years old.
40

2007 2008 20090
5
10
15
20
25
30
35
40
45
50
8.4611.12 9.67
4.56 3.86 4.4
Adolescent Child Abuse and Neglect
Washington CountyOhio
Local Trends on Abuse and Neglect:
2001
2003
2005
2007
2009
0 100 200 300 400 500 600 700
Unduplicated Number of New Allegations of Child Abuse (All Ages)
Washington County
- In 2007 and 2009, new allegations of child abuse and neglect totaled 650 and 638, respectively. The percentage of total reports the new allegations represent fall within the following five categories:
Types of Child Abuse and Neglect 2007 2009Number
Percent Number Percent
Physical abuse 156 24% 145 23%Neglect 296 46% 204 32%Sexual abuse 80 12% 66 10%Emotional maltreatment 7 1% 0 0%Family in need of services, dependency & others 111 17% 223 35%Total 650 100% 638 100%
41

Local and State Comparison of Child Abuse:
Maltreatment/Child Abuse FFY 2009Washington Co. Ohio
Reports/Investigations – Allegations of Child Abuse and Neglect Cases
522 79,906
Number of Maltreatment Cases 112 15,358Percentage of Children with No Recurrence of Maltreatment
88.4% 92.7%
Prenatal Care7,9
The Ohio Department of Health uses the Kotelchuck Index in the definition of adequate prenatal care.
For prenatal care to be adequate according to the Kotelchuck Index, care must begin in the first trimester and the total number of visits must equal or exceed that which would be expected for the infants’ gestational age at birth.
*Adequate prenatal care is expressed as a percent.
2006 2007 20080
10
20
30
40
50
60
70
80
90
10089.5 88.6 86.2
71.5 69.5 68.5
Adequate Prenatal Care
Washington CountyOhio
Late Prenatal Care, 2008 Washington Co. Ohio% Late Prenatal Care 14.5% 27.3%
Aging Population
42

Demographics10
Population Projections by Age Group:
2000 2005 2010 2015 20200
1,000
2,000
3,000
4,000
5,000
6,000
7,000
8,000
9,000
10,000
Projections of Population Age 60+ by Year and Age Group,Washington County*
60-69 Years70-79 Years80-89 Years90+ Years
*Year 2000 data are actual population counts
Population Change among Residents Age 60+ Washington County
2000 Population Projected 2020 Population
Percent Population Increase
Total 60+ population 12,544 18,542 47.8%60-69 years 5,699 9,275 62.7%70-79 years 4,441 5,883 32.5%80-89 years 2,031 2,719 33.9%90+ years 373 665 78.3%
Rank of Washington County in total 60+ population among 88 counties in Ohio (2000): 36
Rank of Washington County in proportion of 60+ population to total county population among 88 counties in Ohio (2000): 11
Marital Status:
43

Married Divorced/ Separated/ Widowed
Never Married0.00%
10.00%
20.00%
30.00%
40.00%
50.00%
60.00%
70.00%80.00%
90.00%
100.00%
Percent ofMarital Staus Among Total Population Age 60+, by Gender, Washington County and Southeast Ohio**, 2000
MenWomen
**The Southeast region of Ohio includes Monroe, Morgan, and Noble counties.
Since older single adults are more likely than married couples to need outside help or institutional care, the population in Washington
County and Southeast Ohio that is potentially in need of such assistance is largely female.
Education:
6th G
rade o
r Les
s
7th-1
2th (N
o Dip
lom
a)
High S
chool G
raduate
Some C
ollege
Bachelo
r's D
egre
e
Graduate
Deg
ree
0.00%5.00%
10.00%15.00%20.00%25.00%30.00%35.00%40.00%45.00%50.00%
Highest Level of Educational Attainment Among Total Popu-lation Age 60+, 2000
Washington County/Southeast Ohio*Ohio
*The Southeast region of Ohio includes Monroe, Morgan, and Noble counties.
The majority of Washington County residents age 60+ (76.1%), have completed 12 or fewer years of school. This suggests that a
44

significant proportion of the older population may be economically vulnerable.
Housing/Residence:
60-64 Years
65-69 Years
70-74 Years
75-79 Years
80-84 Years
85-89 Years
90+ Years
0.00%
10.00%
20.00%
30.00%
40.00%
50.00%
60.00%
Percent of Population Age 60+ Living Alone, by Gender and Age Group, Washington County and Southeast Ohio*, 2000
Men Living AloneWomen Living Alone
*The Southeast region of Ohio includes Monroe, Morgan, and Noble counties.
Health Issues10
Projections of Disability Among 60+ Population, 2000**-2020 Washington County
YearTotalPopulation
NoDisability
ModerateDisability
SevereDisability
2000 12,544 9,439 2,066 1,0392005 13,350 10,026 2,199 1,1252010 14,784 11,140 2,409 1,2352015 16,533 12,514 2,670 1,3492020 18,542 14,077 2,975 1,490
**Year 2000 data are actual disability counts.
In the Scripps Gerontology Center’s Profile and Projections of the 60+ Population, disability is defined as a measure of impairment in
Activities of Daily living (ADLs) and Instrumental Activities of Daily Living (IADLs).
45

- Moderate disability: At least one of the following ADLs: eating, transferring into or out
of bed or chair, getting to the toilet, dressing, bathing, or remaining continent, or
At least one of the following IADLs; walking, shopping, meal preparation, housekeeping, or using transportation or the telephone
- Severe disability: At least two of the following ADLs: eating, bathing, transferring
into or out of bed or chair, dressing, getting to the toilet, remaining continent, or having cognitive impairment.
2000 2005 2010 2015 20200
50
100
150
200
250
300
350
400
Projections of the Number of Women Age 60+ with Severe Disability, by Age Group, Washington County, 2000*-2020
60-69 Years70-79 Years80-89 Years90+ Years
*Year 2000 data are actual disability counts.
2000 2005 2010 2015 20200
20
40
60
80
100
120
140
160
180
Projections of the Number of Men Age 60+ with Severe Disability, by Age Group, Washington County, 2000*-2020
60-69 Years70-79 Years80-89 Years90+ Years
Disability rates by age and sex are projected to remain the same between 2000 and 2020. Any fluctuations in the number of persons with
46

disabilities across time are attributed to projected changes in the number of people in each age-gender group.
Sensory Physical Mental Self Care0.00%
5.00%
10.00%
15.00%
20.00%
25.00%
30.00%
35.00%
Percent of Total Population Age 60+ with Sensory, Physical, Mental, and Self-Care Disabilities, 2000
Washington County/Southeast Ohio*Ohio
*The Southeast region of Ohio includes Monroe, Morgan, and Noble counties.
Characteristics of disabilities:
- Sensory disabilities Blindness Deafness Severe or long-lasting vision or hearing impairment
- Physical disabilities Long-lasting condition that substantially limits one or more basic
physical activities such as walking, climbing stairs, reaching, lifting, or carrying
- Mental disabilities Difficulty learning, remembering, or concentrating because of a
physical, mental, or emotional condition that lasts 6 months or more
- Self-care disabilities Difficulty dressing, bathing, or getting around the house as a result
of a condition that lasts 6 months or more.
Note: These categories of disabilities are not mutually exclusive. Respondents could have multiple impairments, which may span
more than one disability category.
In 2000, 38.5% of the 60+ population in Washington County and Southeast Ohio (Monroe, Morgan, and Noble counties) had at least
one disability.
Adult Protective Services3
47

County Departments of Job and Family Services provide Adult Protective Services to the elderly who are in danger of harm, unable to protect themselves, and/or have no one to assist them.
Adult Protective Services (APS) CY 2008 CY 2009Washington Co. Ohio Washington Co. Ohio
Adult Cases 144 17,351 175 16,208Cases Deemed Emergencies 38 1,215 49 802Cases in Need of Protective Services 45 7,469 61 6,967Cases Where Protective Services Not Available
0 68 0 84
Allocation of APS Funds SFY 2008 SFY 2009Washington Co. Ohio Washington Co. Ohio
Expenditures* $33,044 $21,095,720 $38,676 $21,435,882*APS funds are allocated at the beginning of the SFY (State Fiscal Year), July 1st to June 30th.
Healthcare Access
Access to Health Care2,4,5
Health Care 2000 2006
48

Washington Co. Washington Co. OhioPhysicians (MDs & DOs) 107 108 28,853Physicians per 10,000 Population 17.5 17.1 25.4Registered Hospitals 2 1 207Number of Beds 250 225 45,505Number of Beds per 10,000 Population
40.1 4.0 40.0
Insurance/Medicaid 2002-2005Washington Co. Ohio
Population Uninsured 13.9% 11.2%# of Persons Eligible for Medicaid 11,665 1,786,440% Persons Eligible for Medicaid 18.4% 15.7%
Primary Care Physicians (PCP) 2002-2005Washington Co. Ohio
# of Primary Care Physicians 54 13,400Ratio of Population to Primary Care Physicians 1,159:1 852:1
Family/General Practice Physicians & Medicaid 2002-2005Washington Co. Ohio
# of Family/General Practice Physicians Serving Medicaid Recipients: 1-50 patients
2 1,136
# of Family/General Practice Physicians ServingMedicaid Recipients: 51-250 patients
16 1,783
# of Family/General Practice Physicians Serving Medicaid Recipients: 251-1,000 patients
14 901
# of Family/General Practice Physicians Serving Medicaid Recipients: >1,000 patients
1 103
Pediatricians & Medicaid 2002-2005Washington Co. Ohio
# of Pediatricians Serving Medicaid Recipients: 1-50 patients
0 292
# of Pediatricians Serving Medicaid Recipients: 51- 0 502
49

250 patients# of Pediatricians Serving Medicaid Recipients: 251-1,000 patients
2 605
# of Pediatricians Serving Medicaid Recipients: >1,000 patients
1 138
Dentists 2002-2005Washington Co. Ohio
# of Primary Care Dentists 21 5123Ratio of Population to Primary Care Dentists 2,979:1 2,229:1
Nursing Facilities and Residential Care3,5
Nursing Facilities/ Residential Care CY 2008 CY 2009
Washington Co. Ohio Washington Co. Ohio# of Nursing Homes* 5 961 5 959# of Residential Care Facilities
3 583 3 593
# of Medicaid Eligibles Living in Nursing Facilities
328 51,917 316 49,088
Total Expenditures $16,174,108 $3,090,753,003
$15,966,386 $2,946,913,921
*Includes state-licensed and Medicaid-certified facilities.
Clinical Care8
Two main components:
1. Access to Care Uninsured Adults (Small Area Health Insurance Estimates,
U.S. Census, 2005) Primary Care Provider (Health Resources & Services
Administration, 2006)2. Quality of Care
Preventable Hospital Stays (Medicare/Dartmouth Institute, 2005-2006)
Diabetic Screening (Medicare/Dartmouth Institute, 2003-2006)
Hospice Use (Medicare/Dartmouth Institute, 2001-2005)
Rank of Washington County in Clinical Care Among 88 Counties in Ohio (2010): 72
Preventable Hospitalizations4
Preventable Hospitalizations* 2002-2005
50

Washington Co. OhioPediatric Asthma, under age 18 1.44 1.89Adult Asthma, age 18 and older 0.56 1.20Bacterial Pneumonia, all ages 4.72 4.15Congestive Heart Failure, age 18 and older 4.40 6.00Chronic Obstructive Pulmonary Disease, age 18 and older 3.96 3.53Uncontrolled Diabetes and Diabetes Short-term Complications, age 18 and older
1.01 0.76
Hypertension, age 18 and older 0.44 0.43*Inpatient admissions rate per 1,000 population
Health Behaviors and Risk
Health Behaviors2,8
Four main components:
1. Alcohol Use
51

Binge drinking Motor vehicle crash death rate
2. Tobacco Adult smoking
3. Diet and Exercise Adult Obesity
4. High Risk Sexual Behavior Chlamydia rate Teen birth rate
Rank of Washington County in Health Behaviors Among 88 Counties in Ohio (2010): 67
Health Behaviors, 2004-2007 Washington County Ohio
Male Female AllResidents
Male Female AllResidents
Heavy Drinking* 9.9% 2.7% 6.1% 4.0% 7.6% 5.4%Current Cigarette Smoking
30.0% 29.2% 29.6% 22.6% 30.0% 23.6%
Current Use of Smokeless Tobacco
5.3% 0.2% 2.7% 3.4% 0.2% 2.7%
Consuming <5 Fruits/Vegetables Per Day
86.6% 74.2% 80.1% 73.9% 81.4% 78.4%
Lack of Physical Activity**
26.2% 31.3% 28.9% 26.8% 26.7% 24.2%
Overweight*** 35.8% 26.8 31.1% 29.4% 30.3% 35.9%Obese+ 32.9% 32.1% 32.5% 25.6% 32.6% 26.3%
*Men having more than 2 drinks/day, women having more than 1 drink/day.
**Persons who failed to participate in moderate physical activity for 30 or more minutes per day on five or more days per week; or vigorous activity
for 20 or more minutes per day on three or more days per week.***Body Mass Index (BMI) of 25-29.9.+BMI of 30.0 or greater.
Health Risk4
Behavioral Risk Factor Surveillance System Indicators 2002-2005
Washington Co. Ohio
52

Adults age 18 and older with Diabetes 6.1% 6.5%Adults age 18 and older with Asthma 10.3% 7.9%Adults age 18 and older with High Blood Pressure 31.4% 26.3%Adults age 18 and older with High Cholesterol 39.7% 32.4%Adults age 20 and older that are Obese 22.0% 22.0%Adults age 65 and older that have had a Pneumonia Vaccination
23.5% 27.3%
Mental Health and Substance Abuse4
Mental Health and Substance Abuse** 2002-2005Washington Co. Ohio
Treatment rate per 1,000 children under age 18 for Serious Emotional Disturbance (SED)
23 16
Treatment rate per 1,000 adults age 18 and older for Serious Mental Disease (SMD)
9 8
# of days in past 30 days that adults age 18 and older felt sad/depressed
3.5 3.2
Adults age 18 and older who drank <5 drinks on one or more occasions in past month
12.0% 14.9%
**Insufficient numbers or sample size for meaningful analysis
Social, Economic, and Environmental Factors
Social/Economic Factors2,4,7,8
Five main components:
53

1. Education High school graduation (National Center for Education Statistics,
2005-2006) College degrees (Health Resources & Services Administration,
2006)2. Employment
Unemployment (Bureau of Labor Statistics, 2008)3. Income
Children in poverty (Small Area Income and Poverty Estimates, U.S. Census, 2007)
Income inequality (U.S. Census/American Community Survey, 2000/2005-2007)
4. Family and social support Inadequate social support (Behavioral Risk Factor Surveillance
System, 2005-2008) Single-parent households (U.S. Census/American Community
Survey, 2000/2005-2007)5. Community safety
Violent crime (Uniform Crime Reporting, Federal Bureau of Investigation, 2005-2007)
Rank of Washington County in Socioeconomic Factors among 88 counties in Ohio (2010); 22
Female-headed Households, 2000 Washington Co. Ohio U.S.Female-headed households with children <18 5.3% 7.3% 7.2%
Language, 2002-2005 Washington County OhioPopulation >5 years who speak a language other than English at home
2.5% 6.1%
Households linguistically isolated 0.3% 1.2%
Physical Environment8
Two main components:
1. Air Quality
54

Air pollution - particulate matter days (U.S. Environmental Protection Agency/Centers for Disease Control and Prevention, 2005)
Air pollution - ozone days (U.S. Environmental Protection Agency/Centers for Disease Control and Protection, 2005)
2. Built Environment Access to healthy foods (Census zip Code Business
Patterns 2006) Liquor store density (Census County Business Patterns,
2006)
Rank of Washington County in Physical Environment Among 88 Counties in Ohio (2010): 82
Family Type5
Family Type by Employment Status, 2008 Washington CountyNumber Percent
Total Families 17,766 100.0%Married couple, husband and wife in labor force 7,387 41.6%Married couple, husband in labor force, wife not 3,265 18.4%Married couple, wife in labor force, husband not 955 5.4%Married couple, husband and wife not in labor force 2,942 16.6%Male householder, in labor force 613 3.5%Male householder, not in labor force 197 1.1%Female householder, in labor force 1,547 8.7%Female householder, not in labor force 860 4.8%
Family Type by Presence of Own Children Under 18, 2008 Washington CountyNumber Percent
Total Families 17,766 100.0%Married-couple families with own children 5,826 32.8%Male householder, no wife present, with own children 459 2.6%Female householder, no husband present, with own children 1,478 8.3%Families with no own children 10,003 56.3%
Housing5
Housing Units, 2008 Washington County
55

Number PercentTotal housing units 27,760 100.0%Occupied housing units Owner occupied Renter occupied
25,13719,1655,972
90.6% 69.0% 21.5%
Vacant housing units 2,623 9.4%
Year Structure Built, 2008 Washington CountyNumber Percent
Total housing units 27,760 100.0%Built 1995-March 2000 2,172 7.8%Built 1990-1994 1,596 5.7%Built 1980-1989 3,875 14.0%Built 1970-1979 5,255 18.9%Built 1960-1969 3,401 12.3%Built 1950-1959 3,228 11.6%Built 1940-1949 1,549 5.6%Built 1939 or earlier 6,684 24.1%Median Year Built 1967 ---------------
Crime5
Total crimes in Washington County reported in Uniform Crime Report (2008): 1,327
56

Community Health Council Stakeholder Survey Results
The Community Health Council participated in a survey conducted by the Memorial Health System as part of our Community Health Assessment. Stakeholders of each participating agency were asked to complete the survey. The hospital then tallied the results and provided feedback to the Community Health Council. In addition, the hospital facilitated an action planning session based on the assessment report and the survey results.
Participating Agencies
The Right Path/Washington County Mental HealthEVEWashington County Health DepartmentCommunity Action Health ServiceJob and Family ServicesWashington County Community Health CouncilMemorial Health System
Health Care Access
Very Easy
Somewhat Easy
Not Very Easy
Not At All Easy
Is access to medical treatment and services in Washington County…..
14.3% 42.9%
14.3%
28.6%
Is access to mental health treatment and services in Washington County…..
28.6%
71.4%
Is access to a physician in Washington County….. 57.1%28.6
%14.3
%
Services Sought Outside of Washington County
The services are presented in rank order with the most often cited service appearing first. Services mentioned only once are not included.
Adults Teenagers
Addiction services; detox Mental health
Psychiatric inpatient Psychiatric inpatient
Family planning Dental
Mental health
57

Cardiac open heart surgery Children
Dental Specialized pediatric careDentists who accept Medicaid
Dental Mental health
Top Health Concerns
Adults
Weighted Score Rank
28 1 Mental health19 2 Obesity16 3 Physical health13 4 Substance abuse
Children and Teenagers
Weighted Score Rank
30 1 Mental health20 2 Substance abuse15 3 Obesity11 4 Lack of physical activity/exercise
Community Concerns
Weighted Score Rank
25 1 Employment18 2 Access to mental health services16 3 Access to healthcare
58

Strengths WeaknessesLocal hospitals/health services
2 local hospitals 4 hospitals in mid-Ohio valley Cancer Center New facilities/expansion Wide variety of services Services accessible
Physicians Excellence Primary care physicians Specialists Good psychiatrists
Free Services Free Clinic Growth of dental clinic
Senior Center Day Care
Lack of substance abuse treatment No inpatient services
Lack mental health care/resources No inpatient care Community mental health is private/for
profitPhysician Issues
Contracted physicians Dr. without hospital privileges Limited time spent with patients
Reproductive/Sexual Health Services Lack family planning Lack prenatal care Lack STD clinic
Community Health System/Services Relationship Lack trust in delivery system Lack trust in ED physicians Medical insurance accepted by physicians
controlled by one entity Quality decrease with expansion
Uninsured/underinsured/Medicare Low cost dental limited Limited services without 3rd party payer New services aimed at Medicare
populationLack coordination of Health Departments
Opportunities ThreatsCoordination and Cooperation
Community health providers Health departments
Mental Health ServicesExpansion of Clinics and Free ServicesCaregiver Support
Financial Program funding Reduction in Medicare reimbursement Economy No mental health levy Loss of jobs with medical insurance benefit
Health ReformMental Health/Substance Abuse strain on
community businesses and resourcesLack of community collaborationEnvironmental pollutionInfrastructure in rural parts of county
Cell service High speed internet Emergency response
59

Community Health Council Action Plan
Action Planning Agenda
An action planning session was facilitated by the hospital to review the Community Health Assessment report and the Stakeholder Survey Results in order to develop an action plan based on the findings. Three brainstorming groups formed to develop potential ideas for addressing the community health needs based on the two sources of information.
Brainstorming Group#1 Summary:
o Communicationo Access—resource guide tool lit available to familyo Resourceso Understanding—meet regularly with medical staffo Stronger Attendance of Councilo Education—partnering of council, voice of prevention
Brainstorming Group#2 Summary:
o Grass Roots—support for Mental Health Levyo Potential of grant writing, fundingo Volunteer organizations
Brainstorming Group#3 Summary:
o Meeting mental health services—coming upo Education-nutritiono Levy issues
The larger group then developed a set of priorities based on the three brainstorming groups lists.
Priorities:
1. Communication/Educationa. Toolboxb. Resource Guidec. Social Mediad. Collaboratione. All Resources Currently Available
2. Mental Health Levy—Develop levy support modela. Grassrootsb. Access to Mental Health Initiative
60

c. Council support of levy—tell us what to do3. Partnership Development
a. Physicianb. Employeesc. Volunteersd. Educatione. Financialf. Faith Based
Order of importance of priorities:
Later Now
Communication/Education Mental Health Levy
Mental Health Levy Communication/Education
Partnership Development Partnership Development
Next Steps to accomplish support model for levy support:
Letter of Support/Letter to Editor Encourage Individual Council members to write letter to editor Attend Kiwanis, Rotary, Women’s Club, Lions Club, etc., if you are a
member of secondary organization invite representative to attend to speak of support for levy
Brochure distribution Faith Based Organizations—Health Ministries
Next Steps to accomplish communication and education:
Establish Criteria (Mission) Briefing upcoming levy; what materials using, testimonials Sub-committee of council members Education to local agencies/audiences Commitment of group Ad in local media
61

Memorial Health System Action Plan
The following actions will be undertaken by the Memorial Health System in response the Community Health Assessment and Community Health Council Stakeholder report.
1. Create consistent data sets to understand the trends in our community health needs and the impact of our actions over time.
a. Every three years we will update the current Community Health Assessment report and conduct the same Community Health Council Stakeholder survey.
b. We will share both data sets with Community Health Council to assist them with the broader community health planning.
2. Support the Community Health Council.
a. The Memorial Health System committed resources to assist with the development of a communication toolbox for agencies, a community Resource Guide, and Social Media tools to address community health needs and to connect community members to available resources.
b. The Memorial Health System will provide opportunities for agencies of the Community Health Council to educate our employees on levy issues and agency needs. We will also lend marketing support to support health related levies and public campaigns initiated by the agencies of the Community Health Council.
c. Continue participation as a Community health Council member.
3. Promote disease detection and prevention in the community.
a. Develop a mechanism to offer an all-inclusive colonoscopy screening package at a lower combined cost.
b. Offer more prevention and wellness outreach services to local employers (e.g. health screenings, health education, exercise and nutritional services).
c. Continue offering the grant funded Komen Foundation mammography screenings for low income women. Increase community awareness of program availability.
4. Pursue and obtain Primary Stroke Center Certification through the Healthcare Facilities Accreditation Program (HFAP).
5. Partner with Marietta College and People’s Bank on a long term, community wide project to reduce hunger.
6. Support mental health needs in the community.
62

a. Recruit psychiatrist(s)
b. Add geripsych bed(s)
c. Support other mental health initiatives through the Community Health Council such as levies and community awareness of resources.
63

Reference List/Data Sources
1. National Public Health Performance Standards Program. Local Public Health System Performance Assessment; Report of Results: Washington County General Health District. November 16, 2009.
2. Ohio Department of Health. Health Ohio Community Profiles. Office of Healthy Ohio, Columbus, Ohio. December, 2008.
3. Ohio Department of Job and Family Services. 2009 Washington County Profile. 2009.
4. Ohio Department of Health. Primary Care County Profile: Washington County. 2006.
5. Ohio Department of Development. Ohio County Profiles. Office of Policy, Research, and Strategic Planning, Columbus, Ohio. September, 2010.
6. Public Children Services Association of Ohio. County Profiles: Washington County; The 2009-2010 PCSAO Factbook, 9th Edition. May 2009. The 2011-2012 PCSAO Factbook, 10th Edition. May 2011.
7. Ohio Department of Health. Child and Family Health Services; Health Status Profile: Washington County, Ohio. November, 2010.
8. University of Wisconsin Population Health Institute. Robert Wood Johnson Foundation. County Health Rankings: 2010 Ohio. 2010.
9. Ohio Department of Jobs and Family Services. Ohio Family Children First: Washington County. Ohio Secretary of State, Columbus, Ohio. 2008.
10. Scripps Gerontolgy Center. Profile and Projections of the 60+ Population: Washington County, Ohio. University of Miami, Oxford Ohio. May 24, 2004.
64