Embed Size (px)
Citation preview
信息可视化与可视分析信息可视化与可视分析
Information Visualization Information Visualization
and Visual Analytics and Visual Analytics
林 夏林 夏[email protected] [email protected]
20062006 年年 88 月 月
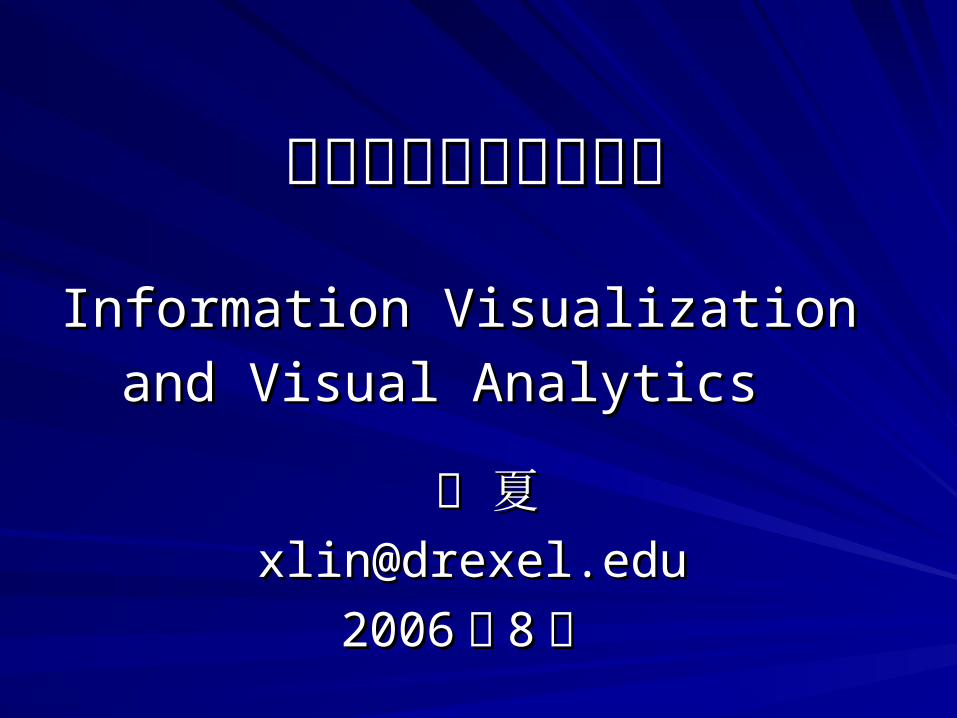
Outline Outline
Introduction to Information VisualizationIntroduction to Information Visualization
The field of Information visualization The field of Information visualization
Applications of Information Visualization Applications of Information Visualization – For Knowledge Domain AnalysisFor Knowledge Domain Analysis– in Libraries/Digital Librariesin Libraries/Digital Libraries– Dynamic knowledge representation Dynamic knowledge representation
Future of Information Visualization Future of Information Visualization
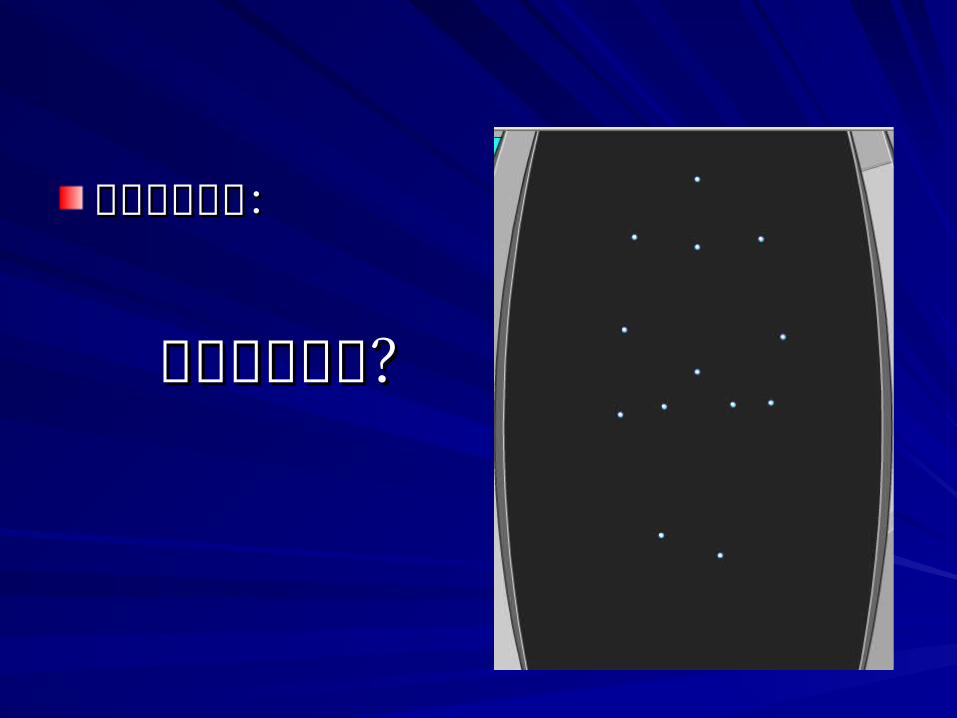
您看到了您看到了什么?什么?
先从游戏开始:先从游戏开始:
为什么您看到了为什么您看到了……
应为我看到了应为我看到了– 靠直觉靠直觉– 靠感应靠感应– 靠联想靠联想– 靠知识靠知识应为一种豁朗尔郎的感觉应为一种豁朗尔郎的感觉– ““ 点到为止”点到为止”– ““ 动态连接”动态连接”

人类智能的开发人类智能的开发信息可视化是对人类智能一种新的开发信息可视化是对人类智能一种新的开发– 理性的智慧理性的智慧
Rational intelligenceRational intelligence – Natural Natural ScienceSciencess
– 感性的智慧感性的智慧Emotional intelligence Emotional intelligence
– Humanities Humanities
– 知性的智慧知性的智慧 Visual intelligence Visual intelligence
– Perception & recognitionPerception & recognition
知性的智慧知性的智慧如何提高认知的功能如何提高认知的功能– 理解感知的能力理解感知的能力
The power of perceptionThe power of perception– 認知的功能認知的功能
The power of graphicsThe power of graphics– 图形的功能图形的功能
The power of associationsThe power of associations– 联想的功能联想的功能
– 通过计算机的功能来提高,放大认知的功能通过计算机的功能来提高,放大认知的功能
What is Information VisualizationWhat is Information Visualization ? ?
Card, Mackinlay, and Shneiderman:Card, Mackinlay, and Shneiderman:– ““The use of computer-supported, interactive, The use of computer-supported, interactive,
visual representation of visual representation of abstractabstract data to data to amplify cognition.”amplify cognition.”
Interactive -- Interactive -- 互动式的互动式的Visual representation –Visual representation – 可視的可視的Amplify cognition –Amplify cognition –提高認知的功能提高認知的功能
How Visualization Works?How Visualization Works?
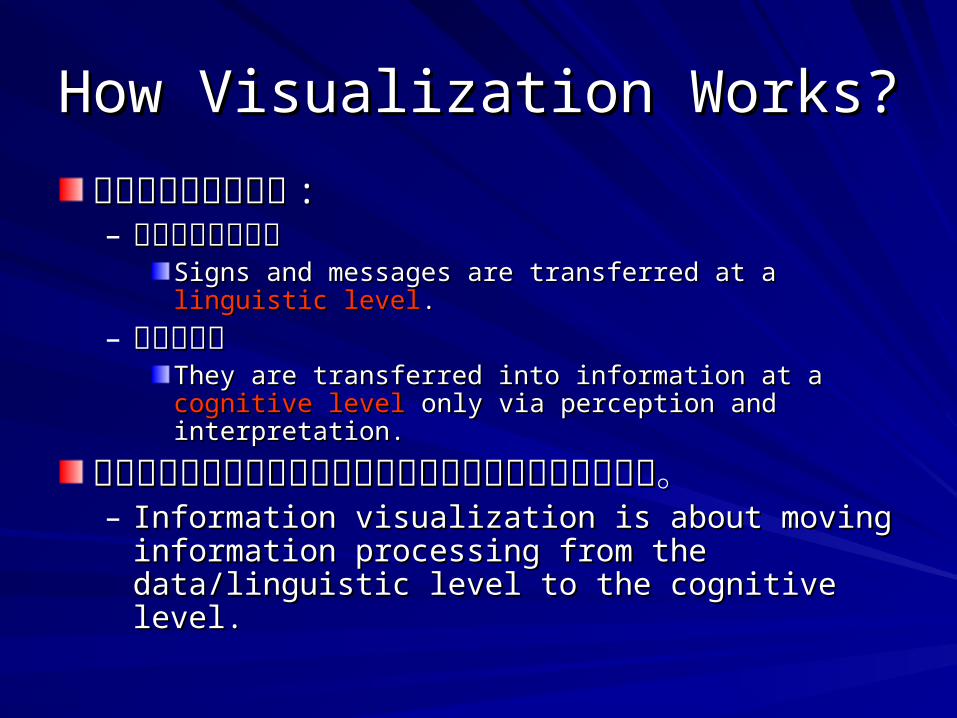
不同层次的信息处理不同层次的信息处理 ::– 语言与信号的层次语言与信号的层次
Signs and messages are transferred at a Signs and messages are transferred at a linguistic levellinguistic level..
– 认知的层次认知的层次They are transferred into information at a They are transferred into information at a cognitive levelcognitive level only only via perception and interpretation. via perception and interpretation.
信息可视化促进了从语言与信号的层次到认知的信息可视化促进了从语言与信号的层次到认知的层次的转化。层次的转化。– Information visualization is about moving information Information visualization is about moving information
processing from the data/linguistic level to the processing from the data/linguistic level to the cognitive level. cognitive level.
The Field of Information VisualizationThe Field of Information Visualization
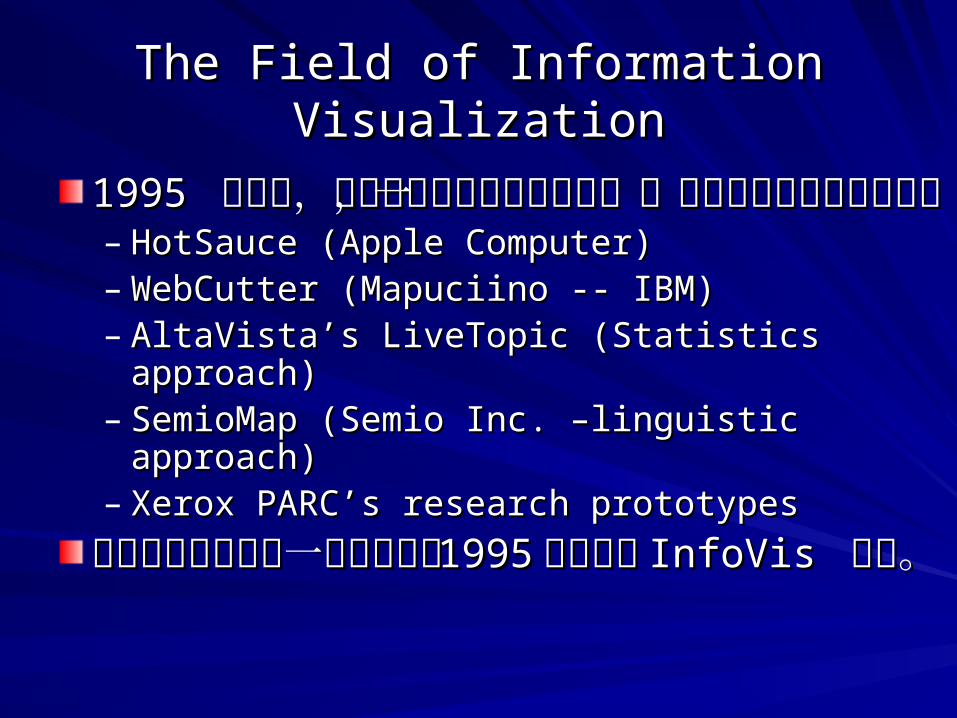
1995 1995 年前后,随着网络信息技术的发展,年前后,随着网络信息技术的发展,一批可视技术有了新的突破一批可视技术有了新的突破– HotSauce (Apple Computer) HotSauce (Apple Computer) – WebCutter (Mapuciino -- IBM)WebCutter (Mapuciino -- IBM)– AltaVista’s LiveTopic (Statistics approach) AltaVista’s LiveTopic (Statistics approach) – SemioMap (Semio Inc. –linguistic approach)SemioMap (Semio Inc. –linguistic approach)– Xerox PARC’s research prototypesXerox PARC’s research prototypes
信息可视化领域的一个里程碑是信息可视化领域的一个里程碑是 19951995 年开年开始的始的 InfoVis InfoVis 年会。年会。
The Field of IVThe Field of IV
另一个里程碑是另一个里程碑是 19991999 年出版的年出版的 ““ Readings in Information Visualization”Readings in Information Visualization”
信息可视化是一门边缘学科信息可视化是一门边缘学科– Computer ScienceComputer Science– Information ScienceInformation Science– Psychology Psychology – EducationEducation– And many other applied fields. And many other applied fields.
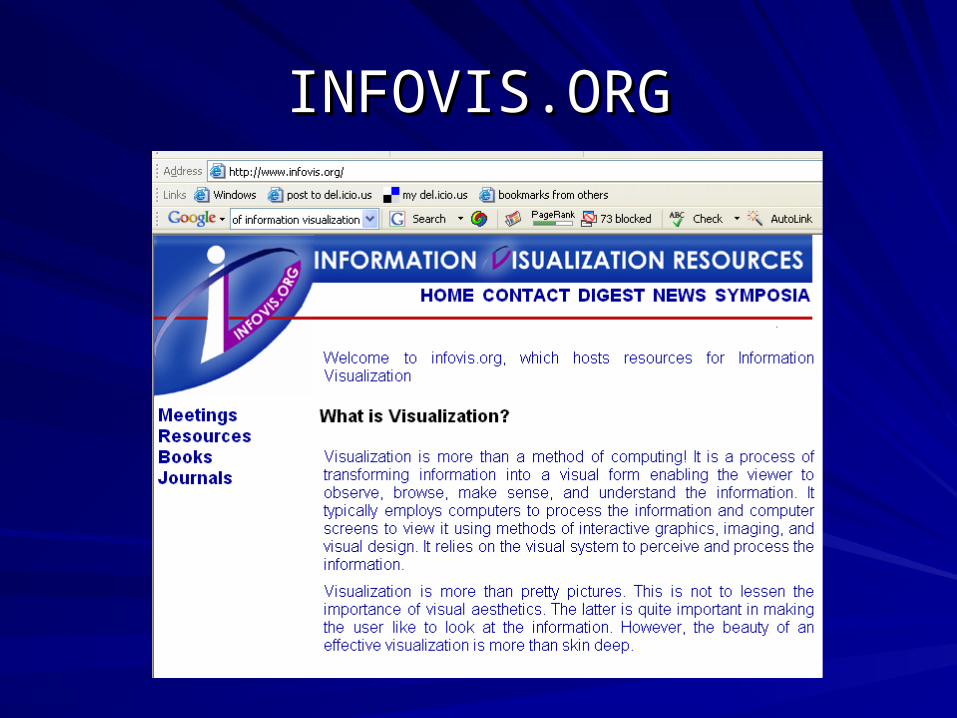
INFOVIS.ORGINFOVIS.ORG
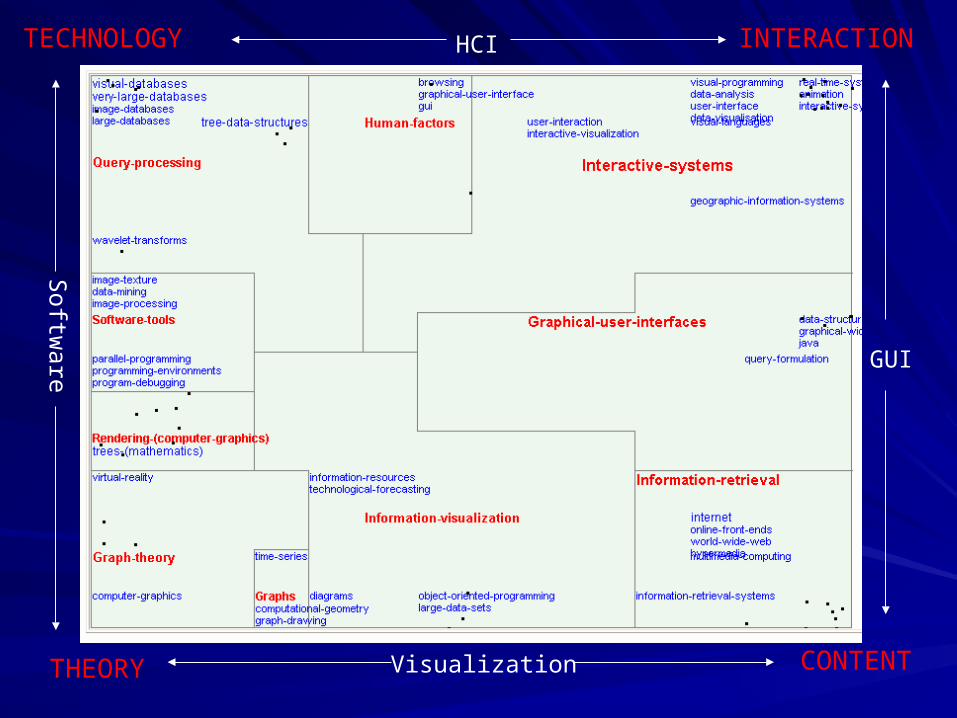
TECHNOLOGY INTERACTION
CONTENTTHEORY Visualization
GUI
Softw
are
HCI
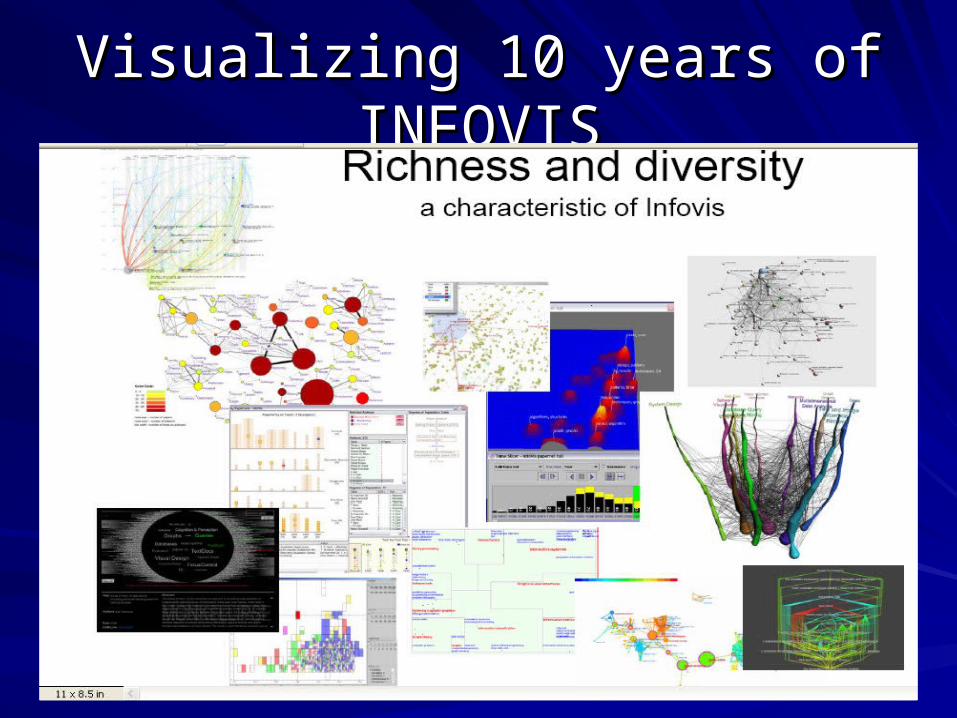
Visualizing 10 years of INFOVISVisualizing 10 years of INFOVIS
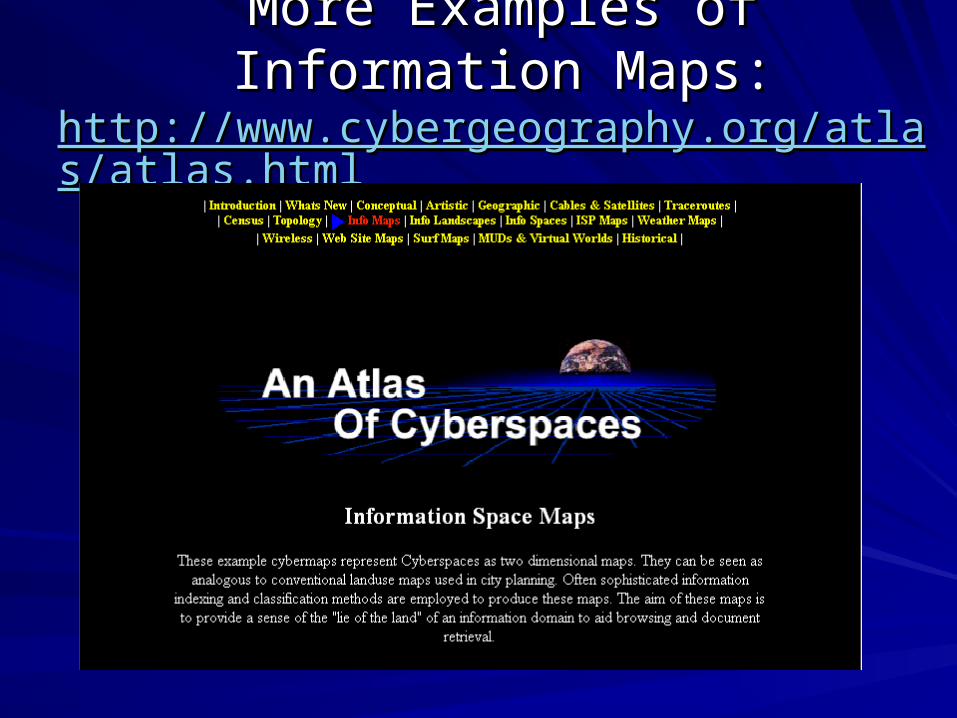
More Examples of Information Maps:More Examples of Information Maps:http://www.cybergeography.org/atlas/atlas.htmlhttp://www.cybergeography.org/atlas/atlas.html
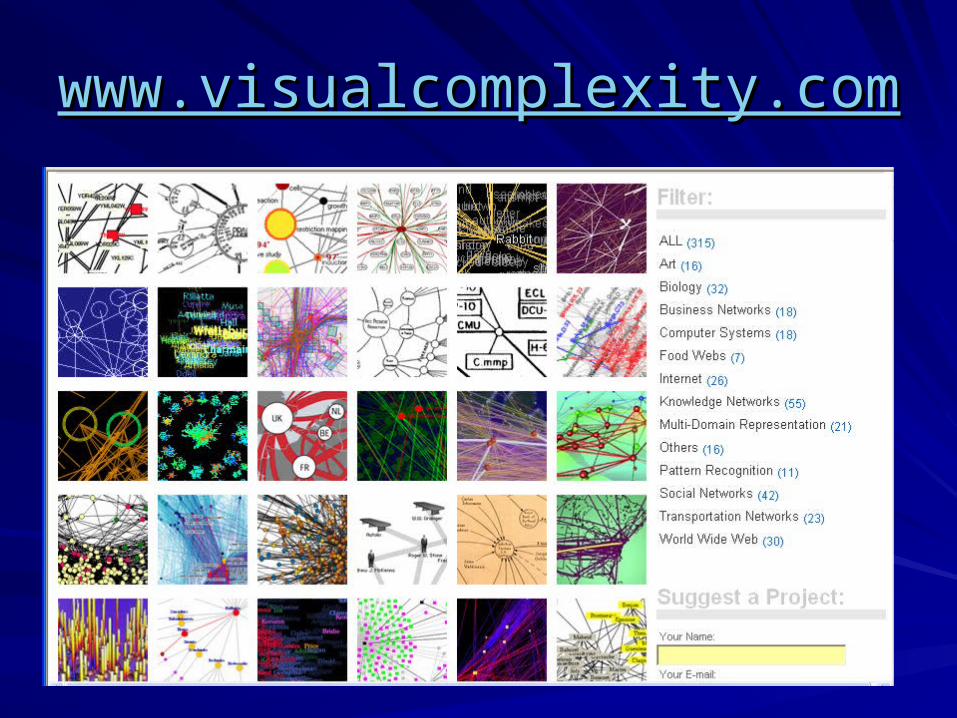
www.visualcomplexity.comwww.visualcomplexity.com
信息可视化的应用信息可视化的应用Knowledge Domain VisualizationKnowledge Domain Visualization
Information Visualization in Libraries Information Visualization in Libraries
Dynamic Knowledge RepresentationDynamic Knowledge Representation
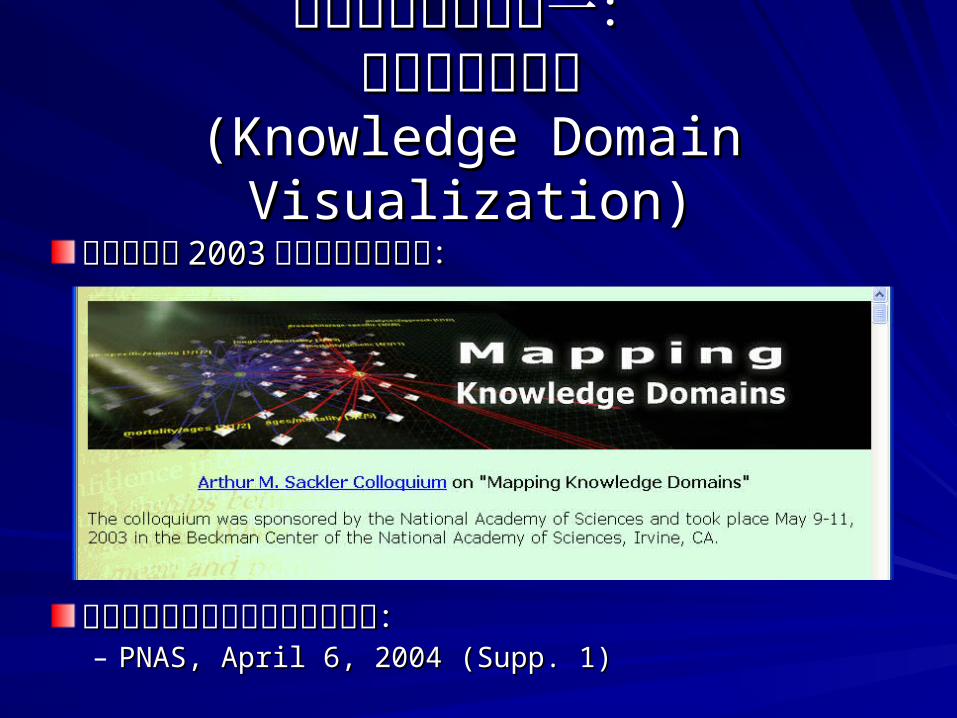
信息可视化应用之一:信息可视化应用之一:知识领域可视化知识领域可视化
(Knowledge Domain Visualization)(Knowledge Domain Visualization)
美国科学院美国科学院 20032003 年举办专题讨论会:年举办专题讨论会:
会议论文在美科学院学报出了专辑:会议论文在美科学院学报出了专辑:– PNAS, April 6, 2004 (Supp. 1) PNAS, April 6, 2004 (Supp. 1)
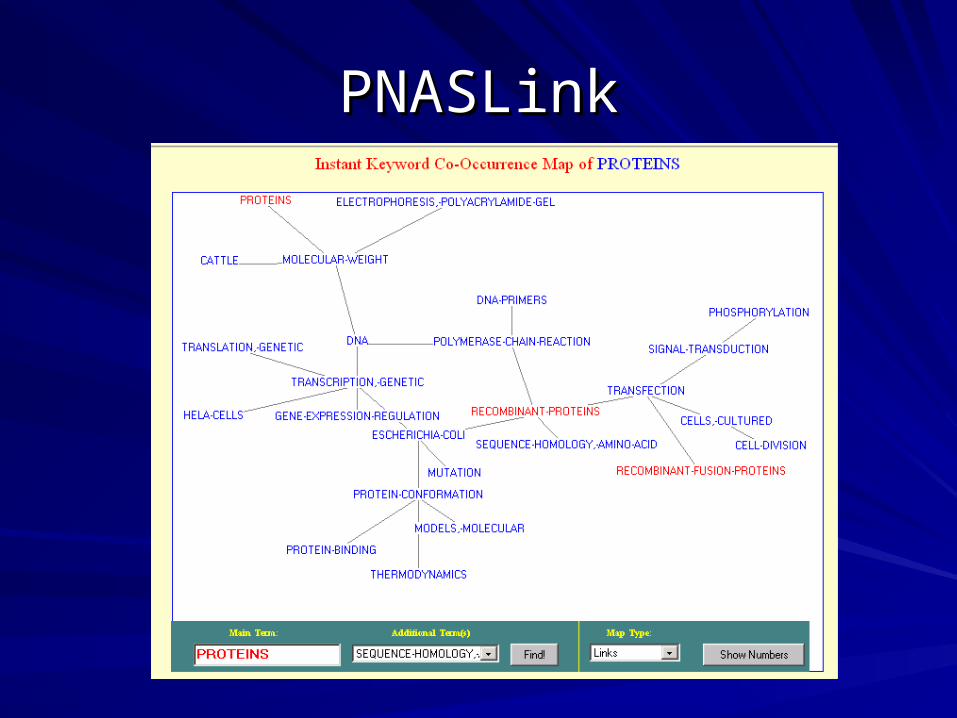
PNASLinkPNASLink
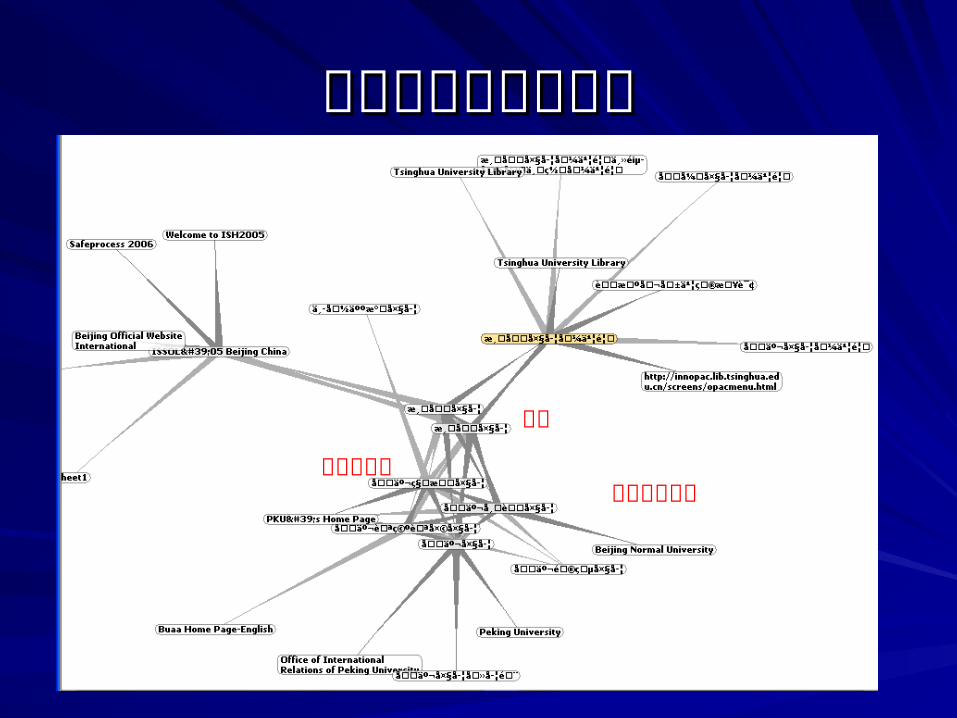
清华大学网站可视图清华大学网站可视图
清华
北京科技大北京邮电大学

信息可视化应用之二:信息可视化应用之二:可视化在图书馆的应用可视化在图书馆的应用
Commercial Products– Visual Thesaurus – AquaBrowser – Xreferplus Concept Map – Dewey browsers
My Prototypes
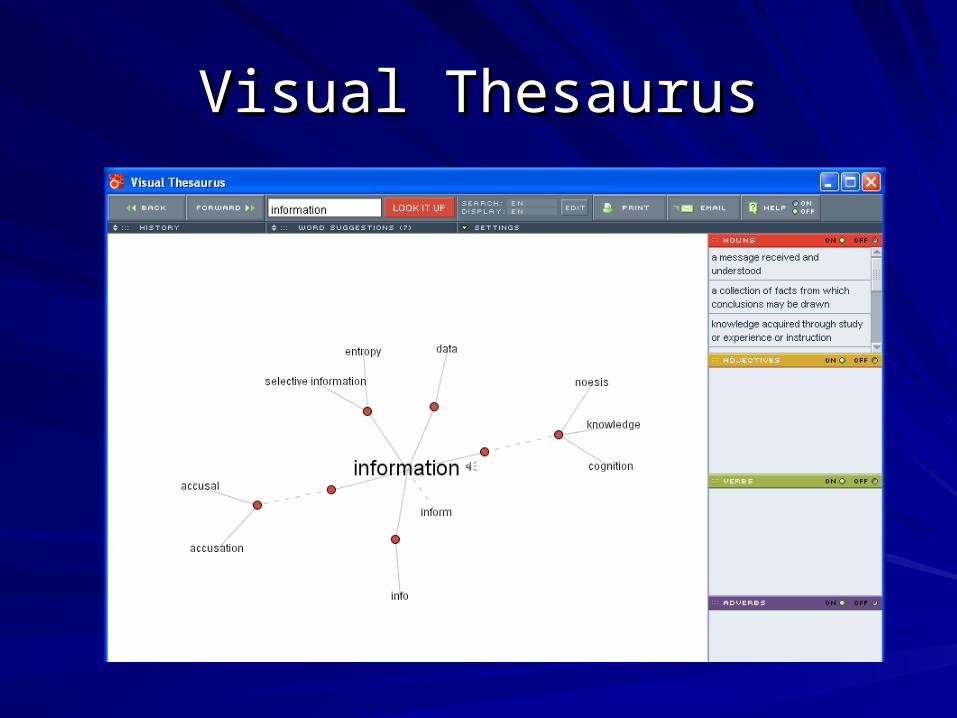
Visual ThesaurusVisual Thesaurus
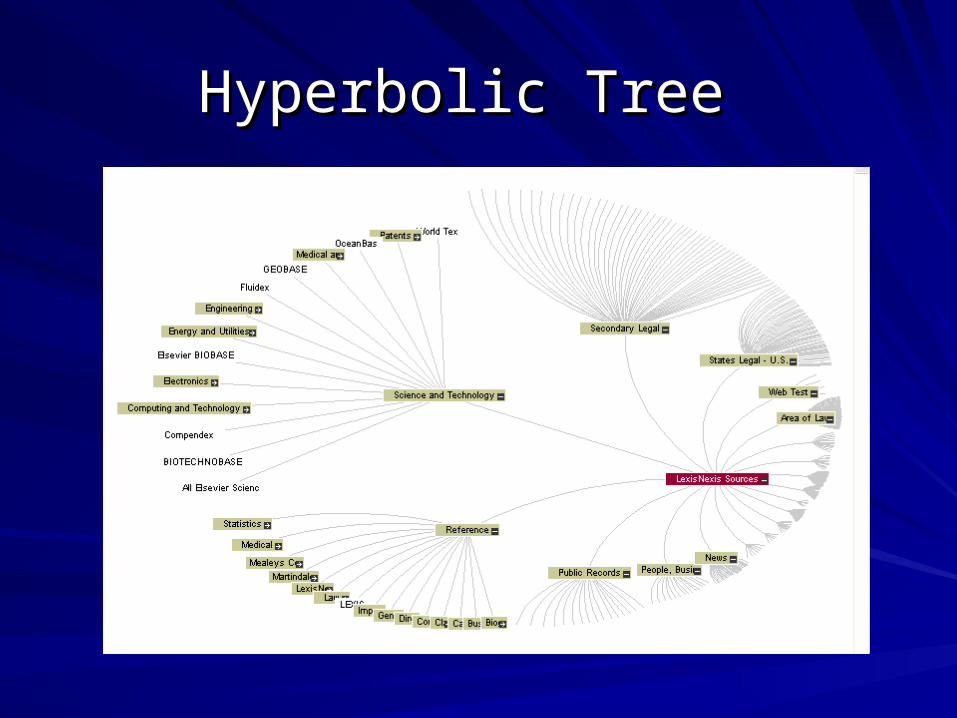
Hyperbolic Tree Hyperbolic Tree
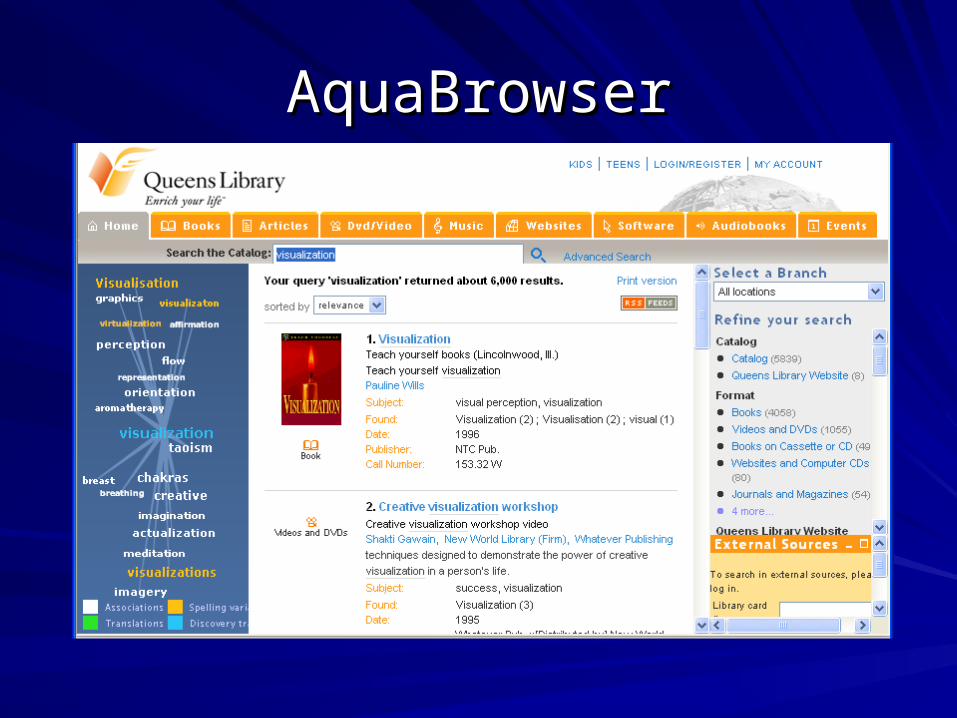
AquaBrowserAquaBrowser
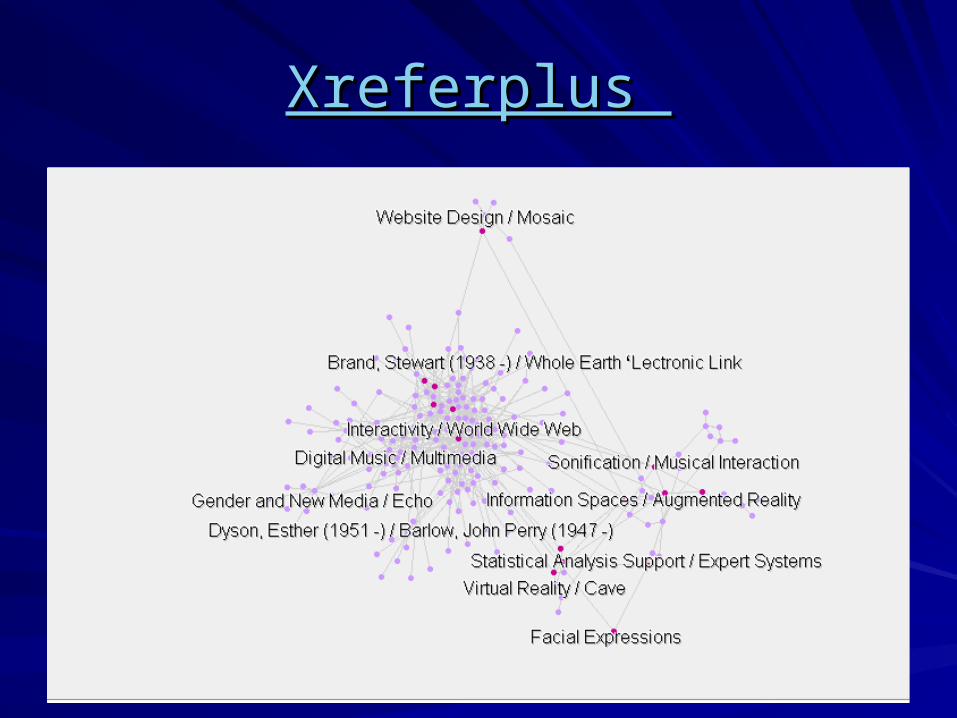
Xreferplus Xreferplus
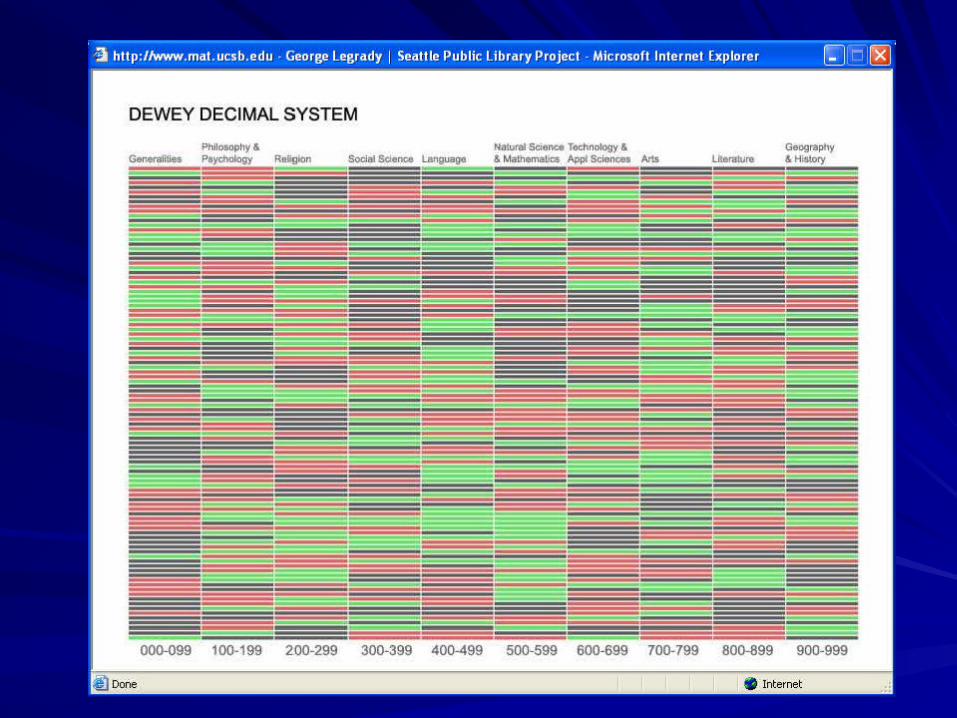
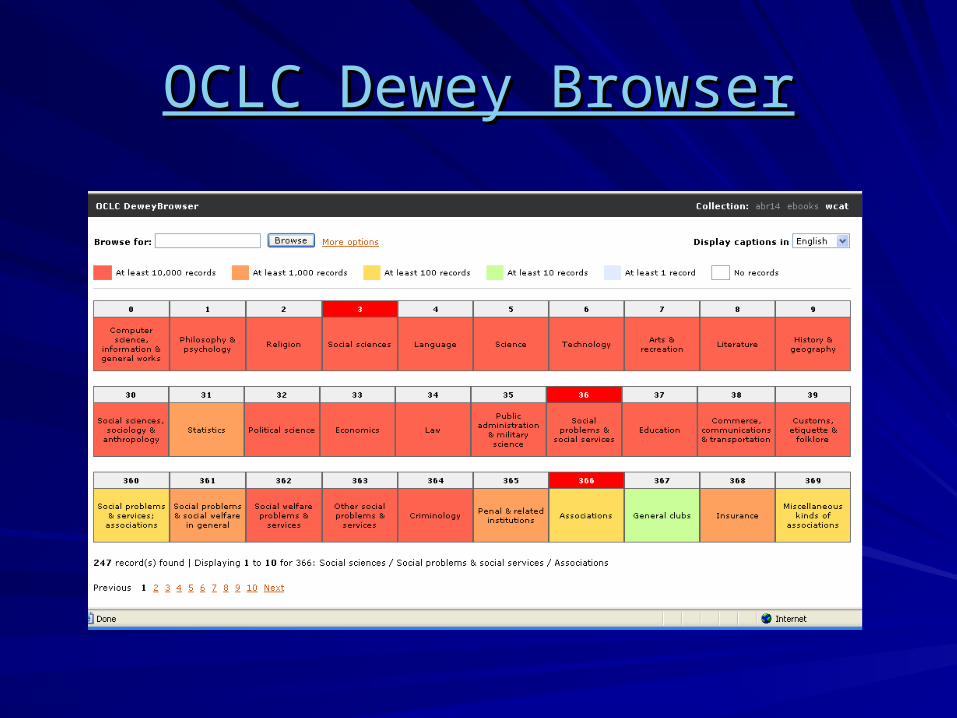
OCLC Dewey BrowserOCLC Dewey Browser
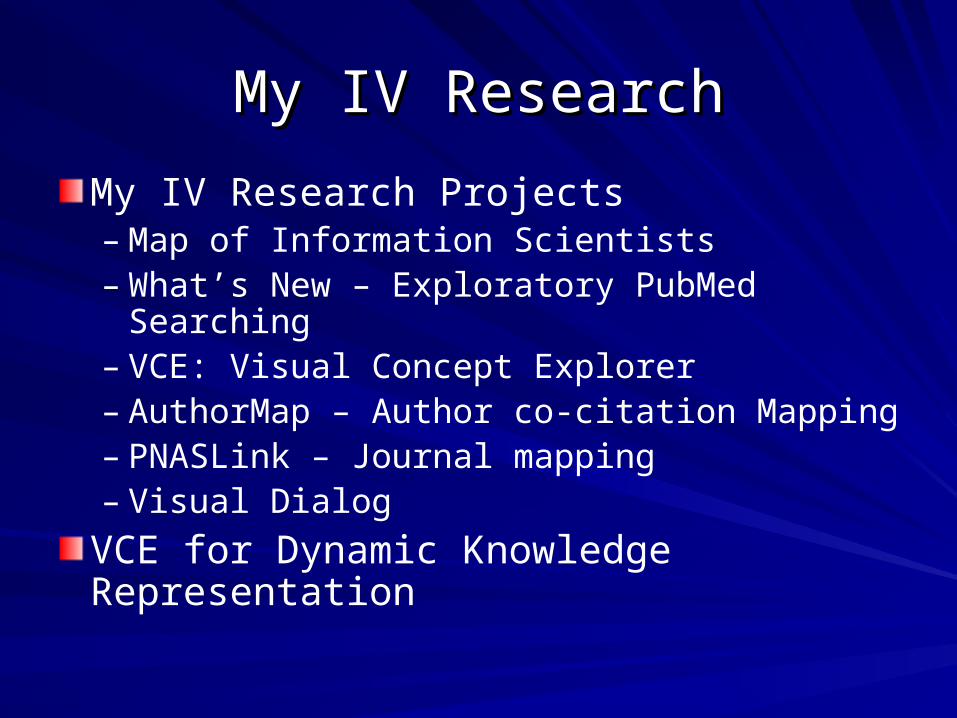
My IV ResearchMy IV Research
My IV Research Projects– Map of Information Scientists– What’s New – Exploratory PubMed Searching– VCE: Visual Concept Explorer– AuthorMap – Author co-citation Mapping – PNASLink – Journal mapping– Visual Dialog
VCE for Dynamic Knowledge Representation
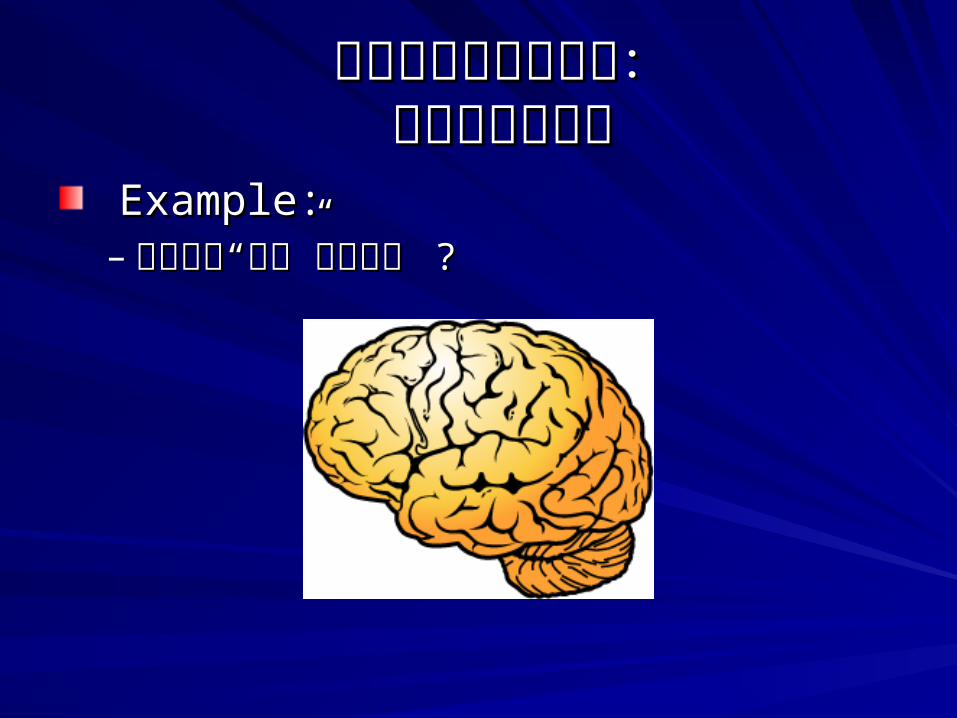
信息可视化应用之三:信息可视化应用之三:动态概念可视图动态概念可视图
Example: Example: – 怎样表示“大脑”这个概念 怎样表示“大脑”这个概念 ??
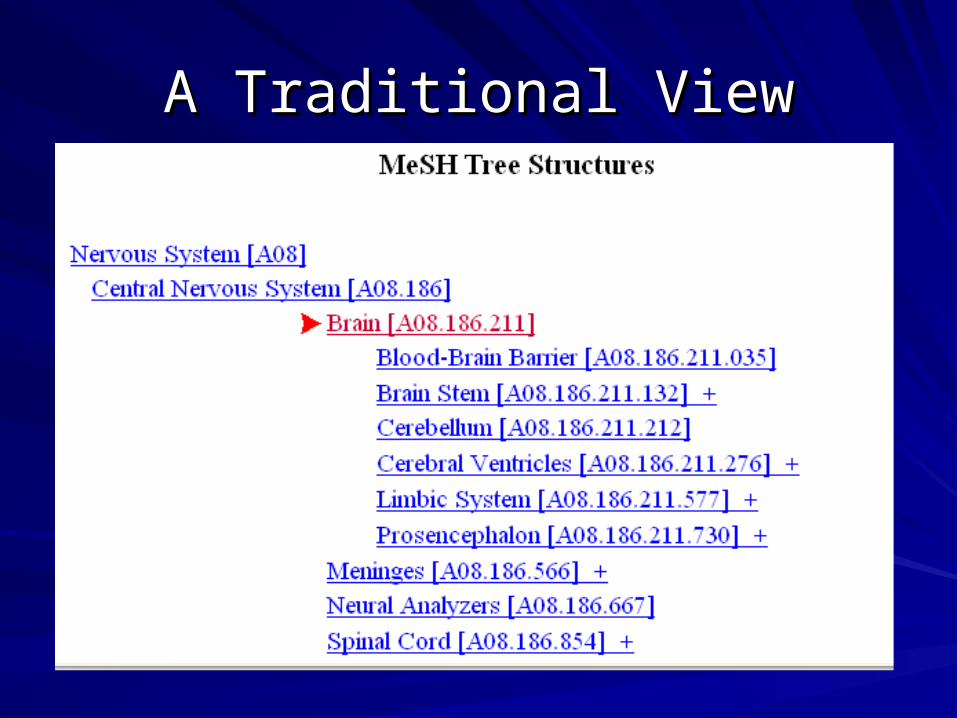
A Traditional ViewA Traditional View
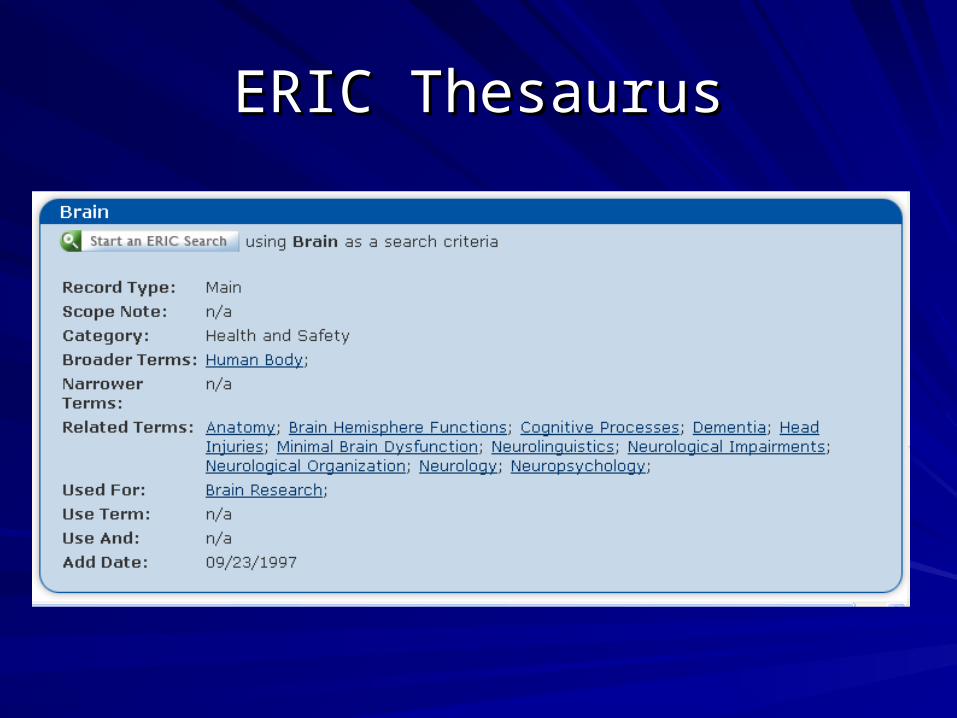
ERIC ThesaurusERIC Thesaurus
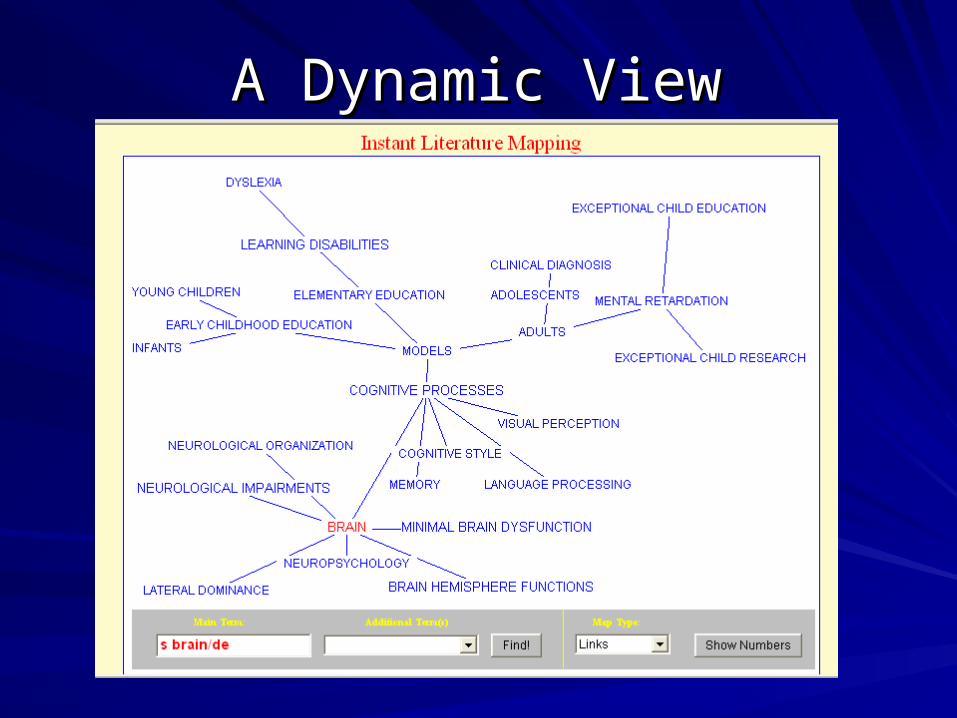
A Dynamic ViewA Dynamic View
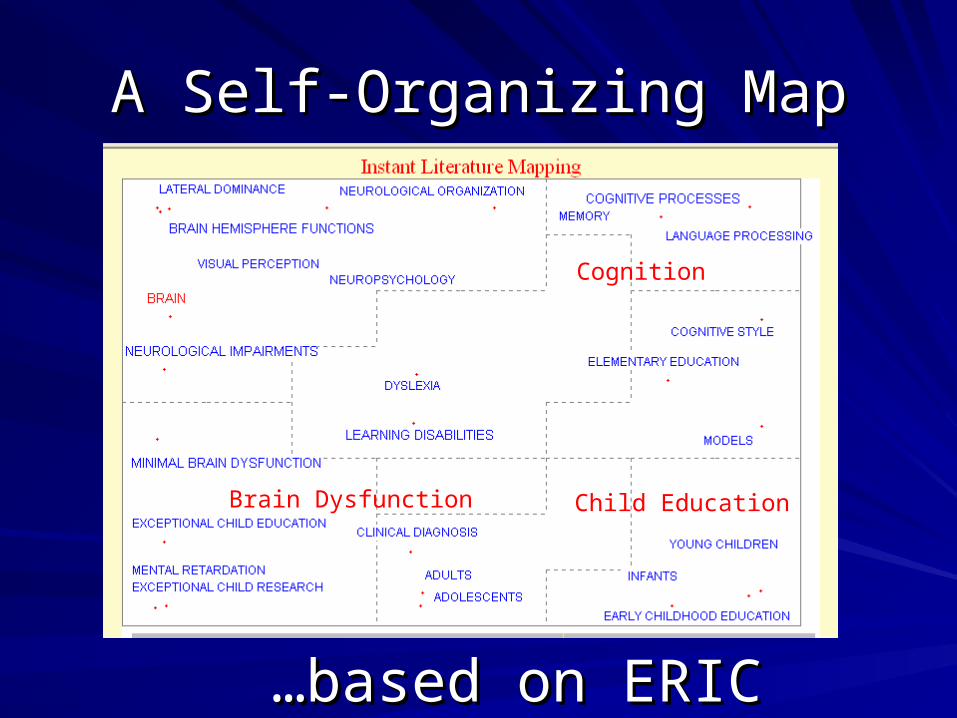
A Self-Organizing MapA Self-Organizing Map
Cognition
Brain Dysfunction Child Education
……based on ERICbased on ERIC
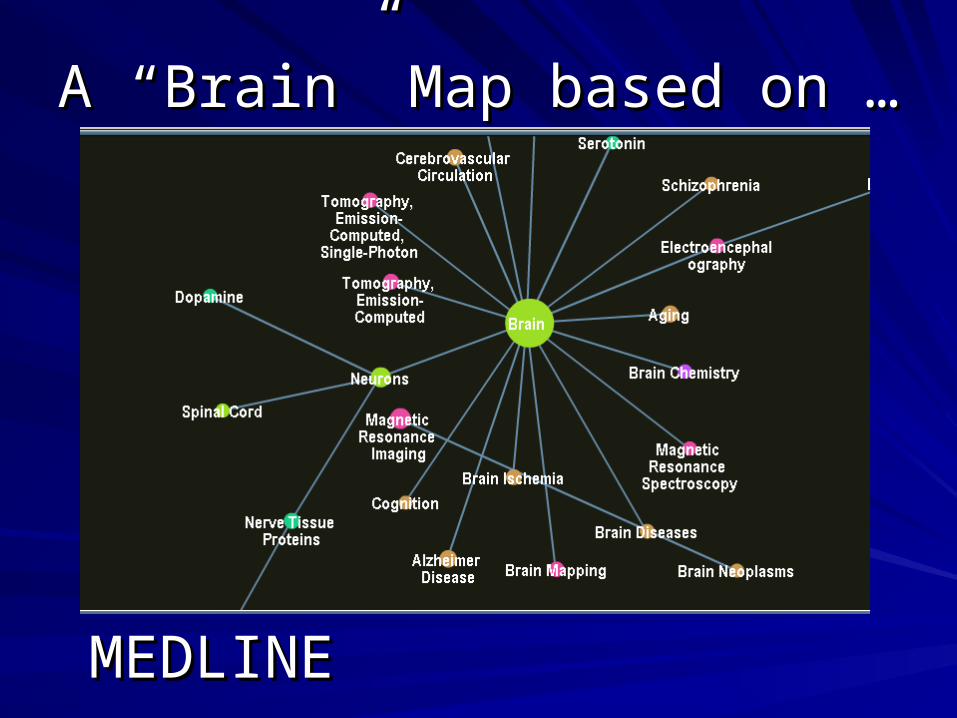
A “Brain” Map based on …A “Brain” Map based on …
MEDLINEMEDLINE
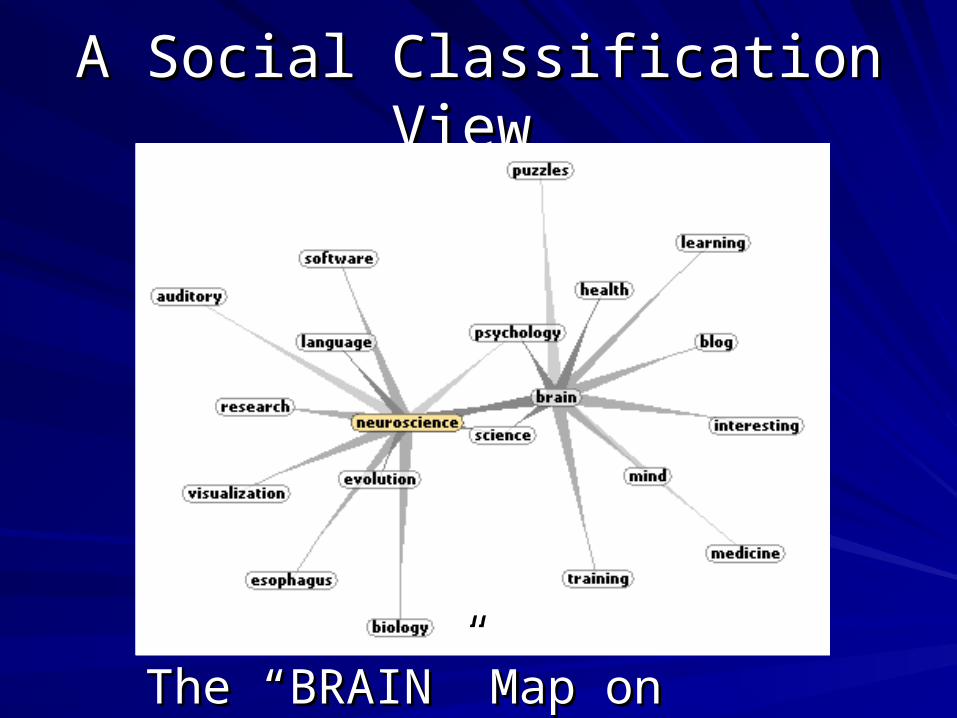
A Social Classification View A Social Classification View
The “BRAIN” Map on Del.icio.usThe “BRAIN” Map on Del.icio.us
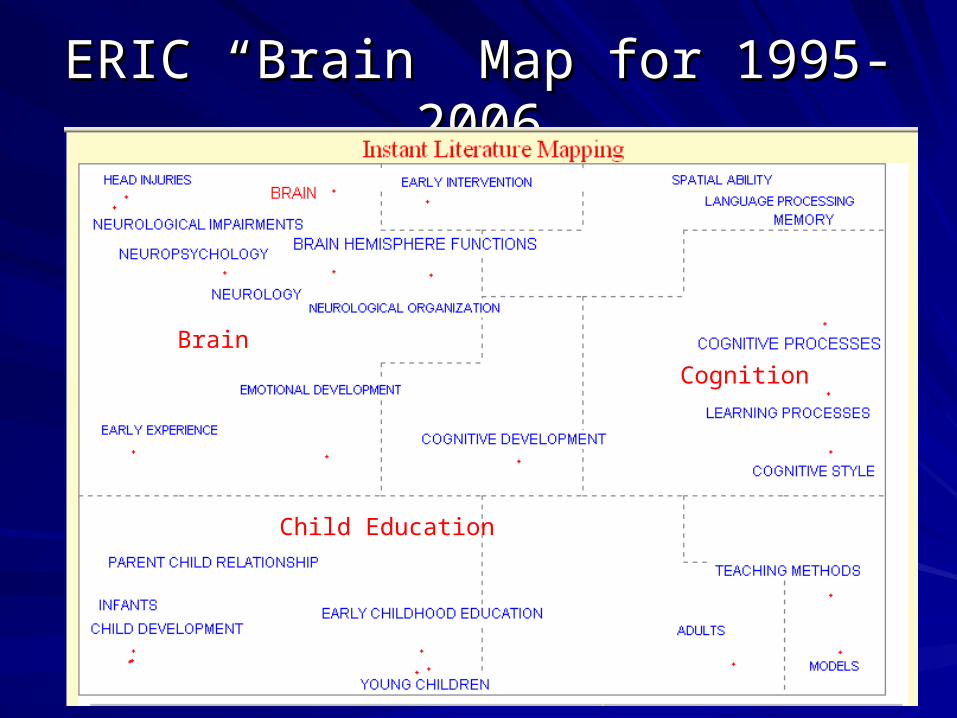
ERIC “Brain” Map for 1995-2006ERIC “Brain” Map for 1995-2006
Cognition
Child Education
Brain

ERIC “Brain” Map for 1990-1984ERIC “Brain” Map for 1990-1984
Brain Dysfunction
Learning Disabilities
Hyperactivity
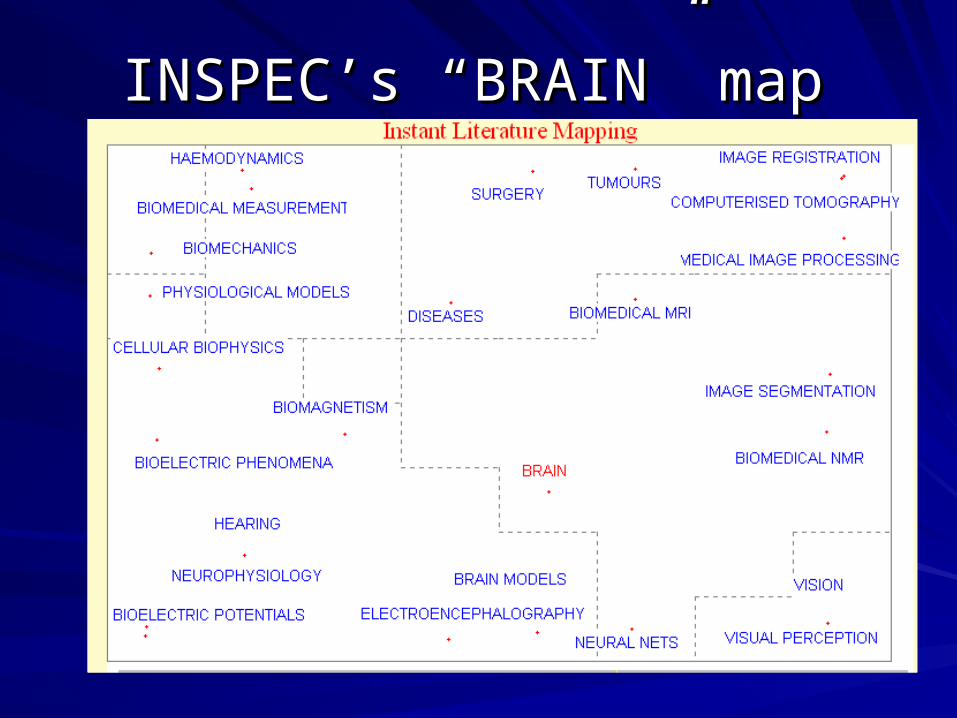
INSPEC’s “BRAIN” mapINSPEC’s “BRAIN” map

讨论讨论动态概念可视图可以根据不同的数据库,不同的用途,不动态概念可视图可以根据不同的数据库,不同的用途,不同的用户需要通过电脑即使生成同的用户需要通过电脑即使生成– Concepts can be represented differently and dynamically in Concepts can be represented differently and dynamically in
different literature databases.different literature databases.– Concept representation canConcept representation can be integrated with the underlying be integrated with the underlying
information space.information space.
用户可以用互动的形式通过可视界面来学习,理解新概念用户可以用互动的形式通过可视界面来学习,理解新概念及概念之间的关系。及概念之间的关系。– Dynamic knowledge representation Dynamic knowledge representation encourages explorative encourages explorative
learninglearningIt provides an overview of what information the system has It provides an overview of what information the system has on related topics.on related topics.It supports interactive means to let user explore. It supports interactive means to let user explore.

VCE – Visual Concept ExplorerVCE – Visual Concept Explorer
VCE is a research tool created to explore VCE is a research tool created to explore – dynamic concept representation dynamic concept representation – applications of information visualization applications of information visualization – interactive Interfaces for explorative learning interactive Interfaces for explorative learning
VCE is a real-world application VCE is a real-world application – Connecting to practical literature databases. Connecting to practical literature databases. – Currently is being tested in practical librariesCurrently is being tested in practical libraries
John Hopkins Medical LibraryJohn Hopkins Medical Library
Stanford Libraries Stanford Libraries

Visual Concept Explorer Visual Concept Explorer
What’s NextWhat’s Next in IV in IV
Several significant developments on the Several significant developments on the next generation of IV applicationsnext generation of IV applications– At University of MarylandAt University of Maryland– At NIH/NSF At NIH/NSF – At National Visualization Analytics CenterAt National Visualization Analytics Center
Next Generation of IV ApplicationsNext Generation of IV Applications
Challenges of second generations of IVChallenges of second generations of IV– Systematic strategies for discovery Systematic strategies for discovery – Diverse data types: textual resources, patient Diverse data types: textual resources, patient
histories, trees, and social networkshistories, trees, and social networks– Tighter integration into organizational Tighter integration into organizational
workflows that amplify individual creativity with workflows that amplify individual creativity with the catalytic benefits of social creativitythe catalytic benefits of social creativity
Ben Shneiderman, University of Maryland Ben Shneiderman, University of Maryland
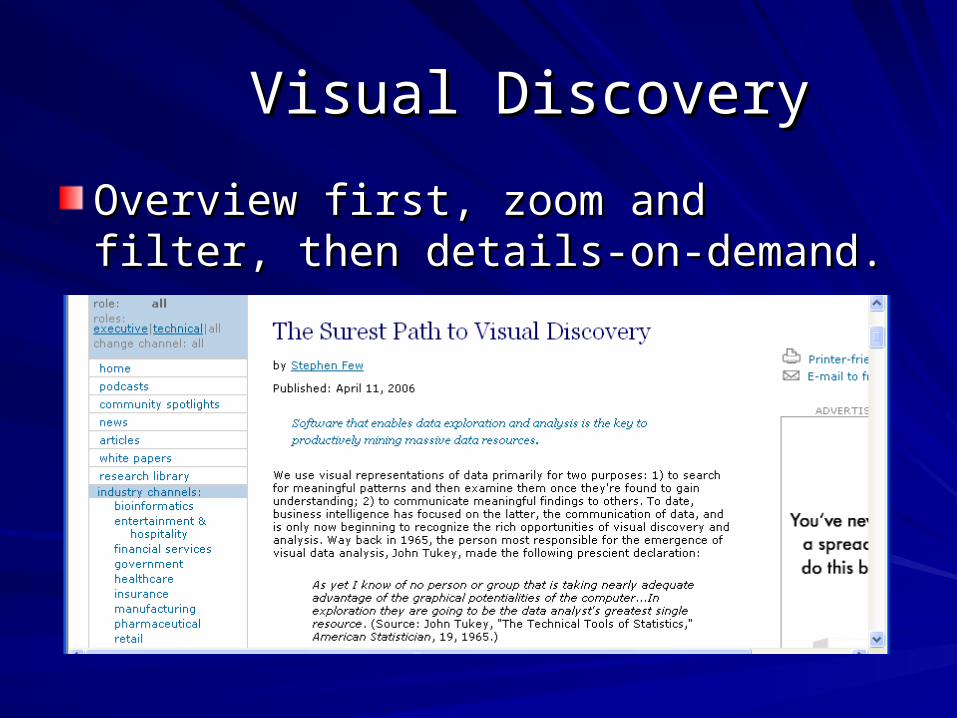
Visual DiscoveryVisual Discovery
Overview first, zoom and filter, then Overview first, zoom and filter, then details-on-demand.details-on-demand.
NIH/NSF Visualization Research NIH/NSF Visualization Research Challenges, Jan. 2006 Challenges, Jan. 2006
Principal Finding: Principal Finding: – Visualization is Visualization is indispensable to the solution of indispensable to the solution of
complex problems in every sectorcomplex problems in every sector, from traditional , from traditional medical, science and engineering domains to such medical, science and engineering domains to such key areas as financial markets, national security, and key areas as financial markets, national security, and public health.public health.
– Advances in visualization enable researchers to Advances in visualization enable researchers to analyze and understand unprecedented amounts of analyze and understand unprecedented amounts of experimental, simulated, and observational data and experimental, simulated, and observational data and through this understanding through this understanding to address problems to address problems previously deemed intractablepreviously deemed intractable or beyond imagination. or beyond imagination.
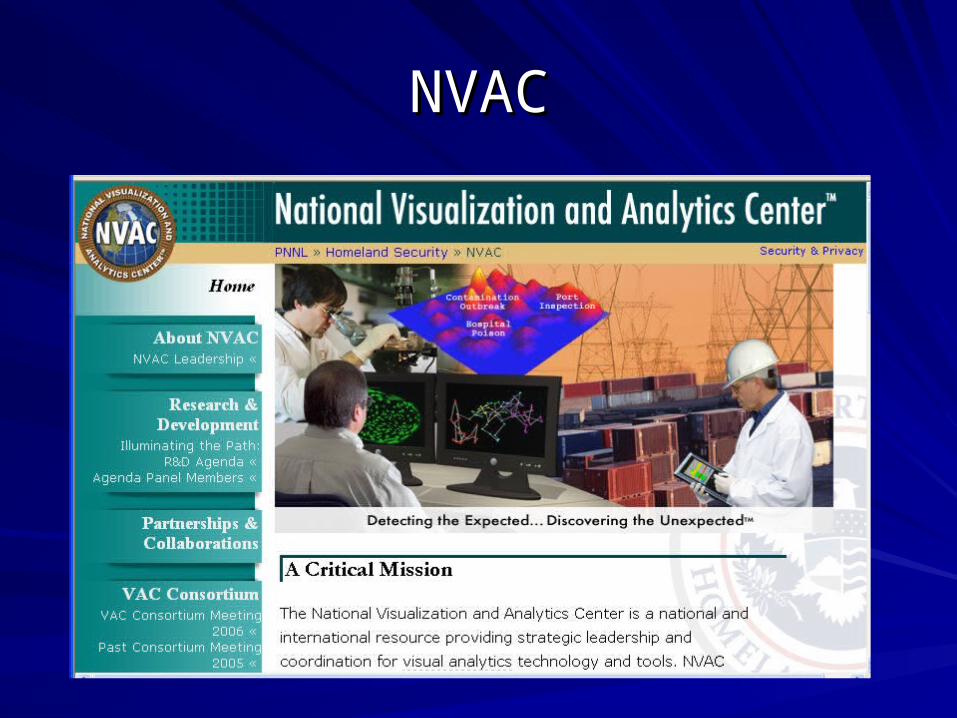
NVACNVAC
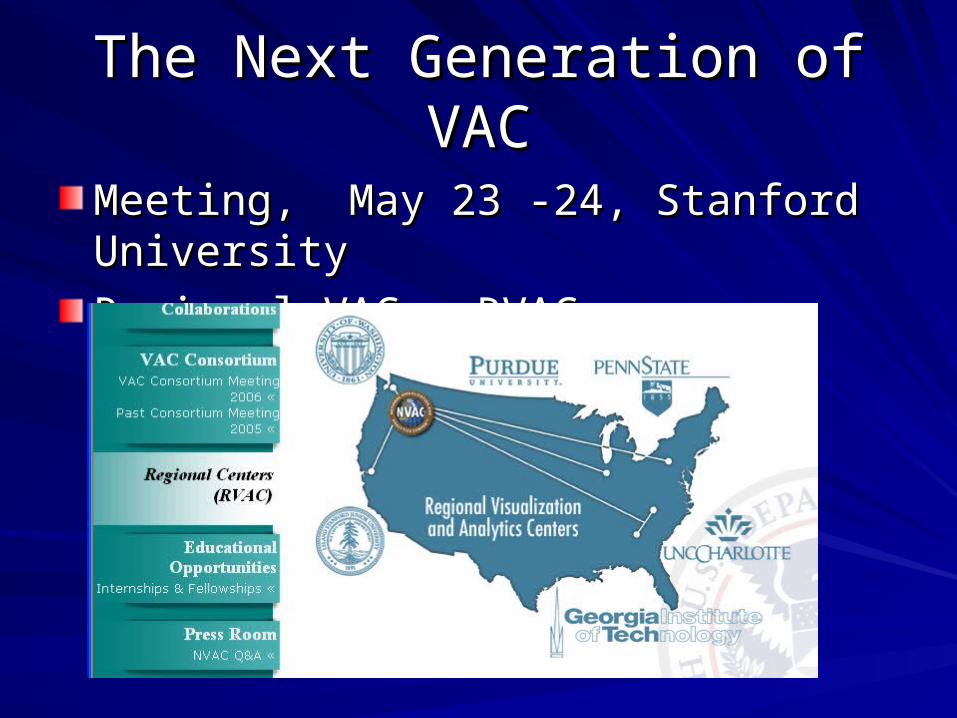
The Next Generation of VACThe Next Generation of VAC
Meeting, May 23 -24, Stanford UniversityMeeting, May 23 -24, Stanford University
Regional VAC – RVAC Regional VAC – RVAC
VASTVAST
可视分析是信息可视化的一个新的分支。可视分析是信息可视化的一个新的分支。 – Visual Analytics of Science and Technology Visual Analytics of Science and Technology
(( VAST).VAST).
可视分析年会从今年开始。 可视分析年会从今年开始。 – The first VAST conference will be hold this The first VAST conference will be hold this
October in Baltimore, Maryland. October in Baltimore, Maryland.
可视分析今后几年将吸引大量的科研投资。可视分析今后几年将吸引大量的科研投资。
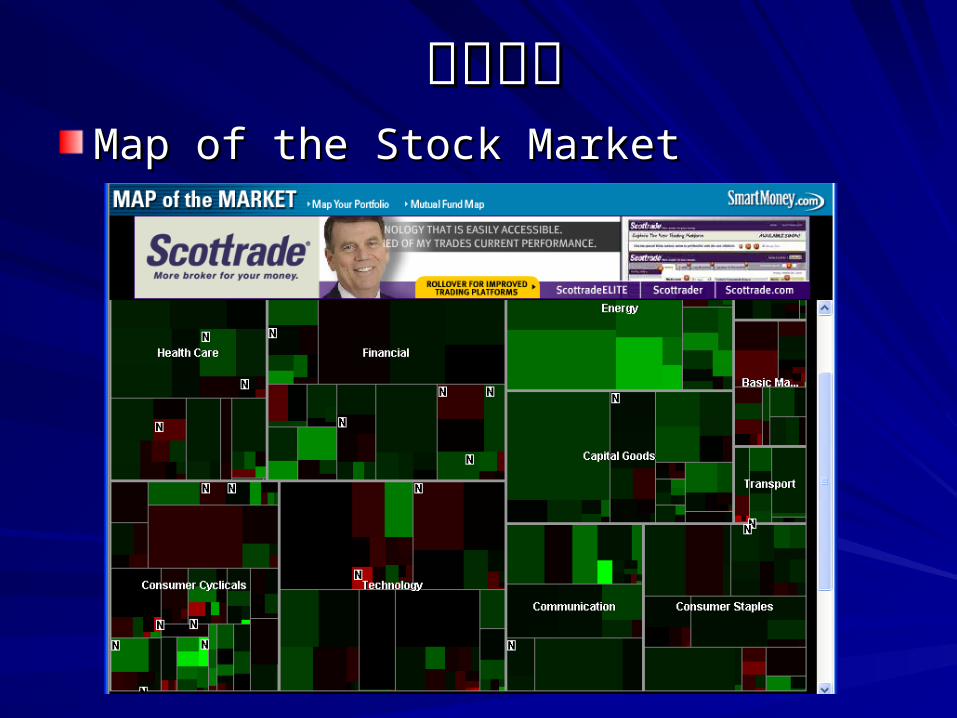
可视分析可视分析Map of the Stock Market Map of the Stock Market
ExpectationsExpectations
A new wave of IV applications is arriving.A new wave of IV applications is arriving.– Focus on information seeking, Focus on information seeking, – Focus on knowledge discoveryFocus on knowledge discovery– Focus on information analyticsFocus on information analytics– Focus on integrated solutions.Focus on integrated solutions.

IV Development Tools IV Development Tools
InfoVis Cyberinfrastructure – Indiana InfoVis Cyberinfrastructure – Indiana University: http://iv.slis.indiana.edu/ University: http://iv.slis.indiana.edu/ Piccolo Toolkit – University of Maryland: Piccolo Toolkit – University of Maryland: http://www.cs.umd.edu/hcil/piccolo/ http://www.cs.umd.edu/hcil/piccolo/ the prefuse visualization toolkit: the prefuse visualization toolkit: http://prefuse.sourceforge.net/ http://prefuse.sourceforge.net/ The visualization toolkit: The visualization toolkit: http://public.kitware.com/VTK/ http://public.kitware.com/VTK/ OpenDX: http://www.opendx.org/ OpenDX: http://www.opendx.org/

http://iv.slis.indiana.edu/http://iv.slis.indiana.edu/