Embed Size (px)
Citation preview
�������������� ������ ������� � ���� � ������ � ���� � ���
���������� �� �� �� � ���� ������ ������ � � �� � ����� � �������� �� � ���� � �������� ��� ������
������ ���� ��!�" �������#���� $%&'(� �)��*��� ����
���������� ������������������������������� ���������������������������������� ������ � ����� ��� �� �������������!
��"�#��$�%��&��'(��'()(*+�,��$�%��������!)����-� $���.���"��"���� $�����.���"��"���� ����.���"��"���� �� ���.���"��"��
�+,-&�.-/!� �� �"#��#����$#� ���#�����������#� ���%%���������� �� �&#�#�����$� ���'��� �� �%�$���� �% �� � ���������"#� �(�����&&$� �� ��#� )#� �� �% �� �� � �$���� *+$,#-.�/# �+01���% )�/#2�#/."!�3�����#4�'�� �����$� ���% �����&�& �� �� �&#�#"#����� ��"&$� ��� ��#����$#� ���#$��&(����5�"��'� #�� �6$���#�&��� ��#�&�������7������8$����� �������#� ���%����� �9�#����&:������ �%���#� �� �#�( �$�$��'��# ��%�� �#�� �������������$�� 9��#��#���� ��� %�� ��� $���� �% � � � ) �� ��� #����$#� �� �%%���� ����� ����#� �� ��� �����$� �� �%����� �� �&#�#�7���&����#�� ����� ����� ������/% ���� ��������"#�$��&�'��/%#����18$#� ��%#����4 "#� ��� �#��& %��� ��� ���� �#� �� �� � ��% � �� &#�# 1���% )�/# 2�#/." !�3� �����4�'���� %�����%%��� �������% ������/ % ���� ����� �� ���&��� ��"#���%����&�;��$������� ��&%����� �� ���&��� ���#��(#� �%��#� �#� ����� ������/% ���� ������#�&#�#�<���� ����#� ������� �� �� ����% �� �� �����"#�������%�������� �� �&#�#���*+$,#-.�/#�+0�3� �#� ���% ������/% ���� ��� �� % �#���� ����#��&����� �� ������$� ���"� ����#(��&��� �������#� ���%���:������ �%���#� ��" ������#��$�#���
�%(0�&1,/�� �� ������$� ���#����$#� ��� ������/% ���� ���/%#����
��
����������
Detailed geological interpretation depends on seismic data resolution. Attenuation ofhigher seismic frequencies increases with depth. The consequence of this phenomenon is the de-crease in seismic resolution (comp. Wang 2008). The high influence of seismic attenuation was
���=>>&?�&� ����>���@ � >�����������������
� A�2�.��2�B �����C�/ �D�+���2�E �����
observed during the acquisition of the seismic survey *+$,#-.�/#�+0 (Geofizyka Kraków S.A.2010). This project was carried out in the � � ��#��#*�F��."�FC(�/ E�)����F�"�0����99� ����12�GA!�3�4 �E��#�&�7� is located in the southern-central part of the Fore-SudeticMonocline (Fig. 1). In this region, the Carboniferous basement of the Fore-Sudetic Mono-cline is covered by the Permian (Rotliegendes and Zechstein) and the Triassic strata(2F#� H�/ �E�������I4�'��# ��%����� �� ��$����*+$,#-.�/#�+0"#��� ����9� �#������� �ly layered (from the seismic point of view) structure of the Zechstein forma-tion. The recorded seismic data are characterized by a frequency decline with depth (Decet al. 2011). One of the possible reasons for this phenomenon can be the high seismic atten-uation, caused by the Lower Triassic Buntsandstein sandstones, which rest above the Zech-stein formation.
The aim of this paper is to present a multi-stage algorithm for the purpose of mini-mizing the attenuation effect, hence increasing the resolution of the seismic data in theZechtstein area. In order to achieve this, the inverse Q filtering process was used, the effi-ciency of which was tested by the use of seismic modeling.
� �������� � ����
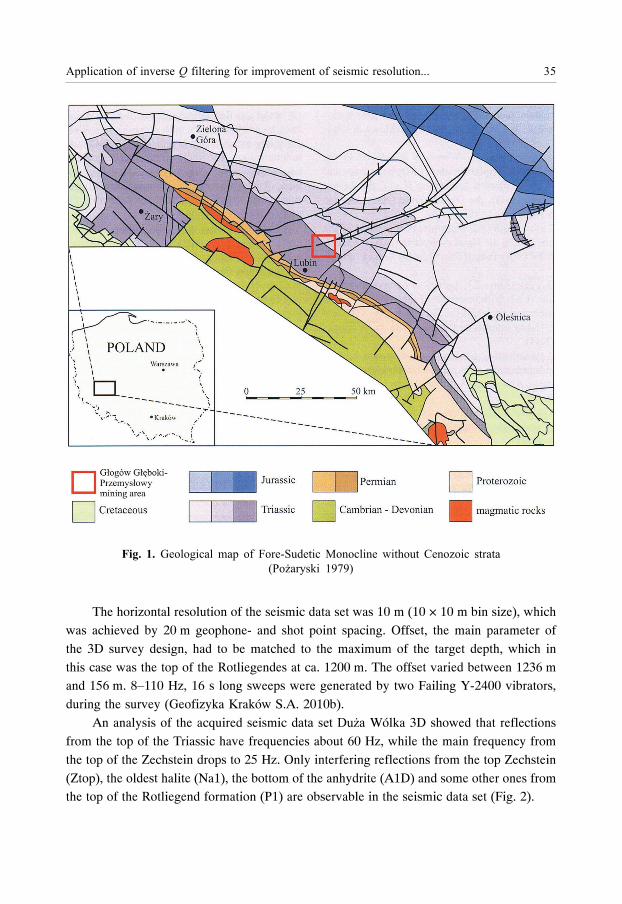
Within the study area, the Rotliegendes and the Zechstein formations overlay foldedCarboniferous formations. The Rotliegendes is developed as brown-red sandstones.The most detailed information about:������ � �*�F��."�FC(�/ E�)����F�"�0� � ��#��#�"#���� &�&(����"���!9 ��3�'���# ��(J��� ���%�� �"���"#���determinethe vertical variation of the petrophysical parameters (Geofizyka Kraków S.A. 2010c).Based on the S-421A well-logging, four Zechstein cyclothems were identified. The first,Werra cyclothem is developed as the Copper Shale (0.8 m), the Zechstein Limestone Ca1(10 m), the Lower Werra Anhydrite A1D (85 m), the Oldest Halite Na1 (42 m), andthe Upper Werra Anhydrite A1G (48 m). The second � Strassfurt cyclothem is composedof the Main Dolomite Ca2 (18 m) and the Basal Anhydrite A2 (19 m). The third, Leinecyclothem is developed as the Anhydrite A3 (33 m) and the Grey Salt Clay I3 (2 m).The Aller cyclothem is composed of Brown-red shales I4 (5 m), the Pegmatite Anhydrite A4(3 m) and the Transitional Claystone Ip (14 m)� 7� ��� *�F��."�FC(�/ E�)����F�"�0� � ��#��#���!��#��%$���5� ��#�&3��������������each are relatively thin, circa 100 me-ters in total, while the Werra cyclothem is ca. 180 meters thick. The Mesozoic strataare composed of the Buntsandstein sandstones and the Muschelkalk limestones, which arecovered by the Cenozoic sediments with brow���#���#�12F#� H�/ �E���� 1996).
� ����� ���� ��2�������
To investigate the geological structure of the study area (1 km2 target area), a 3D seis-mic survey was acquired by Geofizyka Kraków S.A. (Fig. 1).
3� �#� ���% ������/% ���� ��%�� ����������%�� �� ������$� ����� �K
��34 54������ �#��# �% <���9!$&�� �A����� �� " ���$� B���)� � ���#�#1E�,#���/ ��@�4
The horizontal resolution of the seismic data set was 10 m (10 × 10 m bin size), whichwas achieved by 20 m geophone- and shot point spacing. Offset, the main parameter ofthe 3D survey design, had to be matched to the maximum of the target depth, which inthis case was the top of the Rotliegendes at ca. 1200 m. The offset varied between 1236 mand 156 m. 8�110 Hz, 16 s long sweeps were generated by two Failing Y-2400 vibrators,during the survey (Geofizyka Kraków S.A. 2010b).
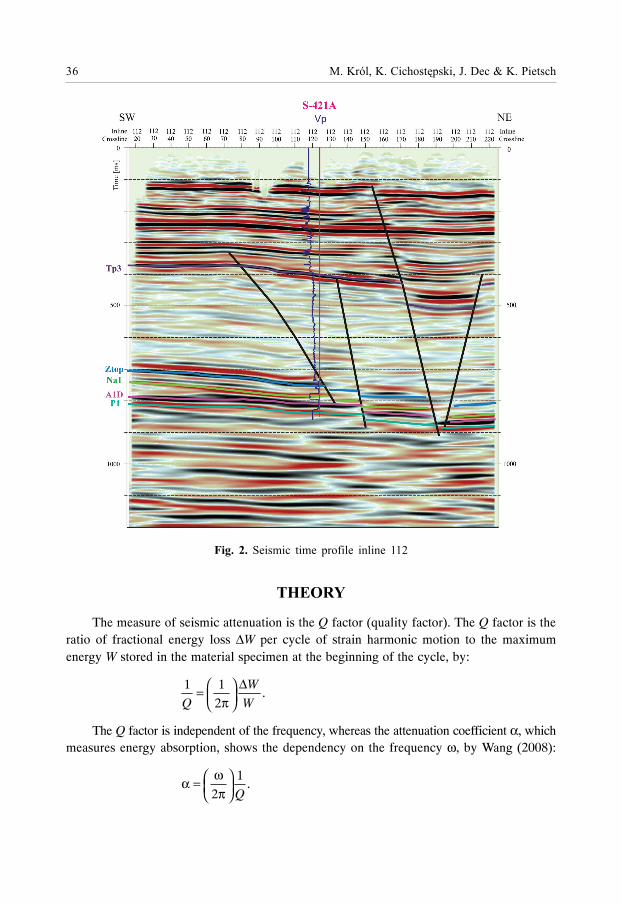
An analysis of the acquired seismic &#�#���+$,# Wólka 3D showed that reflectionsfrom the top of the Triassic have frequencies about 60 Hz, while the main frequency fromthe top of the Zechstein drops to 25 Hz. Only interfering reflections from the top Zechstein(Ztop), the oldest halite (Na1), the bottom of the anhydrite (A1D) and some other ones fromthe top of the Rotliegend formation (P1) are observable in the seismic data set (Fig. 2).
�� ��������� ������������� �������� �
��34 64������ ���� ������ ����� ���
�� ��7
The measure of seismic attenuation is the Q factor (quality factor). The Q factor is theratio of fractional energy loss ΔW per cycle of strain harmonic motion to the maximumenergy W stored in the material specimen at the beginning of the cycle, by:
1 1.
2
W
Q W
Δ⎛ ⎞= ⎜ ⎟π⎝ ⎠
The Q factor is independent of the frequency, whereas the attenuation coefficient α, whichmeasures energy absorption, shows the dependency on the frequency ω, by Wang (2008):
1.
2 Q
ω⎛ ⎞α = ⎜ ⎟π⎝ ⎠
��� !��������"������������#��������"������������� ����$������� �%
It can be concluded that the high value of the quality factor Q means small attenuation.The high frequencies are attenuated more than the low ones.
Based on laboratory measurements of P-wave attenuation, the following conclusioncan be made (Jarzyna 1999):
& "!���$��� ���!"�������'�($!��)�! ������*��!�!��#�"!$����������������!�+�!�+��������!�������!�!�+�����!���������#!��!�$�!��+�!�+������L
& �����#����"!$�����! �����! ���"�+������� �)+�)�� ���'�����$)�!�$�!��+�� ��!�+�����!���������!���!)�!�$�!��+�� ��L
& ($!��) �! ���� !� ,� $��+ �� +���������!�� �$�+� ���!���+ �� ��� �� � ����� !�+��������#)�
The influence of the anelastic attenuation on the seismic section can be computedby the Norsar 2D Ray Modelling software (Norsar 2012). The following formula is used forthe calculation:
( ) /( ) ,k kf T QQC f e− Π=
where:CQ & attenuation coefficient for frequency f,Qk & quality factor in the block corresponding to ray segment no. k,Tk & is the travel time for ray segment no. k.
This is frequency dependent attenuation formula: “The attenuation is a multiplicativefactor in each block (ray segment), and the total attenuation effect along the ray is obtainedby the product of CQ’s for all ray segments. In the seismogram generation the total attenua-tion effect is included by Fourier transforming the seismic signal to the frequency domain,multiplying the spectrum by CQ( f ), and transforming the signal back to time. This processwill change the frequency content in the signal and consequently we obtain a change inthe shape of the signal” (Norsar 2012). Inverse Q filtering is a seismic data processing procedurethat compensates for the energy absorption and corrects the wavelet distortion in termsof shape and timing. In consequence, this improves vertical seismic resolution (Wang 2008).
Inverse Q filtering is based on the assumption that the attenuation coefficient isa linear function of the frequency. It is a multistage process in which accurate estimationof Q factor is crucial (Tonn 1989).
In this paper, for Q factor estimation, the authors used the spectral ratio method (Hauge1981) based on vertical seismic profiling (VSP). Other authors such as Dasgupta & Clark(1988) describe the method of estimation of Q directly from the surface seismic data.However, it is difficult to provide proper Q values due to the influence of different factorsrelated to data acquisition. Not only Wang (2008) but also Bardi and Mooney (1987), con-cluded that the Q values of calculated spectral ratio methods are more appropriate thanthose calculated by other methods. Blias (2011) suggested new method based on optimiza-tion approach to Q factor estimation, which is more accurate then spectral ratio method, butit requires further testing.
�M ��������� ������������� �������� �
� ��������7
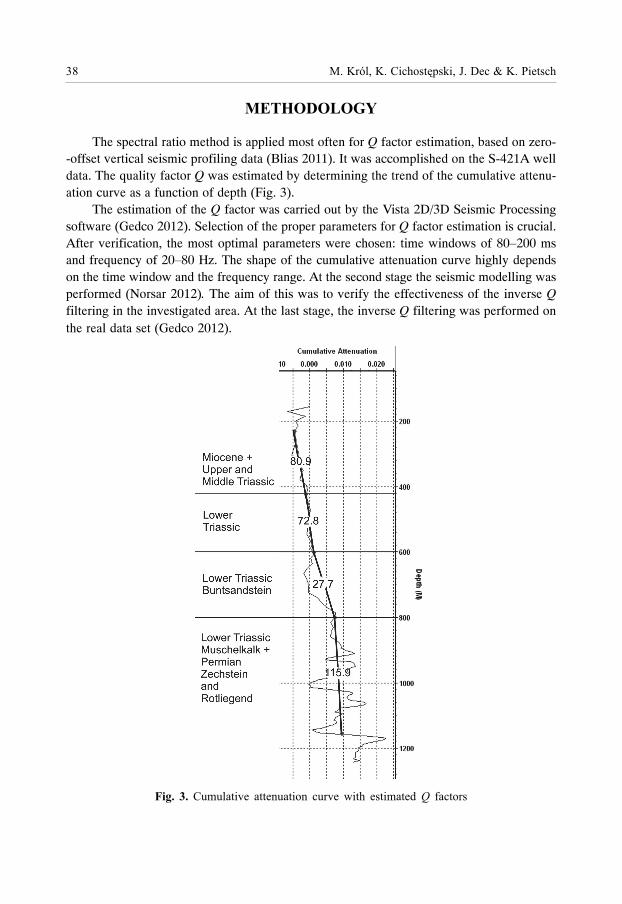
The spectral ratio method is applied most often for Q factor estimation, based on zero--offset vertical seismic profiling data (Blias 2011). It was accomplished on the S-421A welldata. The quality factor Q was estimated by determining the trend of the cumulative attenu-ation curve as a function of depth (Fig. 3).
The estimation of the Q factor was carried out by the Vista 2D/3D Seismic Processingsoftware (Gedco 2012). Selection of the proper parameters for Q factor estimation is crucial.After verification, the most optimal parameters were chosen: time windows of 80&200 msand frequency of 20&80 Hz. The shape of the cumulative attenuation curve highly dependson the time window and the frequency range. At the second stage the seismic modelling wasperformed (Norsar 2012). The aim of this was to verify the effectiveness of the inverse Qfiltering in the investigated area. At the last stage, the inverse Q filtering was performed onthe real data set (Gedco 2012).
��34 84�$�$!��"� !����$!���� $�"�'��� �����!��+� �! ����
��� !��������"������������#��������"������������� ����$������� �-
� ����� ��� ����
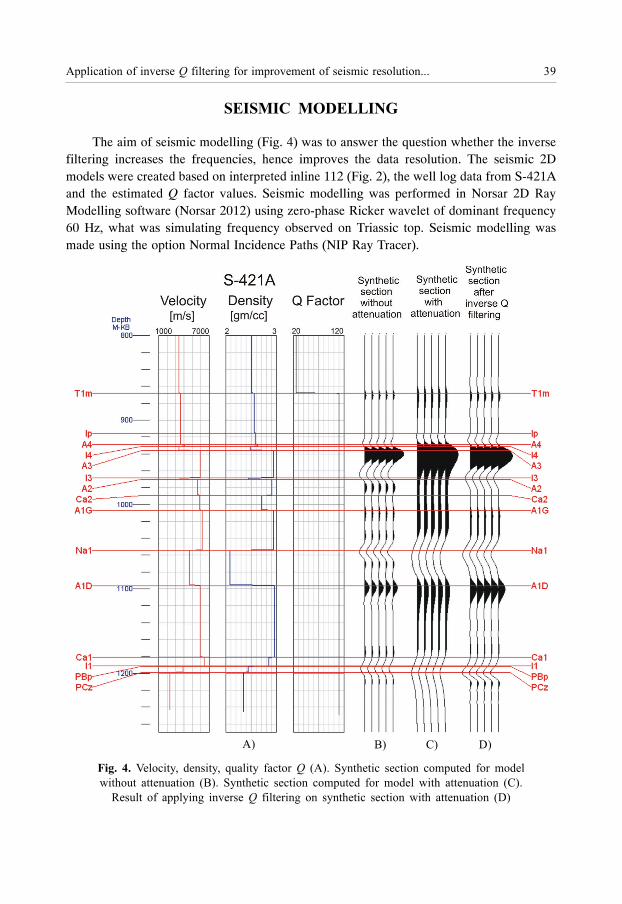
The aim of seismic modelling (Fig. 4) was to answer the question whether the inversefiltering increases the frequencies, hence improves the data resolution. The seismic 2Dmodels were created based on interpreted inline 112 (Fig. 2), the well log data from S-421Aand the estimated Q factor values. Seismic modelling was performed in Norsar 2D RayModelling software (Norsar 2012) using zero-phase Ricker wavelet of dominant frequency60 Hz, what was simulating frequency observed on Triassic top. Seismic modelling wasmade using the option Normal Incidence Paths (NIP Ray Tracer).
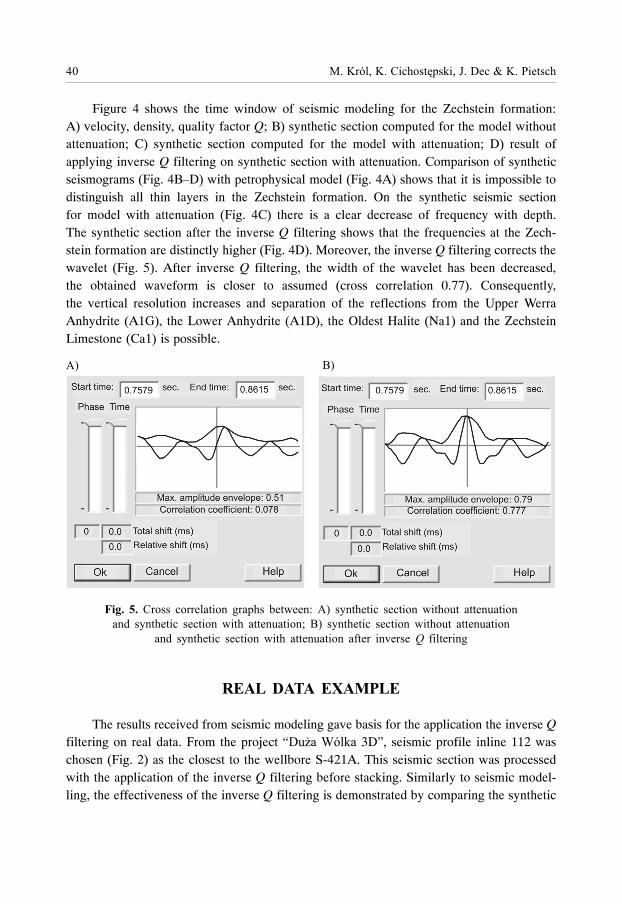
��34 94.�� ��) +�����) ($!��) �! ����� / 0��)������ �� ���� ���$��+ �����+�'����$� !����$!���� /10��)������ �� ���� ���$��+ �����+�'��� !����$!���� /�0�2��$� �� !��)��# ��"����� �������# �� �)������ �� ����'��� !����$!���� /�0
0 10 �0 �0
34 ��������� ������������� �������� �
Figure 4 shows the time window of seismic modeling for the Zechstein formation:A) velocity, density, quality factor Q; B) synthetic section computed for the model withoutattenuation; C) synthetic section computed for the model with attenuation; D) result ofapplying inverse Q filtering on synthetic section with attenuation. Comparison of syntheticseismograms (Fig. 4B&D) with petrophysical model (Fig. 4A) shows that it is impossible todistinguish all thin layers in the Zechstein formation. On the synthetic seismic sectionfor model with attenuation (Fig. 4C) there is a clear decrease of frequency with depth.The synthetic section after the inverse Q filtering shows that the frequencies at the Zech-stein formation are distinctly higher (Fig. 4D). Moreover, the inverse Q filtering corrects thewavelet (Fig. 5). After inverse Q filtering, the width of the wavelet has been decreased,the obtained waveform is closer to assumed (cross correlation 0.77). Consequently,the vertical resolution increases and separation of the reflections from the Upper WerraAnhydrite (A1G), the Lower Anhydrite (A1D), the Oldest Halite (Na1) and the ZechsteinLimestone (Ca1) is possible.
��34 :4����� ����!���� #�!��� ,��'���5 0 �)������ �� ����'����$� !����$!����!�+ �)������ �� ����'��� !����$!����L10 �)������ �� ����'����$� !����$!����
!�+ �)������ �� ����'��� !����$!���� !���� ��"����� �������#
� �� ���� ;����
The results received from seismic modeling gave basis for the application the inverse Qfiltering on real data. From the project “�$6!7��! 3D”, seismic profile inline 112 waschosen (Fig. 2) as the closest to the wellbore S-421A. This seismic section was processedwith the application of the inverse Q filtering before stacking. Similarly to seismic model-ling, the effectiveness of the inverse Q filtering is demonstrated by comparing the synthetic
0 10
��� !��������"������������#��������"������������� ����$������� 3�
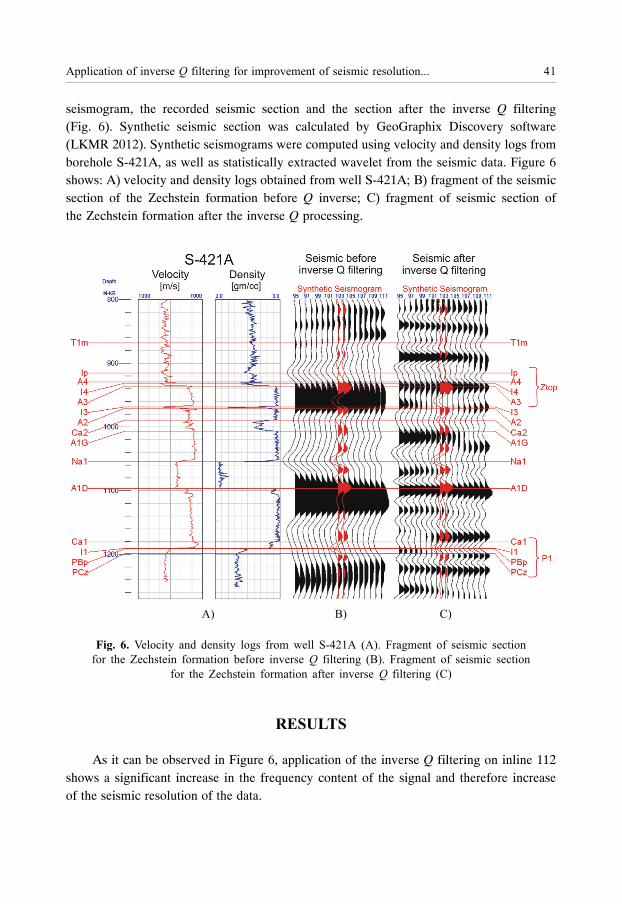
seismogram, the recorded seismic section and the section after the inverse Q filtering(Fig. 6). Synthetic seismic section was calculated by GeoGraphix Discovery software(LKMR 2012). Synthetic seismograms were computed using velocity and density logs fromborehole S-421A, as well as statistically extracted wavelet from the seismic data. Figure 6shows: A) velocity and density logs obtained from well S-421A; B) fragment of the seismicsection of the Zechstein formation before Q inverse; C) fragment of seismic section ofthe Zechstein formation after the inverse Q processing.
��34 <4.�� ��) !�+ +�����) �#� ����'��83�� / 0�9�!#���� �� ������ �� ������� ���:� ������ ����!���� ,����� ��"����� �������# /10�9�!#���� �� ������ �� ����
��� ���:� ������ ����!���� !���� ��"����� �������# /�0
� �����
As it can be observed in Figure 6, application of the inverse Q filtering on inline 112shows a significant increase in the frequency content of the signal and therefore increaseof the seismic resolution of the data.
0 10 �0
�� ����������� ��������� ��������������� �����
As a result of application of this procedure it is possible to distinguish the followingZechstein layers: Ztop � interfered signal contains reflection form the Transitional Claystone(Ip), the Pegmatite Anhydrite (A4), the Brown-red Shale (I4) and the Main Anhydrite (A3);positive reflection form the Basal Anhydrite (A2); negative reflection form the Main Do-lomite (Ca2); negative reflection form the Oldest Halite (Na1); positive reflection formthe Lower Anhydrite (A1D); P1 – interfered negative signal contains reflections from theZechstein Limestone (Ca1), the Copper Shale (I1), the Weissliegend (PBp) and the top ofthe Rotliegend (PCz).
����������
Because of the low resolution of the acquired seismic data, Dec et al. (2011) distin-guished only three interfered reflections within the Zechstein formation. As it is observedon Figure 6B, they are represented only by two positive and one negative events. The firstof them was interpreted as the Zechstein top (Ztop), which contains signal from the Transi-tional Claystone (Ip), the Pegmatite Anhydrite (A4), the Brown-red Shale (I4) and the MainAnhydrite (A3). The second positive reflection is from the Lower Anhydrite (A1D).The negative reflection corresponds to the Oldest Halite (Na1). Application of inverse Q filteringenhanced the vertical resolution, therefore reflections from other Zechstein layers could beidentified. Additionally, there are some events observed from: the Basal Anhydrite A2, MainDolomite Ca2, the Upper Werra Anhydrite A1G and the Zechstein Limestone Ca1. Therefore,identification of seismic horizons may become more accurate. In the light of the obtainedresults, the authors recommend reprocessing of the seismic data set with the application ofinverse Q�� ��� ����� �������� ���������� ����������!��"�� �#� �$ ��%�&'��(ólka” survey.
���������
The presented results demonstrate the usefulness of the inverse Q filtering as a tool forimproving the resolution of the seismic data set. Some general and significant conclusionsare worthy of note:
� �)�������� ��� ��� ������������� �$ ������ �������*&��� ���+� ������&��� �������� ��
�������)��� �������&� ���
� ��������� ��� ������ �)�������� ��� ���� ���������� ����������,������ �����$�� �������-�
����+ ���-���������&���.�
/ � ���������� ������������� � ���0�����1����/��. � ���/����� �����$ �������
����2�����(�����/��. � ���/34���� �����,������ ��" $�5��������3�����-�� �� ��& ��� �
(���� �� �)���$���� $��������� ������ ��� ���$� ���� -����$ ��� ���� 6�� ���� � 7�38� ���� -�
������ �� �
��� !��������"����/�������#��������"������������� ����$������� 3�
� � � � �
Bardi M. & Mooney H.M., 1987. Q measurements from compressional seismic wavesin unconsolidated sediments. Geophysics, 52, 772&784.
Blias E., 2011. Optimization Approach to Q-factor Estimate from VSP Data. 73rd EAGEConference & Exhibition incorporating SPE EUROPEC 2011, Vienna, 23&26 May2011.
Dasgupta R. & Clark R., 1998. Estimation of Q from surface seismic reflection data. Geo-physics, 63, 288&290.
Dec J., Pietsch K. & Marzec P., 2011. Application of seismic methods to identify potentialgas concentration zones at the Zechstein Limstone level in the “Rudna” mining area,SW Poland. Annales Societatis Geologorum Poloniae, 81, 63&78.
=����>)�! ��!��' �� � �4�4!� �$��� ��0�� %���$1%� 2���3� �0����&������ �� � 4S0����&�� 2������� ��%��&�����%� �5�� 61�$�� ' � Archiwum �=?� ����!���+O�� �[unpublished report].
=����>)�!��!��'�� � �4�4,� ����%�&����� $�3��%� &� ����� ����%����� �� 4 �5�61�$��' �Archiwum �=?�����!���+O�� �[unpublished report].
=����>)�! ��!��' �� � �4�4 � 7�����%���� %���$1%� 2���3� �0���$�� � %���%0 4S-421A. Archiwum �=?�����!���+O�� �[unpublished report].
GeoGraphix Discovery Manual, 2009. LMKR, Dubai.Hauge P.S., Measurements of attenuation from vertical seismic profiles. Geophysics, 62,
1548&1558.Jarzyna J., 1999. Determination of attenuation of elastic waves in rock medium from inter-
pretation of acoustic full wavetrains. Geofizyka w Geologii, Górnictwie i Ochronie8rodowiska: V Konferencja Naukowo-Techniczna Jubileusz 50-lecia NauczaniaGeofizyki w Akademii Górniczo-Hutniczej, Kraków 23 czerwca 1999, Akademia Gór-niczo-Hutnicza7)+>�!@=���#��=����>)���P ����)Q��+�'���!:!�@!+=����>)8����!��'.
�@!� �A��� �. & Peryt T.M., 1996. Budowa geologiczna Monokliny Przedsudeckiej. [in:]������>)A��� �/�+�0#����������,��#�����$��#��9��"�", Lublin, 69&77.
Norsar 2D Ray Modelling Manual, 2012. Norsar, Kjeller.��6!�)���7��-%-�Mapa �������&�������$����$��01%��:��������;-((( 000. Wydawnict-
wa Geologiczne, Warszawa.Tonn R., 1989. Comparison of seven methods for computation of Q. Physics of the Earth
and Planetary Interiors, 55, 259&268.Wang Y., 2008. Seismic Inverse Q Filtering. Blackwell Publishing, Oxford.Vista 2D/3D Seismic Processing 12 Manual, 2012. Gedco, Calgary.

33 ��������� ������������� �������� �