Embed Size (px)
Citation preview
������������������� ��
��������� ������ ������������������ ������������ ������������
������������������� ��
��������� ������ ������������������ ������������ ������������
�����������

Numerical Modelling of Experimental Tests on Cylindrical Masonry Specimens
Erasmus Mundus Programme
ADVANCED MASTERS IN STRUCTURAL ANALYSIS OF MONUMENTS AND HISTORICAL CONSTRUCTIONS i
DECLARATION
Name: Chandan Chinnagiri Gowda
Email: [email protected]
Title of the
Msc Dissertation:
Numerical Modelling of Experimental Tests on Cylindrical Masonry
Specimens
Supervisor(s): Prof. Luca Pelà
Prof. Pere Roca
Year: 2013/2014
I hereby declare that all information in this document has been obtained and presented in
accordance with academic rules and ethical conduct. I also declare that, as required by these
rules and conduct, I have fully cited and referenced all material and results that are not
original to this work.
I hereby declare that the MSc Consortium responsible for the Advanced Masters in Structural
Analysis of Monuments and Historical Constructions is allowed to store and make available
electronically the present MSc Dissertation.
University: Technical University of Catalonia, Spain
Date: 15/07/2014
Signature: ___________________________

Numerical Modelling of Experimental Tests on Cylindrical Masonry Specimens
Erasmus Mundus Programme
ii ADVANCED MASTERS IN STRUCTURAL ANALYSIS OF MONUMENTS AND HISTORICAL CONSTRUCTIONS
Numerical Modelling of Experimental Tests on Cylindrical Masonry Specimens
Erasmus Mundus Programme
ADVANCED MASTERS IN STRUCTURAL ANALYSIS OF MONUMENTS AND HISTORICAL CONSTRUCTIONS iii
ACKNOWLEDGEMENTS
First and foremost I offer my sincerest gratitude to my supervisors, Prof. Luca Pelà and Prof.
Pere Roca, who have supported me throughout my thesis with their patience and knowledge. I
attribute the level of my Master’s degree to their encouragement and effort, and without them
the thesis would not have been completed. I could not wish for better or friendlier supervisors.
I thank all the laboratory technicians who have helped me with my experimental campaign
carried for a short period of time.
I gratefully acknowledge the support of Savvas Saloustros throughout my thesis. Also Elisa
Canella, Lucia Garijo and Tasos Drougkas for their valuable feedback at times.
I am also thankful to all the professors from University of Minho, Portugal and Technical
University of Catalonia, Spain for sharing their knowledge during the course.
My heartfelt thanks to my fellow classmates and friends who made this degree a lot more
memorable and fun filled.
Finally I thank my parents, sister and brother for their support and encouragement throughout
in all possible ways.

Numerical Modelling of Experimental Tests on Cylindrical Masonry Specimens
Erasmus Mundus Programme
iv ADVANCED MASTERS IN STRUCTURAL ANALYSIS OF MONUMENTS AND HISTORICAL CONSTRUCTIONS
Numerical Modelling of Experimental Tests on Cylindrical Masonry Specimens
Erasmus Mundus Programme
ADVANCED MASTERS IN STRUCTURAL ANALYSIS OF MONUMENTS AND HISTORICAL CONSTRUCTIONS v
ABSTRACT
The main objective of this study is to carry out numerical modelling of laboratory destructive
tests on small cylindrical masonry specimens. The extraction of cores is a useful technique for
the mechanical characterization of existing masonry, since it moderately damages the
structure. It is possible to extract cores including four brick pieces, with two horizontal joints
and a vertical joint, or cores with three brick pieces and two horizontal joints. The extracted
cylinders can be subjected to or compression test. The correct interpretation of the results of
the test is not easy due to the limited availability of experimental results. Numerical
modelling can complement the experimental activity and help to understand the complex
interaction among the masonry components.
An effort on this is carried out using a Continuum Damage Mechanics constitutive model
with split in tensors, in tension and compression. The failure criterion in tension is defined
according to Mohr-Coulomb and in compression according to Rui Faria (similar to Drucker-
Prager).
The results of linear, non-linear analysis and experimental testing, along with their
comparison confirms that the failure is mainly due to tension in brick. An explanation
regarding the damage evolution and the contribution of area below the loaded cap of the
specimen is discussed. The results of sensitivity analysis reveal that compressive strength of
mortar and the tensile strength of brick have more influence on compressive strength of
masonry with respect to other mechanical parameters. Finally, an attempt to relate the
compressive strength of the cylindrical specimens to that of standard stack prism is proposed.

Numerical Modelling of Experimental Tests on Cylindrical Masonry Specimens
Erasmus Mundus Programme
vi ADVANCED MASTERS IN STRUCTURAL ANALYSIS OF MONUMENTS AND HISTORICAL CONSTRUCTIONS
Numerical Modelling of Experimental Tests on Cylindrical Masonry Specimens
Erasmus Mundus Programme
ADVANCED MASTERS IN STRUCTURAL ANALYSIS OF MONUMENTS AND HISTORICAL CONSTRUCTIONS vii
RESUMEN
Titulo: “Modelizacion numerica de ensayos experimentales en testigos cilindricos de obra de
fabrica”
El principal objetivo de este estudio es llevar a cabo el modelo numérico de los resultados
obtenidos en laboratorio de ensayos destructivos en pequeñas muestras cilíndricas de muros
de fábrica. La extracción de testigos es una técnica muy útil para la caracterización mecánica
de los muros de fábrica existentes, ya que no provoca daños importantes en ésta. De hecho, es
posible extraer muestras compuestas por dos ladrillos y una junta de mortero entre ellos o,
incluso de mayor dimensión incluyendo cuatro ladrillos con dos juntas horizontales y una
junta vertical, o con sólo dos juntas horizontales. Los cilindros extraídos pueden ser
sometidos a ensayos de compresion o ensayos de traccion. La correcta interpretacion de los
resultados de estos ensayos no resulta sencilla, debido a la escasa disponibilidad de datos. Así
pues, el modelo numérico puede ser un complemento a la actividad empírica para ayudar a
entender la compleja interacción entre los distintos componentes de la fábrica estudiada.
En este sentido, la labor realizada es un esfuerzo enfocado a crear un modelo constitutivo con
tensores de separación, ambos en tensión y compresión. El criterio de plasticidad en tensión
es definido de acuerdo con Mohr-Coulomb y con Rui Faria en compresión (similar al de
Drucker-Prager), donde la resistencia a compresión biaxial es tomada como 1.25 veces el
esfuerzo axial.
Los resultados de análisis lineal, no-lineal y ensayos experimentales, incluyendo
comparaciones entre ellos, confirman que la rotura es debida a la tensión en el ladrillo. Una
explicación teniendo en cuenta la evolución del daño y la contribución del área resistente es
discutida. Los resultados de un detallado análisis revelan que la resistencia a compresión del
mortero y la resistencia a tracción del ladrillo tienen más influencia en la resistencia a
compresión de la fábrica con respecto a otros parámetros mecánicos. Finalmente, se plantea
una propuesta por correlacionar la resistencia a compresión de los testigos cilíndricos con la
de los testigos prismáticos.

Numerical Modelling of Experimental Tests on Cylindrical Masonry Specimens
Erasmus Mundus Programme
viii ADVANCED MASTERS IN STRUCTURAL ANALYSIS OF MONUMENTS AND HISTORICAL CONSTRUCTIONS

Numerical Modelling of Experimental Tests on Cylindrical Masonry Specimens
Erasmus Mundus Programme
ADVANCED MASTERS IN STRUCTURAL ANALYSIS OF MONUMENTS AND HISTORICAL CONSTRUCTIONS ix
TABLE OF CONTENTS
TABLE OF CONTENTS ................................................................................................................IX
LIST OF FIGURES .......................................................................................................................XI
1. INTRODUCTION ..................................................................................................................... 1
1.1. MOTIVATION FOR NUMERICAL ANALYSIS ..................................................................... 1
1.2. OBJECTIVE AND FOCUS OF THE THESIS .......................................................................... 2
1.3. OUTLINE OF THE THESIS ................................................................................................ 3
2. STATE OF ART ....................................................................................................................... 5
2.1. INTRODUCTION ............................................................................................................. 5
2.1.1. MASONRY .............................................................................................................. 5
2.1.2. BRICK .................................................................................................................... 6
2.1.3. MORTAR ................................................................................................................ 7
2.1.4. TYPES OF MASONRY............................................................................................... 8
2.2. EXPERIMENTAL COMPRESSIVE STRENGTH DETERMINATION ........................................ 13
2.2.1. NEW MASONRY STRUCTURES ............................................................................... 13
2.2.2. OLD MASONRY STRUCTURES ............................................................................... 15
3. EXPERIMENTAL CAMPAIGN ................................................................................................ 19
3.1. INTRODUCTION ........................................................................................................... 19
3.2. CYLINDRICAL EXTRACTION ........................................................................................ 19
3.3. BRICK ......................................................................................................................... 23
3.3.1. WHOLE BRICK SPECIMENS ................................................................................... 23
3.3.2. MICRO BRICK SPECIMENS .................................................................................... 24
3.4. MORTAR ..................................................................................................................... 26
3.5. STACK PRISM .............................................................................................................. 27
3.6. THREE JOINT AND TWO JOINT CYLINDERS ................................................................... 31
4. NUMERICAL ANALYSIS ...................................................................................................... 35
4.1. INTRODUCTION ........................................................................................................... 35
4.2. CONSTITUTIVE LAW .................................................................................................... 35
4.2.1. TENSION AND COMPRESSION MODEL ................................................................... 37
4.3. BENCH MARK ANALYSIS ............................................................................................. 39
4.3.1. 2D ANALYSIS ...................................................................................................... 42
Numerical Modelling of Experimental Tests on Cylindrical Masonry Specimens
Erasmus Mundus Programme
x ADVANCED MASTERS IN STRUCTURAL ANALYSIS OF MONUMENTS AND HISTORICAL CONSTRUCTIONS
4.3.2. 3D ANALYSIS ...................................................................................................... 45
4.3.3. RESULTS AND DISCUSSION .................................................................................. 48
4.4. MODELLING OF STACK PRISM ..................................................................................... 49
4.4.1. RESULTS ............................................................................................................. 50
4.4.2. COMPARISON OF RESULTS ................................................................................... 56
5. MODELLING OF CYLINDRICAL SPECIMENS ......................................................................... 59
5.1. LINEAR ANALYSIS: THREE JOINT SPECIMEN ................................................................ 60
5.2. LINEAR ANALYSIS: TWO JOINT SPECIMEN ................................................................... 65
5.3. NON-LINEAR ANALYSIS: THREE JOINT CYLINDERS ..................................................... 68
5.4. NON-LINEAR ANALYSIS: TWO JOINT CYLINDERS ........................................................ 75
5.5. COMPARISON OF RESULTS .......................................................................................... 80
5.5.1. NON-LINEAR: THREE JOINT AND TWO JOINT CYLINDER........................................ 80
5.5.2. NUMERICAL AND EXPERIMENTAL THREE JOINT CYLINDER .................................. 83
5.5.3. NUMERICAL AND EXPERIMENTAL TWO JOINT CYLINDER ..................................... 87
5.6. FINAL REMARKS ......................................................................................................... 89
5.7. SENSITIVITY ANALYSIS RESULTS ................................................................................ 90
5.7.1. MASONRY PRISM ................................................................................................. 90
5.7.2. CYLINDRICAL SPECIMEN ..................................................................................... 92
6. CONCLUSIONS .................................................................................................................... 97
6.1. SUMMARY .................................................................................................................. 97
6.2. CONCLUSIONS ............................................................................................................ 98
6.3. SCOPE FOR FUTURE WORK .......................................................................................... 99
REFERENCES ........................................................................................................................... 101
Numerical Modelling of Experimental Tests on Cylindrical Masonry Specimens
Erasmus Mundus Programme
ADVANCED MASTERS IN STRUCTURAL ANALYSIS OF MONUMENTS AND HISTORICAL CONSTRUCTIONS xi
LIST OF FIGURES
FIGURE 2.1 DIFFERENT TYPES OF BRICKWORK ............................................................................ 5
FIGURE 2.2 DIFFERENT TYPES OF BRICK ...................................................................................... 6
FIGURE 2.3 BRICKWORK WITH (A) LIME MORTAR (B) CEMENT MORTAR ..................................... 7
FIGURE 2.4 BEHAVIOUR OF (A) MASONRY (B) UNIT AND (C) MORTAR ........................................ 9
FIGURE 2.5 FAILURE MODES OF SOLID CLAY UNITS UNDER (A) UNIAXIAL COMPRESSION (B)
UNIAXIAL TENSION (PAGE - 1981, 1983) ........................................................................... 10
FIGURE 2.6 FAILURE MODE IN SOLID CLAY UNIT UNDER BIAXIAL COMPRESSION (PAGE - 1981,
1983) ................................................................................................................................. 10
FIGURE 2.7 FAILURE MODE OF MASONRY WALL UNDER DIRECT TENSILE LOADING (BACKES
1985) (A) TYPE 1 (B) TYPE 2.............................................................................................. 11
FIGURE 2.8 FAILURE MODES OF SOLID CLAY UNITS UNDER BIAXIAL TENSION-COMPRESSION
(PAGE - 1981, 1983) .......................................................................................................... 11
FIGURE 2.9 FAILURE SURFACE FOR DIFFERENT ANGLE OF INCLINATION UNDER (A) BIAXIAL
TENSION-COMPRESSION AND (B) BIAXIAL COMPRESSION ................................................... 12
FIGURE 2.10 TESTS ON PRISMS BY PEVERINI (2014) AT UPC .................................................... 15
FIGURE 2.11 (A) CYLINDRICAL SPECIMEN WITH MORTAR ON TOP AND BOTTOM FOR TESTING (B)
SAND CONE SHAPED FAILURE ............................................................................................ 16
FIGURE 3.1 (A) BEFORE EXTRACTION (B) DURING EXTRACTION (C) AFTER EXTRACTION .......... 21
FIGURE 3.2 (A) CYLINDER IN THE MOULD & (B) FINAL SPECIMEN ............................................. 22
FIGURE 3.3 BRICKS WITH SURFACE TREATMENT (A) CAPPED & (B) POLISHED .......................... 23
FIGURE 3.4 (A) MICRO SPECIMENS OF THE BRICK & (B) EXPERIMENTAL SET UP FOR BRAZILIAN
TEST ................................................................................................................................... 24
FIGURE 3.5 EXPERIMENTAL SETUP OF MORTAR FOR DETERMINATION OF (A) FLEXURAL & (B)
COMPRESSIVE STRENGTH ................................................................................................... 27
FIGURE 3.6 FAILURE OF PRISMS (A)(A) STACK PRISM 2 & (B) STACK PRISM 3 ........................... 30
FIGURE 3.7 ((A) FINAL SPECIMEN BEFORE TESTING (B) SPECIMEN WITH LVDT’S PLACED ........ 31
FIGURE 3.8 SPECIMEN AT THE END OF THE TEST ........................................................................ 34
FIGURE 4.1 FAILURE CRITERIA FOR THE PRESENT MODEL IN TENSION AND COMPRESSION ......... 38
FIGURE 4.2 STRESS STRAIN CURVE ADOPTED BY BERTO ET AL (2005) ....................................... 40
FIGURE 4.3 MASONRY PRISM ..................................................................................................... 40
Numerical Modelling of Experimental Tests on Cylindrical Masonry Specimens
Erasmus Mundus Programme
xii ADVANCED MASTERS IN STRUCTURAL ANALYSIS OF MONUMENTS AND HISTORICAL CONSTRUCTIONS
FIGURE 4.4 2-DIMENSIONAL MESH (A) PRESENT MODEL (B) BERTO ET AL (2005) .................... 42
FIGURE 4.5 2D PLANE STRESS ANALYSIS: CONTOURS OF THE DAMAGE VARIABLE AT FAILURE (A)
& (B) COMPRESSIVE DAMAGE d OF PRESENT AND BERTO MODEL (C) & (D) TENSILE
DAMAGE d OF PRESENT AND BERTO MODEL ................................................................... 43
FIGURE 4.6 2D PLANE STRESS ANALYSIS (A) COMPRESSIVE STRESS DISTRIBUTION & (B) TENSILE
STRESS DISTRIBUTION ....................................................................................................... 44
FIGURE 4.7 3D MODEL (A) PRESENT MODEL (B) BERTO MODEL .............................................. 45
FIGURE 4.8 3D MODEL (A) & (B) COMPRESSIVE DAMAGE OF PRESENT 3D AND BERTO MODEL
(C) & (D) TENSILE DAMAGE OF PRESENT 3D AND BERTO MODEL ...................................... 46
FIGURE 4.9 3D MODEL: STRESS DISTRIBUTION AT PEAK (A) COMPRESSION & (B) TENSION ..... 47
FIGURE 4.10 3-DIMENSIONAL MESH AND MODELLED PART OF THE MASONRY PRISM ................ 50
FIGURE 4.11 TENSILE DAMAGE EVOLUTION .............................................................................. 52
FIGURE 4.12 COMPRESSIVE DAMAGE EVOLUTION OF MASONRY PRISM ..................................... 53
FIGURE 4.13 PRINCIPLE TENSILE STRESS DISTRIBUTION IN MASONRY PRISM ............................ 54
FIGURE 4.14 PRINCIPLE COMPRESSIVE STRESS DISTRIBUTION IN MASONRY PRISM ................... 55
FIGURE 4.15 VECTOR DISTRIBUTION OF STRESSES IN MASONRY PRISM..................................... 56
FIGURE 5.1 FINAL MESH OF THE THREE JOINT CYLINDRICAL SPECIMEN ..................................... 60
FIGURE 5.2 PRINCIPLE TENSILE AND PRINCIPLE COMPRESSIVE STRESS THE IN ELASTIC RANGE . 61
FIGURE 5.3 STRESS DISTRIBUTION ALONG DIFFERENT LAYERS xx (RED), yy (BLUE) AND
zz (GREEN) (A) 2D (B) 3D ................................................................................................ 61
FIGURE 5.4 STRESS DISTRIBUTION IN (A) 2D AND (B) 3D IN THE CENTER OF THE TOP BRICK & (C)
xx AND zz ALONG THE CENTRAL LINE OF TOP BRICK SURFACE, xx (RED), yy (BLUE) AND
zz (GREEN) ...................................................................................................................... 62
FIGURE 5.5 STRESS DISTRIBUTION IN (A) 2D (B) 3D IN THE CENTER OF THE TOP HORIZONTAL
MORTAR & & (C) xx AND zz ALONG THE CENTRAL LINE OF TOP MORTAR SURFACE,
xx (RED), yy (BLUE) AND zz (GREEN) ............................................................................ 63
FIGURE 5.6 STRESS DISTRIBUTION IN (A) 2D (B) 3D IN THE CENTER OF THE CYLINDER (CENTRAL
BRICK) & & (C) xx AND zz ALONG THE CENTRAL LINE OF SPECIMEN, xx (RED),
yy (BLUE) AND zz (GREEN) ............................................................................................. 65
FIGURE 5.7 PRINCIPLE (A) TENSILE & (B) COMPRESSIVE STRESS IN THE ELASTIC RANGE ........... 66
Numerical Modelling of Experimental Tests on Cylindrical Masonry Specimens
Erasmus Mundus Programme
ADVANCED MASTERS IN STRUCTURAL ANALYSIS OF MONUMENTS AND HISTORICAL CONSTRUCTIONS xiii
FIGURE 5.8 EVOLUTION OF TENSILE DAMAGE IN THREE JOINT CYLINDER (A) POINT 1 (B) POINT 2
(C) POINT 3 AND (D) POINT 4 ............................................................................................. 70
FIGURE 5.9 EVOLUTION OF COMPRESSIVE DAMAGE IN THREE JOINT CYLINDER (A) POINT 1 (B)
POINT 2 (C) POINT 3 & (D) POINT 4 .................................................................................... 71
FIGURE 5.10 PRINCIPLE TENSILE STRESS DISTRIBUTION IN THREE JOINT CYLINDER (A) POINT 1
(B) POINT 2 (C) POINT 3 & (D) POINT 4 .............................................................................. 72
FIGURE 5.11 PRINCIPLE COMPRESSIVE STRESS DISTRIBUTION IN THREE JOINT CYLINDER (A)
POINT 1 (B) POINT 2 (C) POINT 3 & (D) POINT 4 ................................................................. 74
FIGURE 5.12 VECTOR DISTRIBUTION OF STRESSES IN THREE JOINT CYLINDER AT PEAK ............. 74
FIGURE 5.13 EXPERIMENTAL FAILURE OF THREE JOINT SPECIMEN ............................................. 75
FIGURE 5.14 FINAL MESH OF TWO JOINT CYLINDRICAL SPECIMEN ............................................. 76
FIGURE 5.15 EVOLUTION OF TENSILE DAMAGE IN TWO JOINT CYLINDER (A) POINT 1 (B) POINT 2
& (C) POINT 3 .................................................................................................................... 77
FIGURE 5.16 EVOLUTION OF COMPRESSIVE DAMAGE IN THREE JOINT CYLINDER (A) POINT 1 (B)
POINT 2 & (C) POINT 3 ....................................................................................................... 78
FIGURE 5.17 PRINCIPLE TENSILE STRESS DISTRIBUTION IN TWO JOINT CYLINDER (A) POINT 1 (B)
POINT 2 & (C) POINT 3 ....................................................................................................... 78
FIGURE 5.18 PRINCIPLE COMPRESSIVE STRESS DISTRIBUTION IN TWO JOINT CYLINDER (A) POINT
1 (B) POINT 2 & (C) POINT 3 .............................................................................................. 79
FIGURE 5.19 VECTOR DISTRIBUTION OF PRINCIPLE STRESSES .................................................... 80
FIGURE 5.20 EXPERIMENTAL FAILURE OF TWO JOINT SPECIMEN ................................................ 80
FIGURE 5.21 SENSITIVITY ANALYSIS RESULTS (A) & (B) VARIATION OF TENSILE STRENGTH OF
BRICK (C) & (D) VARIATION OF COMPRESSIVE STRENGTH OF MORTAR .............................. 93
FIGURE 5.22 SENSITIVITY ANALYSIS RESULTS (A) & (B) VARIATION OF MODULUS OF ELASTICITY
OF MORTAR (C) & (D) VARIATION OF COMPRESSIVE STRENGTH OF MORTAR ...................... 95

Numerical Modelling of Experimental Tests on Cylindrical Masonry Specimens
Erasmus Mundus Programme
xiv ADVANCED MASTERS IN STRUCTURAL ANALYSIS OF MONUMENTS AND HISTORICAL CONSTRUCTIONS
LIST OF GRAPHS
GRAPH 3.1 FORCE DISPLACEMENT DIAGRAM OF STACK PRISM 1 AND 2 .................................... 29
GRAPH 3.2 LOADING AND UNLOADING CYCLE FOR STACK PRISMS............................................ 30
GRAPH 3.3 FORCE DISPLACEMENT DIAGRAM (A) THREE JOINT CYLINDERS & (B) TWO JOINT
CYLINDERS ........................................................................................................................ 32
GRAPH 4.1 2D PLANE STRESS ANALYSIS: STRESS STRAIN DIAGRAM ......................................... 44
GRAPH 4.2 3D MODEL: COMPARISON OF STRESS STRAIN DISTRIBUTION ................................... 47
GRAPH 4.3 COMPARISON OF STRESS STRAIN GRAPH BY GID AND BERTO ET AL (2005) ............ 48
GRAPH 4.4 FORCE DISPLACEMENT DIAGRAM OF MASONRY PRISM ............................................ 51
GRAPH 4.5 COMPARISON OF FORCE DISPLACEMENT DIAGRAM OF NUMERICAL ANALYSIS WITH
EXPERIMENTAL RESULTS ................................................................................................... 57
GRAPH 5.1 STRESS DISTRIBUTION IN THE INTERFACE LAYER BETWEEN MORTAR AND BRICK (A)
xx (RED), yy (BLUE) AND zz (GREEN) (B) xx (RED) & zz (GREEN) ............................... 64
GRAPH 5.2 STRESS DISTRIBUTION OF (A) xx (RED), yy (BLUE) AND zz (GREEN) IN THE
CENTRAL LINE OF THE TOP BRICK (B) xx (RED) AND zz (GREEN) ..................................... 66
GRAPH 5.3 STRESS DISTRIBUTION OF (A) xx (RED), yy (BLUE) AND zz (GREEN) IN THE
CENTRAL LINE OF THE TOP MORTAR (B) xx (RED) AND zz (GREEN) ................................. 67
GRAPH 5.4 STRESS DISTRIBUTION OF (A) xx (RED), yy (BLUE) AND zz (GREEN) AT THE
INTERFACE BETWEEN THE BRICK AND THE MORTAR (B) xx (RED) AND zz (GREEN) ......... 67
GRAPH 5.5 STRESS DISTRIBUTION OF (A) xx (RED), yy (BLUE) AND zz (GREEN) IN THE
CENTRAL LINE OF THE SPECIMEN (B) xx (RED) AND zz (GREEN) ...................................... 68
GRAPH 5.6 FORCE DISPLACEMENT GRAPH OF THREE JOINT CYLINDRICAL SPECIMEN................. 69
GRAPH 5.7 FORCE DISPLACEMENT GRAPH OF TWO JOINT CYLINDRICAL SPECIMEN ................... 76
GRAPH 5.8 COMPARISON OF FORCE DISPLACEMENT DIAGRAM OF THREE JOINT AND TWO JOINT
CYLINDER (NUMERICAL) ................................................................................................... 81
GRAPH 5.9 COMPARISON OF STRESS STRAIN DIAGRAM (A) CONSIDERING DIAMETRIC AREA (B)
CONSIDERING AREA BELOW LOADED CAP .......................................................................... 83
GRAPH 5.10 FORCE DISPLACEMENT DIAGRAM OF EXPERIMENTAL TESTS AND NUMERICAL
ANALYSIS (THREE JOINT CYLINDERS) ................................................................................ 84

Numerical Modelling of Experimental Tests on Cylindrical Masonry Specimens
Erasmus Mundus Programme
ADVANCED MASTERS IN STRUCTURAL ANALYSIS OF MONUMENTS AND HISTORICAL CONSTRUCTIONS xv
GRAPH 5.11 CORRECTED EXPERIMENTAL RESULTS ALONG WITH THE NUMERICAL RESULTS
(THREE JOINT CYLINDERS) ................................................................................................. 85
GRAPH 5.12 STRESS STRAIN DIAGRAM OF EXPERIMENTAL AND NUMERICAL (THREE JOINT
CYLINDERS), CONSIDERING (A) DIAMETRIC AREA OF CROSS SECTION & (B) AREA BELOW
THE LOADED CAP ............................................................................................................... 86
GRAPH 5.13 FORCE DISPLACEMENT DIAGRAM OF EXPERIMENTAL AND NUMERICAL ANALYSIS
(TWO JOINT CYLINDER) (A) ORIGINAL RESULTS & (B) CORRECTED RESULTS .................... 88
GRAPH 5.14 RESULTS OF SENSITIVITY ANALYSIS (A) VARIATION OF TENSILE STRENGTH OF
BRICK (B) VARIATION OF COMPRESSIVE STRENGTH OF MORTAR (C) VARIATION OF
MODULUS OF ELASTICITY OF MORTAR ............................................................................... 91
GRAPH 5.15 VARIATION OF COMPRESSIVE FRACTURE ENERGY OF MORTAR .............................. 92

Numerical Modelling of Experimental Tests on Cylindrical Masonry Specimens
Erasmus Mundus Programme
xvi ADVANCED MASTERS IN STRUCTURAL ANALYSIS OF MONUMENTS AND HISTORICAL CONSTRUCTIONS
LIST OF TABLES
TABLE 2.1 SPECIMEN SIZES FOR TESTING THE COMPRESSIVE STRENGTH OF MASONRY .............. 14
TABLE 3.1 EXPERIMENTAL RESULTS OF COMPRESSIVE STRENGTH OF BRICK ............................. 23
TABLE 3.2 FLEXURAL TEST ON WHOLE BRICK SPECIMENS ......................................................... 24
TABLE 3.3 RESULTS OF COMPRESSIVE TESTS ON BRICKS OF 35 MM DIAMETER SPECIMENS ...... 25
TABLE 3.4 RESULTS OF COMPRESSIVE TESTS ON BRICKS OF 75 MM DIAMETER SPECIMENS ...... 25
TABLE 3.5 RESULTS OF BRAZILIAN TESTS ON BRICK SPECIMENS OF 35 MM DIAMETER ............. 26
TABLE 3.6 EXPERIMENTAL RESULTS ON MORTAR FLEXURAL AND COMPRESSIVE STRENGTH .... 26
TABLE 3.7 EXPERIMENTAL RESULTS OF MORTAR ..................................................................... 27
TABLE 3.8 EXPERIMENTAL RESULTS OF THE COMPRESSIVE TEST ON STACK PRISMS .................. 28
TABLE 3.9 MODULUS OF ELASTICITY OF STACK PRIMS .............................................................. 29
TABLE 3.10 EXPERIMENTAL RESULTS OF THREE JOINT AND TWO JOINT CYLINDERS .................. 33
TABLE 3.11 YOUNG’S MODULUS FOR THREE JOINT AND TWO JOINT SPECIMENS ........................ 34
TABLE 4.1 MECHANICAL PARAMETER FOR THE PRISM .............................................................. 41
TABLE 4.2 MECHANICAL PROPERTIES OF MASONRY PRISM....................................................... 49
TABLE 4.3 DESCRIPTION OF POINTS, PRESENTED IN THE FORCE DISPLACEMENT GRAPH ............ 51
TABLE 4.4 COMPARISON OF EXPERIMENTAL AND NUMERICAL RESULTS OF MASONRY PRISM ... 57
TABLE 5.1 MECHANICAL PROPERTIES OF CYLINDRICAL THREE JOINT SPECIMEN ....................... 59
TABLE 5.2 DESCRIPTION OF POINTS, REFERRED IN THE FORCE DISPLACEMENT GRAPH OF THREE
JOINT CYLINDER ................................................................................................................ 69
TABLE 5.3 DESCRIPTION OF POINTS, REFERRED IN THE FORCE DISPLACEMENT GRAPH OF TWO
JOINT CYLINDER ................................................................................................................ 77
TABLE 5.4 COMPARISON OF THREE JOINT AND TWO JOINT NUMERICAL RESULTS ...................... 81
TABLE 5.5 COMPARISON OF MODULUS OF ELASTICITY .............................................................. 82
TABLE 5.6 RELATION BETWEEN EXPERIMENTAL AND NUMERICAL RESULTS ............................. 83
TABLE 5.7 COMPARISON OF EXPERIMENTAL AND NUMERICAL RESULTS (THREE JOINT
CYLINDERS)....................................................................................................................... 85
TABLE 5.8 COMPARISON OF EXPERIMENTAL AND NUMERICAL RESULTS OF TWO JOINT
CYLINDERS ........................................................................................................................ 88
TABLE 5.9 RELATION BETWEEN EXPERIMENTAL AND THREE JOINT NUMERICAL RESULTS ......... 89
TABLE 5.10 RELATION BETWEEN EXPERIMENTAL AND TWO JOINT NUMERICAL RESULTS .......... 89
TABLE 5.11 RELATION OF COMPRESSIVE STRENGTH OF MORTAR ON MASONRY STRENGTH ....... 91
Numerical Modelling of Experimental Tests on Cylindrical Masonry Specimens
Erasmus Mundus Programme
ADVANCED MASTERS IN STRUCTURAL ANALYSIS OF MONUMENTS AND HISTORICAL CONSTRUCTIONS xvii
TABLE 5.12 RELATION OF btf , ON COMPRESSIVE STRENGTH OF MASONRY ................................ 93
TABLE 5.13 RELATION OF mcf , ON COMPRESSIVE STRENGTH OF MASONRY ................................ 94
TABLE 5.14 RELATION OF mE ON COMPRESSIVE STRENGTH OF MASONRY ................................. 95
TABLE 5.15 RELATION OF mcG , ON COMPRESSIVE STRENGTH OF MASONRY ............................... 95


Numerical Modelling of Experimental Tests on Cylindrical Masonry Specimens
Erasmus Mundus Programme
ADVANCED MASTERS IN STRUCTURAL ANALYSIS OF MONUMENTS AND HISTORICAL CONSTRUCTIONS 1
1. INTRODUCTION
1.1. MOTIVATION FOR NUMERICAL ANALYSIS
Masonry is one of the oldest and most widely used construction techniques since ever.
Evidences of its early use date back to the Mesolithic Era (9000-8000 BC). The in-situ
availability of raw material necessary to the building process, the resistance and high
durability of masonry structures and the simplicity of the manufacturing process, are just few
of the key-factors contributing to the spread and success of this construction technique that
survived till today, being still adopted in many countries. It is widely known that the strength
of masonry structures depend, on the strength and the cohesion properties of the units. Among
all the others, the compressive strength is doubtless one of the most important parameters
describing the mechanical features of this type of constructions. As a consequence, the
determination of the compressive strength of masonry structures play a fundamental role. The
investigations and experimental works carried out may give us a brief description on how the
compressive strength can be determined, but the availability of these data is quite limited.
Moreover, no unique method is provided in order to obtain the desired value. This resulted in
the possibility to work on the development of different approaches aimed at computing the
compressive strength of masonry with sufficient reliability and accuracy. The necessity of
going beyond the available techniques and moving forward in this direction is the drive
behind the present thesis.
One of the idea being investigated in the research field, recommended by the guidelines of
UIC 778-3R (International Union of Railways), is to determine the compressive strength by
extracting cylindrical specimens and testing them in the laboratory. The extraction of
cylindrical specimens from the wall, and their subsequent testing, makes more sense in
computing the strength value, since it truly represents the material. But the challenge is in
identifying which part of the wall needs to be extracted for the testing. As a result, different
combinations of mortar joints need to be studied and the compressive strength of all the
specimens has to be checked, in order to determine the true strength of the wall.
With the purpose of validating the experimental results and understanding the stress
distribution, numerical modelling needs to be carried out. In particular, the numerical
modelling allows us to understand not only the evolution of the damage and the correspondent

Numerical Modelling of Experimental Tests on Cylindrical Masonry Specimens
Erasmus Mundus Programme
2 ADVANCED MASTERS IN STRUCTURAL ANALYSIS OF MONUMENTS AND HISTORICAL CONSTRUCTIONS
distribution of stresses, but also the failure modes involved in the process and the behavior of
units and mortar. All the parameters can be evaluated step by step. Moreover, numerical
modelling provides a complementary tool to the experimental activity and helps to understand
the complex interaction among the masonry components. In this study both the numerical
analysis and part of the experimental activity are carried out, for the purpose stated above.
Particular emphasis is given to the modelling of the cylindrical specimens, first of all
selecting the proper type of constitutive model which adequately depicts the real masonry
behavior, then comparing the available experimental results on cylindrical specimens, bricks
and mortars, and finally discussing the results.
1.2. OBJECTIVE AND FOCUS OF THE THESIS
The main objective of the thesis is numerical modelling of cylindrical masonry specimens to
determine the compressive strength. The results from the experimental campaign are
modelled using a pre-post processor called GiD and a finite element software called COMET
(Cervera et al. 2002), both developed at the International center of Numerical Methods in
Engineering (CIMNE, Barcelona, Spain). The concept is based on a new promising technique
to determine the compressive strength of existing structures, by extracting cylindrical
specimens, according to the guidelines of UIC 778-3R formed by the International Union of
Railways.
The work involves modelling of the cylindrical specimens with the results of the experimental
campaign already carried out. It helps to understand the behaviour of unit and mortar, the type
of stresses acting in them, failure mechanism and ultimate load and also to validate the
experimental results. The research is organized on the basis of following steps:
To gather information on the existing knowledge about the behavior of units and
mortar in masonry.
To determine the compressive strength of masonry using different approaches
involving different type of theories.
To validate the selected constitutive model, by performing benchmark analysis.
To assess and validate the reliability of the technique by comparing the results with the
experimental and through literature review.

Numerical Modelling of Experimental Tests on Cylindrical Masonry Specimens
Erasmus Mundus Programme
ADVANCED MASTERS IN STRUCTURAL ANALYSIS OF MONUMENTS AND HISTORICAL CONSTRUCTIONS 3
To compare the linear and non-linear analysis results to understand the initiation of
damage and stress distribution
To carry out sensitivity analysis to determine the behaviour of parameters affecting the
compressive strength of masonry. To suggest the formula to be used in determining
the compressive strength of cylindrical masonry specimens.
To understand and correlate how better the compressive strength of the cylindrical
specimen can be compared to that of the masonry wall.
1.3. OUTLINE OF THE THESIS
The present thesis is divided into six chapters. The first chapter deals with the motivation for
numerical analysis, objective and focus of the thesis.
The second chapter deals with the state of art, where an introduction is given on masonry,
brick and mortar, along with the compressive strength determination for old and new masonry
structures.
In chapter three, the experimental campaign carried out is presented, along with the previous
research results on bricks (whole and micro specimens), mortar, masonry prism, two joint
cylindrical specimen and three joint cylindrical specimen as these are the input values for the
numerical analysis.
Chapter four deals with the numerical analysis carried out. First, an introduction on the
constitutive model used is presented. Next, modelling and results of a bench mark analysis
carried out to calibrate the model is shown. Finally modelling and results of stack prism along
with the comparison of experimental results are discussed.
Chapter five presents the FE modelling, the results and the comparison of cylindrical
specimens of two joints and three joints. Firstly the results of linear analysis are presented,
next the non-linear analysis of three joint and two joint specimens are shown. Then the
comparison of numerical results with experimental results is discussed. Finally, some
conclusions are drawn along with the results of sensitivity analysis on masonry prism and
cylindrical specimens.
Chapter six concludes the thesis with the summary and outcome of the present research and
suggestions for the future work.

Numerical Modelling of Experimental Tests on Cylindrical Masonry Specimens
Erasmus Mundus Programme
4 ADVANCED MASTERS IN STRUCTURAL ANALYSIS OF MONUMENTS AND HISTORICAL CONSTRUCTIONS
Numerical Modelling of Experimental Tests on Cylindrical Masonry Specimens
Erasmus Mundus Programme
ADVANCED MASTERS IN STRUCTURAL ANALYSIS OF MONUMENTS AND HISTORICAL CONSTRUCTIONS 5
2. STATE OF ART
2.1. INTRODUCTION
This chapter deals with the introduction of masonry components, viz. the brick and the
mortar, the behaviour of masonry in general, failure criteria of masonry under uniaxial
compression and uniaxial tension. The second part deals with the different methods in
estimating the compressive strength using the Euro Code, Hilsdorf theory (1969) and finally
the new methods.
2.1.1. MASONRY
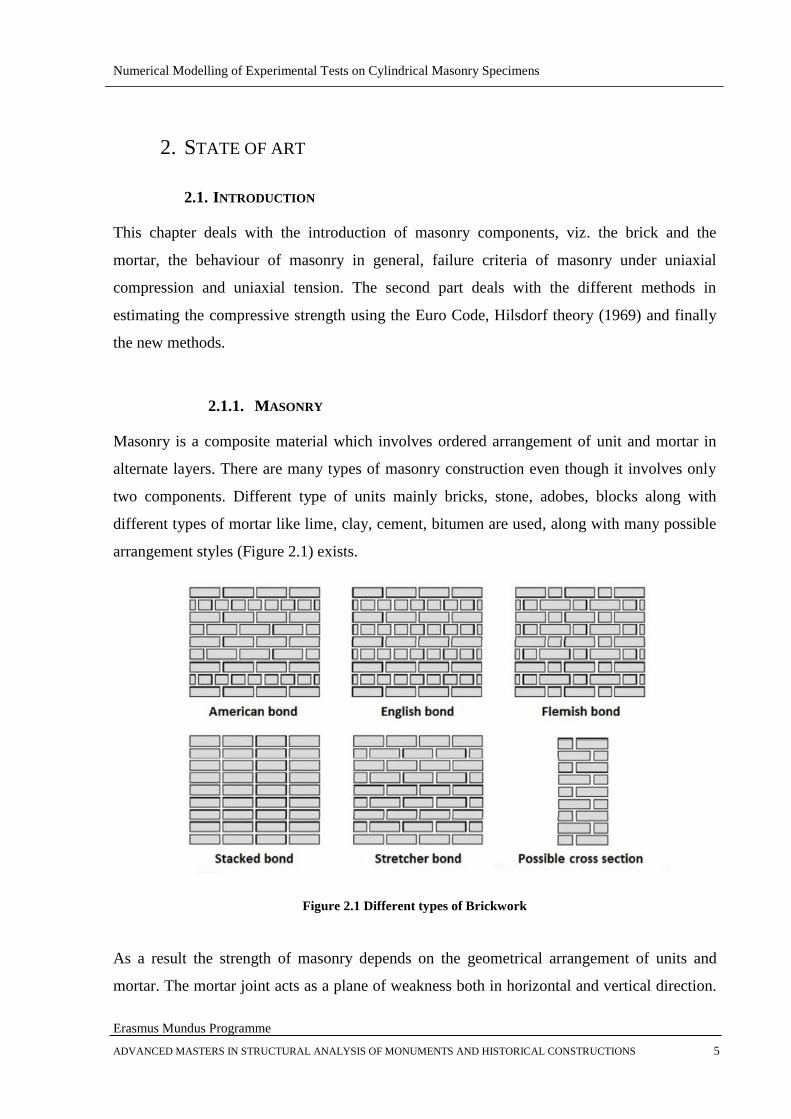
Masonry is a composite material which involves ordered arrangement of unit and mortar in
alternate layers. There are many types of masonry construction even though it involves only
two components. Different type of units mainly bricks, stone, adobes, blocks along with
different types of mortar like lime, clay, cement, bitumen are used, along with many possible
arrangement styles (Figure 2.1) exists.
Figure 2.1 Different types of Brickwork
As a result the strength of masonry depends on the geometrical arrangement of units and
mortar. The mortar joint acts as a plane of weakness both in horizontal and vertical direction.
Numerical Modelling of Experimental Tests on Cylindrical Masonry Specimens
Erasmus Mundus Programme
6 ADVANCED MASTERS IN STRUCTURAL ANALYSIS OF MONUMENTS AND HISTORICAL CONSTRUCTIONS
Since the interface layer of the unit and mortar has weak bond, the response is strongly
dependent on the orientation of joints. There are many other factors which influence the
behaviour of masonry. According to Hendry (1990), in general the stress strain behaviour is
dependent on
Units: compressive and tensile strength, type and geometry (solid, perforated, hollow
etc) and absorption capacity
Mortar: strength, thickness, Poisson’s ratio
Unit-mortar interface: bond between the two, direction of stress and local strain.
The features of units are possible to determine during the manufacturing process. But in case
of mortar it is subjected to variations, since it depends on the constituent materials. A brief
introduction on the behaviour of brick and mortar in masonry is given below.
2.1.2. BRICK
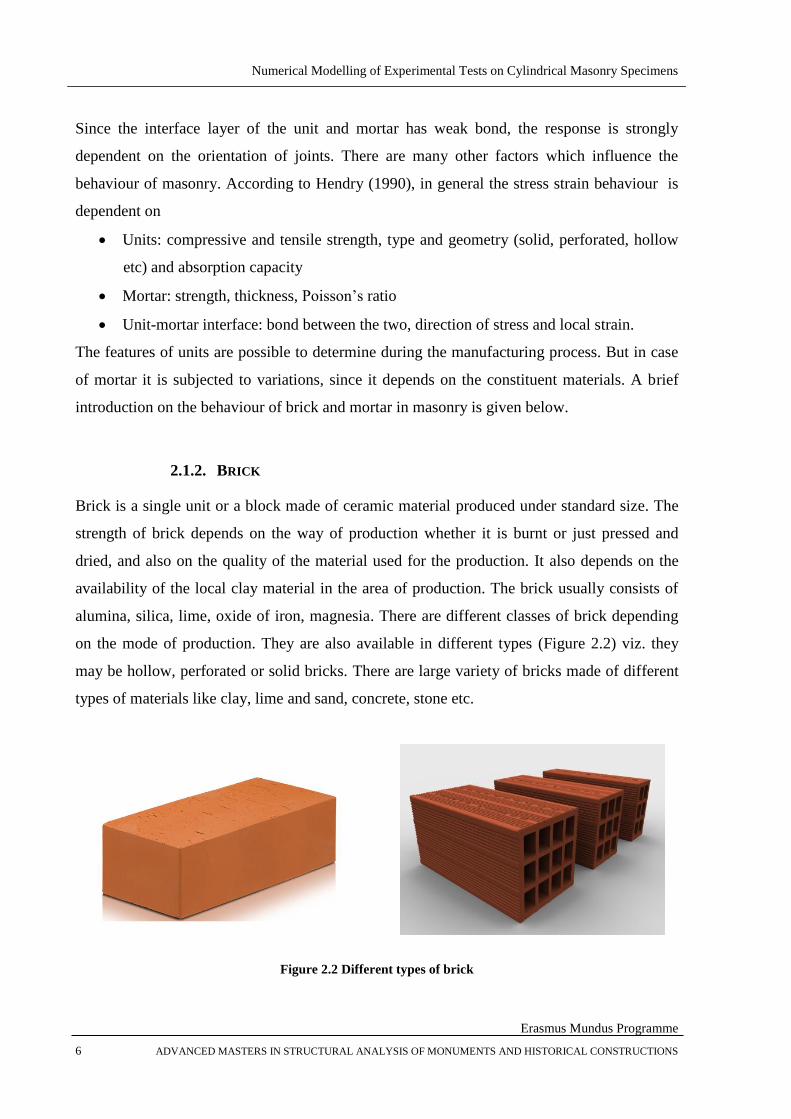
Brick is a single unit or a block made of ceramic material produced under standard size. The
strength of brick depends on the way of production whether it is burnt or just pressed and
dried, and also on the quality of the material used for the production. It also depends on the
availability of the local clay material in the area of production. The brick usually consists of
alumina, silica, lime, oxide of iron, magnesia. There are different classes of brick depending
on the mode of production. They are also available in different types (Figure 2.2) viz. they
may be hollow, perforated or solid bricks. There are large variety of bricks made of different
types of materials like clay, lime and sand, concrete, stone etc.
Figure 2.2 Different types of brick

Numerical Modelling of Experimental Tests on Cylindrical Masonry Specimens
Erasmus Mundus Programme
ADVANCED MASTERS IN STRUCTURAL ANALYSIS OF MONUMENTS AND HISTORICAL CONSTRUCTIONS 7
The mechanical parameters may vary within the same bath of bricks. It depends on the
duration of burning, the temperature, and manufacturing process. All these contribute to the
variation of their properties. There is a large scatter of production, based on the evolution of
time. The research has shown that ancient materials have low characteristics in comparison
with the modern ones, such as high porosity and absorption, low compressive strength and
elastic modulus (Lourenço et al, 2010).
Even though there is scatter of brick properties, the dimension of the brick are almost standard
viz., the length is almost twice the shorter side and the shorter side is around 1.5 times the
height. The mechanical properties of bricks, in particular the compressive strength, modulus
of elasticity and Poisson’s ratio are very relevant for the structural behaviour of masonry
constructions.
2.1.3. MORTAR
Mortar is a workable paste which holds the units, bricks and concrete together. Mortar
becomes hard when it cures, resulting in a rigid aggregate structure. However, the mortar is
intended to be weaker than the building blocks and the sacrificial element in the masonry,
because the mortar is easier and less expensive to repair than the building blocks. Mortars are
typically made from a mixture of sand, a binder, and water. The most common binder since
the early 20th century is Portland cement but the ancient binder lime mortar is still used in
some new construction.
(a)
(b)
Figure 2.3 Brickwork with (a) Lime mortar (b) Cement mortar
Numerical Modelling of Experimental Tests on Cylindrical Masonry Specimens
Erasmus Mundus Programme
8 ADVANCED MASTERS IN STRUCTURAL ANALYSIS OF MONUMENTS AND HISTORICAL CONSTRUCTIONS
The important properties of mortar are to fill the joints, impeding the passage of water, to
regularize the disposition of bricks and to distribute the load uniformly and to cooperate to
lead horizontal stresses until foundations. According to EN 459-1, European standard for
building lime (CEN, 2010), the lime mortar can be divided into two categories namely air
lime and lime with hydraulic properties, which are sub divided into many categories.
The properties of mortar which effect the masonry are the compressive strength, modulus of
elasticity and Poisson’s ratio.
The experimental results referred in this thesis are taken from natural hydraulic lime. Natural
hydraulic lime is produced by heating limestone that naturally contains clay and other
impurities, with no other material added to create hydraulicity.
2.1.4. TYPES OF MASONRY
The combination of brick and mortar can be of two types. The first possibility is when the
strength of brick is higher than the strength of mortar. The second case is when the strength of
mortar is greater than the strength of brick. Type one is the most common type of construction
found in old and also carried out in modern construction. The difference in stiffness between
the brick and mortar properties is the main criteria responsible for the failure of masonry as
stated by Hilsdorf (1969).
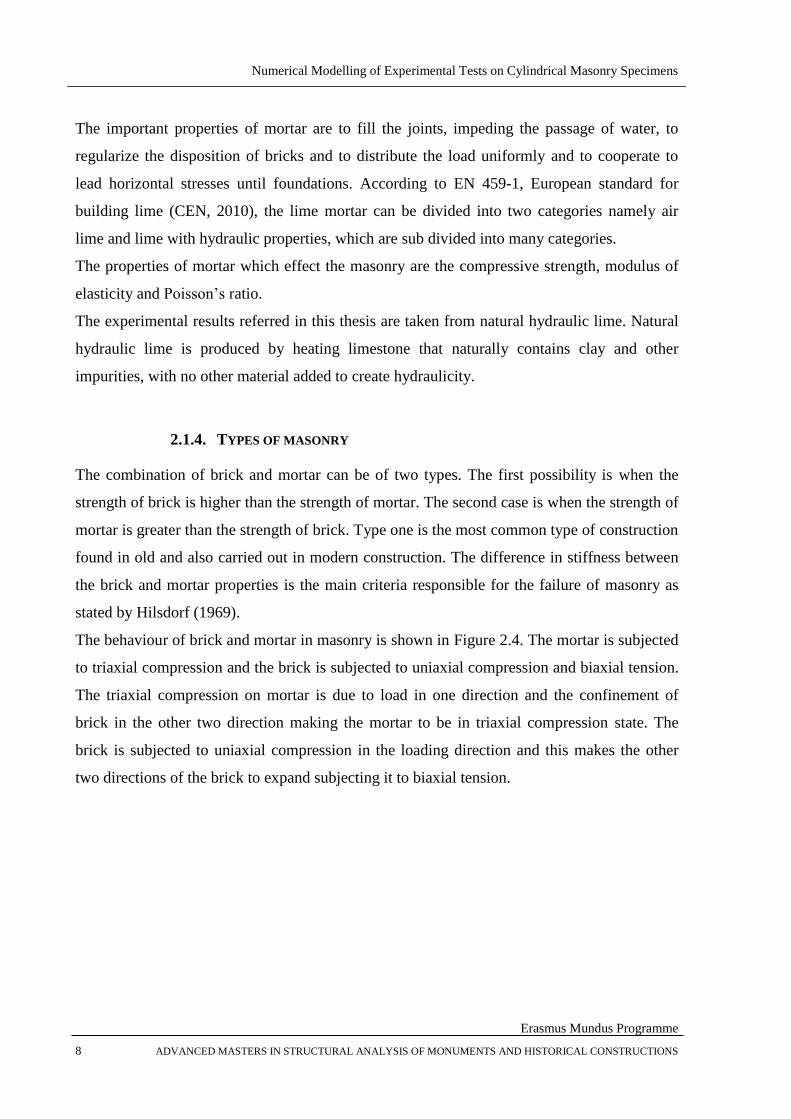
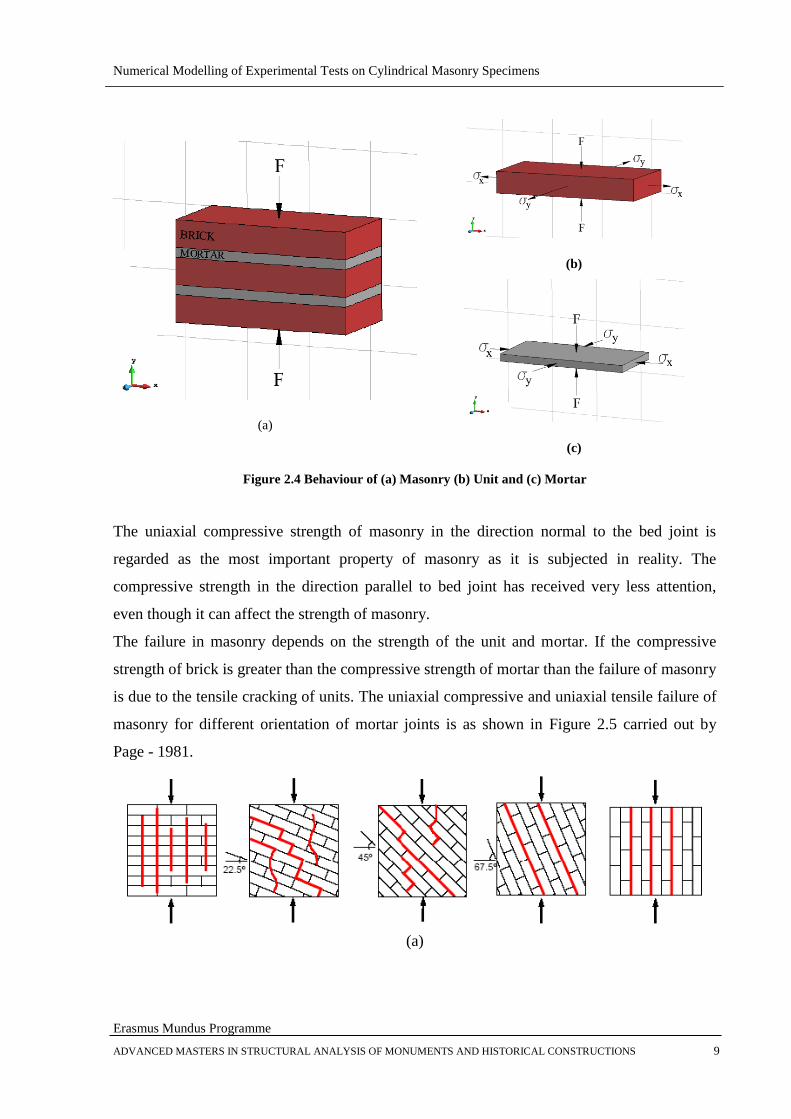
The behaviour of brick and mortar in masonry is shown in Figure 2.4. The mortar is subjected
to triaxial compression and the brick is subjected to uniaxial compression and biaxial tension.
The triaxial compression on mortar is due to load in one direction and the confinement of
brick in the other two direction making the mortar to be in triaxial compression state. The
brick is subjected to uniaxial compression in the loading direction and this makes the other
two directions of the brick to expand subjecting it to biaxial tension.
Numerical Modelling of Experimental Tests on Cylindrical Masonry Specimens
Erasmus Mundus Programme
ADVANCED MASTERS IN STRUCTURAL ANALYSIS OF MONUMENTS AND HISTORICAL CONSTRUCTIONS 9
(a)
(b)
(c)
Figure 2.4 Behaviour of (a) Masonry (b) Unit and (c) Mortar
The uniaxial compressive strength of masonry in the direction normal to the bed joint is
regarded as the most important property of masonry as it is subjected in reality. The
compressive strength in the direction parallel to bed joint has received very less attention,
even though it can affect the strength of masonry.
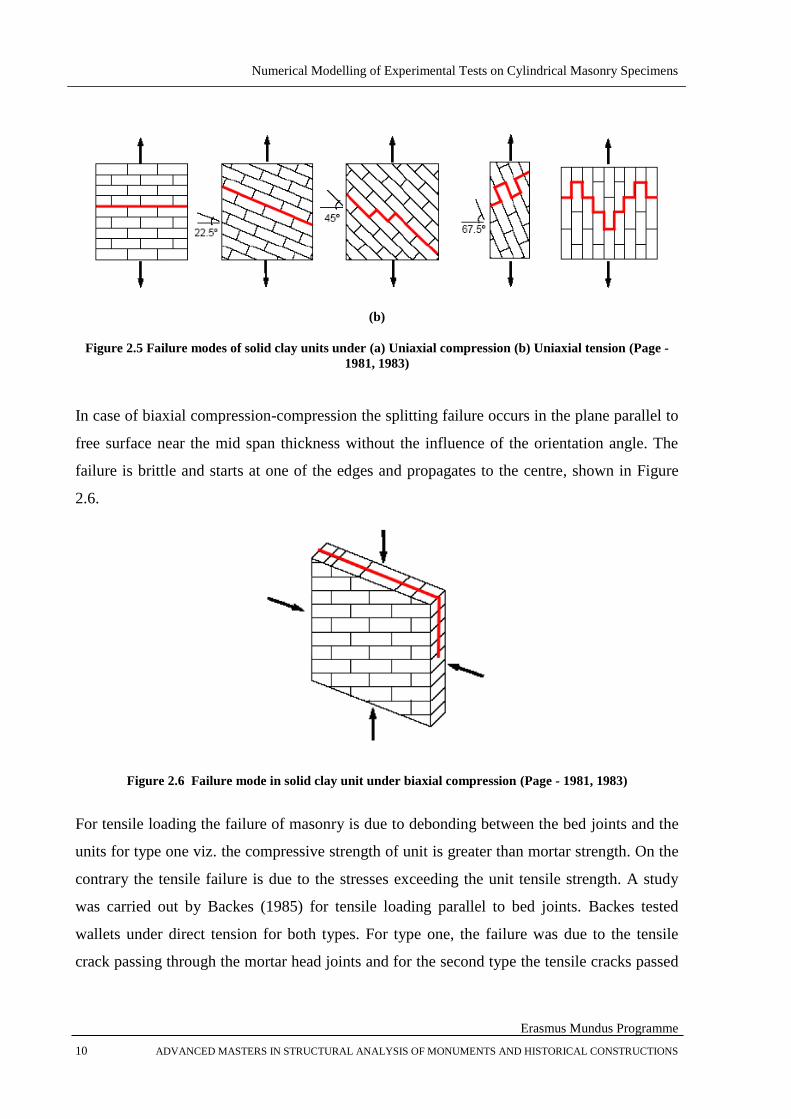
The failure in masonry depends on the strength of the unit and mortar. If the compressive
strength of brick is greater than the compressive strength of mortar than the failure of masonry
is due to the tensile cracking of units. The uniaxial compressive and uniaxial tensile failure of
masonry for different orientation of mortar joints is as shown in Figure 2.5 carried out by
Page - 1981.
(a)
Numerical Modelling of Experimental Tests on Cylindrical Masonry Specimens
Erasmus Mundus Programme
10 ADVANCED MASTERS IN STRUCTURAL ANALYSIS OF MONUMENTS AND HISTORICAL CONSTRUCTIONS
(b)
Figure 2.5 Failure modes of solid clay units under (a) Uniaxial compression (b) Uniaxial tension (Page -
1981, 1983)
In case of biaxial compression-compression the splitting failure occurs in the plane parallel to
free surface near the mid span thickness without the influence of the orientation angle. The
failure is brittle and starts at one of the edges and propagates to the centre, shown in Figure
2.6.
Figure 2.6 Failure mode in solid clay unit under biaxial compression (Page - 1981, 1983)
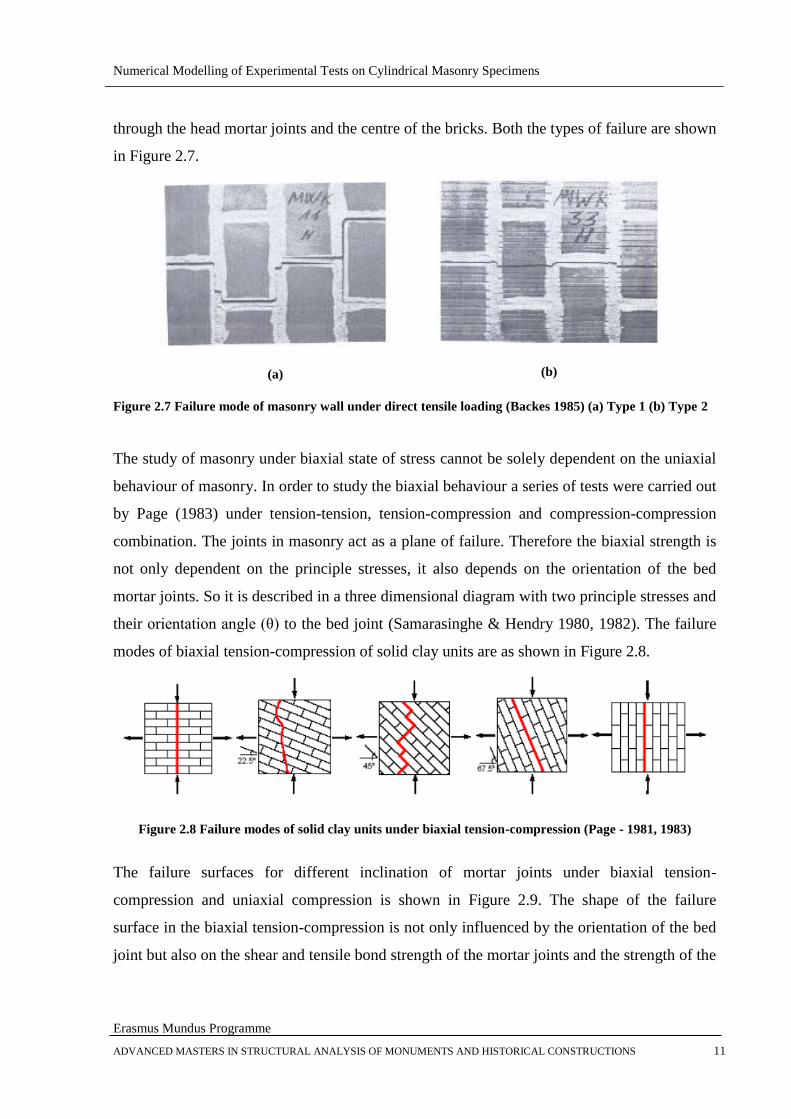
For tensile loading the failure of masonry is due to debonding between the bed joints and the
units for type one viz. the compressive strength of unit is greater than mortar strength. On the
contrary the tensile failure is due to the stresses exceeding the unit tensile strength. A study
was carried out by Backes (1985) for tensile loading parallel to bed joints. Backes tested
wallets under direct tension for both types. For type one, the failure was due to the tensile
crack passing through the mortar head joints and for the second type the tensile cracks passed
Numerical Modelling of Experimental Tests on Cylindrical Masonry Specimens
Erasmus Mundus Programme
ADVANCED MASTERS IN STRUCTURAL ANALYSIS OF MONUMENTS AND HISTORICAL CONSTRUCTIONS 11
through the head mortar joints and the centre of the bricks. Both the types of failure are shown
in Figure 2.7.
(a)
(b)
Figure 2.7 Failure mode of masonry wall under direct tensile loading (Backes 1985) (a) Type 1 (b) Type 2
The study of masonry under biaxial state of stress cannot be solely dependent on the uniaxial
behaviour of masonry. In order to study the biaxial behaviour a series of tests were carried out
by Page (1983) under tension-tension, tension-compression and compression-compression
combination. The joints in masonry act as a plane of failure. Therefore the biaxial strength is
not only dependent on the principle stresses, it also depends on the orientation of the bed
mortar joints. So it is described in a three dimensional diagram with two principle stresses and
their orientation angle (θ) to the bed joint (Samarasinghe & Hendry 1980, 1982). The failure
modes of biaxial tension-compression of solid clay units are as shown in Figure 2.8.
Figure 2.8 Failure modes of solid clay units under biaxial tension-compression (Page - 1981, 1983)
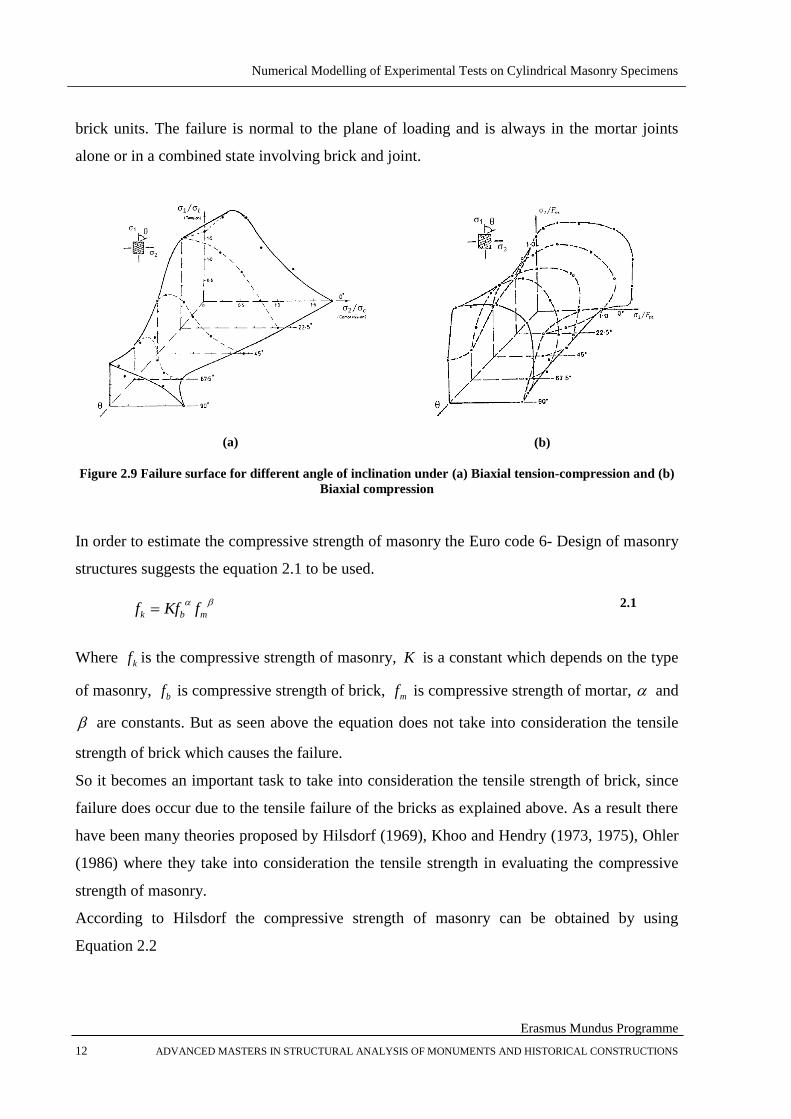
The failure surfaces for different inclination of mortar joints under biaxial tension-
compression and uniaxial compression is shown in Figure 2.9. The shape of the failure
surface in the biaxial tension-compression is not only influenced by the orientation of the bed
joint but also on the shear and tensile bond strength of the mortar joints and the strength of the
Numerical Modelling of Experimental Tests on Cylindrical Masonry Specimens
Erasmus Mundus Programme
12 ADVANCED MASTERS IN STRUCTURAL ANALYSIS OF MONUMENTS AND HISTORICAL CONSTRUCTIONS
brick units. The failure is normal to the plane of loading and is always in the mortar joints
alone or in a combined state involving brick and joint.
(a)
(b)
Figure 2.9 Failure surface for different angle of inclination under (a) Biaxial tension-compression and (b)
Biaxial compression
In order to estimate the compressive strength of masonry the Euro code 6- Design of masonry
structures suggests the equation 2.1 to be used.
mbk fKff 2.1
Where kf is the compressive strength of masonry, K is a constant which depends on the type
of masonry, bf is compressive strength of brick, mf is compressive strength of mortar, and
are constants. But as seen above the equation does not take into consideration the tensile
strength of brick which causes the failure.
So it becomes an important task to take into consideration the tensile strength of brick, since
failure does occur due to the tensile failure of the bricks as explained above. As a result there
have been many theories proposed by Hilsdorf (1969), Khoo and Hendry (1973, 1975), Ohler
(1986) where they take into consideration the tensile strength in evaluating the compressive
strength of masonry.
According to Hilsdorf the compressive strength of masonry can be obtained by using
Equation 2.2
Numerical Modelling of Experimental Tests on Cylindrical Masonry Specimens
Erasmus Mundus Programme
ADVANCED MASTERS IN STRUCTURAL ANALYSIS OF MONUMENTS AND HISTORICAL CONSTRUCTIONS 13
)(
)(
bcbt
jbt
u
bc
uff
ff
U
ff
2.2
bcf is the compressive strength of brick, btf is the tensile strength of brick, jf is the
compressive strength of mortar, is the ratio of thickness of mortar joint to thickness of the
brick and uU is coefficient of non-uniformity which Hilsdorf established according to his
experimental investigation. This equation was developed based on an assumed linear relation
between the lateral biaxial tensile stress and local compressive stress equal to external
compressive stress multiplied by the non-uniformity.
Ohler (1986) developed an equation for compressive strength determination of masonry,
assuming the tri-linear representation of biaxial failure crack for brick based on the available
experimental data.
xoss
yosm
yomyos
yomy
mh
thl
s
2.3
y is the compressive stress at failure, yom is the uniaxial compressive strength of mortar,
yos is the uniaxial compressive strength of brick, xos is the uniaxial tensile strength of
brick, sh and mh are the thickness of mortar and brick, m is the slope of failure, s and t are the
parameters defining unit failure envelope.
2.2. EXPERIMENTAL COMPRESSIVE STRENGTH DETERMINATION
Compressive strength determination can be split into two parts based on the age of masonry
structures. One for the new masonry construction, which can be tested along with the
construction of new masonry walls and the other for old masonry constructions which
requires a method to determine the compressive strength.
2.2.1. NEW MASONRY STRUCTURES
The compressive strength determination for new masonry can be performed by constructing
new masonry walls simultaneously and testing them under laboratory conditions. The

Numerical Modelling of Experimental Tests on Cylindrical Masonry Specimens
Erasmus Mundus Programme
14 ADVANCED MASTERS IN STRUCTURAL ANALYSIS OF MONUMENTS AND HISTORICAL CONSTRUCTIONS
European standard EN 1052-1:1998 is followed for the construction and testing procedures.
Experimental investigations have been carried out based on this standard for instance by
Peverini (2014), and by University of Padova in the framework of the NIKER European
project (New integrated knowledge based approaches to the protection of cultural heritage
from earthquake induced risk) for the strength determination.
Small masonry stack prisms and wallets are constructed according to Table 2.1 for the
specimen dimensions and tested under loading, till the specimen fails. Once the maximum
load is obtained the compressive strength is calculated using the equation 2.4, the maximum
force divided by the area under loading.
Table 2.1 Specimen sizes for testing the compressive strength of masonry
Face size of unit Masonry specimen size
)(mmlu )(mmhu Length
)(mmls
Height
)(mmhs
Thickness
)(mmt s
300 150
)2( ulX uh5
sss landtandt 153 ut 150 uh3
300 150
)5.1( ulX uh5
150 uh3
i
i
iA
ff
max,
2.4
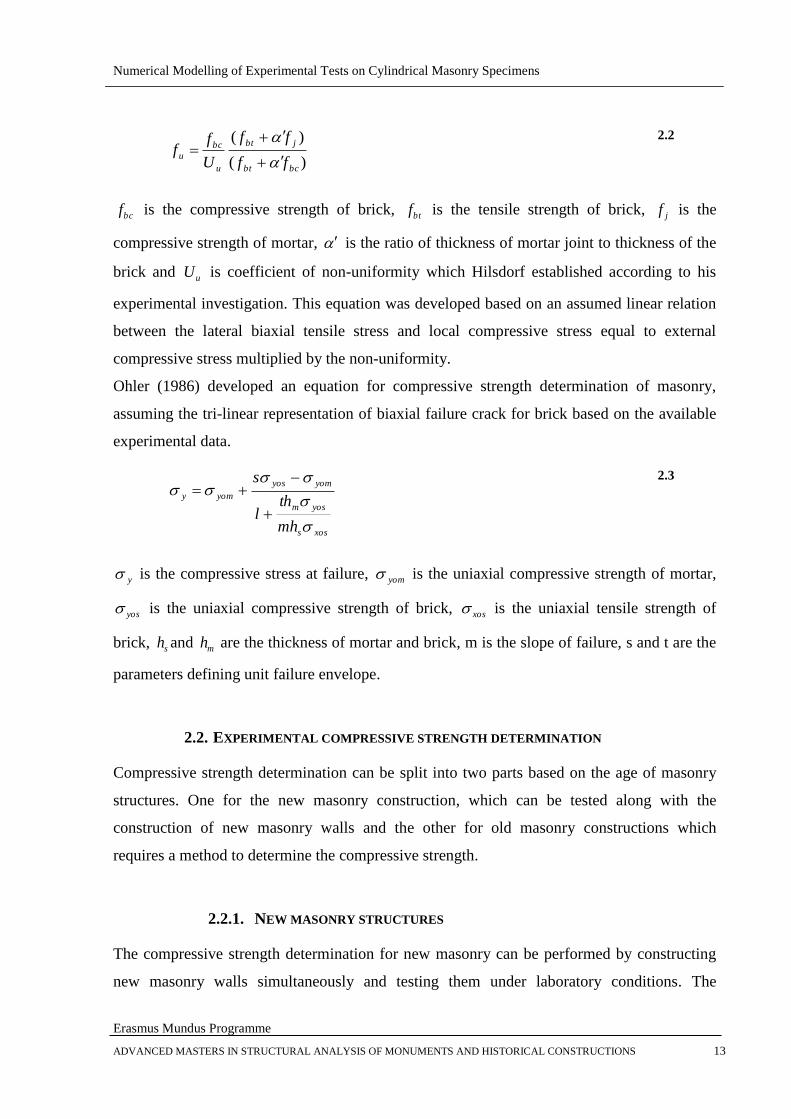
The experiments conducted by Peverini (2014) on masonry prism is shown in Figure 2.10
compute good results. The average compressive strength of prisms were 8.64 MPa with a
maximum force of 320.69 kN. The tests were performed under displacement control to obtain
the post peak behaviour.
Numerical Modelling of Experimental Tests on Cylindrical Masonry Specimens
Erasmus Mundus Programme
ADVANCED MASTERS IN STRUCTURAL ANALYSIS OF MONUMENTS AND HISTORICAL CONSTRUCTIONS 15
Figure 2.10 Tests on Prisms by Peverini (2014) at UPC
Before testing the masonry prisms, the brick and the mortar casted at the time of construction
can be tested, in order to compare the results with masonry. This is the method used to
estimate the compressive strength of new masonries. But to find the compressive strength of
historical masonry or old masonry, there have been little investigation and works related to it.
2.2.2. OLD MASONRY STRUCTURES
It is difficult to estimate the compressive strength of existing masonry, since only non-
destructive and minor destructive tests need to be carried out. As a result deformation and
failure theories are necessary. Many theories have been proposed by Hilsdorf (1969), Khoo
and Hendry (1973, 1975), Atkinson (1982) and others, for both theoretical, empherical and
failure criteria based on the mechanical parameters of masonry. Since theoretical assumptions
do not satisfy the experimental outcomes, there is further research need to be carried out in
this field.
UIC 778-3R (International Union of Railways, 1995) proposes to extract cylindrical
specimens from the existing masonry to determine their compressive strength. The diameter
of the cylindrical specimens is recommended to be 150 mm by UIC and Brencich et al (2004,
2006), since they represent actual brickwork involving a vertical and two horizontal mortar
joints. There are experiments carried out on 90-100 mm diametrical cylindrical cores by
Sassoni & Mazzotti (2013) to estimate the compressive strength. The specimens are small and
represent partially the complex interaction among joints and bricks, therefore more

Numerical Modelling of Experimental Tests on Cylindrical Masonry Specimens
Erasmus Mundus Programme
16 ADVANCED MASTERS IN STRUCTURAL ANALYSIS OF MONUMENTS AND HISTORICAL CONSTRUCTIONS
investigation is necessary for a better correlation between the strength of small cores and that
of whole masonry.
Brencich et al (2004, 2006) carried out experiments on cylindrical masonry specimens from
150 year old bridge in Alessandria, Italy. The specimens are shown in Figure 2.11. Three
centimetre thick mortar was casted on top and at the bottom of the specimens to apply the
load uniformly on the specimen. To compare the results from the experiments, they also
carried out numerical analysis using finite element method. The failure of the cylindrical
specimens in experiments and the numerical model were almost the same viz. the failure of
brick in tension and the vertical mortar joint resulting in the detachment of the lateral parts of
the brick. The failure of the specimen in the numerical model is at lower load, resulting in
lower compressive strength in comparison to the experimental results. The numerical model is
compared with the traditional approaches like flat jack and sclerometer using Schmidt
hammer to determine the compressive strength.
(a)
(b)
Figure 2.11 (a) Cylindrical specimen with mortar on top and bottom for testing (b) Sand cone shaped
failure
The compressive strength is given by the equation 2.5. The area of consideration is the full
diametric area of the specimen, which is assumed to resist the applied force. This criterion
might lead to underestimations of the masonry strength, since at failure the distribution of
vertical stresses should distribute in the sand cone shape in the central part of the specimen.
Numerical Modelling of Experimental Tests on Cylindrical Masonry Specimens
Erasmus Mundus Programme
ADVANCED MASTERS IN STRUCTURAL ANALYSIS OF MONUMENTS AND HISTORICAL CONSTRUCTIONS 17
l
Ff coll
c
2.5
The finite element models (FEM) helps in understanding the collapse mechanism viz. the
evolution of cracking in the specimen. The lower strength of the numerical model is due to the
elastic mismatch between the brick and mortar, resulting in the evolution of tensile stresses in
the brick near the vertical joint, where the failure initiates.

Numerical Modelling of Experimental Tests on Cylindrical Masonry Specimens
Erasmus Mundus Programme
18 ADVANCED MASTERS IN STRUCTURAL ANALYSIS OF MONUMENTS AND HISTORICAL CONSTRUCTIONS
Numerical Modelling of Experimental Tests on Cylindrical Masonry Specimens
Erasmus Mundus Programme
ADVANCED MASTERS IN STRUCTURAL ANALYSIS OF MONUMENTS AND HISTORICAL CONSTRUCTIONS 19
3. EXPERIMENTAL CAMPAIGN
3.1. INTRODUCTION
This chapter deals with the experimental extraction of cylindrical specimens carried out in the
laboratory. Also the results of compressive strength, tensile strength, Young’s modulus of
elasticity and Poisson’s ratio of the mortar, brick, prism and cylinders are presented. The latter
experiments were carried out in Technical University of Catalonia, being the objective of
master thesis by Peverini (2014) and onCaUsan ~ (2014), and the former was carried out for
the present thesis. The results are presented, since they are the values of input for the
numerical analysis carried out on prism and cylindrical specimens of two joints and three
joints.
The chapter is split into sections dealing individually with cylindrical extraction (present),
brick, mortar, prism and cylindrical specimens with reference codes used for respective
experimental campaign.
3.2. CYLINDRICAL EXTRACTION
Extraction of cylinders were planned and executed on the newly constructed masonry wall in
the laboratory. Two walls were constructed with Spanish brick units and non-hydraulic lime
mortar having the total dimension 1537 x 700 x 133 mm3. The extractions were carried out at
the age of 61 days.
The extraction was performed in order to eliminate the drawbacks from the previous
experimental work. Namely, before extraction the wall was laid in horizontal direction. The
extraction was done by using drilling machine along with water, to reduce the dust and
pressure originating from the extraction. As a result five cylindrical specimens of three joints
and six cylindrical specimens of two joints were successfully extracted.
Based on this experience, the new extraction was carried out by keeping the wall in vertical
direction. An initial pre compression of 3 kPa was applied at four points so as not to lose the
integrity during extraction as a whole, or part of the wall. Markings of the cylinders were
made on the masonry wall with the necessary joints (three joints, two joints and one joint)
before performing the extraction.
Numerical Modelling of Experimental Tests on Cylindrical Masonry Specimens
Erasmus Mundus Programme
20 ADVANCED MASTERS IN STRUCTURAL ANALYSIS OF MONUMENTS AND HISTORICAL CONSTRUCTIONS
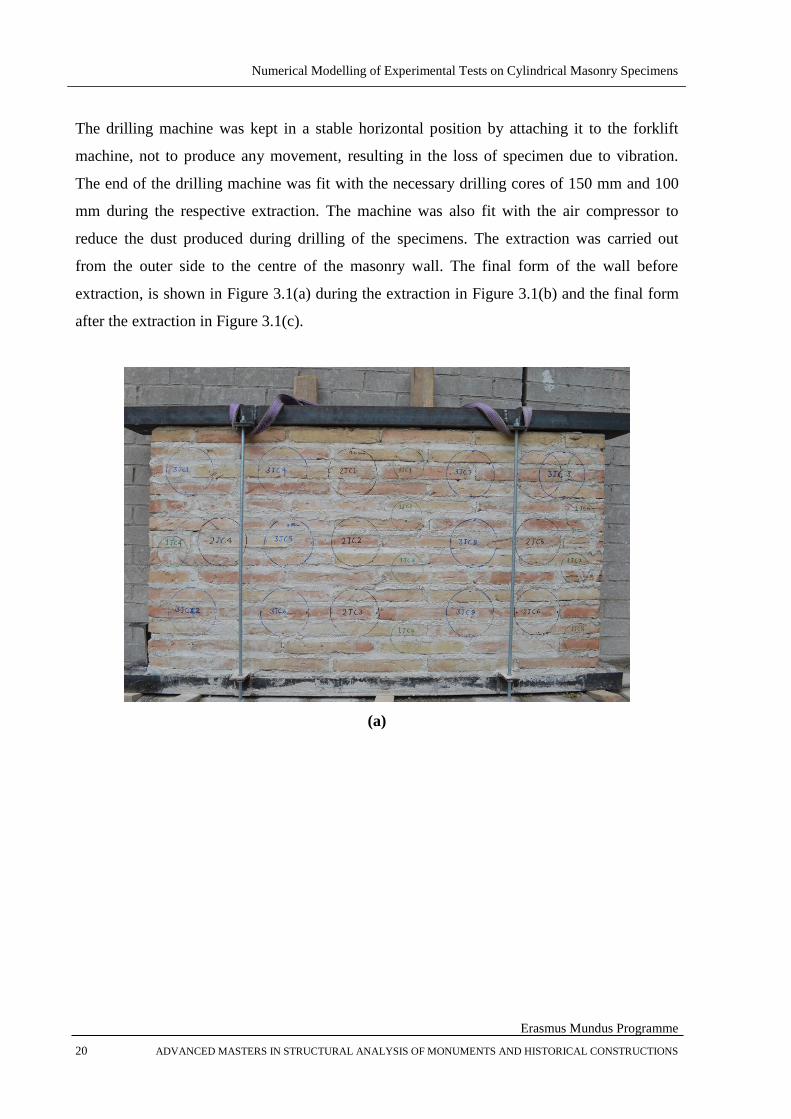
The drilling machine was kept in a stable horizontal position by attaching it to the forklift
machine, not to produce any movement, resulting in the loss of specimen due to vibration.
The end of the drilling machine was fit with the necessary drilling cores of 150 mm and 100
mm during the respective extraction. The machine was also fit with the air compressor to
reduce the dust produced during drilling of the specimens. The extraction was carried out
from the outer side to the centre of the masonry wall. The final form of the wall before
extraction, is shown in Figure 3.1(a) during the extraction in Figure 3.1(b) and the final form
after the extraction in Figure 3.1(c).
(a)

Numerical Modelling of Experimental Tests on Cylindrical Masonry Specimens
Erasmus Mundus Programme
ADVANCED MASTERS IN STRUCTURAL ANALYSIS OF MONUMENTS AND HISTORICAL CONSTRUCTIONS 21
(b)
(c)
Figure 3.1 (a) Before extraction (b) During extraction (c) After extraction
Three types of cylindrical specimens were extracted viz., two joint cylinder (with two
horizontal mortar joints) of 150 mm, three joint cylinders (with two horizontal and one
vertical joint) of 150 mm and a single joint cylinder (with one horizontal joint) of 100 mm.

Numerical Modelling of Experimental Tests on Cylindrical Masonry Specimens
Erasmus Mundus Programme
22 ADVANCED MASTERS IN STRUCTURAL ANALYSIS OF MONUMENTS AND HISTORICAL CONSTRUCTIONS
No problems were encountered during any stages of the extraction. A total of 14 two joint
cylinders, 15 three joint cylinders and 22 single joint cylinders were extracted from the two
walls.
After the completion of extraction regularization mortar was laid around the cylindrical
specimens. This was applied to provide a uniform surface to apply load and to remove any
irregularities if present. The mortar used is Sika FastFix, a quick setting mortar. Wooden
moulds (Figure 3.2 a) were created to place the cylindrical specimens in the centre, and to
pour the quick setting mortar around it. The final specimen after casting the regularisation
mortar is shown in Figure 3.2(b).
Figure 3.2 (a) Cylinder in the mould & (b) Final specimen
Unfortunately any of the experiments planned were not executed because of the time
constraint. But the specimens will be used to carry out the experimental investigation in the
near future.
(a) (b)
Numerical Modelling of Experimental Tests on Cylindrical Masonry Specimens
Erasmus Mundus Programme
ADVANCED MASTERS IN STRUCTURAL ANALYSIS OF MONUMENTS AND HISTORICAL CONSTRUCTIONS 23
3.3. BRICK
The experiments carried out on bricks will be presented in two parts. First part dealing with
the tests carried out on whole brick specimens and second part with the tests carried out on
micro specimens extracted from the bricks.
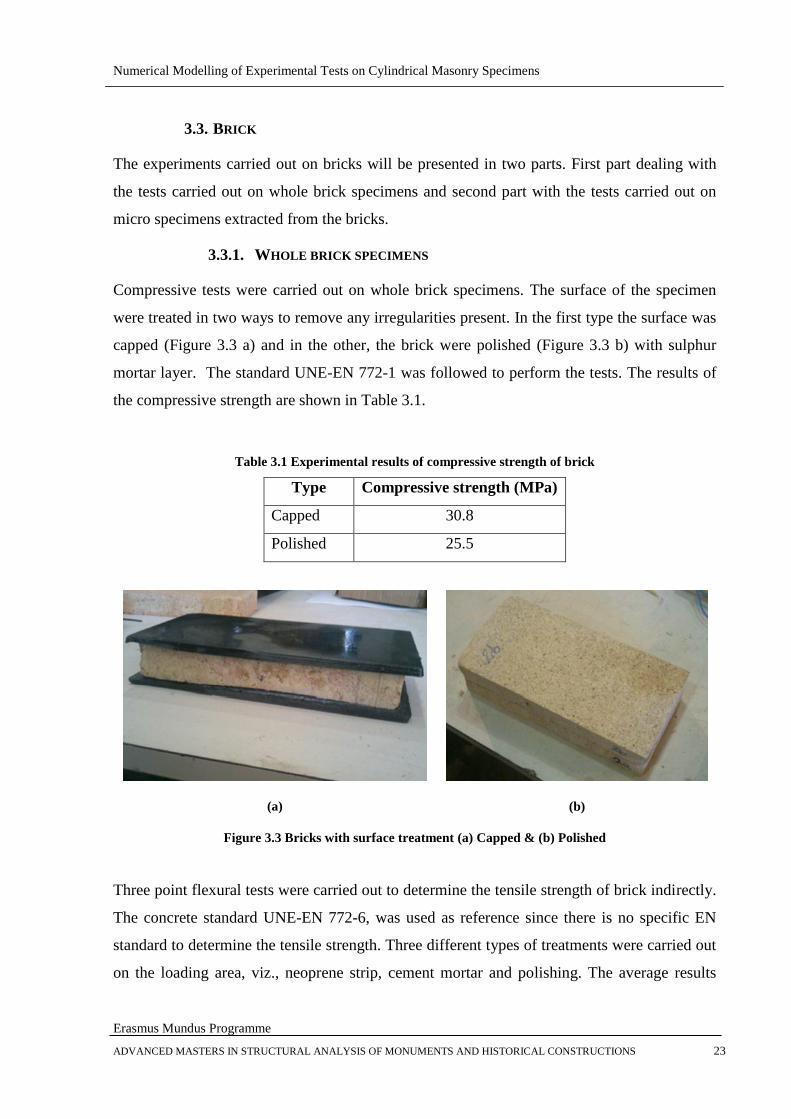
3.3.1. WHOLE BRICK SPECIMENS
Compressive tests were carried out on whole brick specimens. The surface of the specimen
were treated in two ways to remove any irregularities present. In the first type the surface was
capped (Figure 3.3 a) and in the other, the brick were polished (Figure 3.3 b) with sulphur
mortar layer. The standard UNE-EN 772-1 was followed to perform the tests. The results of
the compressive strength are shown in Table 3.1.
Table 3.1 Experimental results of compressive strength of brick
Type Compressive strength (MPa)
Capped 30.8
Polished 25.5
(a)
(b)
Figure 3.3 Bricks with surface treatment (a) Capped & (b) Polished
Three point flexural tests were carried out to determine the tensile strength of brick indirectly.
The concrete standard UNE-EN 772-6, was used as reference since there is no specific EN
standard to determine the tensile strength. Three different types of treatments were carried out
on the loading area, viz., neoprene strip, cement mortar and polishing. The average results
Numerical Modelling of Experimental Tests on Cylindrical Masonry Specimens
Erasmus Mundus Programme
24 ADVANCED MASTERS IN STRUCTURAL ANALYSIS OF MONUMENTS AND HISTORICAL CONSTRUCTIONS
obtained from the tests are shown in Table 3.2. The tensile strength was calculated using the
equation 3.1 (Model Code 1990).
7.0
0
7.0
0
,
5.11
5.1
h
h
h
h
ff
b
b
flctctm
3.1
ctmf is the mean axial tensile strength, ctmf is the flexural tensile strength, bh is the depth of the
specimen, mmh 1000 .
Table 3.2 Flexural test on whole brick specimens
Type Flexural strength (MPa) Tensile strength (MPa)
Neoprene 3.57 1.17
Mortar 3.74 1.23
Polished 3.68 1.15
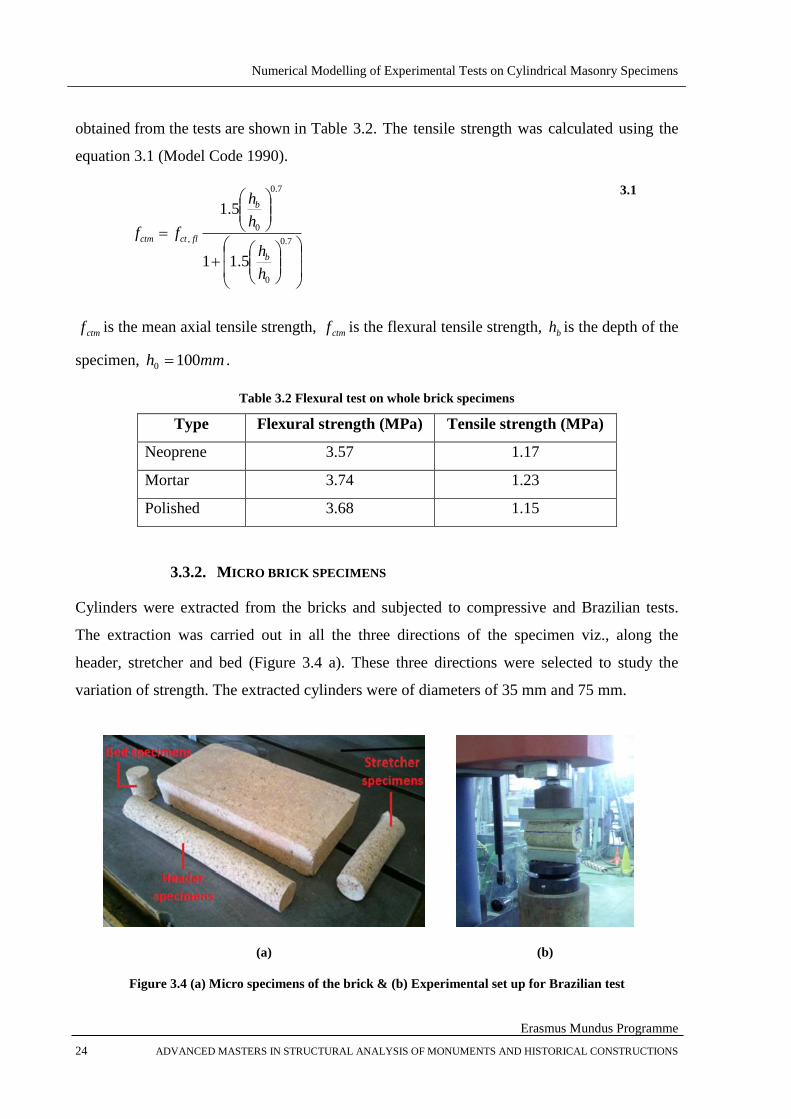
3.3.2. MICRO BRICK SPECIMENS
Cylinders were extracted from the bricks and subjected to compressive and Brazilian tests.
The extraction was carried out in all the three directions of the specimen viz., along the
header, stretcher and bed (Figure 3.4 a). These three directions were selected to study the
variation of strength. The extracted cylinders were of diameters of 35 mm and 75 mm.
(a)
(b)
Figure 3.4 (a) Micro specimens of the brick & (b) Experimental set up for Brazilian test
Numerical Modelling of Experimental Tests on Cylindrical Masonry Specimens
Erasmus Mundus Programme
ADVANCED MASTERS IN STRUCTURAL ANALYSIS OF MONUMENTS AND HISTORICAL CONSTRUCTIONS 25
Two ratios were opted to perform the test, with each test having three minimum samples for
testing. The ratio 2:1 with the height to diameter and the ratio of 1:1 were carried out. For the
bed sample to be tested for 2:1 ratio, two samples were placed one on top of another without
any connecting material. Fracture energy was also determined by calculating the area below
the stress displacement curve. The modulus of elasticity was found to be 6671.3 MPa. The
results of compressive strength and fracture energy are shown in Table 3.3.
Table 3.3 Results of Compressive tests on Bricks of 35 mm diameter specimens
Compressive
strength (MPa)
Fracture energy
(N/mm)
Header (2:1) 16.17 0.151
Stretcher (2:1) 25.36 0.167
Bed (2:1) 12.41 0.156
Average 17.98 0.158
The same experiments were carried out on 75 mm diametrical cylinders. The average results
of these are presented in Table 3.4.
Table 3.4 Results of Compressive tests on Bricks of 75 mm diameter specimens
Compressive
strength (MPa)
Fracture
energy
(N/mm)
Poisson’s
ratio
Bed 23.62 1.72 0.1
The concrete code UNE-EN 12390-3 was used for the compressive tests and the ASTM
standard C496-96 was used for the Brazilian test. The experimental set up of the Brazilian test
is shown in Figure 3.4 (b) and the results are shown in Table 3.5.
Numerical Modelling of Experimental Tests on Cylindrical Masonry Specimens
Erasmus Mundus Programme
26 ADVANCED MASTERS IN STRUCTURAL ANALYSIS OF MONUMENTS AND HISTORICAL CONSTRUCTIONS
Table 3.5 Results of Brazilian tests on Brick specimens of 35 mm diameter
Tensile strength (MPa)
Header (1:1) 3.33
Stretcher (1:1) 3.10
Bed (1:1) 2.07
Header (2:1) 1.90
Stretcher (2:1) 2.07
3.4. MORTAR
The experimental tests on mortar were carried out according to the European standard CEN -
2007 -EN 1015-11 - Methods of test for mortar for masonry - Part 11 Determination of
flexural and compressive strength of hardened mortar. The preparation, storage, testing and
analysis are all explained in detail in the code. The results were analysed at 7, 14, 28 and 61
days to compare the evolution of strength over the period. The results obtained were
comparatively less with respect to the standard lime mortar, hence even the standard for
concrete UNE-EN 12390-3 was also referred to evaluate the compressive strength and
modulus of elasticity.
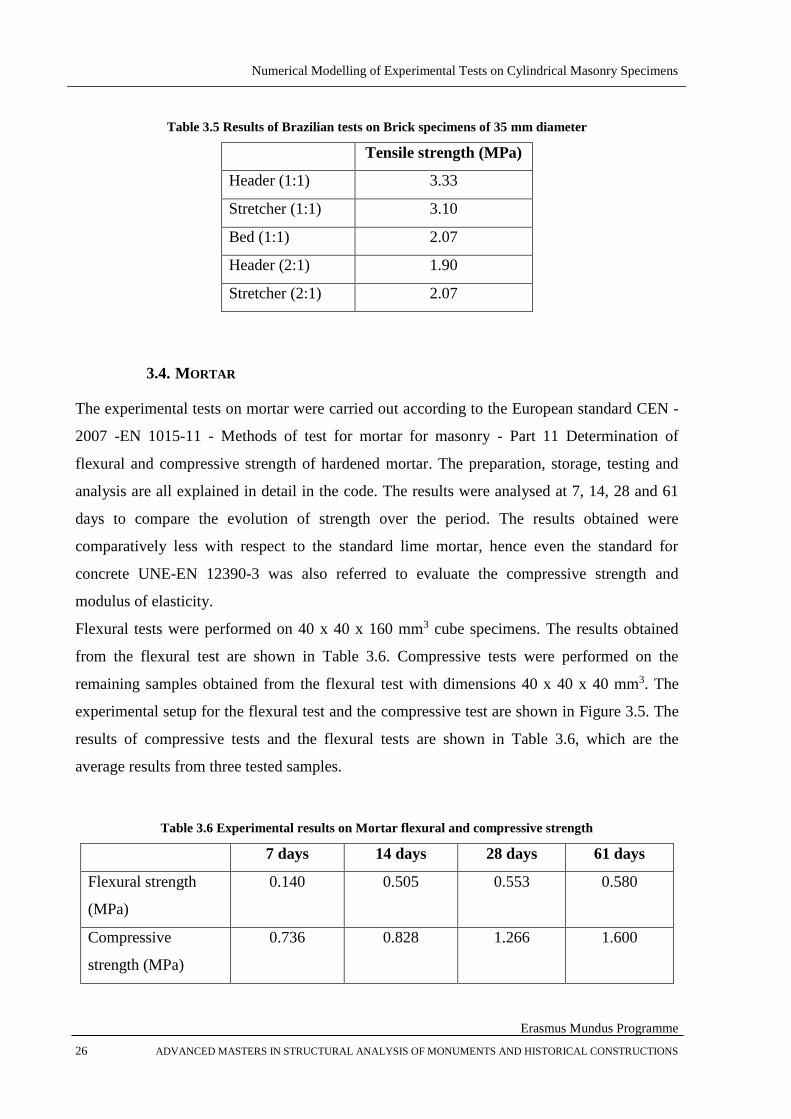
Flexural tests were performed on 40 x 40 x 160 mm3 cube specimens. The results obtained
from the flexural test are shown in Table 3.6. Compressive tests were performed on the
remaining samples obtained from the flexural test with dimensions 40 x 40 x 40 mm3. The
experimental setup for the flexural test and the compressive test are shown in Figure 3.5. The
results of compressive tests and the flexural tests are shown in Table 3.6, which are the
average results from three tested samples.
Table 3.6 Experimental results on Mortar flexural and compressive strength
7 days 14 days 28 days 61 days
Flexural strength
(MPa)
0.140 0.505 0.553 0.580
Compressive
strength (MPa)
0.736 0.828 1.266 1.600
Numerical Modelling of Experimental Tests on Cylindrical Masonry Specimens
Erasmus Mundus Programme
ADVANCED MASTERS IN STRUCTURAL ANALYSIS OF MONUMENTS AND HISTORICAL CONSTRUCTIONS 27
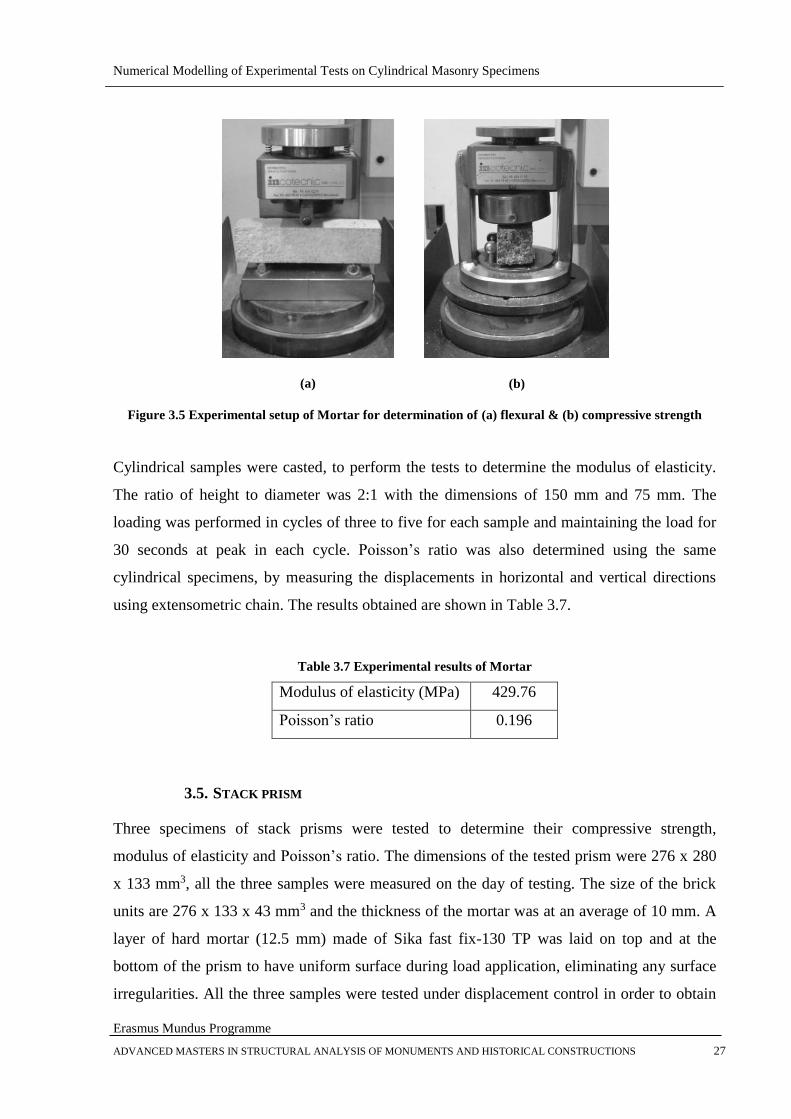
(a)
(b)
Figure 3.5 Experimental setup of Mortar for determination of (a) flexural & (b) compressive strength
Cylindrical samples were casted, to perform the tests to determine the modulus of elasticity.
The ratio of height to diameter was 2:1 with the dimensions of 150 mm and 75 mm. The
loading was performed in cycles of three to five for each sample and maintaining the load for
30 seconds at peak in each cycle. Poisson’s ratio was also determined using the same
cylindrical specimens, by measuring the displacements in horizontal and vertical directions
using extensometric chain. The results obtained are shown in Table 3.7.
Table 3.7 Experimental results of Mortar
Modulus of elasticity (MPa) 429.76
Poisson’s ratio 0.196
3.5. STACK PRISM
Three specimens of stack prisms were tested to determine their compressive strength,
modulus of elasticity and Poisson’s ratio. The dimensions of the tested prism were 276 x 280
x 133 mm3, all the three samples were measured on the day of testing. The size of the brick
units are 276 x 133 x 43 mm3 and the thickness of the mortar was at an average of 10 mm. A
layer of hard mortar (12.5 mm) made of Sika fast fix-130 TP was laid on top and at the
bottom of the prism to have uniform surface during load application, eliminating any surface
irregularities. All the three samples were tested under displacement control in order to obtain

Numerical Modelling of Experimental Tests on Cylindrical Masonry Specimens
Erasmus Mundus Programme
28 ADVANCED MASTERS IN STRUCTURAL ANALYSIS OF MONUMENTS AND HISTORICAL CONSTRUCTIONS
the post peak behaviour. The brick units and the mortar investigated earlier were used to
construct the prisms.
Each prism had five brick units, with four layers of lime mortar and hard layer of mortar on
top and in the bottom. The testing was carried out at the age of 61 days. 6 LVDT’s were used
to measure the displacement in the horizontal and vertical directions, with the aim to
determine the Poisson’s ratio. The prism was subjected to cyclic loading and unloading for
five cycles, to determine the modulus of elasticity.
The Poisson’s ratio and the modulus elasticity were not determined in first stack prism, since
it was used to perform the pilot test just to obtain the compressive strength. For stack prism 2
and 3 modulus of elasticity and Poisson’s ratio were calculated. The loading was applied
under displacement control at the rate of 0.003 mm/sec, to obtain the post peak response of
the prism. The results of the compressive strength are shown in Table 3.8.
Table 3.8 Experimental results of the compressive test on stack prisms
Specimen Area (mm2) Fmax (kN) Compressive
strength (MPa)
Stack prism 1 37125 328.28 8.84
Stack prism 2 37125 308.96 8.32
Stack prism 3 37125 324.83 8.75
Average 37125 320.69 8.64
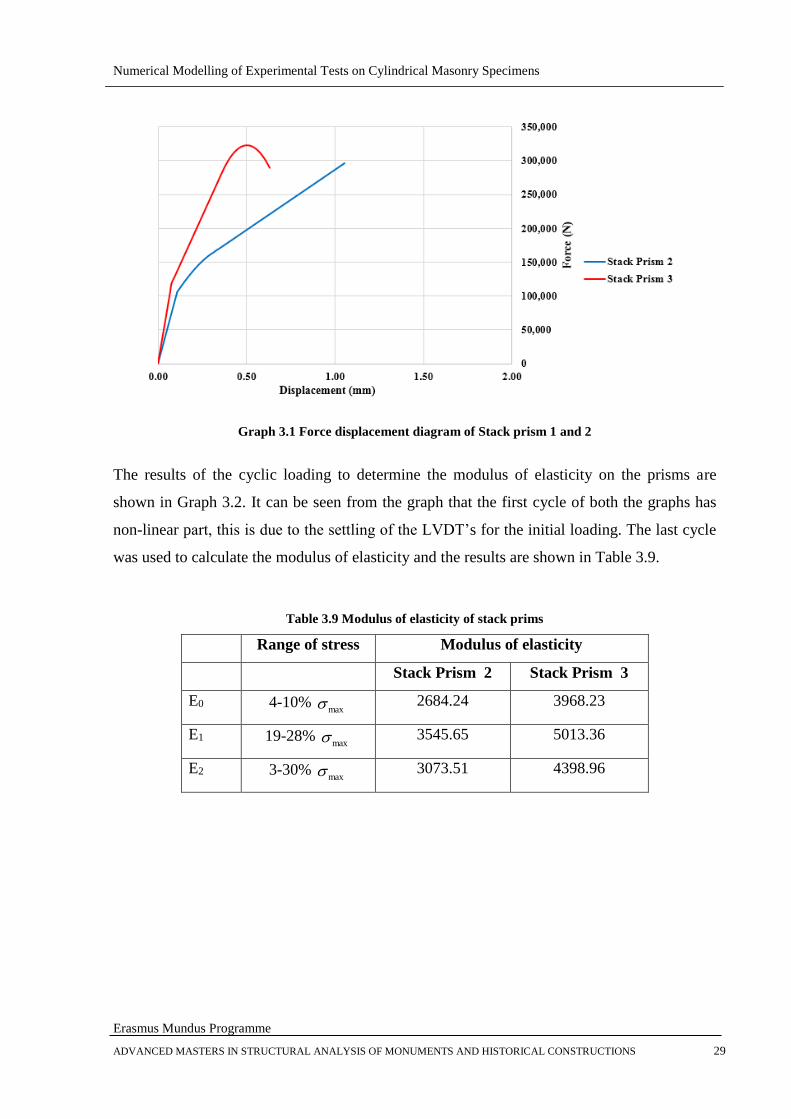
The load displacement graph of prism 1 and prism 2 are shown in Graph 3.1. But
unfortunately none of the experiments were able to capture the post peak behaviour, since the
LVDT’s were either removed or detached from the prism after the maximum load was
reached, in order not to damage the measuring instruments.
Numerical Modelling of Experimental Tests on Cylindrical Masonry Specimens
Erasmus Mundus Programme
ADVANCED MASTERS IN STRUCTURAL ANALYSIS OF MONUMENTS AND HISTORICAL CONSTRUCTIONS 29
Graph 3.1 Force displacement diagram of Stack prism 1 and 2
The results of the cyclic loading to determine the modulus of elasticity on the prisms are
shown in Graph 3.2. It can be seen from the graph that the first cycle of both the graphs has
non-linear part, this is due to the settling of the LVDT’s for the initial loading. The last cycle
was used to calculate the modulus of elasticity and the results are shown in Table 3.9.
Table 3.9 Modulus of elasticity of stack prims
Range of stress Modulus of elasticity
Stack Prism 2 Stack Prism 3
E0 4-10% max 2684.24 3968.23
E1 19-28% max 3545.65 5013.36
E2 3-30% max 3073.51 4398.96

Numerical Modelling of Experimental Tests on Cylindrical Masonry Specimens
Erasmus Mundus Programme
30 ADVANCED MASTERS IN STRUCTURAL ANALYSIS OF MONUMENTS AND HISTORICAL CONSTRUCTIONS
Graph 3.2 Loading and unloading cycle for Stack prisms
Three similar types of failures were observed in the three prisms tested. All the failures
occurred in the brick and not in the mortar. The prism was investigated after the failure. The
prism as a whole was observed to be very fragile, since the test was continued till the end of
the residual strength.
(a)
(b)
Figure 3.6 Failure of prisms (a)(a) Stack prism 2 & (b) Stack prism 3
In prism one the failure originated in the left quarter of the second brick from the top and
propagated throughout the height of the specimen. In the second prism the failure occurred in
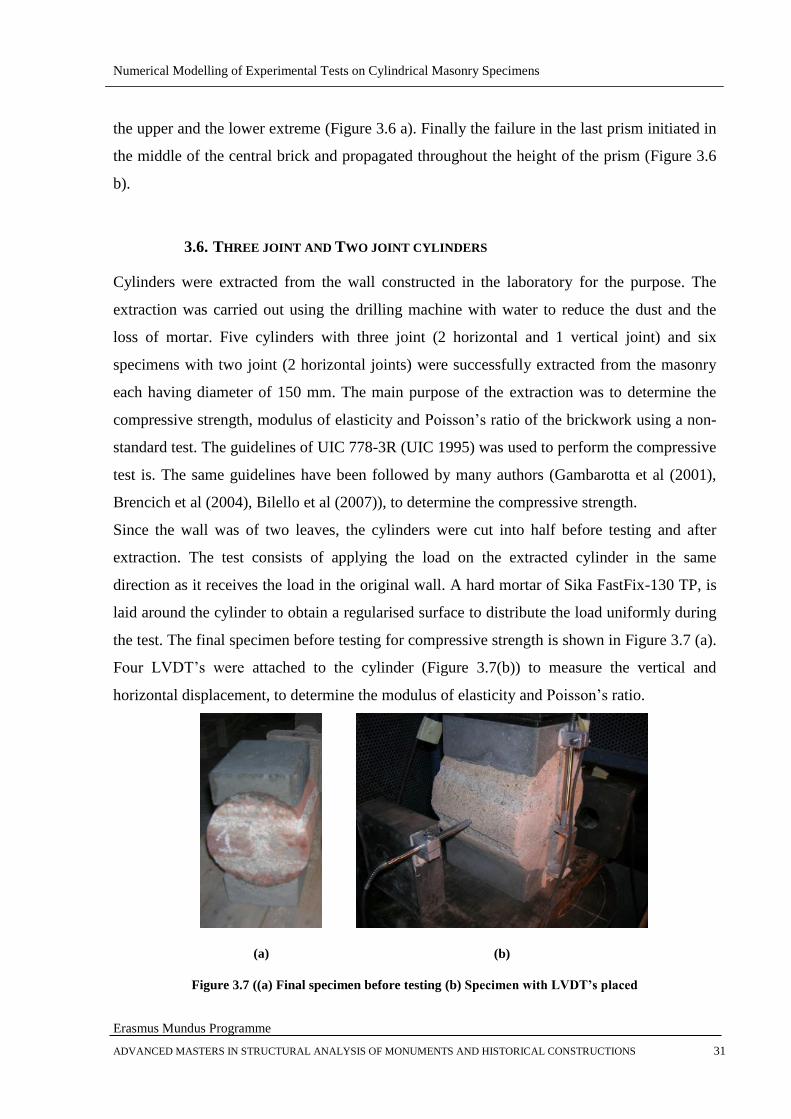
Numerical Modelling of Experimental Tests on Cylindrical Masonry Specimens
Erasmus Mundus Programme
ADVANCED MASTERS IN STRUCTURAL ANALYSIS OF MONUMENTS AND HISTORICAL CONSTRUCTIONS 31
the upper and the lower extreme (Figure 3.6 a). Finally the failure in the last prism initiated in
the middle of the central brick and propagated throughout the height of the prism (Figure 3.6
b).
3.6. THREE JOINT AND TWO JOINT CYLINDERS
Cylinders were extracted from the wall constructed in the laboratory for the purpose. The
extraction was carried out using the drilling machine with water to reduce the dust and the
loss of mortar. Five cylinders with three joint (2 horizontal and 1 vertical joint) and six
specimens with two joint (2 horizontal joints) were successfully extracted from the masonry
each having diameter of 150 mm. The main purpose of the extraction was to determine the
compressive strength, modulus of elasticity and Poisson’s ratio of the brickwork using a non-
standard test. The guidelines of UIC 778-3R (UIC 1995) was used to perform the compressive
test is. The same guidelines have been followed by many authors (Gambarotta et al (2001),
Brencich et al (2004), Bilello et al (2007)), to determine the compressive strength.
Since the wall was of two leaves, the cylinders were cut into half before testing and after
extraction. The test consists of applying the load on the extracted cylinder in the same
direction as it receives the load in the original wall. A hard mortar of Sika FastFix-130 TP, is
laid around the cylinder to obtain a regularised surface to distribute the load uniformly during
the test. The final specimen before testing for compressive strength is shown in Figure 3.7 (a).
Four LVDT’s were attached to the cylinder (Figure 3.7(b)) to measure the vertical and
horizontal displacement, to determine the modulus of elasticity and Poisson’s ratio.
(a)
(b)
Figure 3.7 ((a) Final specimen before testing (b) Specimen with LVDT’s placed
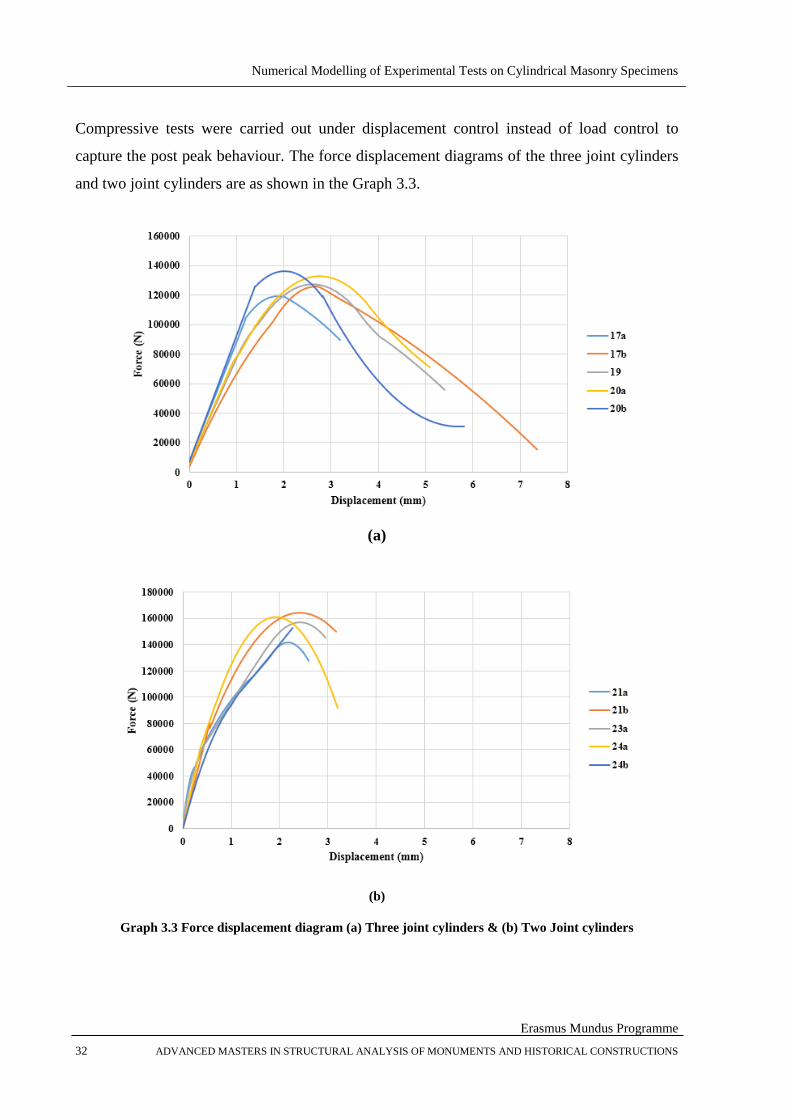
Numerical Modelling of Experimental Tests on Cylindrical Masonry Specimens
Erasmus Mundus Programme
32 ADVANCED MASTERS IN STRUCTURAL ANALYSIS OF MONUMENTS AND HISTORICAL CONSTRUCTIONS
Compressive tests were carried out under displacement control instead of load control to
capture the post peak behaviour. The force displacement diagrams of the three joint cylinders
and two joint cylinders are as shown in the Graph 3.3.
(a)
(b)
Graph 3.3 Force displacement diagram (a) Three joint cylinders & (b) Two Joint cylinders

Numerical Modelling of Experimental Tests on Cylindrical Masonry Specimens
Erasmus Mundus Programme
ADVANCED MASTERS IN STRUCTURAL ANALYSIS OF MONUMENTS AND HISTORICAL CONSTRUCTIONS 33
The obtained results were compared with A. Brencich & Sterpi (2006). The main discussion
on the analysis of the experimental results was to determine, the area to be considered for
compressive strength, which is the aim of the present thesis too. The two areas considered in
determining the experimental results are the diametric area of the specimen and the area
below the loaded cap. The results are shown in Table 3.10, where maxF is the maximum load,
1A is the diametric area of the specimen and 2A is the area below the loaded cap .It is clear
that if the area of loaded cap is taken into consideration the compressive strength increases by
25%. In order to understand better the distribution of stresses and to finalise the area to be
considered for the calculation, numerical analysis is carried out.
Table 3.10 Experimental results of three joint and two joint cylinders
Specimen maxF Area (A1)
mm2
Area (A2)
mm2
Compressive
strength (MPa)
Compressive
strength (MPa)
Three Joint
specimens
133.30 19500 15600 6.84 8.55
Two Joint
specimens
157.87 19500 15600 8.10 10.12
The initiation of cracks in the experiments were observed in the lateral parts of the cylinder,
right below the regularisation mortar. As the load was increased, the cracks increased their
width and finally detached from the cylinder, before reaching the maximum load. Apart from
these main cracks, several micro cracks were distributed throughout the cylinder by the end of
the experiment. The final specimen at the end was a prism with the width equal to
regularisation mortar as shown in Figure 3.8.
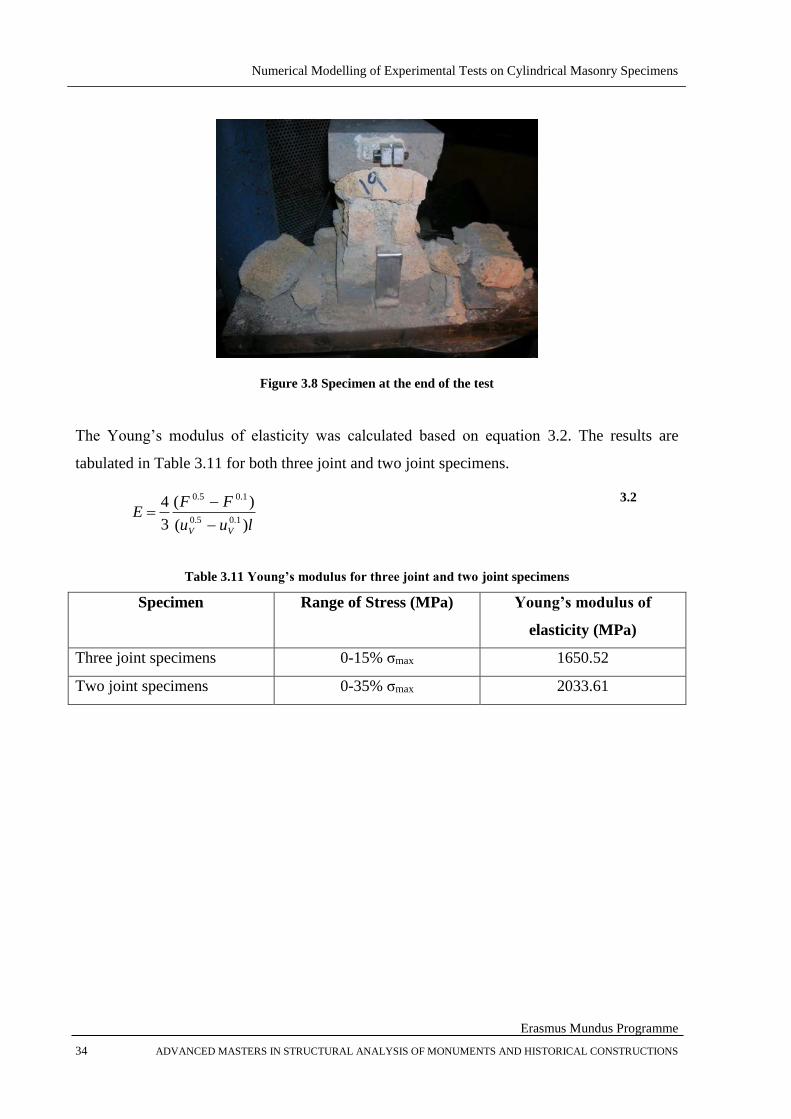
Numerical Modelling of Experimental Tests on Cylindrical Masonry Specimens
Erasmus Mundus Programme
34 ADVANCED MASTERS IN STRUCTURAL ANALYSIS OF MONUMENTS AND HISTORICAL CONSTRUCTIONS
Figure 3.8 Specimen at the end of the test
The Young’s modulus of elasticity was calculated based on equation 3.2. The results are
tabulated in Table 3.11 for both three joint and two joint specimens.
luu
FFE
VV )(
)(
3
41.05.0
1.05.0
3.2
Table 3.11 Young’s modulus for three joint and two joint specimens
Specimen Range of Stress (MPa) Young’s modulus of
elasticity (MPa)
Three joint specimens 0-15% σmax 1650.52
Two joint specimens 0-35% σmax 2033.61
Numerical Modelling of Experimental Tests on Cylindrical Masonry Specimens
Erasmus Mundus Programme
ADVANCED MASTERS IN STRUCTURAL ANALYSIS OF MONUMENTS AND HISTORICAL CONSTRUCTIONS 35
4. NUMERICAL ANALYSIS
4.1. INTRODUCTION
Finite element models (FEM) are able to capture some aspects which are unable to be
captured in the experimental testing. To perform the numerical analysis it is necessary to
know the mechanical parameters of mortar and brick. These parameters are the compressive
strength, tensile strength, young’s modulus, Poisson’s ratio, compressive fracture energy and
tensile fracture energy.
Masonry can be modelled in three types. The first type is micro modelling where the brick,
mortar and the interface layer is studied individually to access the behaviour of the masonry.
The second type is the meso scale modelling where the interface and the units are clubbed
together to study as single entity and the brick separately. The final type is the macro
modelling where the entities for the brick and mortar is homogenised as a continuum.
To model masonry using finite element technique, three parts need to be carefully examined
(1) Behaviour of clay bricks (2) Behaviour of mortar joints and (3) Mechanisms of joint
failure (Page - 1978). The numerical modelling is a necessity to study the triaxial compressive
state in mortar and the uniaxial compression and biaxial tension state in brick, allowing us to
study the stress distribution as a whole. Since mortar joints act as plane of weakness, the
structural response of masonry depends on the orientation of mortar joint.
4.2. CONSTITUTIVE LAW
The damage model used is of Faria et al (1998), where they consider the split of stress tensor
into tension and compression. It is performed to capture the unilateral behaviour of the
material when it passes from tension to compression. The split of effective stress tensor
into tension and compression is done according to Ortiz (1985) is presented in equation 4.1
and equation 4.2.
ii
i
pp
`
4.1
4.2
Numerical Modelling of Experimental Tests on Cylindrical Masonry Specimens
Erasmus Mundus Programme
36 ADVANCED MASTERS IN STRUCTURAL ANALYSIS OF MONUMENTS AND HISTORICAL CONSTRUCTIONS
Where i denotes the ith principle stress extracted from tensor and ip corresponds to the
unit vector for the associated principle direction. Are the Macaulay brackets, which
returns the value if positive or zero if negative. The constitutive law is as shown in equation
4.3.
)1()1( dd 4.3
The split of the stress is defined according to equation 4.4 and equation 4.5, where equation
4.4 represents the tensile stress and equation 4.5 represents the compressive stresses.
)1( d
)1( d
4.4
4.5
This derivation is based on Helmholtz free energy potential of the form
)()1()()1(),,( 00 dddd 4.6
Where )(0 and )(0 are the elastic free energies, which are defined according to
0:
2
1::
2
1)( 1
0 C
0:2
1::
2
1)( 1
0 C
4.7
4.8
The internal variables consist of plastic strain tensor , d and d the scalar damage
variables linked directly to the tensile and compressive deteriorations assumed as independent
variables. Strain tensor is the only single variable admitted.
During any loading process the dissipation of energy is always positive, which states the
entropy increases leading to an irreversible process, according to second principle of
thermodynamics. The dissipation for an isothermic elasto-damageable process is of the form
as shown in equation 4.9, which is according to Clausius-Duhem inequality
0:: 00
ddD
4.9
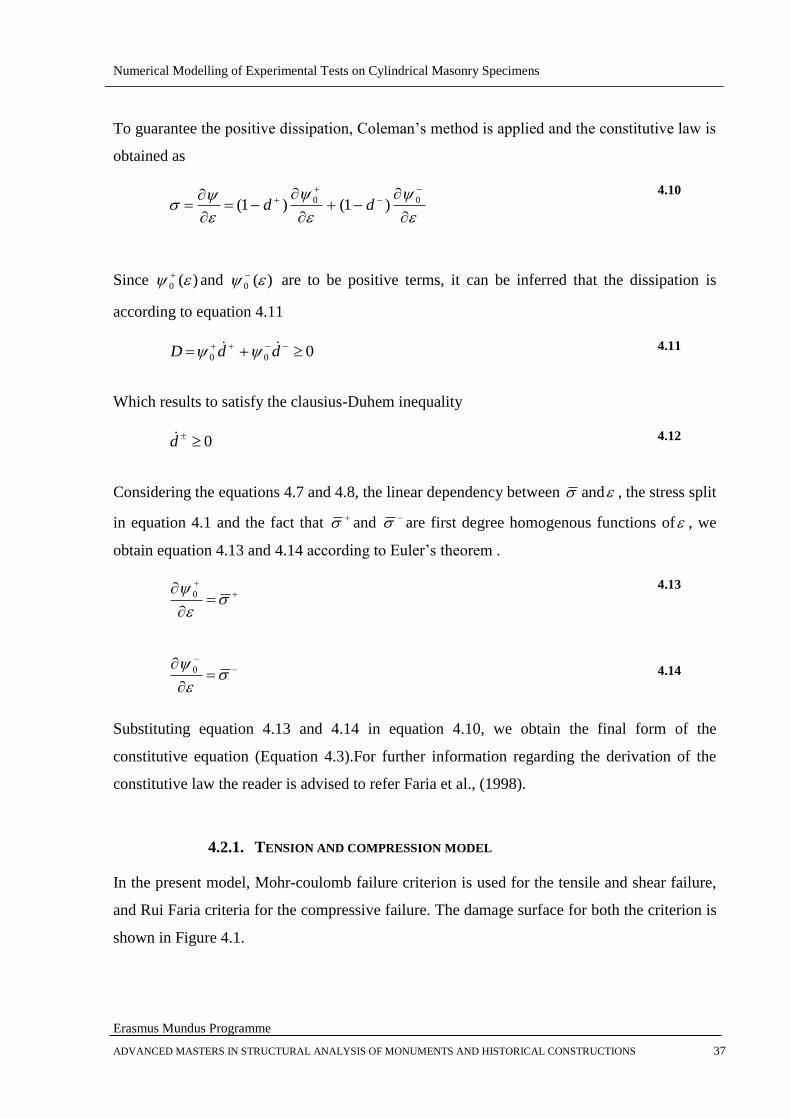
Numerical Modelling of Experimental Tests on Cylindrical Masonry Specimens
Erasmus Mundus Programme
ADVANCED MASTERS IN STRUCTURAL ANALYSIS OF MONUMENTS AND HISTORICAL CONSTRUCTIONS 37
To guarantee the positive dissipation, Coleman’s method is applied and the constitutive law is
obtained as
00 )1()1( dd
4.10
Since )(0 and )(0 are to be positive terms, it can be inferred that the dissipation is
according to equation 4.11
000 ddD 4.11
Which results to satisfy the clausius-Duhem inequality
0d 4.12
Considering the equations 4.7 and 4.8, the linear dependency between and , the stress split
in equation 4.1 and the fact that and are first degree homogenous functions of , we
obtain equation 4.13 and 4.14 according to Euler’s theorem .
0
0
4.13
4.14
Substituting equation 4.13 and 4.14 in equation 4.10, we obtain the final form of the
constitutive equation (Equation 4.3).For further information regarding the derivation of the
constitutive law the reader is advised to refer Faria et al., (1998).
4.2.1. TENSION AND COMPRESSION MODEL
In the present model, Mohr-coulomb failure criterion is used for the tensile and shear failure,
and Rui Faria criteria for the compressive failure. The damage surface for both the criterion is
shown in Figure 4.1.
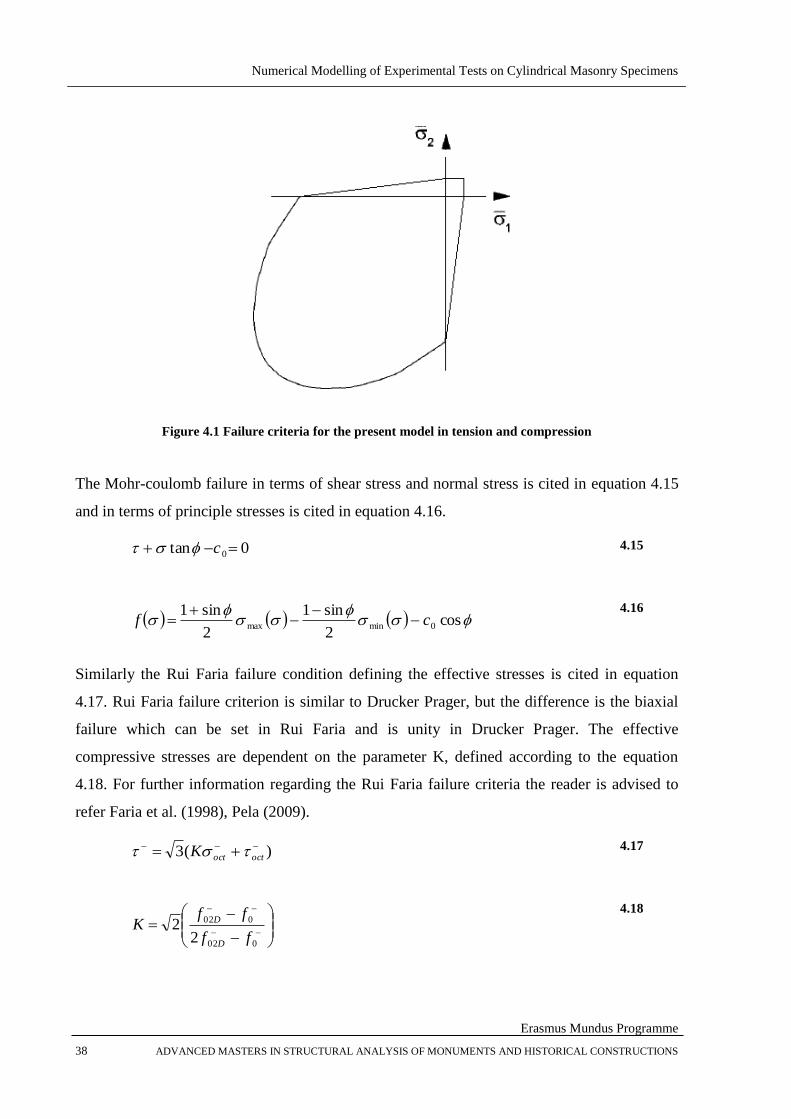
Numerical Modelling of Experimental Tests on Cylindrical Masonry Specimens
Erasmus Mundus Programme
38 ADVANCED MASTERS IN STRUCTURAL ANALYSIS OF MONUMENTS AND HISTORICAL CONSTRUCTIONS
Figure 4.1 Failure criteria for the present model in tension and compression
The Mohr-coulomb failure in terms of shear stress and normal stress is cited in equation 4.15
and in terms of principle stresses is cited in equation 4.16.
0tan 0 c 4.15
cos
2
sin1
2
sin10minmax cf
4.16
Similarly the Rui Faria failure condition defining the effective stresses is cited in equation
4.17. Rui Faria failure criterion is similar to Drucker Prager, but the difference is the biaxial
failure which can be set in Rui Faria and is unity in Drucker Prager. The effective
compressive stresses are dependent on the parameter K, defined according to the equation
4.18. For further information regarding the Rui Faria failure criteria the reader is advised to
refer Faria et al. (1998), Pela (2009).
)(3 octoctK 4.17
002
002
22
ff
ffK
D
D
4.18
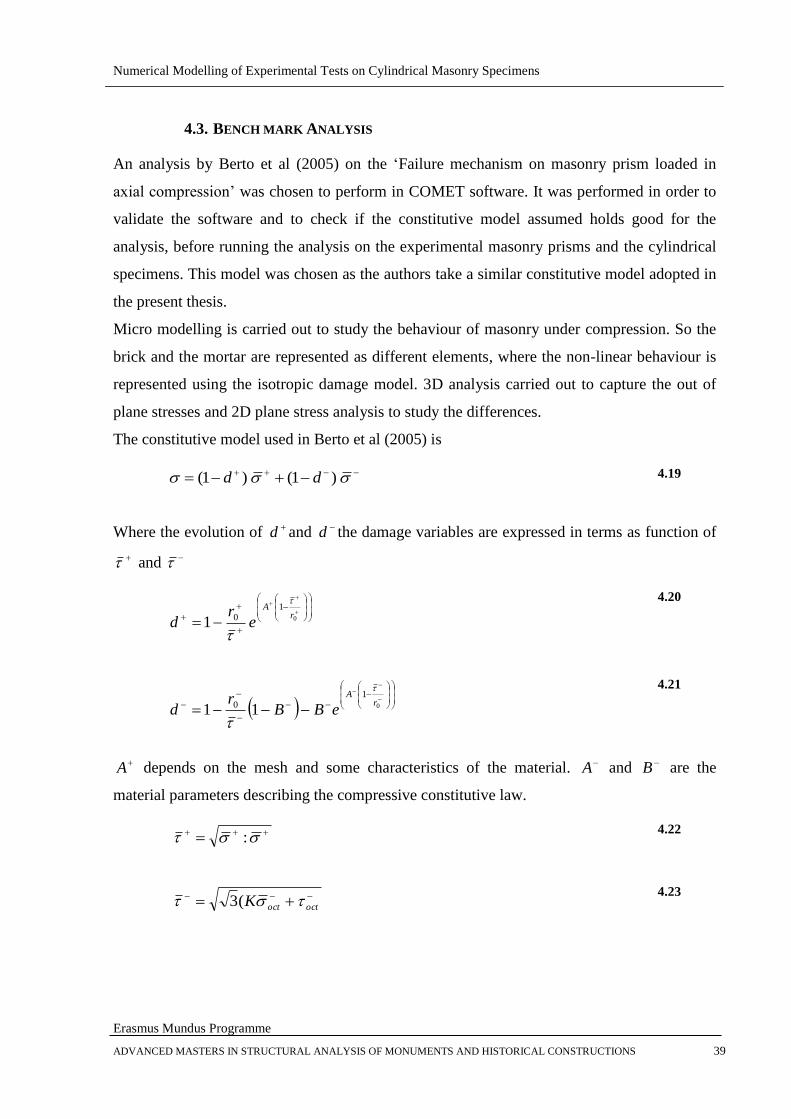
Numerical Modelling of Experimental Tests on Cylindrical Masonry Specimens
Erasmus Mundus Programme
ADVANCED MASTERS IN STRUCTURAL ANALYSIS OF MONUMENTS AND HISTORICAL CONSTRUCTIONS 39
4.3. BENCH MARK ANALYSIS
An analysis by Berto et al (2005) on the ‘Failure mechanism on masonry prism loaded in
axial compression’ was chosen to perform in COMET software. It was performed in order to
validate the software and to check if the constitutive model assumed holds good for the
analysis, before running the analysis on the experimental masonry prisms and the cylindrical
specimens. This model was chosen as the authors take a similar constitutive model adopted in
the present thesis.
Micro modelling is carried out to study the behaviour of masonry under compression. So the
brick and the mortar are represented as different elements, where the non-linear behaviour is
represented using the isotropic damage model. 3D analysis carried out to capture the out of
plane stresses and 2D plane stress analysis to study the differences.
The constitutive model used in Berto et al (2005) is
)1()1( dd 4.19
Where the evolution of d and d the damage variables are expressed in terms as function of
and
0
101
rA
er
d
4.20
0
10 11
rA
eBBr
d
4.21
A depends on the mesh and some characteristics of the material. A and B are the
material parameters describing the compressive constitutive law.
: 4.22
octoctK (3 4.23
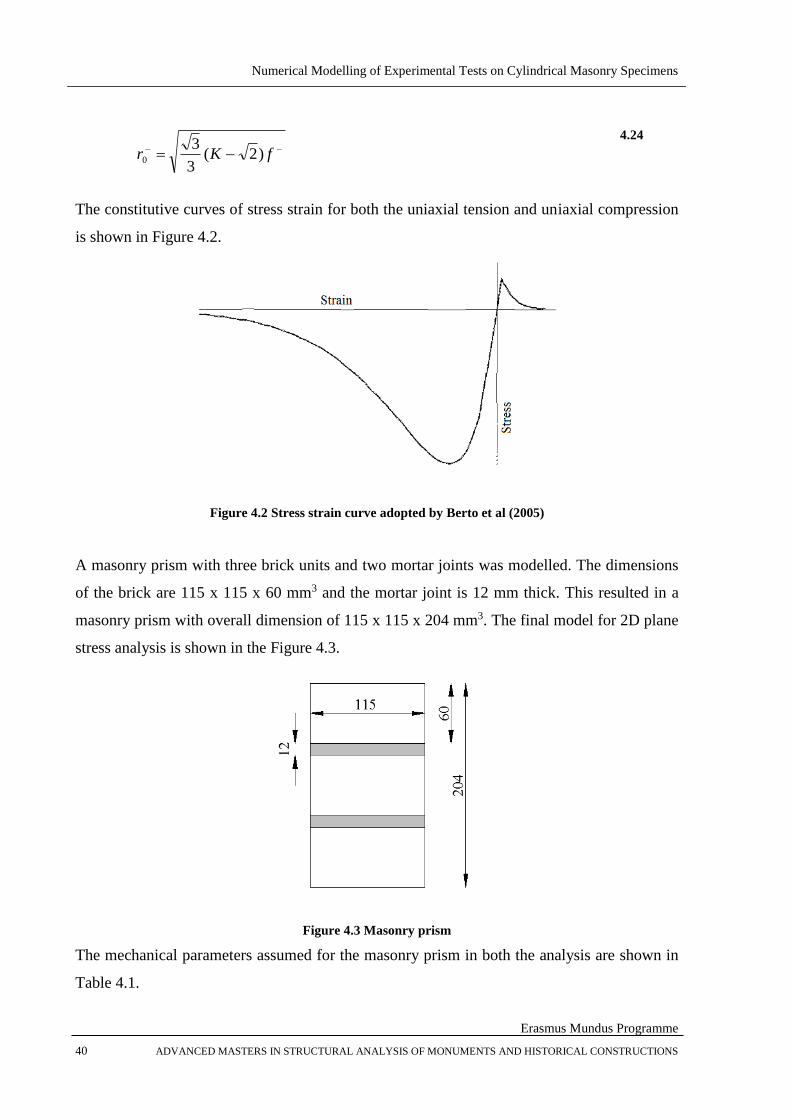
Numerical Modelling of Experimental Tests on Cylindrical Masonry Specimens
Erasmus Mundus Programme
40 ADVANCED MASTERS IN STRUCTURAL ANALYSIS OF MONUMENTS AND HISTORICAL CONSTRUCTIONS
fKr )2(
3
30
4.24
The constitutive curves of stress strain for both the uniaxial tension and uniaxial compression
is shown in Figure 4.2.
Figure 4.2 Stress strain curve adopted by Berto et al (2005)
A masonry prism with three brick units and two mortar joints was modelled. The dimensions
of the brick are 115 x 115 x 60 mm3 and the mortar joint is 12 mm thick. This resulted in a
masonry prism with overall dimension of 115 x 115 x 204 mm3. The final model for 2D plane
stress analysis is shown in the Figure 4.3.
Figure 4.3 Masonry prism
The mechanical parameters assumed for the masonry prism in both the analysis are shown in
Table 4.1.

Numerical Modelling of Experimental Tests on Cylindrical Masonry Specimens
Erasmus Mundus Programme
ADVANCED MASTERS IN STRUCTURAL ANALYSIS OF MONUMENTS AND HISTORICAL CONSTRUCTIONS 41
Table 4.1 Mechanical parameter for the prism
Berto et al (2005) Present thesis
Mortar Brick Mortar Brick
Young’s Modulus (MPa) E = 6000 E = 15000 E = 6000 E = 15000
Poisson’s Ratio ν = 0.3 ν = 0.1 ν = 0.3 ν = 0.1
Uniaxial compressive
strength (MPa)
51
Df 9.141
Df 51
Df 9.141
Df
Uniaxial tensile strength
(MPa)
3.10 f 4.10 f 3.10 f 4.10 f
Tensile fracture energy
(N/mm)
06.0fG 08.0fG 081.0fG 108.0fG
Compressive fracture
energy (N/mm)
845.0CG 10CG
Compression parameter A 1A 9.0A - -
Compression parameter B 1.1B 6.1B - -
Ratio
D
D
f
f
1
2 25.10 R 1.10 R 25.10 R 25.10 R
Compressive damage
threshold/ Compressive
strength ratio
- - 0.3 0.3
As shown in the table most of the values are same as taken in Berto et al (2005). The only
variations of mechanical parameters are the values of compressive fracture energy and the
tensile fracture energy. Berto et al assume the fracture energy only below plastic zone of
stress displacement diagram. But the present software COMET assumes the fracture energy as
the area below the stress displacement graph under both the elastic and the plastic zone. As a
result the values for fG and CG have higher values than the model in Berto et al (2005). This
increment was calculated based on an analysis by trial and error method. The analysis was
carried out on a simple triangular element assuming the same mechanical parameters until the
stress strain graph of both the models matched. Once the graphs were matched the area below
the stress displacement graph was calculated and taken as the fracture energy for both the
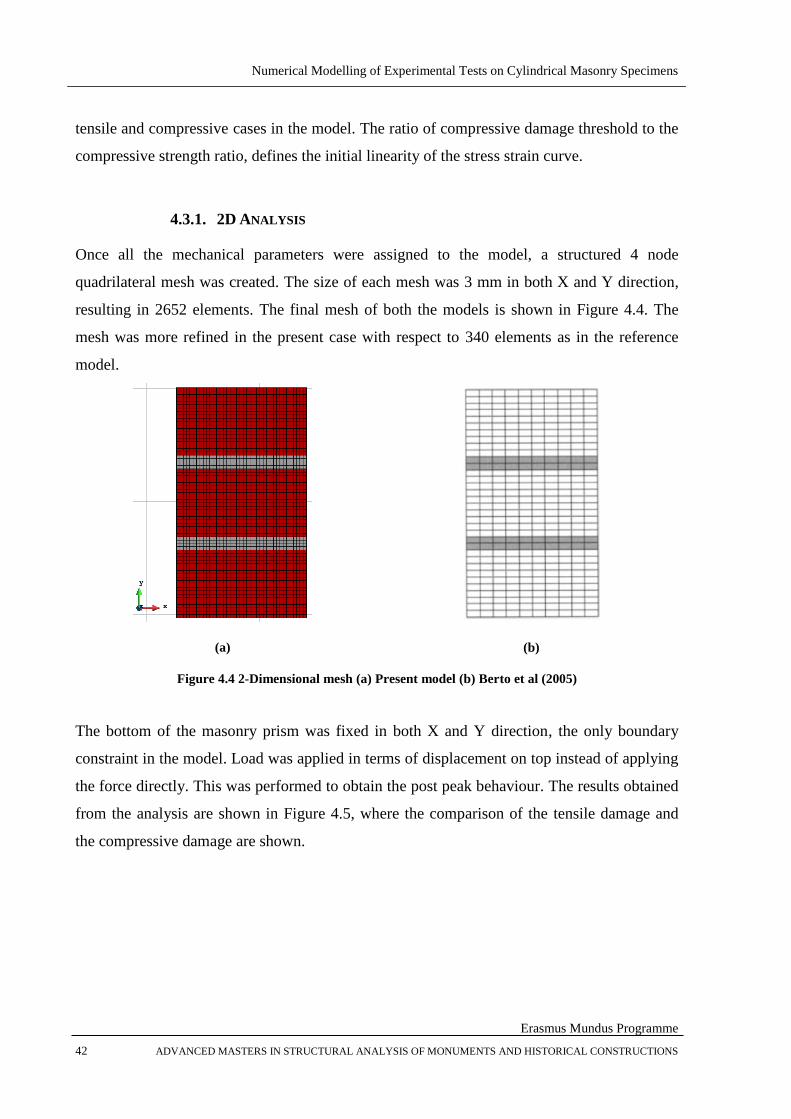
Numerical Modelling of Experimental Tests on Cylindrical Masonry Specimens
Erasmus Mundus Programme
42 ADVANCED MASTERS IN STRUCTURAL ANALYSIS OF MONUMENTS AND HISTORICAL CONSTRUCTIONS
tensile and compressive cases in the model. The ratio of compressive damage threshold to the
compressive strength ratio, defines the initial linearity of the stress strain curve.
4.3.1. 2D ANALYSIS
Once all the mechanical parameters were assigned to the model, a structured 4 node
quadrilateral mesh was created. The size of each mesh was 3 mm in both X and Y direction,
resulting in 2652 elements. The final mesh of both the models is shown in Figure 4.4. The
mesh was more refined in the present case with respect to 340 elements as in the reference
model.
(a)
(b)
Figure 4.4 2-Dimensional mesh (a) Present model (b) Berto et al (2005)
The bottom of the masonry prism was fixed in both X and Y direction, the only boundary
constraint in the model. Load was applied in terms of displacement on top instead of applying
the force directly. This was performed to obtain the post peak behaviour. The results obtained
from the analysis are shown in Figure 4.5, where the comparison of the tensile damage and
the compressive damage are shown.

Numerical Modelling of Experimental Tests on Cylindrical Masonry Specimens
Erasmus Mundus Programme
ADVANCED MASTERS IN STRUCTURAL ANALYSIS OF MONUMENTS AND HISTORICAL CONSTRUCTIONS 43
(a)
(b)
(c)
(d)
Figure 4.5 2D Plane stress analysis: contours of the damage variable at failure (a) & (b) Compressive
damage d of present and Berto model (c) & (d) Tensile damage
d of present and Berto model
As it can be seen from the figures, the failure is due to the compression in mortar joints than
the tensile damage of the brick. The tensile damage is concentrated near the edges of the
mortar joint and in the middle of the central brick, even though the damage in the central
brick is half of the mortar damage. This is due to, the plane stress analysis which is unable to
capture the real behaviour of the masonry in compression viz. the confining effect of the
stresses in the out of plane direction of the prism. This results, in underestimation of the
compressive strength of the mortar and delays the failure of the bricks in tension.

Numerical Modelling of Experimental Tests on Cylindrical Masonry Specimens
Erasmus Mundus Programme
44 ADVANCED MASTERS IN STRUCTURAL ANALYSIS OF MONUMENTS AND HISTORICAL CONSTRUCTIONS
The maximum compressive stress obtained from the analysis is 5.88 MPa, corresponding to a
displacement of 0.12 mm and the tensile stress is 0.6 MPa. The tensile stress and the
compressive stresses at this peak is shown in Figure 4.6.
(a)
(b)
Figure 4.6 2D Plane stress analysis (a) Compressive stress distribution & (b) Tensile stress distribution
The stress strain distribution is shown in Graph 4.1. It can be clearly seen from the graph that
both the analysis gives almost the same results. The Berto analysis does not give any
softening curve. This is due to the fact that the compressive fracture energy of mortar is just
sufficient enough to cause the failure and obtain a slightly inclined straight line.
Graph 4.1 2D Plane stress analysis: Stress strain diagram
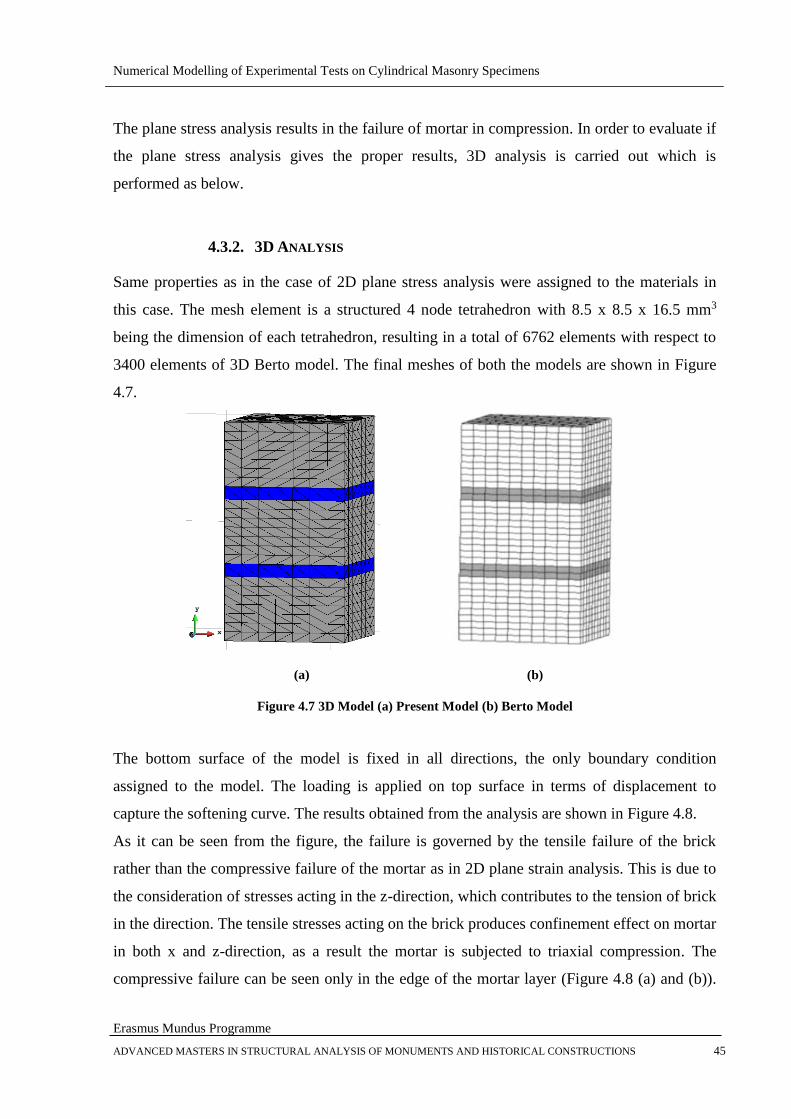
Numerical Modelling of Experimental Tests on Cylindrical Masonry Specimens
Erasmus Mundus Programme
ADVANCED MASTERS IN STRUCTURAL ANALYSIS OF MONUMENTS AND HISTORICAL CONSTRUCTIONS 45
The plane stress analysis results in the failure of mortar in compression. In order to evaluate if
the plane stress analysis gives the proper results, 3D analysis is carried out which is
performed as below.
4.3.2. 3D ANALYSIS
Same properties as in the case of 2D plane stress analysis were assigned to the materials in
this case. The mesh element is a structured 4 node tetrahedron with 8.5 x 8.5 x 16.5 mm3
being the dimension of each tetrahedron, resulting in a total of 6762 elements with respect to
3400 elements of 3D Berto model. The final meshes of both the models are shown in Figure
4.7.
(a)
(b)
Figure 4.7 3D Model (a) Present Model (b) Berto Model
The bottom surface of the model is fixed in all directions, the only boundary condition
assigned to the model. The loading is applied on top surface in terms of displacement to
capture the softening curve. The results obtained from the analysis are shown in Figure 4.8.
As it can be seen from the figure, the failure is governed by the tensile failure of the brick
rather than the compressive failure of the mortar as in 2D plane strain analysis. This is due to
the consideration of stresses acting in the z-direction, which contributes to the tension of brick
in the direction. The tensile stresses acting on the brick produces confinement effect on mortar
in both x and z-direction, as a result the mortar is subjected to triaxial compression. The
compressive failure can be seen only in the edge of the mortar layer (Figure 4.8 (a) and (b)).
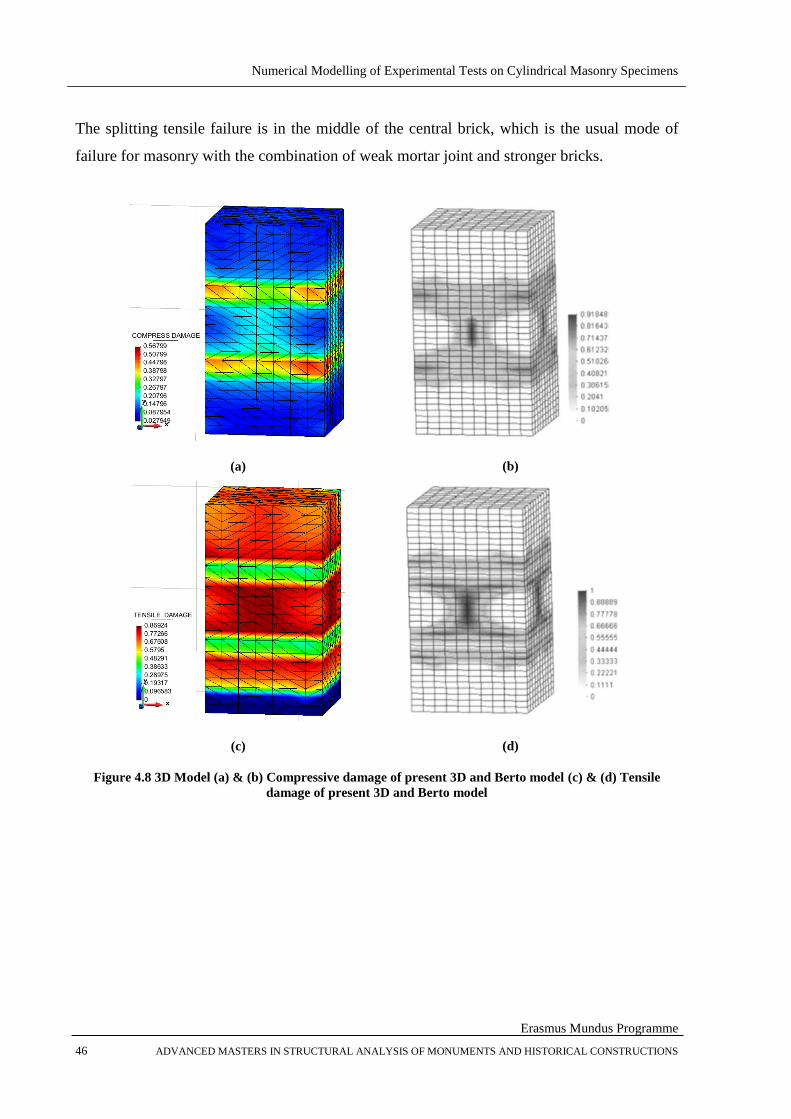
Numerical Modelling of Experimental Tests on Cylindrical Masonry Specimens
Erasmus Mundus Programme
46 ADVANCED MASTERS IN STRUCTURAL ANALYSIS OF MONUMENTS AND HISTORICAL CONSTRUCTIONS
The splitting tensile failure is in the middle of the central brick, which is the usual mode of
failure for masonry with the combination of weak mortar joint and stronger bricks.
(a)
(b)
(c)
(d)
Figure 4.8 3D Model (a) & (b) Compressive damage of present 3D and Berto model (c) & (d) Tensile
damage of present 3D and Berto model
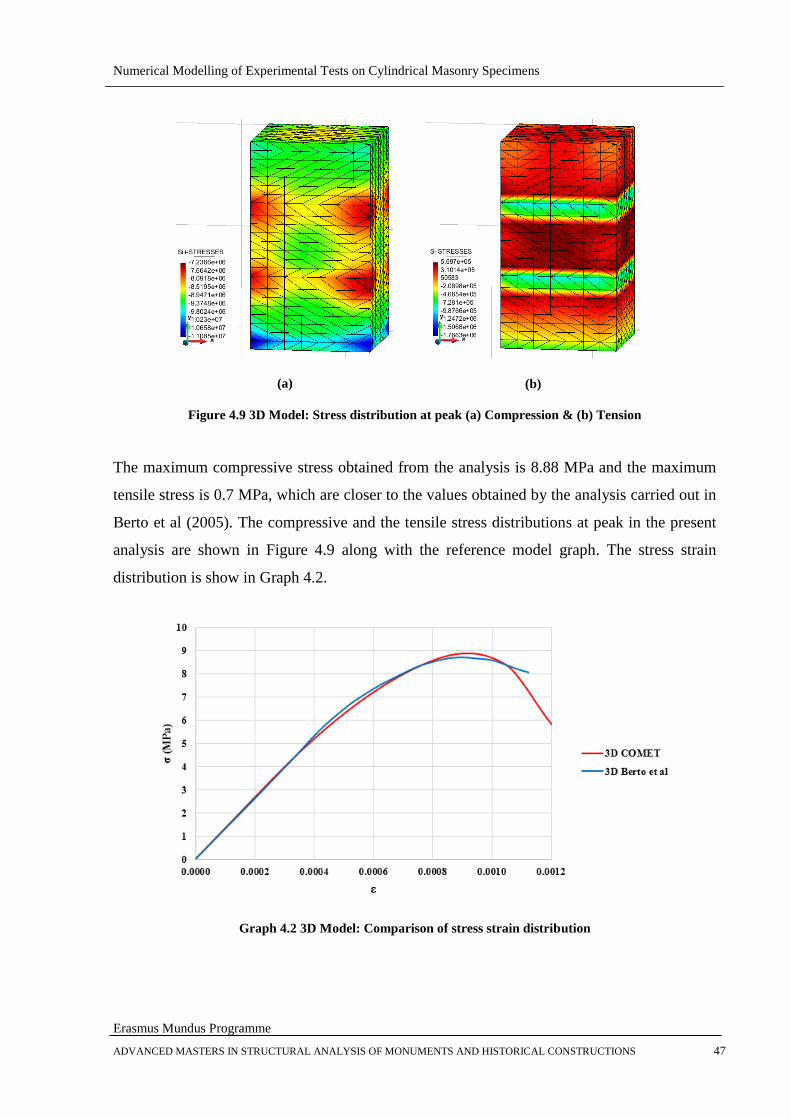
Numerical Modelling of Experimental Tests on Cylindrical Masonry Specimens
Erasmus Mundus Programme
ADVANCED MASTERS IN STRUCTURAL ANALYSIS OF MONUMENTS AND HISTORICAL CONSTRUCTIONS 47
(a)
(b)
Figure 4.9 3D Model: Stress distribution at peak (a) Compression & (b) Tension
The maximum compressive stress obtained from the analysis is 8.88 MPa and the maximum
tensile stress is 0.7 MPa, which are closer to the values obtained by the analysis carried out in
Berto et al (2005). The compressive and the tensile stress distributions at peak in the present
analysis are shown in Figure 4.9 along with the reference model graph. The stress strain
distribution is show in Graph 4.2.
Graph 4.2 3D Model: Comparison of stress strain distribution

Numerical Modelling of Experimental Tests on Cylindrical Masonry Specimens
Erasmus Mundus Programme
48 ADVANCED MASTERS IN STRUCTURAL ANALYSIS OF MONUMENTS AND HISTORICAL CONSTRUCTIONS
4.3.3. RESULTS AND DISCUSSION
The stress strain diagrams in 2D and 3D analysis are shown in Graph 4.3. The compressive
strength of the prism obtained from the present 3D analysis is 8.88 MPa in comparison to the
compressive strength obtained from 2D analysis with 5.80 MPa, with an error of 34.68%. But
the strength is lower than the strength of brick (14.9 MPa) and greater than the strength of
mortar (5.0 MPa), is as expected from a weak mortar and strong brick combination. The 2D
plane stress analysis results not only in lower compressive strength but also in wrong failure
mode of the model viz. the compressive failure of the mortar than the tensile failure of the
brick.
Graph 4.3 Comparison of Stress strain graph by GiD and Berto et al (2005)
The main purpose here was to compare the results obtained from the analysis carried out by
Berto et al (2005) and the results from the present analysis carried out in COMET. It can be
concluded that after comparing the results of tensile damage, compressive damage, tensile
stress distribution and the compressive stress distribution the results match almost in perfect.
The only modification which was needed to be carried out is the estimation of fracture energy
for tension and in compression. With the results compared, it can be concluded that the
software is validated for the prism and cylindrical analysis to be carried out.
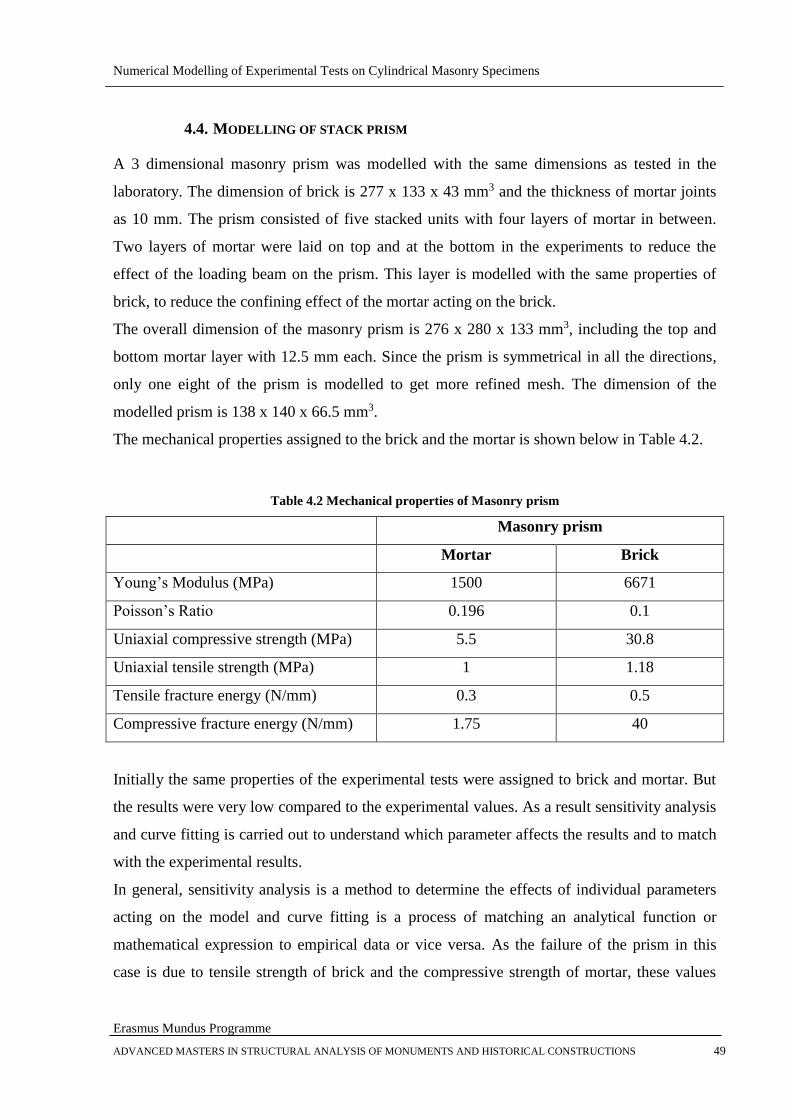
Numerical Modelling of Experimental Tests on Cylindrical Masonry Specimens
Erasmus Mundus Programme
ADVANCED MASTERS IN STRUCTURAL ANALYSIS OF MONUMENTS AND HISTORICAL CONSTRUCTIONS 49
4.4. MODELLING OF STACK PRISM
A 3 dimensional masonry prism was modelled with the same dimensions as tested in the
laboratory. The dimension of brick is 277 x 133 x 43 mm3 and the thickness of mortar joints
as 10 mm. The prism consisted of five stacked units with four layers of mortar in between.
Two layers of mortar were laid on top and at the bottom in the experiments to reduce the
effect of the loading beam on the prism. This layer is modelled with the same properties of
brick, to reduce the confining effect of the mortar acting on the brick.
The overall dimension of the masonry prism is 276 x 280 x 133 mm3, including the top and
bottom mortar layer with 12.5 mm each. Since the prism is symmetrical in all the directions,
only one eight of the prism is modelled to get more refined mesh. The dimension of the
modelled prism is 138 x 140 x 66.5 mm3.
The mechanical properties assigned to the brick and the mortar is shown below in Table 4.2.
Table 4.2 Mechanical properties of Masonry prism
Masonry prism
Mortar Brick
Young’s Modulus (MPa) 1500 6671
Poisson’s Ratio 0.196 0.1
Uniaxial compressive strength (MPa) 5.5 30.8
Uniaxial tensile strength (MPa) 1 1.18
Tensile fracture energy (N/mm) 0.3 0.5
Compressive fracture energy (N/mm) 1.75 40
Initially the same properties of the experimental tests were assigned to brick and mortar. But
the results were very low compared to the experimental values. As a result sensitivity analysis
and curve fitting is carried out to understand which parameter affects the results and to match
with the experimental results.
In general, sensitivity analysis is a method to determine the effects of individual parameters
acting on the model and curve fitting is a process of matching an analytical function or
mathematical expression to empirical data or vice versa. As the failure of the prism in this
case is due to tensile strength of brick and the compressive strength of mortar, these values
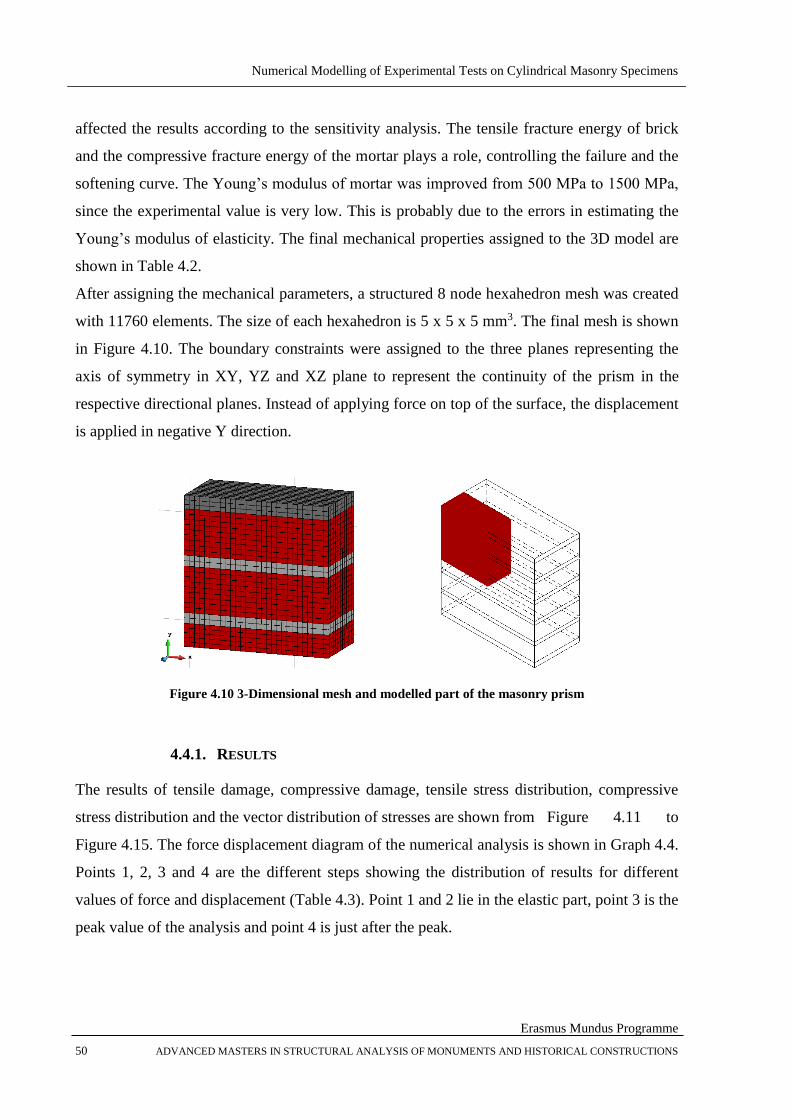
Numerical Modelling of Experimental Tests on Cylindrical Masonry Specimens
Erasmus Mundus Programme
50 ADVANCED MASTERS IN STRUCTURAL ANALYSIS OF MONUMENTS AND HISTORICAL CONSTRUCTIONS
affected the results according to the sensitivity analysis. The tensile fracture energy of brick
and the compressive fracture energy of the mortar plays a role, controlling the failure and the
softening curve. The Young’s modulus of mortar was improved from 500 MPa to 1500 MPa,
since the experimental value is very low. This is probably due to the errors in estimating the
Young’s modulus of elasticity. The final mechanical properties assigned to the 3D model are
shown in Table 4.2.
After assigning the mechanical parameters, a structured 8 node hexahedron mesh was created
with 11760 elements. The size of each hexahedron is 5 x 5 x 5 mm3. The final mesh is shown
in Figure 4.10. The boundary constraints were assigned to the three planes representing the
axis of symmetry in XY, YZ and XZ plane to represent the continuity of the prism in the
respective directional planes. Instead of applying force on top of the surface, the displacement
is applied in negative Y direction.
Figure 4.10 3-Dimensional mesh and modelled part of the masonry prism
4.4.1. RESULTS
The results of tensile damage, compressive damage, tensile stress distribution, compressive
stress distribution and the vector distribution of stresses are shown from Figure 4.11 to
Figure 4.15. The force displacement diagram of the numerical analysis is shown in Graph 4.4.
Points 1, 2, 3 and 4 are the different steps showing the distribution of results for different
values of force and displacement (Table 4.3). Point 1 and 2 lie in the elastic part, point 3 is the
peak value of the analysis and point 4 is just after the peak.
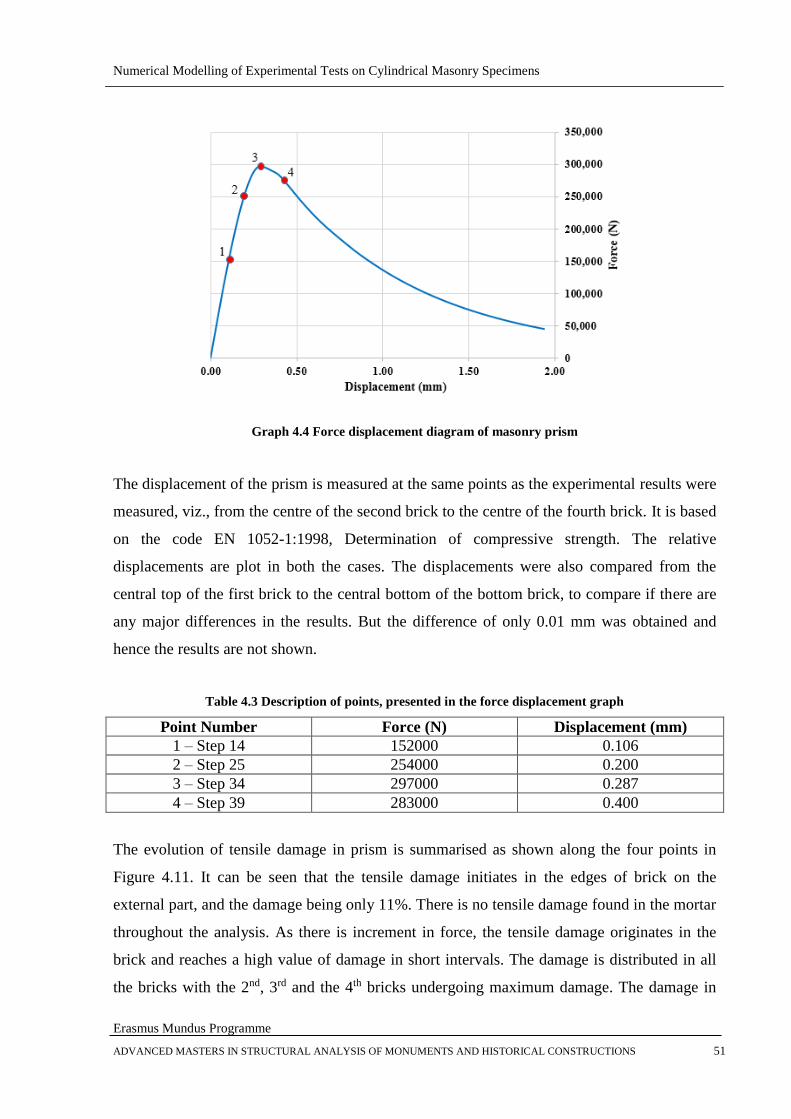
Numerical Modelling of Experimental Tests on Cylindrical Masonry Specimens
Erasmus Mundus Programme
ADVANCED MASTERS IN STRUCTURAL ANALYSIS OF MONUMENTS AND HISTORICAL CONSTRUCTIONS 51
Graph 4.4 Force displacement diagram of masonry prism
The displacement of the prism is measured at the same points as the experimental results were
measured, viz., from the centre of the second brick to the centre of the fourth brick. It is based
on the code EN 1052-1:1998, Determination of compressive strength. The relative
displacements are plot in both the cases. The displacements were also compared from the
central top of the first brick to the central bottom of the bottom brick, to compare if there are
any major differences in the results. But the difference of only 0.01 mm was obtained and
hence the results are not shown.
Table 4.3 Description of points, presented in the force displacement graph
Point Number Force (N) Displacement (mm)
1 – Step 14 152000 0.106
2 – Step 25 254000 0.200
3 – Step 34 297000 0.287
4 – Step 39 283000 0.400
The evolution of tensile damage in prism is summarised as shown along the four points in
Figure 4.11. It can be seen that the tensile damage initiates in the edges of brick on the
external part, and the damage being only 11%. There is no tensile damage found in the mortar
throughout the analysis. As there is increment in force, the tensile damage originates in the
brick and reaches a high value of damage in short intervals. The damage is distributed in all
the bricks with the 2nd, 3rd and the 4th bricks undergoing maximum damage. The damage in

Numerical Modelling of Experimental Tests on Cylindrical Masonry Specimens
Erasmus Mundus Programme
52 ADVANCED MASTERS IN STRUCTURAL ANALYSIS OF MONUMENTS AND HISTORICAL CONSTRUCTIONS
central part of brick initiates at 66% (196 kN) of the maximum load, sustains the load up to a
displacement of 0.05 mm from it and finally fails at 297 kN with a total displacement of 0.287
mm.
Point 1
Point 2
Point 3
Point 4
Figure 4.11 Tensile damage evolution
The evolution of compressive damage is shown in Figure 4.12. The compressive damage
originates in the very initial stages in the mortar. In the first point, the compressive damage is
around 11%, and in second point it reaches 35%. Finally at the peak strength, the damage is
equal to 63%. There is no compressive damage found in brick throughout the analysis, as can
be seen in Figure 4.12. It is due to the high compressive strength of brick with respect to
mortar.
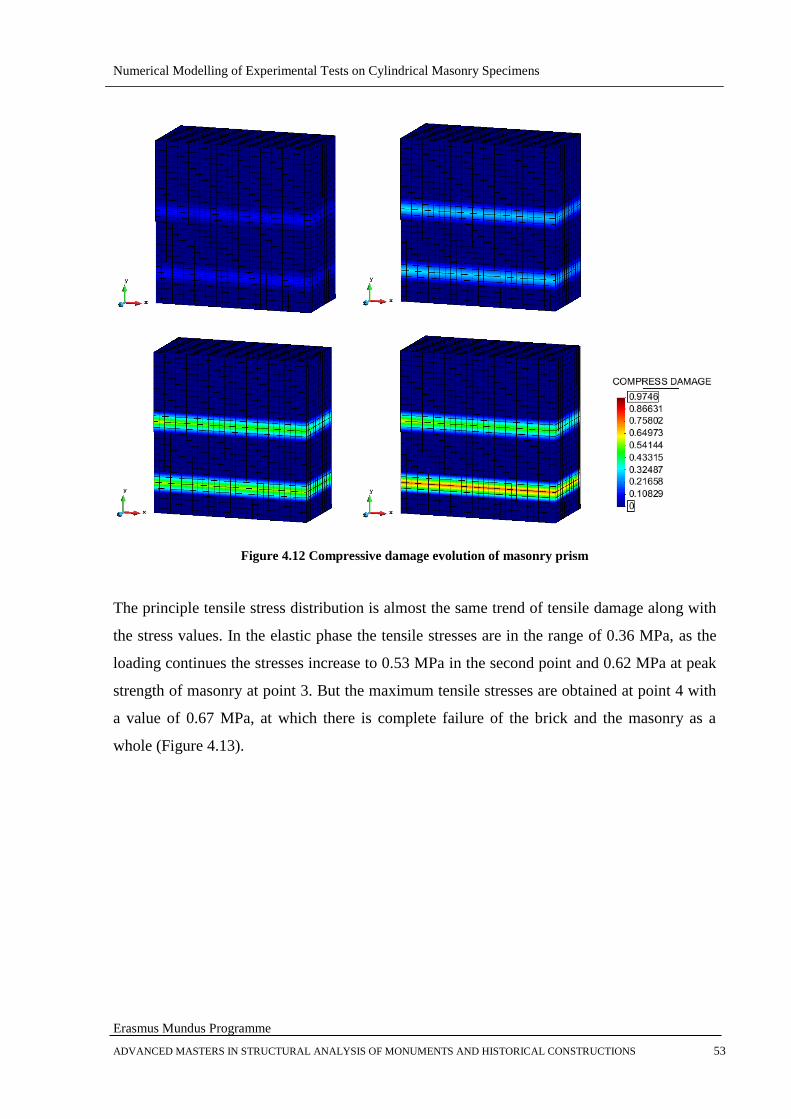
Numerical Modelling of Experimental Tests on Cylindrical Masonry Specimens
Erasmus Mundus Programme
ADVANCED MASTERS IN STRUCTURAL ANALYSIS OF MONUMENTS AND HISTORICAL CONSTRUCTIONS 53
Figure 4.12 Compressive damage evolution of masonry prism
The principle tensile stress distribution is almost the same trend of tensile damage along with
the stress values. In the elastic phase the tensile stresses are in the range of 0.36 MPa, as the
loading continues the stresses increase to 0.53 MPa in the second point and 0.62 MPa at peak
strength of masonry at point 3. But the maximum tensile stresses are obtained at point 4 with
a value of 0.67 MPa, at which there is complete failure of the brick and the masonry as a
whole (Figure 4.13).

Numerical Modelling of Experimental Tests on Cylindrical Masonry Specimens
Erasmus Mundus Programme
54 ADVANCED MASTERS IN STRUCTURAL ANALYSIS OF MONUMENTS AND HISTORICAL CONSTRUCTIONS
Point 1
Point 2
Point 3
Point 4
Figure 4.13 Principle tensile stress distribution in Masonry prism
The principle compressive stress distribution of the masonry prism is shown in Figure 4.14.
The mortar is subjected to compression right from the initial stages of loading. The maximum
elastic compressive stress of prism is 0.56 MPa (second point) and peak stress is 0.57 MPa
(third point), both being in mortar. At point 4 the strength of masonry decreases to 0.53 MPa
where it is in the softening part.
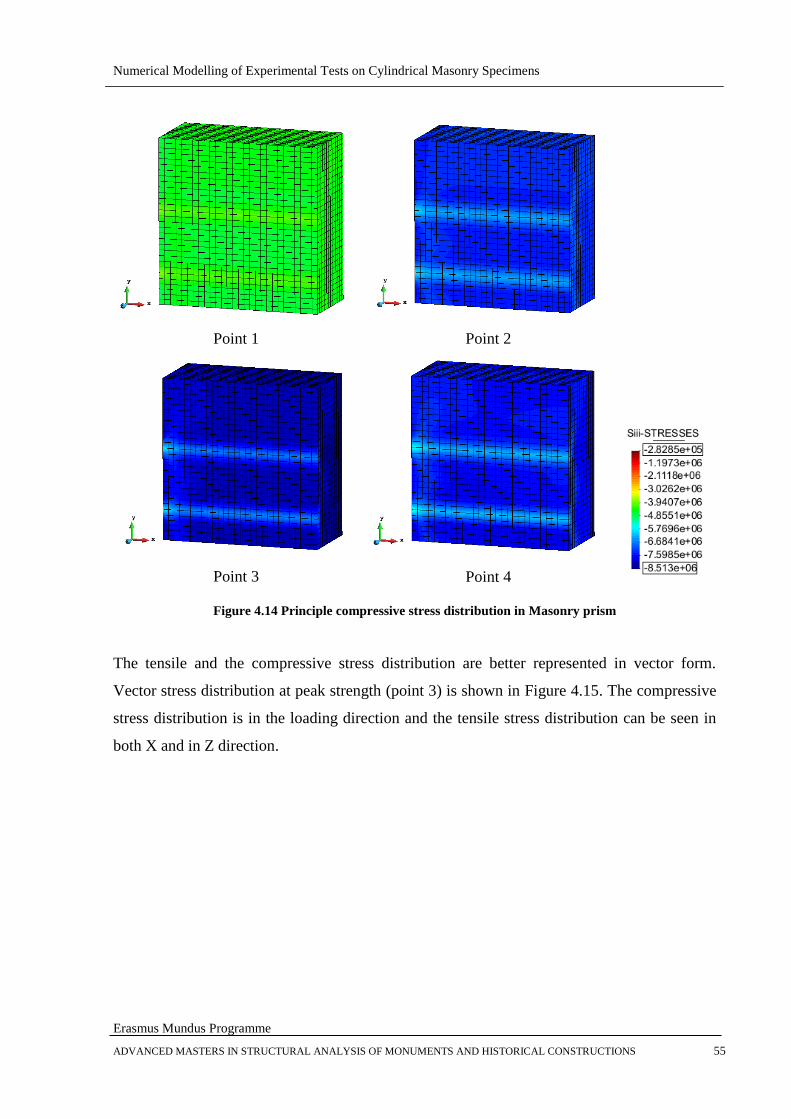
Numerical Modelling of Experimental Tests on Cylindrical Masonry Specimens
Erasmus Mundus Programme
ADVANCED MASTERS IN STRUCTURAL ANALYSIS OF MONUMENTS AND HISTORICAL CONSTRUCTIONS 55
Point 1
Point 2
Point 3
Point 4
Figure 4.14 Principle compressive stress distribution in Masonry prism
The tensile and the compressive stress distribution are better represented in vector form.
Vector stress distribution at peak strength (point 3) is shown in Figure 4.15. The compressive
stress distribution is in the loading direction and the tensile stress distribution can be seen in
both X and in Z direction.
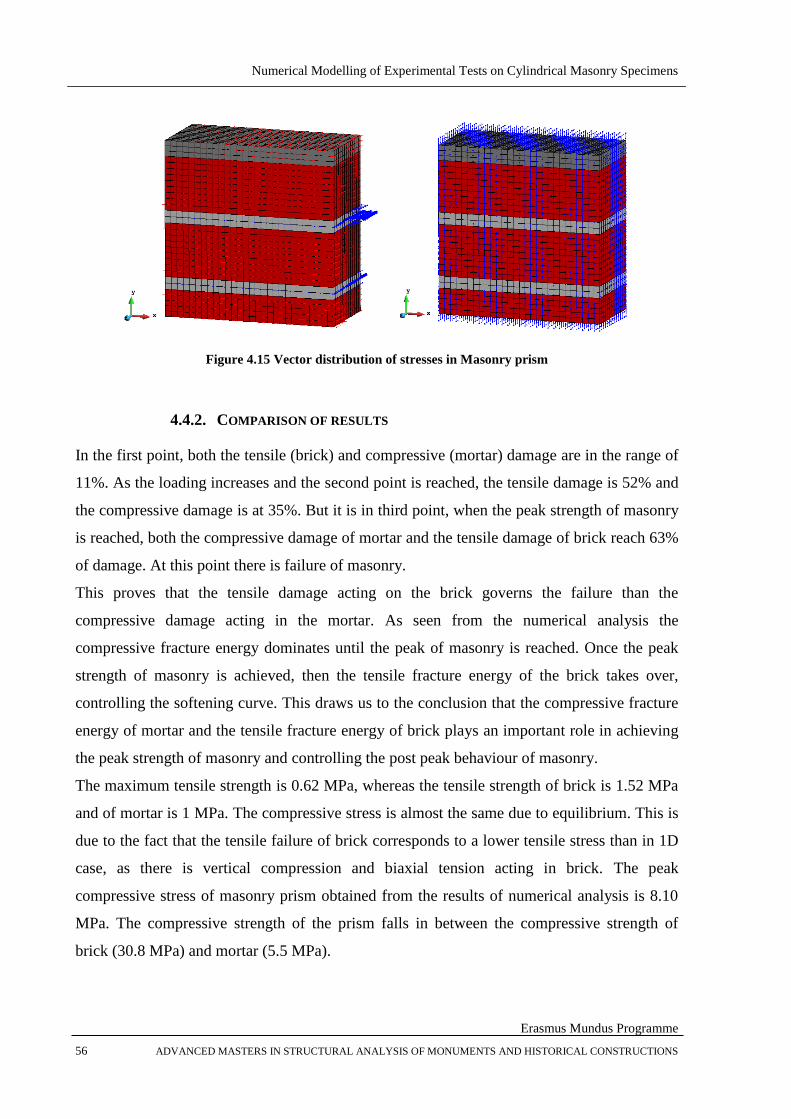
Numerical Modelling of Experimental Tests on Cylindrical Masonry Specimens
Erasmus Mundus Programme
56 ADVANCED MASTERS IN STRUCTURAL ANALYSIS OF MONUMENTS AND HISTORICAL CONSTRUCTIONS
Figure 4.15 Vector distribution of stresses in Masonry prism
4.4.2. COMPARISON OF RESULTS
In the first point, both the tensile (brick) and compressive (mortar) damage are in the range of
11%. As the loading increases and the second point is reached, the tensile damage is 52% and
the compressive damage is at 35%. But it is in third point, when the peak strength of masonry
is reached, both the compressive damage of mortar and the tensile damage of brick reach 63%
of damage. At this point there is failure of masonry.
This proves that the tensile damage acting on the brick governs the failure than the
compressive damage acting in the mortar. As seen from the numerical analysis the
compressive fracture energy dominates until the peak of masonry is reached. Once the peak
strength of masonry is achieved, then the tensile fracture energy of the brick takes over,
controlling the softening curve. This draws us to the conclusion that the compressive fracture
energy of mortar and the tensile fracture energy of brick plays an important role in achieving
the peak strength of masonry and controlling the post peak behaviour of masonry.
The maximum tensile strength is 0.62 MPa, whereas the tensile strength of brick is 1.52 MPa
and of mortar is 1 MPa. The compressive stress is almost the same due to equilibrium. This is
due to the fact that the tensile failure of brick corresponds to a lower tensile stress than in 1D
case, as there is vertical compression and biaxial tension acting in brick. The peak
compressive stress of masonry prism obtained from the results of numerical analysis is 8.10
MPa. The compressive strength of the prism falls in between the compressive strength of
brick (30.8 MPa) and mortar (5.5 MPa).
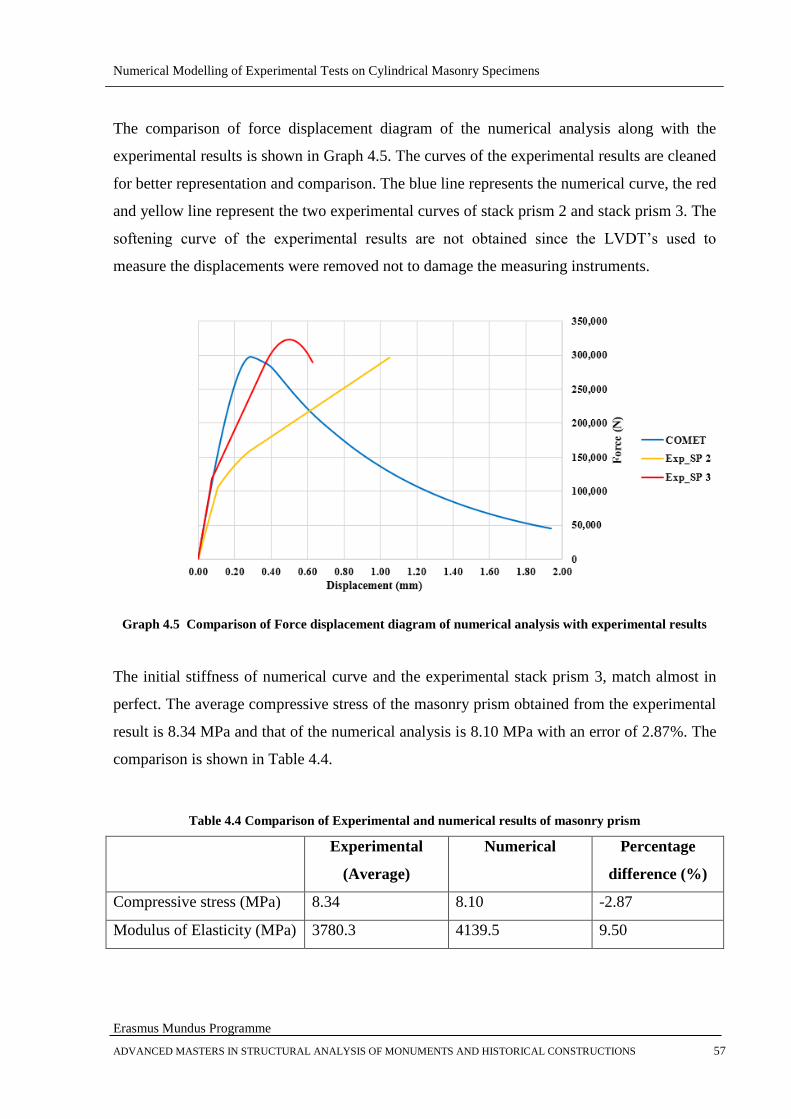
Numerical Modelling of Experimental Tests on Cylindrical Masonry Specimens
Erasmus Mundus Programme
ADVANCED MASTERS IN STRUCTURAL ANALYSIS OF MONUMENTS AND HISTORICAL CONSTRUCTIONS 57
The comparison of force displacement diagram of the numerical analysis along with the
experimental results is shown in Graph 4.5. The curves of the experimental results are cleaned
for better representation and comparison. The blue line represents the numerical curve, the red
and yellow line represent the two experimental curves of stack prism 2 and stack prism 3. The
softening curve of the experimental results are not obtained since the LVDT’s used to
measure the displacements were removed not to damage the measuring instruments.
Graph 4.5 Comparison of Force displacement diagram of numerical analysis with experimental results
The initial stiffness of numerical curve and the experimental stack prism 3, match almost in
perfect. The average compressive stress of the masonry prism obtained from the experimental
result is 8.34 MPa and that of the numerical analysis is 8.10 MPa with an error of 2.87%. The
comparison is shown in Table 4.4.
Table 4.4 Comparison of Experimental and numerical results of masonry prism
Experimental
(Average)
Numerical Percentage
difference (%)
Compressive stress (MPa) 8.34 8.10 -2.87
Modulus of Elasticity (MPa) 3780.3 4139.5 9.50
Numerical Modelling of Experimental Tests on Cylindrical Masonry Specimens
Erasmus Mundus Programme
58 ADVANCED MASTERS IN STRUCTURAL ANALYSIS OF MONUMENTS AND HISTORICAL CONSTRUCTIONS
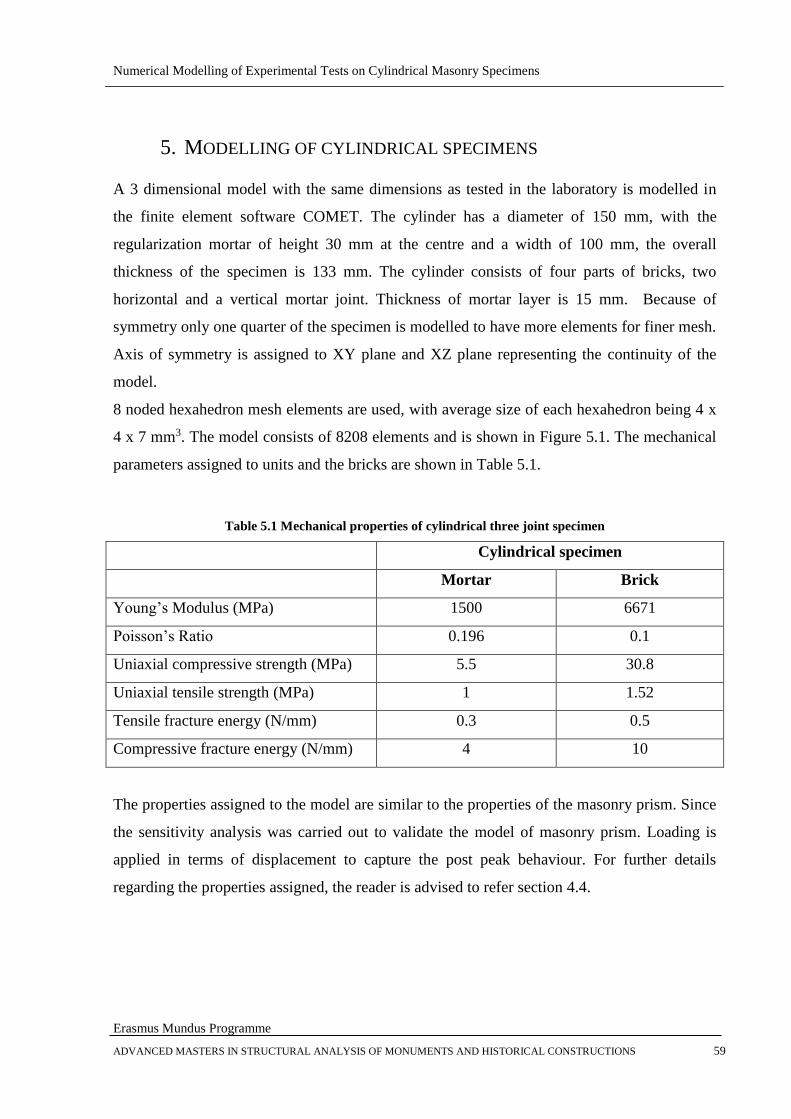
Numerical Modelling of Experimental Tests on Cylindrical Masonry Specimens
Erasmus Mundus Programme
ADVANCED MASTERS IN STRUCTURAL ANALYSIS OF MONUMENTS AND HISTORICAL CONSTRUCTIONS 59
5. MODELLING OF CYLINDRICAL SPECIMENS
A 3 dimensional model with the same dimensions as tested in the laboratory is modelled in
the finite element software COMET. The cylinder has a diameter of 150 mm, with the
regularization mortar of height 30 mm at the centre and a width of 100 mm, the overall
thickness of the specimen is 133 mm. The cylinder consists of four parts of bricks, two
horizontal and a vertical mortar joint. Thickness of mortar layer is 15 mm. Because of
symmetry only one quarter of the specimen is modelled to have more elements for finer mesh.
Axis of symmetry is assigned to XY plane and XZ plane representing the continuity of the
model.
8 noded hexahedron mesh elements are used, with average size of each hexahedron being 4 x
4 x 7 mm3. The model consists of 8208 elements and is shown in Figure 5.1. The mechanical
parameters assigned to units and the bricks are shown in Table 5.1.
Table 5.1 Mechanical properties of cylindrical three joint specimen
Cylindrical specimen
Mortar Brick
Young’s Modulus (MPa) 1500 6671
Poisson’s Ratio 0.196 0.1
Uniaxial compressive strength (MPa) 5.5 30.8
Uniaxial tensile strength (MPa) 1 1.52
Tensile fracture energy (N/mm) 0.3 0.5
Compressive fracture energy (N/mm) 4 10
The properties assigned to the model are similar to the properties of the masonry prism. Since
the sensitivity analysis was carried out to validate the model of masonry prism. Loading is
applied in terms of displacement to capture the post peak behaviour. For further details
regarding the properties assigned, the reader is advised to refer section 4.4.
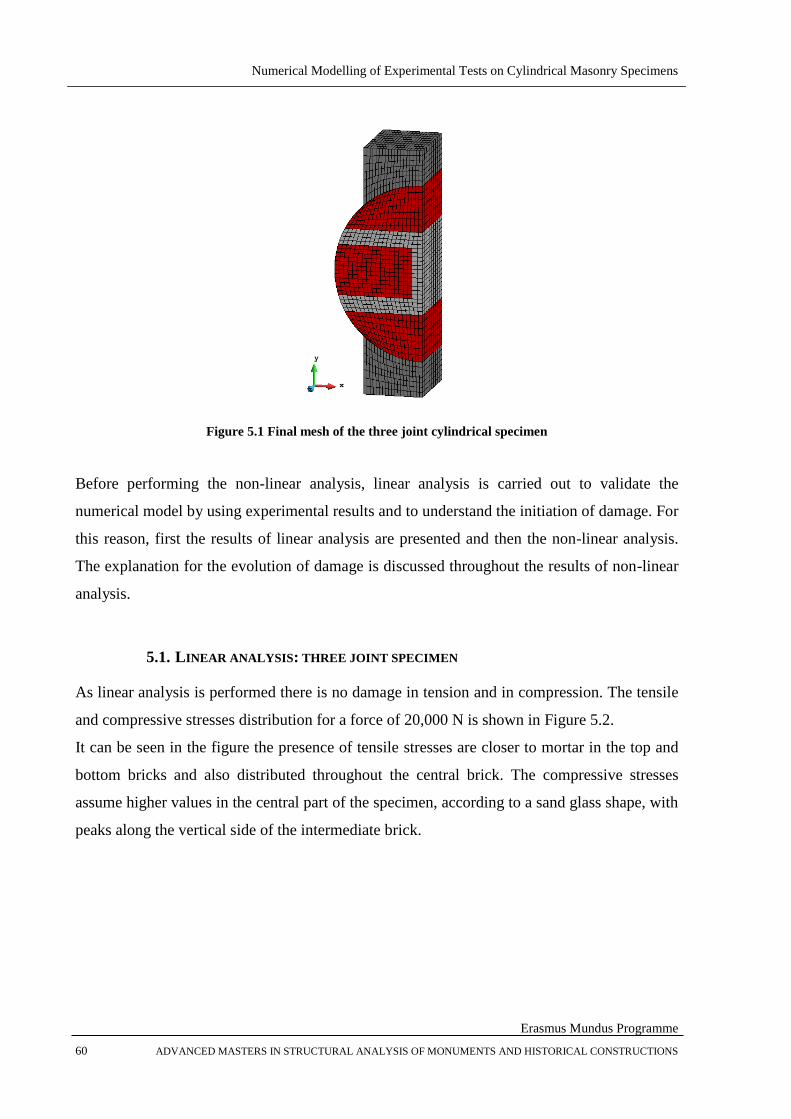
Numerical Modelling of Experimental Tests on Cylindrical Masonry Specimens
Erasmus Mundus Programme
60 ADVANCED MASTERS IN STRUCTURAL ANALYSIS OF MONUMENTS AND HISTORICAL CONSTRUCTIONS
Figure 5.1 Final mesh of the three joint cylindrical specimen
Before performing the non-linear analysis, linear analysis is carried out to validate the
numerical model by using experimental results and to understand the initiation of damage. For
this reason, first the results of linear analysis are presented and then the non-linear analysis.
The explanation for the evolution of damage is discussed throughout the results of non-linear
analysis.
5.1. LINEAR ANALYSIS: THREE JOINT SPECIMEN
As linear analysis is performed there is no damage in tension and in compression. The tensile
and compressive stresses distribution for a force of 20,000 N is shown in Figure 5.2.
It can be seen in the figure the presence of tensile stresses are closer to mortar in the top and
bottom bricks and also distributed throughout the central brick. The compressive stresses
assume higher values in the central part of the specimen, according to a sand glass shape, with
peaks along the vertical side of the intermediate brick.
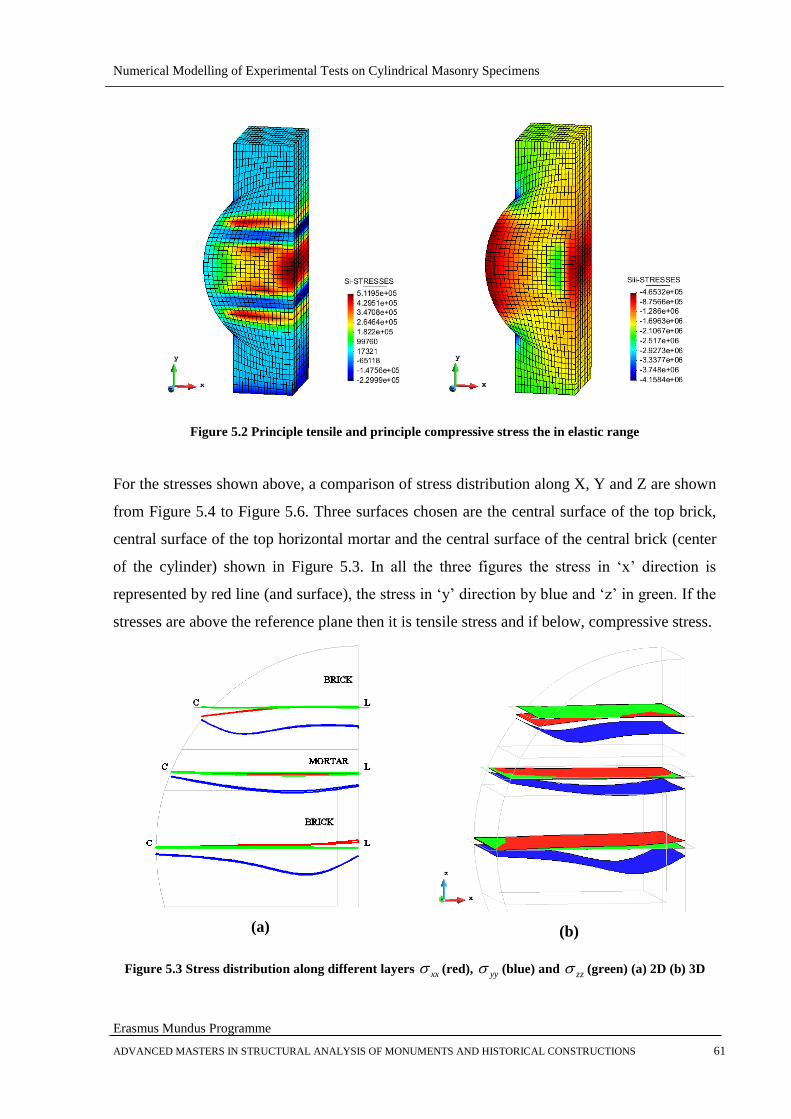
Numerical Modelling of Experimental Tests on Cylindrical Masonry Specimens
Erasmus Mundus Programme
ADVANCED MASTERS IN STRUCTURAL ANALYSIS OF MONUMENTS AND HISTORICAL CONSTRUCTIONS 61
Figure 5.2 Principle tensile and principle compressive stress the in elastic range
For the stresses shown above, a comparison of stress distribution along X, Y and Z are shown
from Figure 5.4 to Figure 5.6. Three surfaces chosen are the central surface of the top brick,
central surface of the top horizontal mortar and the central surface of the central brick (center
of the cylinder) shown in Figure 5.3. In all the three figures the stress in ‘x’ direction is
represented by red line (and surface), the stress in ‘y’ direction by blue and ‘z’ in green. If the
stresses are above the reference plane then it is tensile stress and if below, compressive stress.
(a)
(b)
Figure 5.3 Stress distribution along different layers xx (red), yy (blue) and zz (green) (a) 2D (b) 3D

Numerical Modelling of Experimental Tests on Cylindrical Masonry Specimens
Erasmus Mundus Programme
62 ADVANCED MASTERS IN STRUCTURAL ANALYSIS OF MONUMENTS AND HISTORICAL CONSTRUCTIONS
In the center of the top brick shown in Figure 5.4, the compressive stresses are maximum at
one quarter on the left side. This is due to concentration of stresses by the regularization
mortar above it. The compressive stress is in the range of 1-2 MPa. In the other parts of the
plane the stresses in ‘x’ and ‘z’ vary from tension to compression. Where the stresses in ‘x’
are from +0.01 MPa to -0.70 MPa. In ‘z’ direction the tensile stresses increase from the outer
surface towards the central core of the specimen. The increment is from -5.0 kPa to 85 kPa at
the center. In the central line of the top brick surface the average stress distribution can be
summarised as yyxx 224.0 and yyzz 04.0
(a)
(b)
(c)
Figure 5.4 Stress distribution in (a) 2D and (b) 3D in the center of the top brick & (c) xx and zz along
the central line of top brick surface, xx (red), yy (blue) and zz (green)
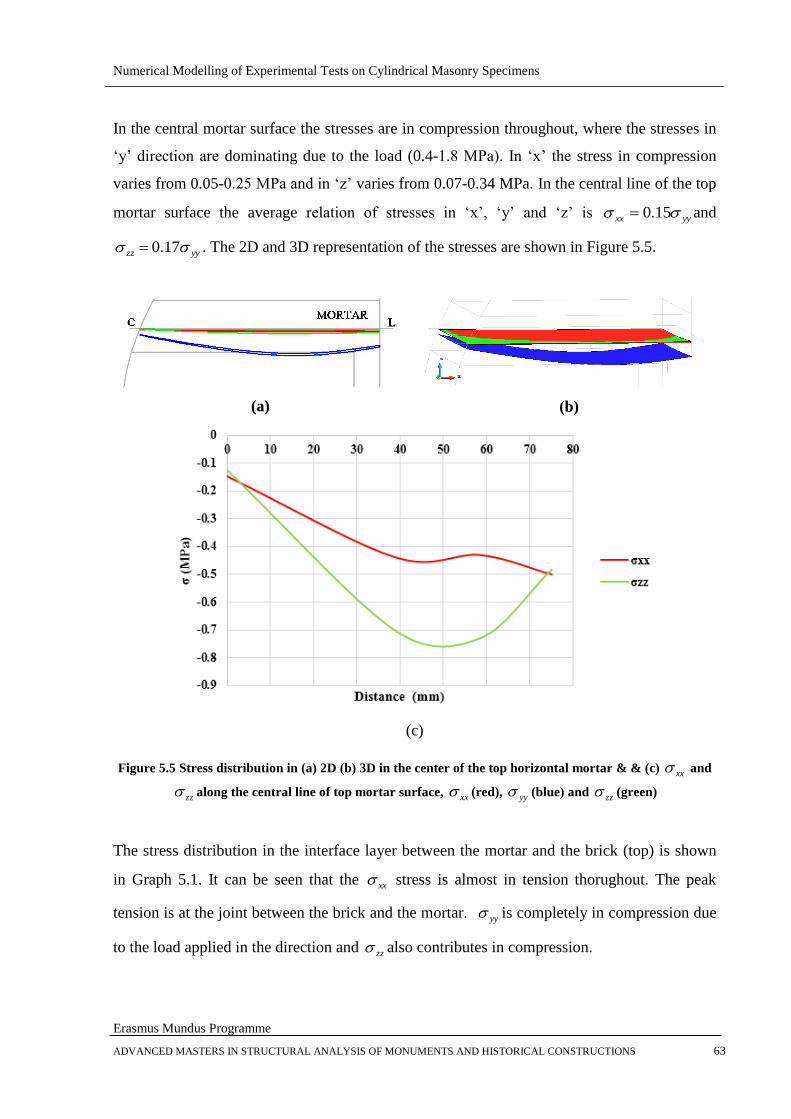
Numerical Modelling of Experimental Tests on Cylindrical Masonry Specimens
Erasmus Mundus Programme
ADVANCED MASTERS IN STRUCTURAL ANALYSIS OF MONUMENTS AND HISTORICAL CONSTRUCTIONS 63
In the central mortar surface the stresses are in compression throughout, where the stresses in
‘y’ direction are dominating due to the load (0.4-1.8 MPa). In ‘x’ the stress in compression
varies from 0.05-0.25 MPa and in ‘z’ varies from 0.07-0.34 MPa. In the central line of the top
mortar surface the average relation of stresses in ‘x’, ‘y’ and ‘z’ is yyxx 15.0 and
yyzz 17.0 . The 2D and 3D representation of the stresses are shown in Figure 5.5.
(a)
(b)
(c)
Figure 5.5 Stress distribution in (a) 2D (b) 3D in the center of the top horizontal mortar & & (c) xx and
zz along the central line of top mortar surface, xx (red), yy (blue) and zz (green)
The stress distribution in the interface layer between the mortar and the brick (top) is shown
in Graph 5.1. It can be seen that the xx stress is almost in tension thorughout. The peak
tension is at the joint between the brick and the mortar. yy is completely in compression due
to the load applied in the direction and zz also contributes in compression.

Numerical Modelling of Experimental Tests on Cylindrical Masonry Specimens
Erasmus Mundus Programme
64 ADVANCED MASTERS IN STRUCTURAL ANALYSIS OF MONUMENTS AND HISTORICAL CONSTRUCTIONS
(a)
(b)
Graph 5.1 Stress distribution in the interface layer between mortar and brick (a) xx (red), yy (blue) and
zz (green) (b) xx (red) & zz (green)
The stress distribution in the central surface of the specimen is shown in Figure 5.6. The
compressive stresses of ‘y’ are maximum, acting in the range of 0.5-2.5 MPa. The stress in ‘x’
and ‘z’ are acting in tension throughout the surface. The average relations between the
stresses are: yyxx 30.0 and yyzz 10.0 along the central line of the specimen. From
the center to the outer edge, the stresses in all the direction decreases as shown in the
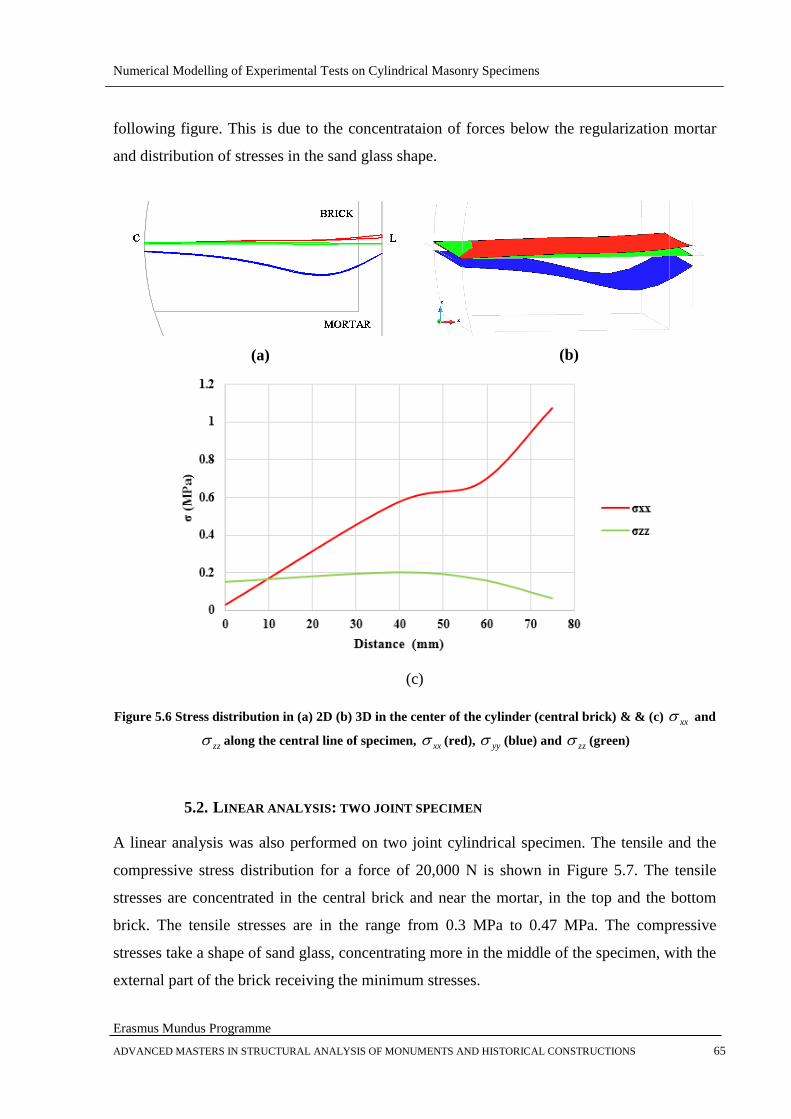
Numerical Modelling of Experimental Tests on Cylindrical Masonry Specimens
Erasmus Mundus Programme
ADVANCED MASTERS IN STRUCTURAL ANALYSIS OF MONUMENTS AND HISTORICAL CONSTRUCTIONS 65
following figure. This is due to the concentrataion of forces below the regularization mortar
and distribution of stresses in the sand glass shape.
(a)
(b)
(c)
Figure 5.6 Stress distribution in (a) 2D (b) 3D in the center of the cylinder (central brick) & & (c) xx and
zz along the central line of specimen, xx (red), yy (blue) and zz (green)
5.2. LINEAR ANALYSIS: TWO JOINT SPECIMEN
A linear analysis was also performed on two joint cylindrical specimen. The tensile and the
compressive stress distribution for a force of 20,000 N is shown in Figure 5.7. The tensile
stresses are concentrated in the central brick and near the mortar, in the top and the bottom
brick. The tensile stresses are in the range from 0.3 MPa to 0.47 MPa. The compressive
stresses take a shape of sand glass, concentrating more in the middle of the specimen, with the
external part of the brick receiving the minimum stresses.
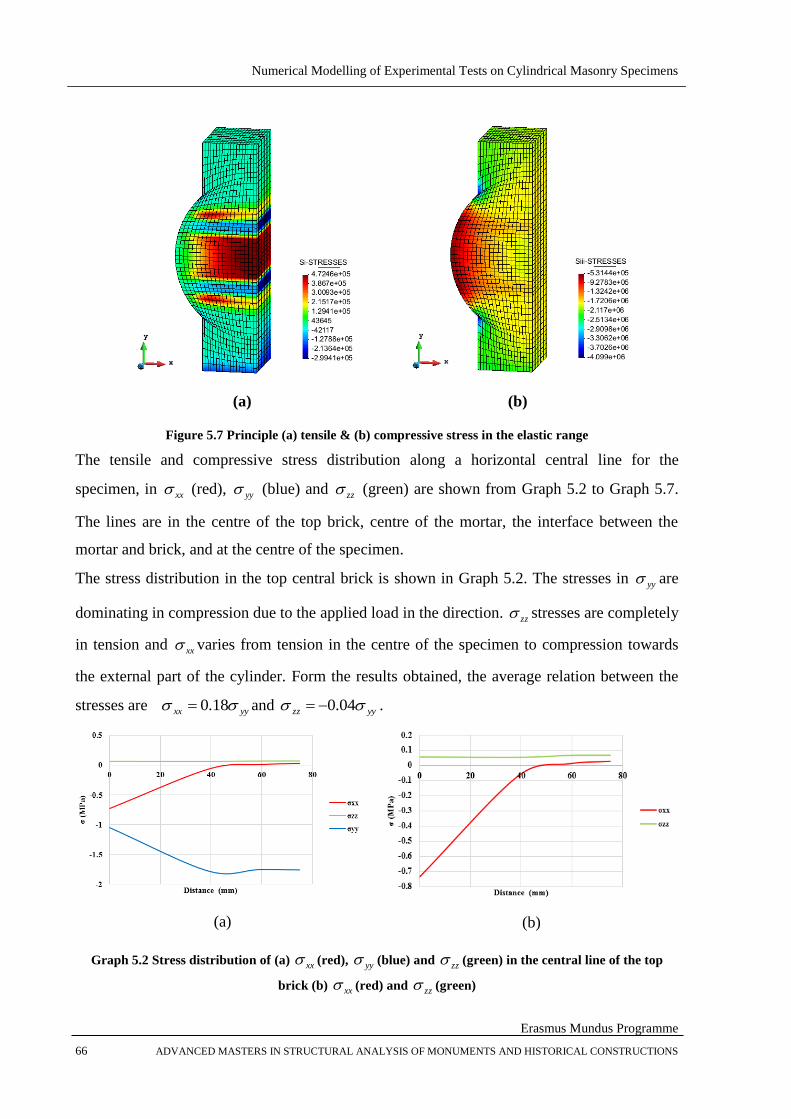
Numerical Modelling of Experimental Tests on Cylindrical Masonry Specimens
Erasmus Mundus Programme
66 ADVANCED MASTERS IN STRUCTURAL ANALYSIS OF MONUMENTS AND HISTORICAL CONSTRUCTIONS
(a)
(b)
Figure 5.7 Principle (a) tensile & (b) compressive stress in the elastic range
The tensile and compressive stress distribution along a horizontal central line for the
specimen, in xx (red), yy (blue) and zz (green) are shown from Graph 5.2 to Graph 5.7.
The lines are in the centre of the top brick, centre of the mortar, the interface between the
mortar and brick, and at the centre of the specimen.
The stress distribution in the top central brick is shown in Graph 5.2. The stresses in yy are
dominating in compression due to the applied load in the direction. zz stresses are completely
in tension and xx varies from tension in the centre of the specimen to compression towards
the external part of the cylinder. Form the results obtained, the average relation between the
stresses are yyxx 18.0 and yyzz 04.0 .
(a)
(b)
Graph 5.2 Stress distribution of (a) xx (red), yy (blue) and zz (green) in the central line of the top
brick (b) xx (red) and zz (green)

Numerical Modelling of Experimental Tests on Cylindrical Masonry Specimens
Erasmus Mundus Programme
ADVANCED MASTERS IN STRUCTURAL ANALYSIS OF MONUMENTS AND HISTORICAL CONSTRUCTIONS 67
The variation of stresses along the central line in the middle of the mortar is shown in Graph
5.3 (a) and (b). xx (red), yy (blue) and zz (green) stresses are in compression throughout.
yyxx 15.0 and yyzz 18.0 are the relation between stresses in ‘x’, ‘y’ and ‘z’ directions
for average values.
(a)
(b)
Graph 5.3 Stress distribution of (a) xx (red), yy (blue) and zz (green) in the central line of the top
mortar (b) xx (red) and zz (green)
At the interface between the brick and the mortar, the stresses along ‘x’ varies from tension in
the central core of the specimen to compression at the external end. The stresses along ‘z’ acts
opposite to stresses in ‘x’ varying from compression in the centre towards tension in the
external end, shown in Graph 5.4(b). Based on the stress distribution in xx , yy and zz the
following relation can be summarized yyxx 01.0 and yyzz 05.0 (for average values).
(a)
(b)
Graph 5.4 Stress distribution of (a) xx (red), yy (blue) and zz (green) at the interface between the
brick and the mortar (b) xx (red) and zz (green)
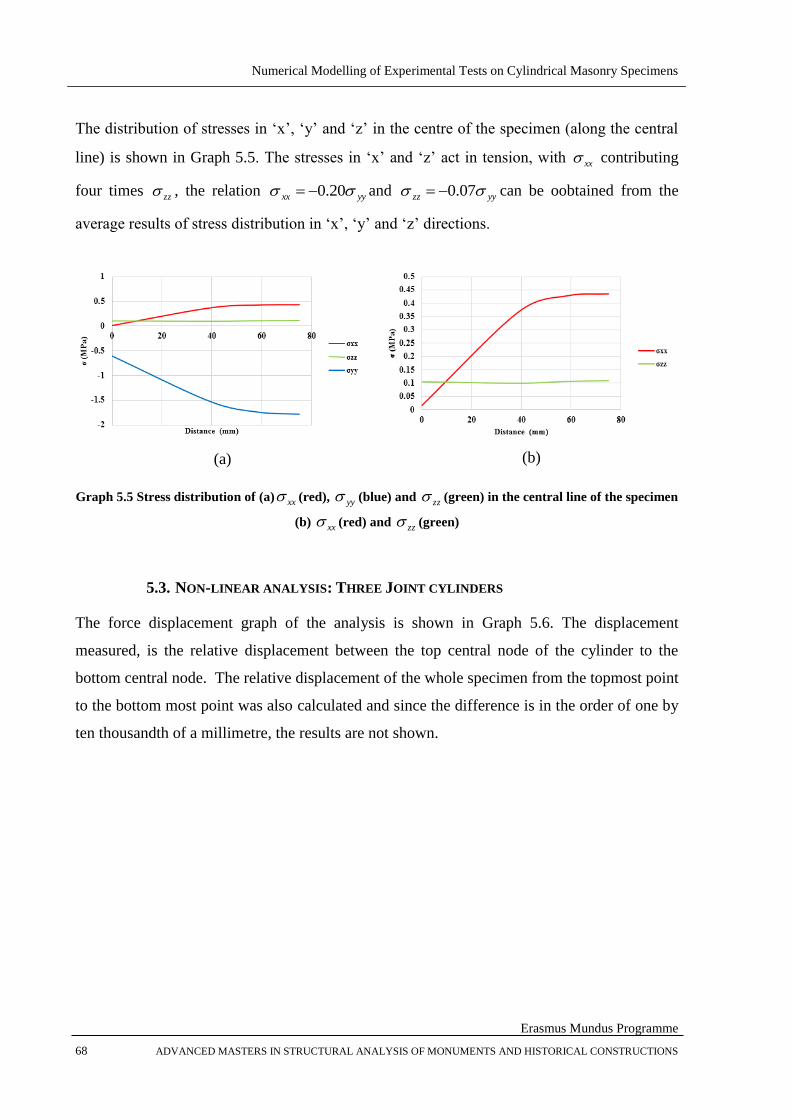
Numerical Modelling of Experimental Tests on Cylindrical Masonry Specimens
Erasmus Mundus Programme
68 ADVANCED MASTERS IN STRUCTURAL ANALYSIS OF MONUMENTS AND HISTORICAL CONSTRUCTIONS
The distribution of stresses in ‘x’, ‘y’ and ‘z’ in the centre of the specimen (along the central
line) is shown in Graph 5.5. The stresses in ‘x’ and ‘z’ act in tension, with xx contributing
four times zz , the relation yyxx 20.0 and yyzz 07.0 can be oobtained from the
average results of stress distribution in ‘x’, ‘y’ and ‘z’ directions.
(a)
(b)
Graph 5.5 Stress distribution of (a) xx (red), yy (blue) and zz (green) in the central line of the specimen
(b) xx (red) and zz (green)
5.3. NON-LINEAR ANALYSIS: THREE JOINT CYLINDERS
The force displacement graph of the analysis is shown in Graph 5.6. The displacement
measured, is the relative displacement between the top central node of the cylinder to the
bottom central node. The relative displacement of the whole specimen from the topmost point
to the bottom most point was also calculated and since the difference is in the order of one by
ten thousandth of a millimetre, the results are not shown.
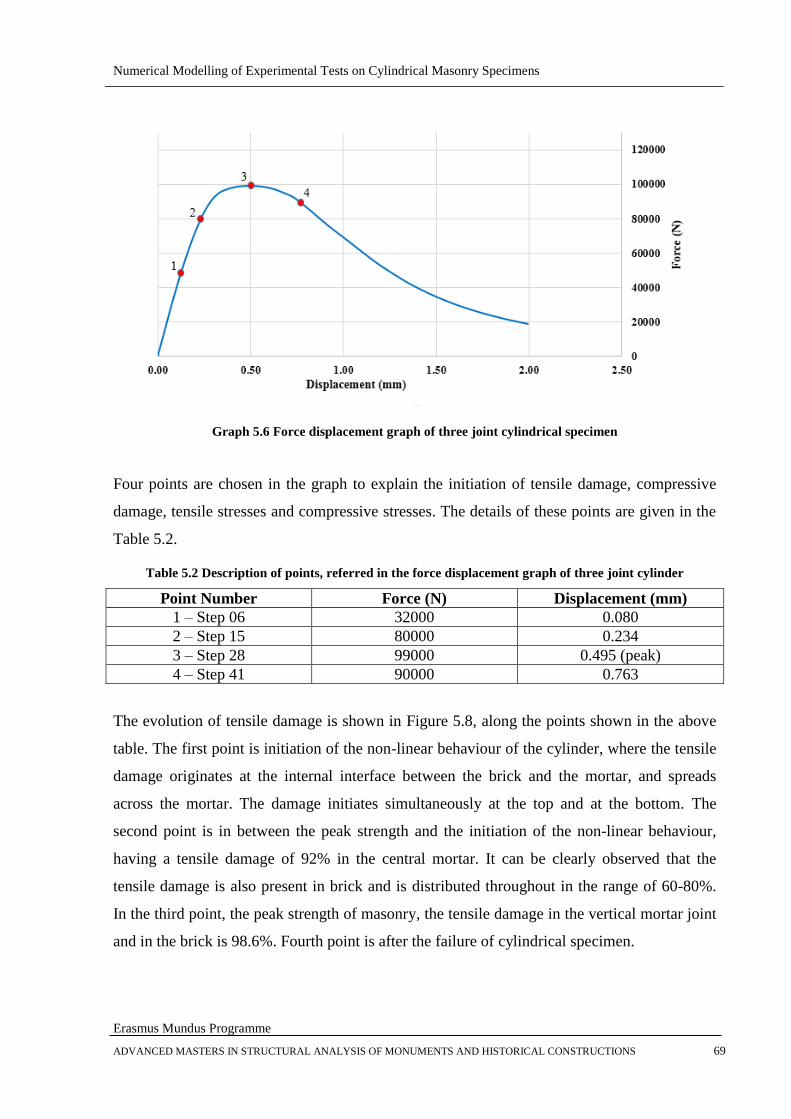
Numerical Modelling of Experimental Tests on Cylindrical Masonry Specimens
Erasmus Mundus Programme
ADVANCED MASTERS IN STRUCTURAL ANALYSIS OF MONUMENTS AND HISTORICAL CONSTRUCTIONS 69
Graph 5.6 Force displacement graph of three joint cylindrical specimen
Four points are chosen in the graph to explain the initiation of tensile damage, compressive
damage, tensile stresses and compressive stresses. The details of these points are given in the
Table 5.2.
Table 5.2 Description of points, referred in the force displacement graph of three joint cylinder
Point Number Force (N) Displacement (mm)
1 – Step 06 32000 0.080
2 – Step 15 80000 0.234
3 – Step 28 99000 0.495 (peak)
4 – Step 41 90000 0.763
The evolution of tensile damage is shown in Figure 5.8, along the points shown in the above
table. The first point is initiation of the non-linear behaviour of the cylinder, where the tensile
damage originates at the internal interface between the brick and the mortar, and spreads
across the mortar. The damage initiates simultaneously at the top and at the bottom. The
second point is in between the peak strength and the initiation of the non-linear behaviour,
having a tensile damage of 92% in the central mortar. It can be clearly observed that the
tensile damage is also present in brick and is distributed throughout in the range of 60-80%.
In the third point, the peak strength of masonry, the tensile damage in the vertical mortar joint
and in the brick is 98.6%. Fourth point is after the failure of cylindrical specimen.
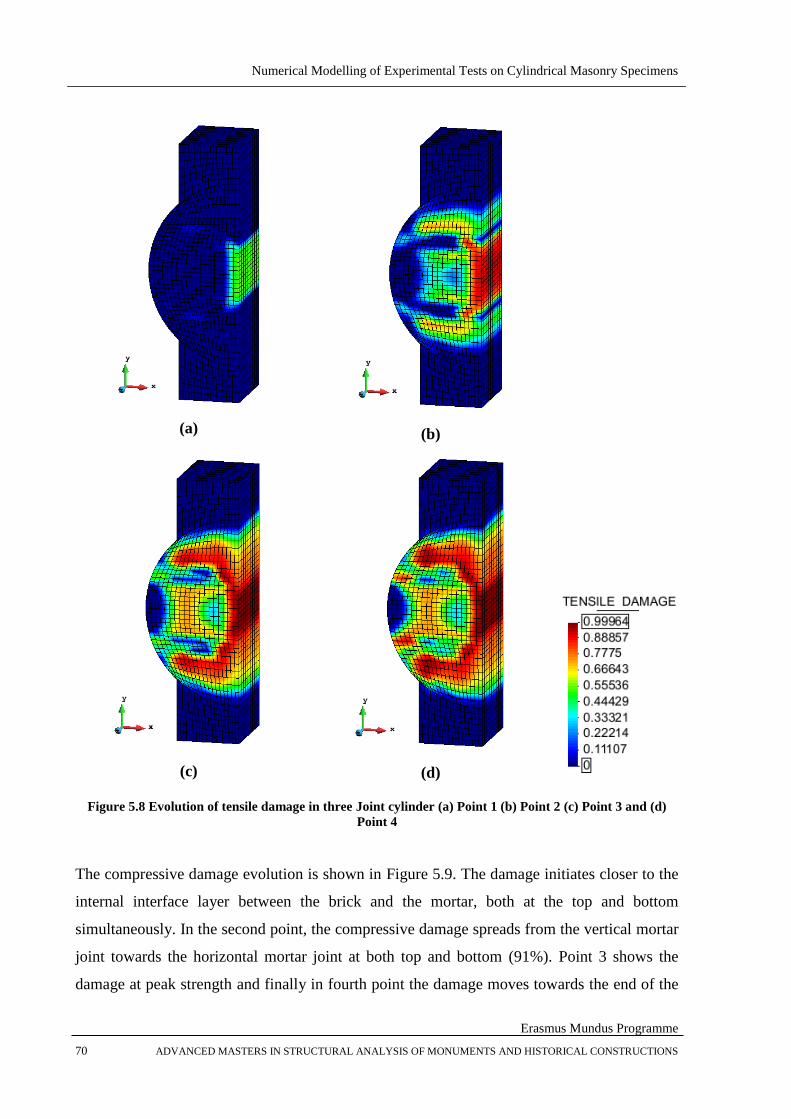
Numerical Modelling of Experimental Tests on Cylindrical Masonry Specimens
Erasmus Mundus Programme
70 ADVANCED MASTERS IN STRUCTURAL ANALYSIS OF MONUMENTS AND HISTORICAL CONSTRUCTIONS
(a)
(b)
(c)
(d)
Figure 5.8 Evolution of tensile damage in three Joint cylinder (a) Point 1 (b) Point 2 (c) Point 3 and (d)
Point 4
The compressive damage evolution is shown in Figure 5.9. The damage initiates closer to the
internal interface layer between the brick and the mortar, both at the top and bottom
simultaneously. In the second point, the compressive damage spreads from the vertical mortar
joint towards the horizontal mortar joint at both top and bottom (91%). Point 3 shows the
damage at peak strength and finally in fourth point the damage moves towards the end of the

Numerical Modelling of Experimental Tests on Cylindrical Masonry Specimens
Erasmus Mundus Programme
ADVANCED MASTERS IN STRUCTURAL ANALYSIS OF MONUMENTS AND HISTORICAL CONSTRUCTIONS 71
regularization mortar. Comparing the tensile damage and compressive damage it can be seen
that at peak strength the tensile damage is 98.6% and the compressive damage is 91%.
(a)
(b)
(c)
(d)
Figure 5.9 Evolution of compressive damage in three joint cylinder (a) Point 1 (b) Point 2 (c) Point 3 & (d)
Point 4
The principle tensile stress distribution gives us a clear idea about the failure taking place in
the specimen (Figure 5.10). The stresses are in the range of 0.6-0.8 MPa in the first point. It
can be observed in the first figure that the initiation of tensile stresses in the brick is around

Numerical Modelling of Experimental Tests on Cylindrical Masonry Specimens
Erasmus Mundus Programme
72 ADVANCED MASTERS IN STRUCTURAL ANALYSIS OF MONUMENTS AND HISTORICAL CONSTRUCTIONS
the mortar. The tensile stress reaches a maximum of 1.37 MPa at the peak strength (point 3)
lies in between the tensile strength of brick (1.52 MPa) and tensile strength of mortar (1
MPa). The cracking in brick is reached slightly before the uniaxial tensile strength value is
reached, due to the combined effect of vertical compression according to the Mohr-Coulomb
criterion. It can be clearly seen the distribution of tensile stresses are dominated in the brick
throughout.
(a)
(b)
(c)
(d)
Figure 5.10 Principle tensile stress distribution in three Joint cylinder (a) Point 1 (b) Point 2 (c) Point 3 &
(d) Point 4
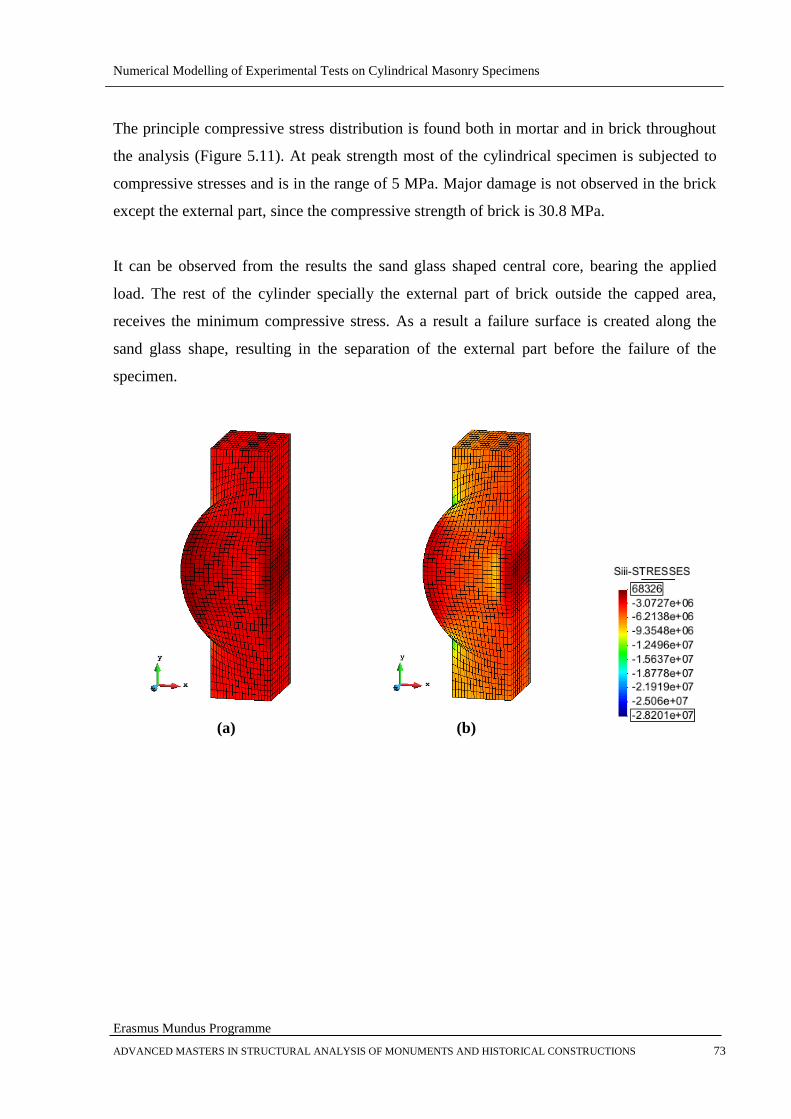
Numerical Modelling of Experimental Tests on Cylindrical Masonry Specimens
Erasmus Mundus Programme
ADVANCED MASTERS IN STRUCTURAL ANALYSIS OF MONUMENTS AND HISTORICAL CONSTRUCTIONS 73
The principle compressive stress distribution is found both in mortar and in brick throughout
the analysis (Figure 5.11). At peak strength most of the cylindrical specimen is subjected to
compressive stresses and is in the range of 5 MPa. Major damage is not observed in the brick
except the external part, since the compressive strength of brick is 30.8 MPa.
It can be observed from the results the sand glass shaped central core, bearing the applied
load. The rest of the cylinder specially the external part of brick outside the capped area,
receives the minimum compressive stress. As a result a failure surface is created along the
sand glass shape, resulting in the separation of the external part before the failure of the
specimen.
(a)
(b)

Numerical Modelling of Experimental Tests on Cylindrical Masonry Specimens
Erasmus Mundus Programme
74 ADVANCED MASTERS IN STRUCTURAL ANALYSIS OF MONUMENTS AND HISTORICAL CONSTRUCTIONS
(c)
(d)
Figure 5.11 Principle compressive stress distribution in three Joint cylinder (a) Point 1 (b) Point 2 (c)
Point 3 & (d) Point 4
The vector distribution of tensile and compressive stress at peak strength is shown in Figure
5.12. It gives a clear idea of the stress distribution. The tensile stresses are dominating in X
and Z direction in the brick. The compressive stress being distributed throughout the
specimen especially in the area of loaded cap.
Figure 5.12 Vector distribution of stresses in three joint cylinder at peak
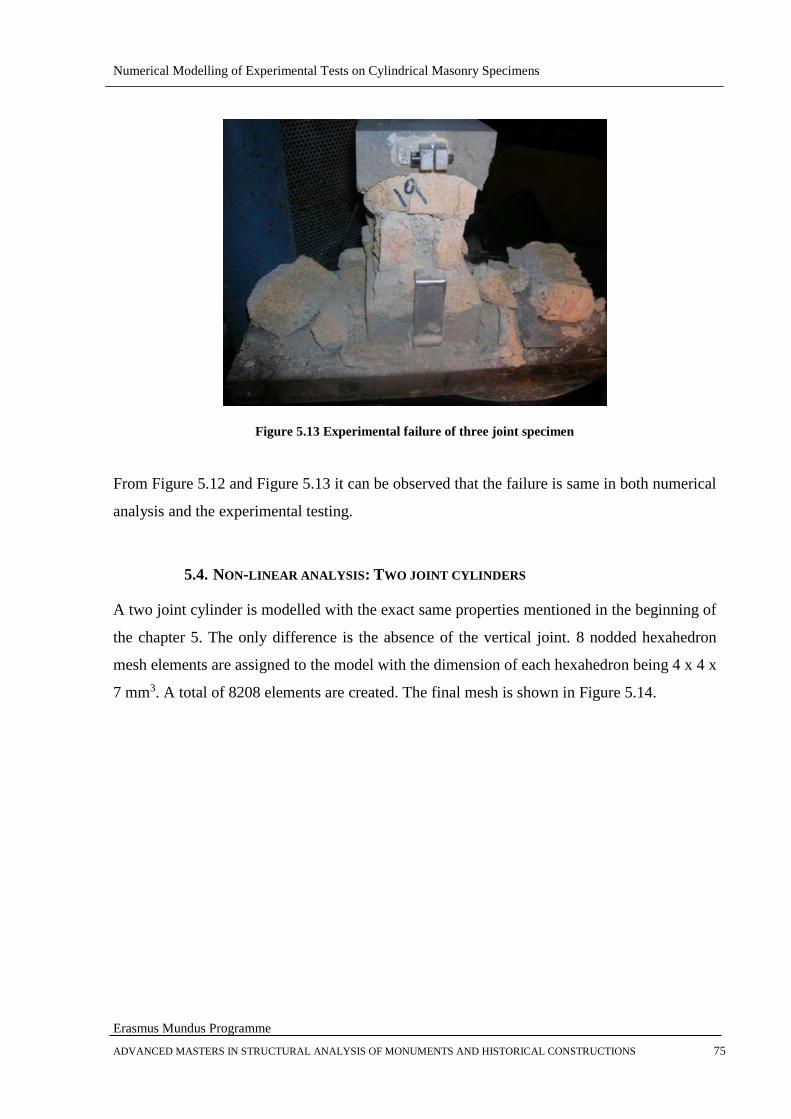
Numerical Modelling of Experimental Tests on Cylindrical Masonry Specimens
Erasmus Mundus Programme
ADVANCED MASTERS IN STRUCTURAL ANALYSIS OF MONUMENTS AND HISTORICAL CONSTRUCTIONS 75
Figure 5.13 Experimental failure of three joint specimen
From Figure 5.12 and Figure 5.13 it can be observed that the failure is same in both numerical
analysis and the experimental testing.
5.4. NON-LINEAR ANALYSIS: TWO JOINT CYLINDERS
A two joint cylinder is modelled with the exact same properties mentioned in the beginning of
the chapter 5. The only difference is the absence of the vertical joint. 8 nodded hexahedron
mesh elements are assigned to the model with the dimension of each hexahedron being 4 x 4 x
7 mm3. A total of 8208 elements are created. The final mesh is shown in Figure 5.14.
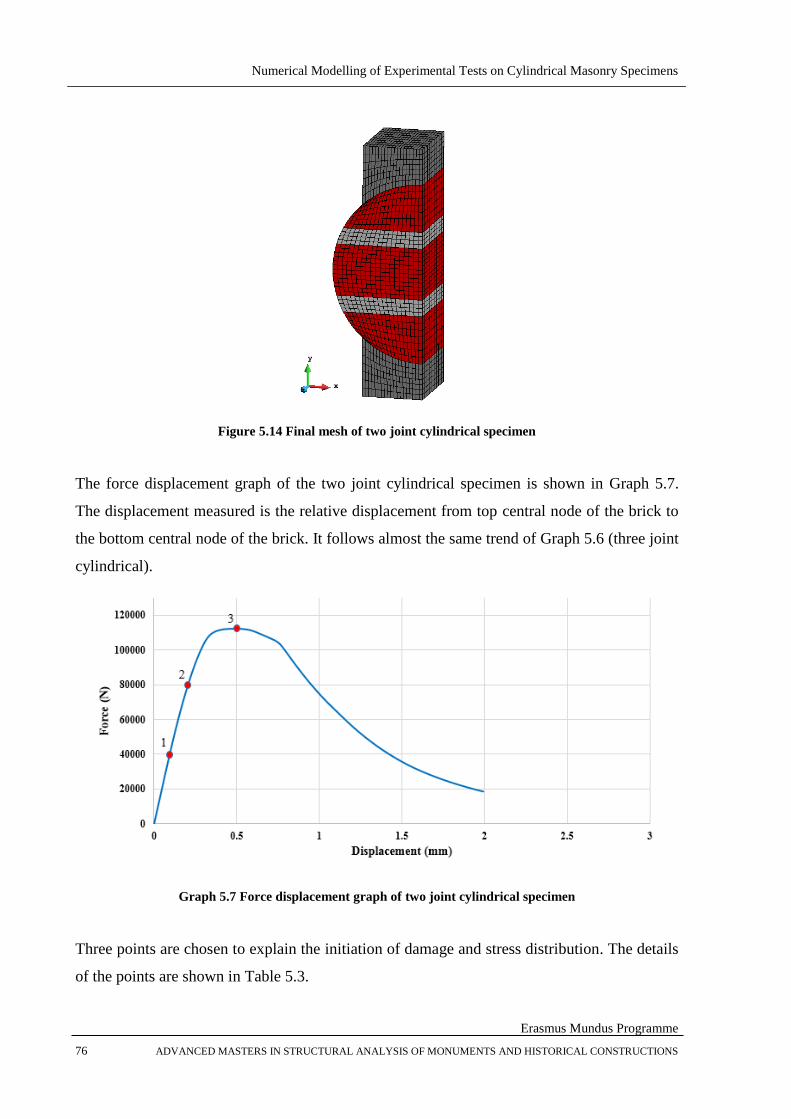
Numerical Modelling of Experimental Tests on Cylindrical Masonry Specimens
Erasmus Mundus Programme
76 ADVANCED MASTERS IN STRUCTURAL ANALYSIS OF MONUMENTS AND HISTORICAL CONSTRUCTIONS
Figure 5.14 Final mesh of two joint cylindrical specimen
The force displacement graph of the two joint cylindrical specimen is shown in Graph 5.7.
The displacement measured is the relative displacement from top central node of the brick to
the bottom central node of the brick. It follows almost the same trend of Graph 5.6 (three joint
cylindrical).
Graph 5.7 Force displacement graph of two joint cylindrical specimen
Three points are chosen to explain the initiation of damage and stress distribution. The details
of the points are shown in Table 5.3.

Numerical Modelling of Experimental Tests on Cylindrical Masonry Specimens
Erasmus Mundus Programme
ADVANCED MASTERS IN STRUCTURAL ANALYSIS OF MONUMENTS AND HISTORICAL CONSTRUCTIONS 77
Table 5.3 Description of points, referred in the force displacement graph of two joint cylinder
Point Number Force (N) Displacement (mm)
1 – Step 7 40000 0.095
2 – Step 14 81000 0.209
3 – Step 29 112000 0.496 (peak)
The evolution of tensile damage is shown in Figure 5.15. It can be seen that initiation of
damage takes place in the central brick at 35% of the maximum load. At 72% of the
maximum load, the damage is spread throughout the central brick and in the top and bottom
of the brick near the mortar. At peak even the mortar has tensile damage right below the edge
of regularization mortar.
(a)
(b)
(c)
Figure 5.15 Evolution of tensile damage in two Joint cylinder (a) Point 1 (b) Point 2 & (c) Point 3
The compressive damage evolution is shown in Figure 5.16. The damage initiates in the
mortar due to the low compressive strength till the peak strength. Only at peak there is slight
damage present in the brick. The maximum damage is 76% (mortar) whereas it is 95% in the
tensile damage (brick).
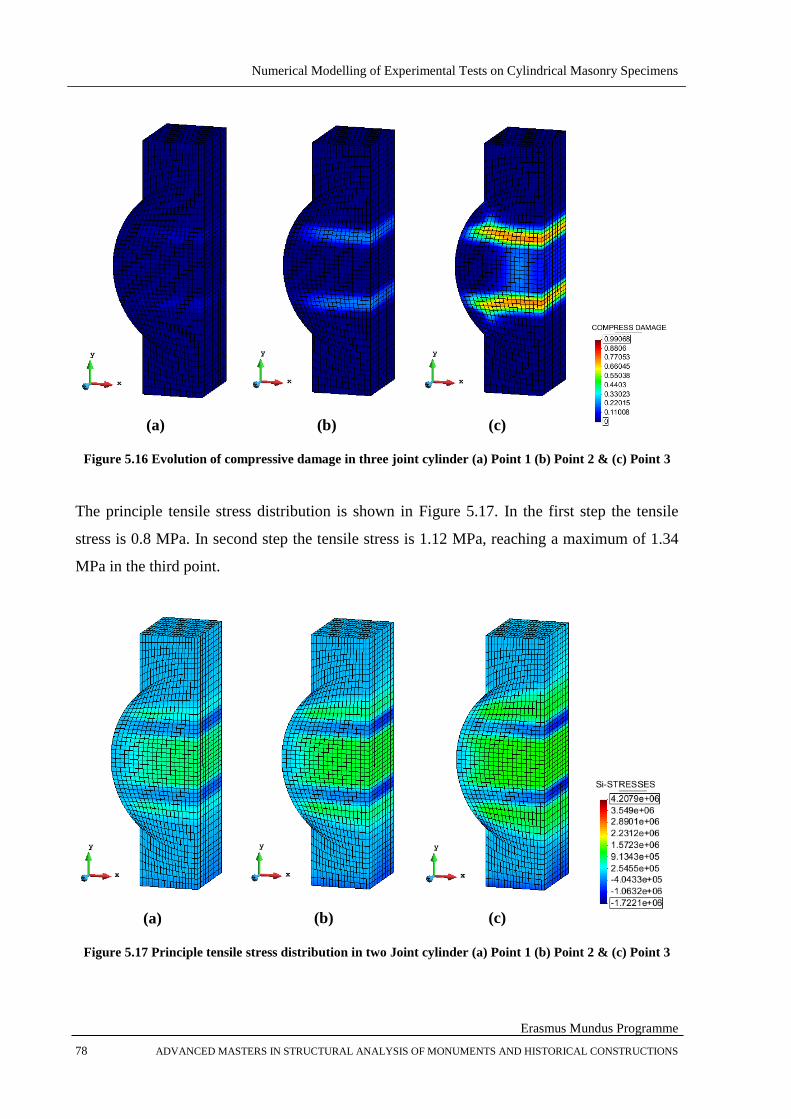
Numerical Modelling of Experimental Tests on Cylindrical Masonry Specimens
Erasmus Mundus Programme
78 ADVANCED MASTERS IN STRUCTURAL ANALYSIS OF MONUMENTS AND HISTORICAL CONSTRUCTIONS
(a)
(b)
(c)
Figure 5.16 Evolution of compressive damage in three joint cylinder (a) Point 1 (b) Point 2 & (c) Point 3
The principle tensile stress distribution is shown in Figure 5.17. In the first step the tensile
stress is 0.8 MPa. In second step the tensile stress is 1.12 MPa, reaching a maximum of 1.34
MPa in the third point.
(a)
(b)
(c)
Figure 5.17 Principle tensile stress distribution in two Joint cylinder (a) Point 1 (b) Point 2 & (c) Point 3
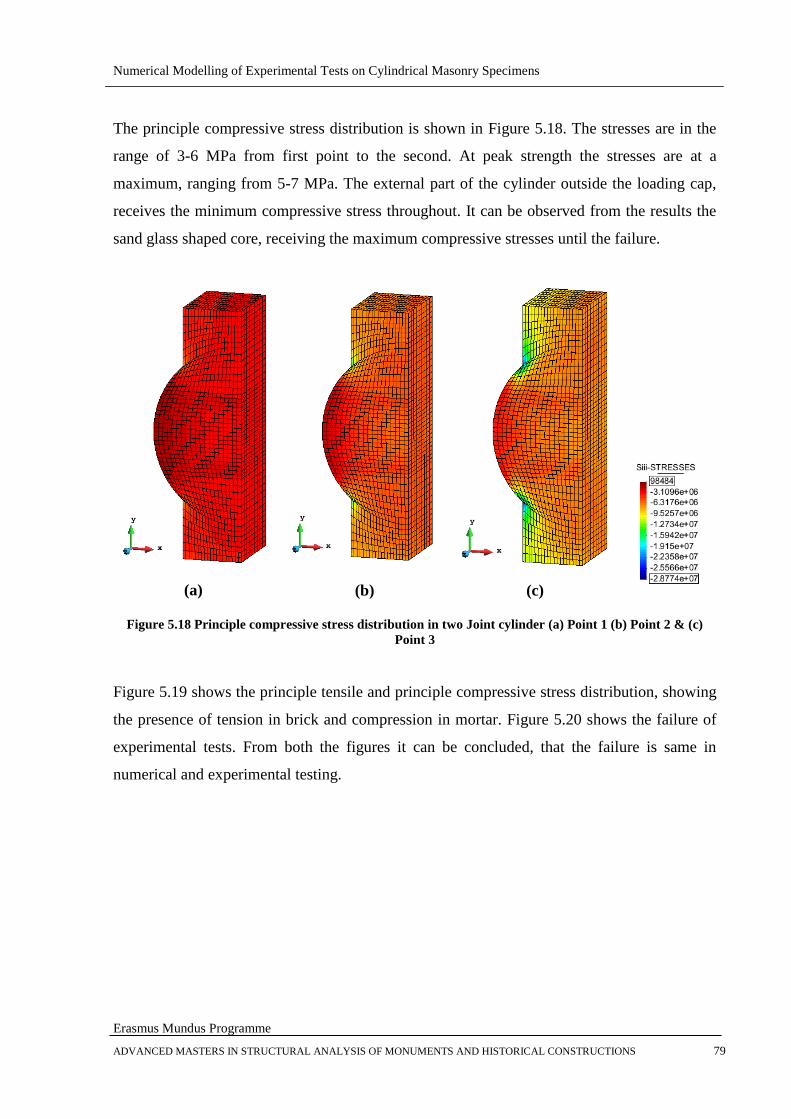
Numerical Modelling of Experimental Tests on Cylindrical Masonry Specimens
Erasmus Mundus Programme
ADVANCED MASTERS IN STRUCTURAL ANALYSIS OF MONUMENTS AND HISTORICAL CONSTRUCTIONS 79
The principle compressive stress distribution is shown in Figure 5.18. The stresses are in the
range of 3-6 MPa from first point to the second. At peak strength the stresses are at a
maximum, ranging from 5-7 MPa. The external part of the cylinder outside the loading cap,
receives the minimum compressive stress throughout. It can be observed from the results the
sand glass shaped core, receiving the maximum compressive stresses until the failure.
(a)
(b)
(c)
Figure 5.18 Principle compressive stress distribution in two Joint cylinder (a) Point 1 (b) Point 2 & (c)
Point 3
Figure 5.19 shows the principle tensile and principle compressive stress distribution, showing
the presence of tension in brick and compression in mortar. Figure 5.20 shows the failure of
experimental tests. From both the figures it can be concluded, that the failure is same in
numerical and experimental testing.
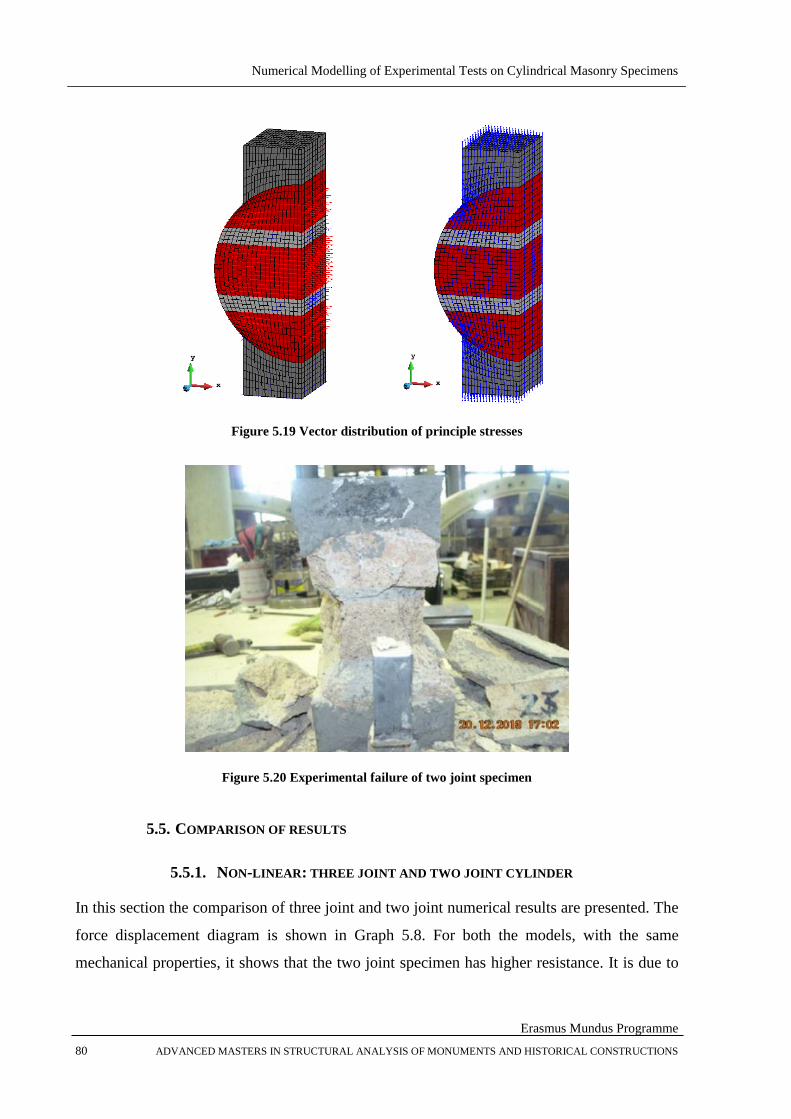
Numerical Modelling of Experimental Tests on Cylindrical Masonry Specimens
Erasmus Mundus Programme
80 ADVANCED MASTERS IN STRUCTURAL ANALYSIS OF MONUMENTS AND HISTORICAL CONSTRUCTIONS
Figure 5.19 Vector distribution of principle stresses
Figure 5.20 Experimental failure of two joint specimen
5.5. COMPARISON OF RESULTS
5.5.1. NON-LINEAR: THREE JOINT AND TWO JOINT CYLINDER
In this section the comparison of three joint and two joint numerical results are presented. The
force displacement diagram is shown in Graph 5.8. For both the models, with the same
mechanical properties, it shows that the two joint specimen has higher resistance. It is due to
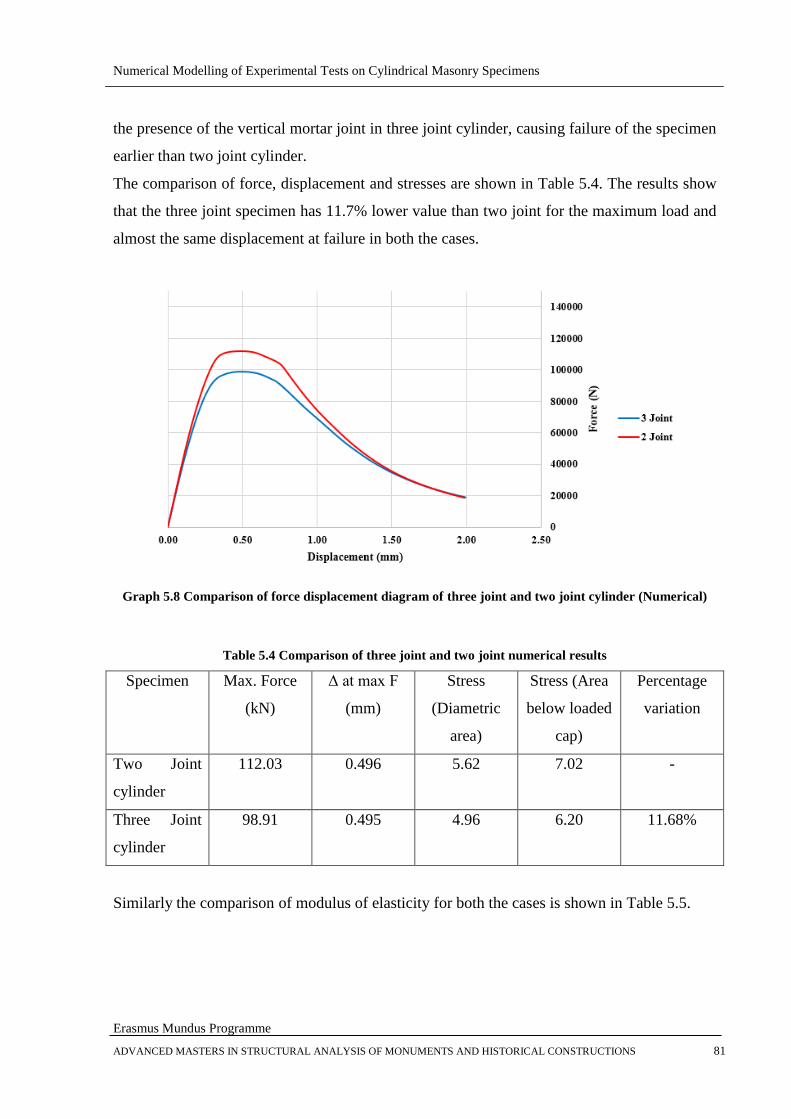
Numerical Modelling of Experimental Tests on Cylindrical Masonry Specimens
Erasmus Mundus Programme
ADVANCED MASTERS IN STRUCTURAL ANALYSIS OF MONUMENTS AND HISTORICAL CONSTRUCTIONS 81
the presence of the vertical mortar joint in three joint cylinder, causing failure of the specimen
earlier than two joint cylinder.
The comparison of force, displacement and stresses are shown in Table 5.4. The results show
that the three joint specimen has 11.7% lower value than two joint for the maximum load and
almost the same displacement at failure in both the cases.
Graph 5.8 Comparison of force displacement diagram of three joint and two joint cylinder (Numerical)
Table 5.4 Comparison of three joint and two joint numerical results
Specimen Max. Force
(kN)
Δ at max F
(mm)
Stress
(Diametric
area)
Stress (Area
below loaded
cap)
Percentage
variation
Two Joint
cylinder
112.03 0.496 5.62 7.02 -
Three Joint
cylinder
98.91 0.495 4.96 6.20 11.68%
Similarly the comparison of modulus of elasticity for both the cases is shown in Table 5.5.
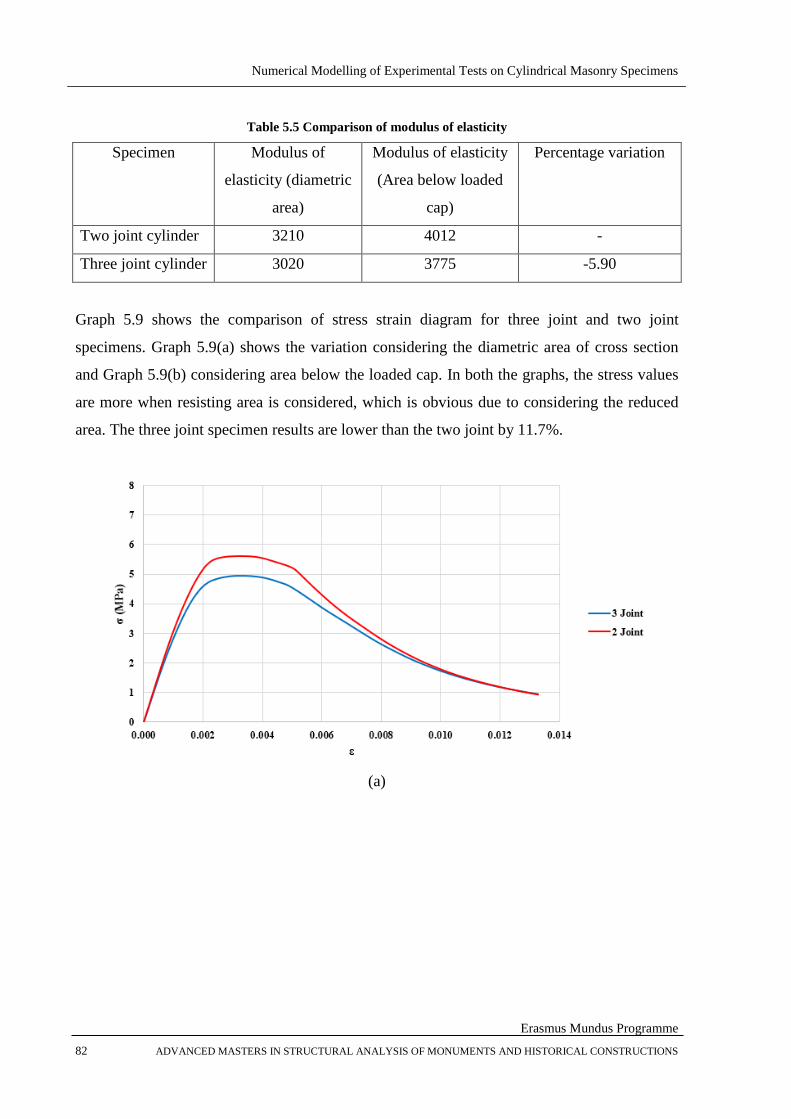
Numerical Modelling of Experimental Tests on Cylindrical Masonry Specimens
Erasmus Mundus Programme
82 ADVANCED MASTERS IN STRUCTURAL ANALYSIS OF MONUMENTS AND HISTORICAL CONSTRUCTIONS
Table 5.5 Comparison of modulus of elasticity
Specimen Modulus of
elasticity (diametric
area)
Modulus of elasticity
(Area below loaded
cap)
Percentage variation
Two joint cylinder 3210 4012 -
Three joint cylinder 3020 3775 -5.90
Graph 5.9 shows the comparison of stress strain diagram for three joint and two joint
specimens. Graph 5.9(a) shows the variation considering the diametric area of cross section
and Graph 5.9(b) considering area below the loaded cap. In both the graphs, the stress values
are more when resisting area is considered, which is obvious due to considering the reduced
area. The three joint specimen results are lower than the two joint by 11.7%.
(a)
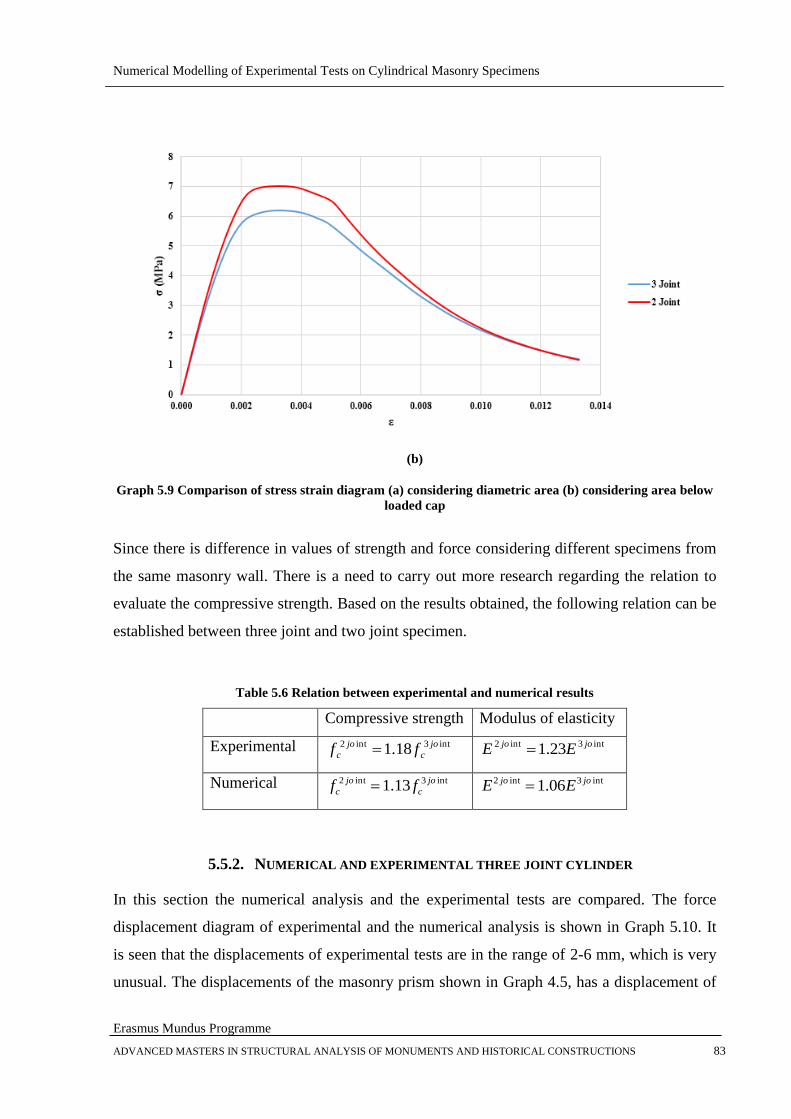
Numerical Modelling of Experimental Tests on Cylindrical Masonry Specimens
Erasmus Mundus Programme
ADVANCED MASTERS IN STRUCTURAL ANALYSIS OF MONUMENTS AND HISTORICAL CONSTRUCTIONS 83
(b)
Graph 5.9 Comparison of stress strain diagram (a) considering diametric area (b) considering area below
loaded cap
Since there is difference in values of strength and force considering different specimens from
the same masonry wall. There is a need to carry out more research regarding the relation to
evaluate the compressive strength. Based on the results obtained, the following relation can be
established between three joint and two joint specimen.
Table 5.6 Relation between experimental and numerical results
Compressive strength Modulus of elasticity
Experimental int3int2 18.1 jo
c
jo
c ff int3int2 23.1 jojo EE
Numerical int3int2 13.1 jo
c
jo
c ff int3int2 06.1 jojo EE
5.5.2. NUMERICAL AND EXPERIMENTAL THREE JOINT CYLINDER
In this section the numerical analysis and the experimental tests are compared. The force
displacement diagram of experimental and the numerical analysis is shown in Graph 5.10. It
is seen that the displacements of experimental tests are in the range of 2-6 mm, which is very
unusual. The displacements of the masonry prism shown in Graph 4.5, has a displacement of
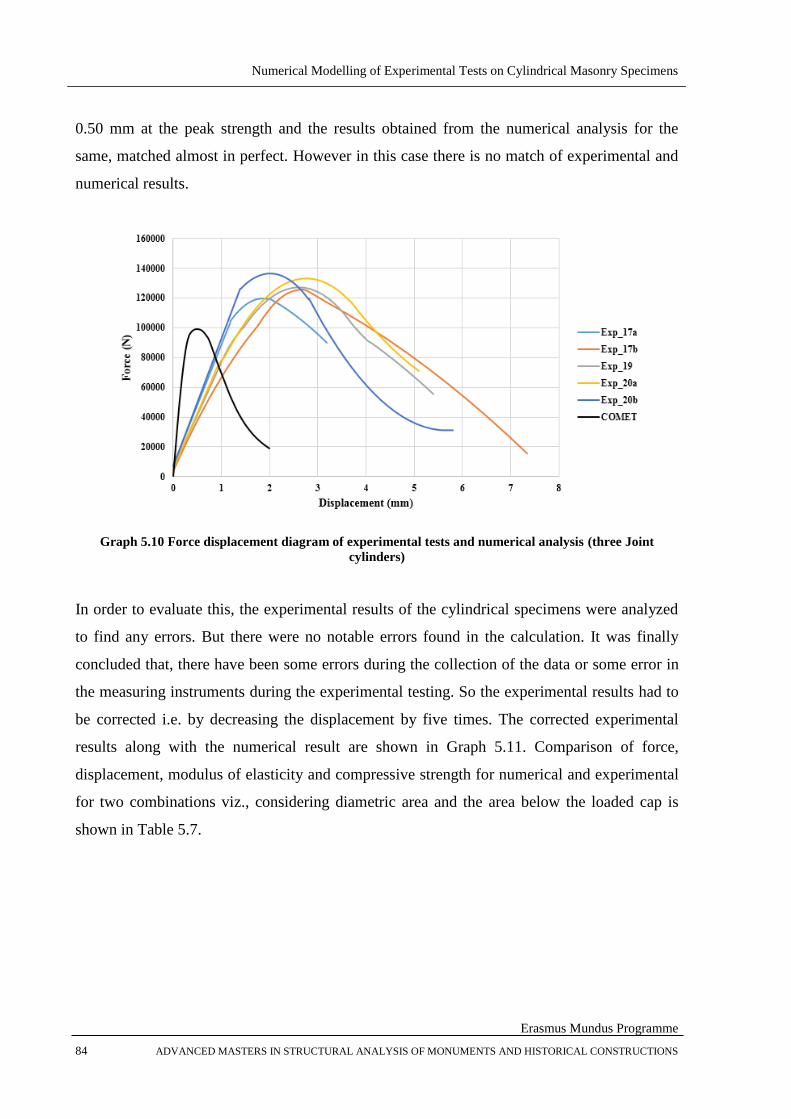
Numerical Modelling of Experimental Tests on Cylindrical Masonry Specimens
Erasmus Mundus Programme
84 ADVANCED MASTERS IN STRUCTURAL ANALYSIS OF MONUMENTS AND HISTORICAL CONSTRUCTIONS
0.50 mm at the peak strength and the results obtained from the numerical analysis for the
same, matched almost in perfect. However in this case there is no match of experimental and
numerical results.
Graph 5.10 Force displacement diagram of experimental tests and numerical analysis (three Joint
cylinders)
In order to evaluate this, the experimental results of the cylindrical specimens were analyzed
to find any errors. But there were no notable errors found in the calculation. It was finally
concluded that, there have been some errors during the collection of the data or some error in
the measuring instruments during the experimental testing. So the experimental results had to
be corrected i.e. by decreasing the displacement by five times. The corrected experimental
results along with the numerical result are shown in Graph 5.11. Comparison of force,
displacement, modulus of elasticity and compressive strength for numerical and experimental
for two combinations viz., considering diametric area and the area below the loaded cap is
shown in Table 5.7.

Numerical Modelling of Experimental Tests on Cylindrical Masonry Specimens
Erasmus Mundus Programme
ADVANCED MASTERS IN STRUCTURAL ANALYSIS OF MONUMENTS AND HISTORICAL CONSTRUCTIONS 85
Graph 5.11 Corrected experimental results along with the numerical results (three joint cylinders)
Table 5.7 Comparison of experimental and numerical results (three joint cylinders)
Avg. Exp.
(Diametric
area)
Avg. Exp.
(Area below
loaded cap)
Num.
(Diametric
area)
Num. (Area
below loaded
cap)
Max. Force (kN) 123.95 123.95 98.91 98.91
Displacement at max
force (mm)
0.47 0.47 0.50 0.50
Modulus of Elasticity
(MPa)
2888 3610 2956 3695
Compressive strength
(MPa)
6.84 8.55 4.96 6.20
Variation of
compressive strength
- +25% -28.36% -9.35%
The numerical analysis predicts lower compressive strength with respect to experimental
results in both the cases (Brencich et al., (2004), Bilello et al., (2007), A Brencich et al.,
(2006)). The comparison of stress strain diagram for experimental and numerical analysis is
shown in Graph 5.12 (a) and (b). (a) Is considering the diametric area of cross section and (b)
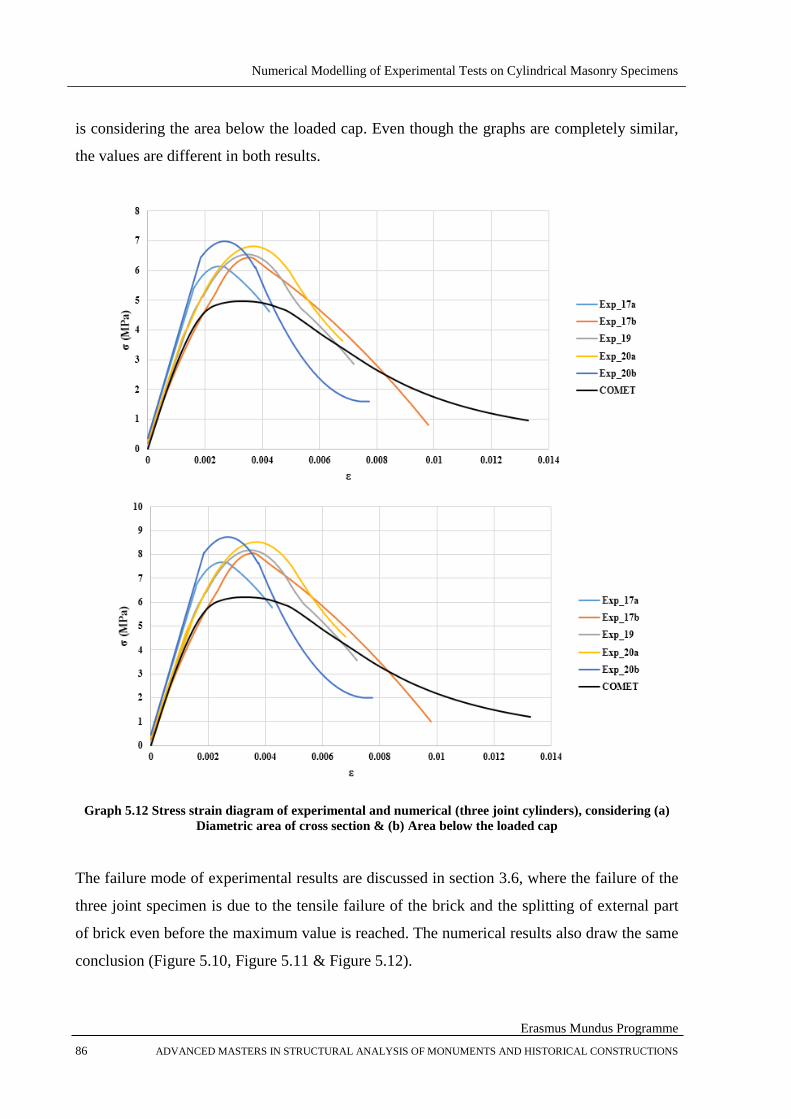
Numerical Modelling of Experimental Tests on Cylindrical Masonry Specimens
Erasmus Mundus Programme
86 ADVANCED MASTERS IN STRUCTURAL ANALYSIS OF MONUMENTS AND HISTORICAL CONSTRUCTIONS
is considering the area below the loaded cap. Even though the graphs are completely similar,
the values are different in both results.
Graph 5.12 Stress strain diagram of experimental and numerical (three joint cylinders), considering (a)
Diametric area of cross section & (b) Area below the loaded cap
The failure mode of experimental results are discussed in section 3.6, where the failure of the
three joint specimen is due to the tensile failure of the brick and the splitting of external part
of brick even before the maximum value is reached. The numerical results also draw the same
conclusion (Figure 5.10, Figure 5.11 & Figure 5.12).
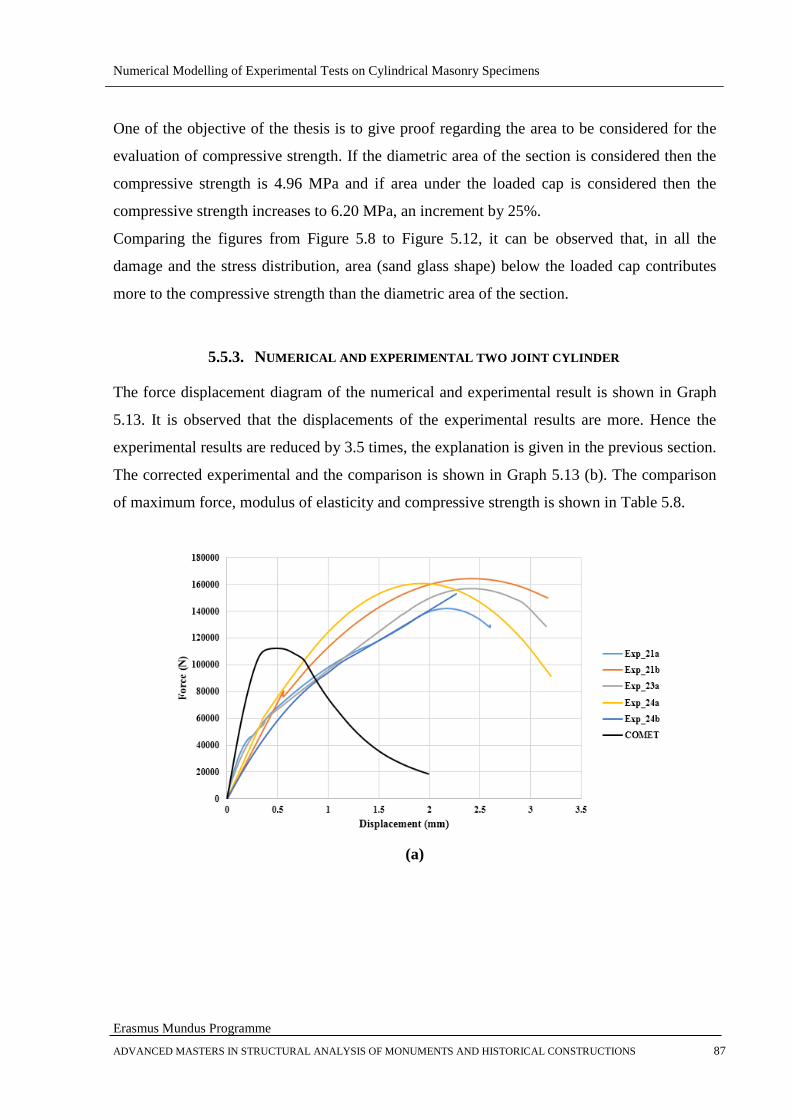
Numerical Modelling of Experimental Tests on Cylindrical Masonry Specimens
Erasmus Mundus Programme
ADVANCED MASTERS IN STRUCTURAL ANALYSIS OF MONUMENTS AND HISTORICAL CONSTRUCTIONS 87
One of the objective of the thesis is to give proof regarding the area to be considered for the
evaluation of compressive strength. If the diametric area of the section is considered then the
compressive strength is 4.96 MPa and if area under the loaded cap is considered then the
compressive strength increases to 6.20 MPa, an increment by 25%.
Comparing the figures from Figure 5.8 to Figure 5.12, it can be observed that, in all the
damage and the stress distribution, area (sand glass shape) below the loaded cap contributes
more to the compressive strength than the diametric area of the section.
5.5.3. NUMERICAL AND EXPERIMENTAL TWO JOINT CYLINDER
The force displacement diagram of the numerical and experimental result is shown in Graph
5.13. It is observed that the displacements of the experimental results are more. Hence the
experimental results are reduced by 3.5 times, the explanation is given in the previous section.
The corrected experimental and the comparison is shown in Graph 5.13 (b). The comparison
of maximum force, modulus of elasticity and compressive strength is shown in Table 5.8.
(a)
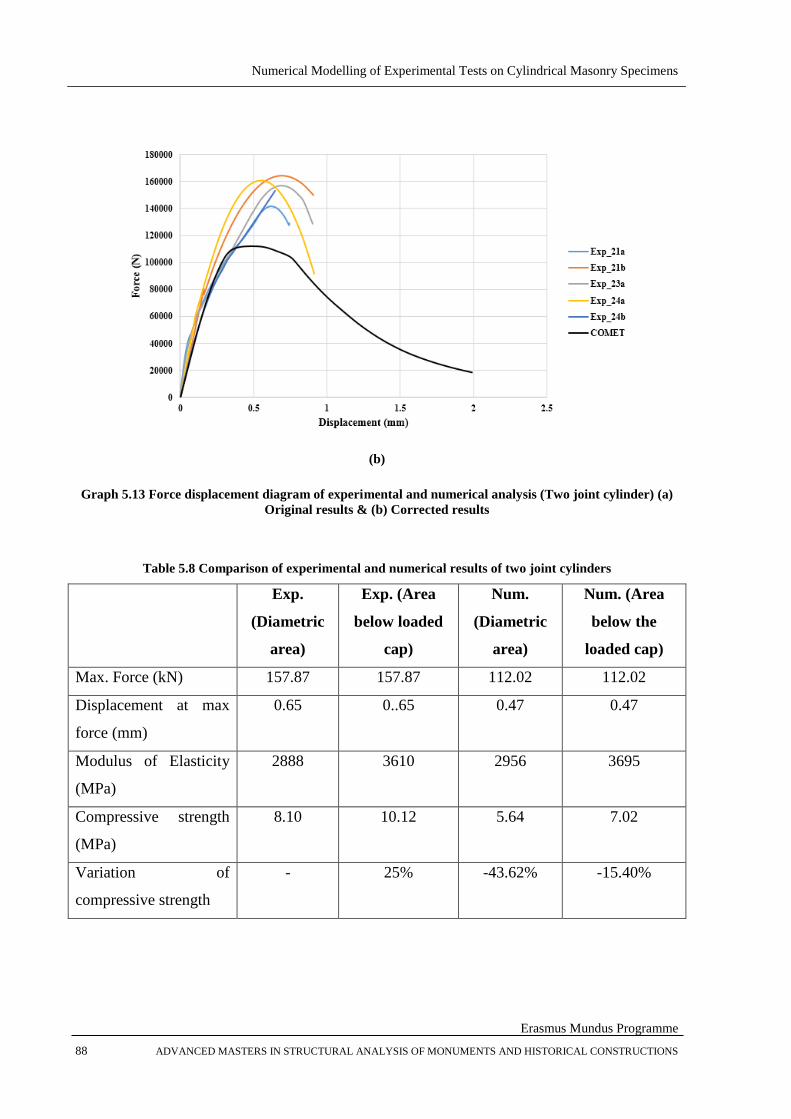
Numerical Modelling of Experimental Tests on Cylindrical Masonry Specimens
Erasmus Mundus Programme
88 ADVANCED MASTERS IN STRUCTURAL ANALYSIS OF MONUMENTS AND HISTORICAL CONSTRUCTIONS
(b)
Graph 5.13 Force displacement diagram of experimental and numerical analysis (Two joint cylinder) (a)
Original results & (b) Corrected results
Table 5.8 Comparison of experimental and numerical results of two joint cylinders
Exp.
(Diametric
area)
Exp. (Area
below loaded
cap)
Num.
(Diametric
area)
Num. (Area
below the
loaded cap)
Max. Force (kN) 157.87 157.87 112.02 112.02
Displacement at max
force (mm)
0.65 0..65 0.47 0.47
Modulus of Elasticity
(MPa)
2888 3610 2956 3695
Compressive strength
(MPa)
8.10 10.12 5.64 7.02
Variation of
compressive strength
- 25% -43.62% -15.40%
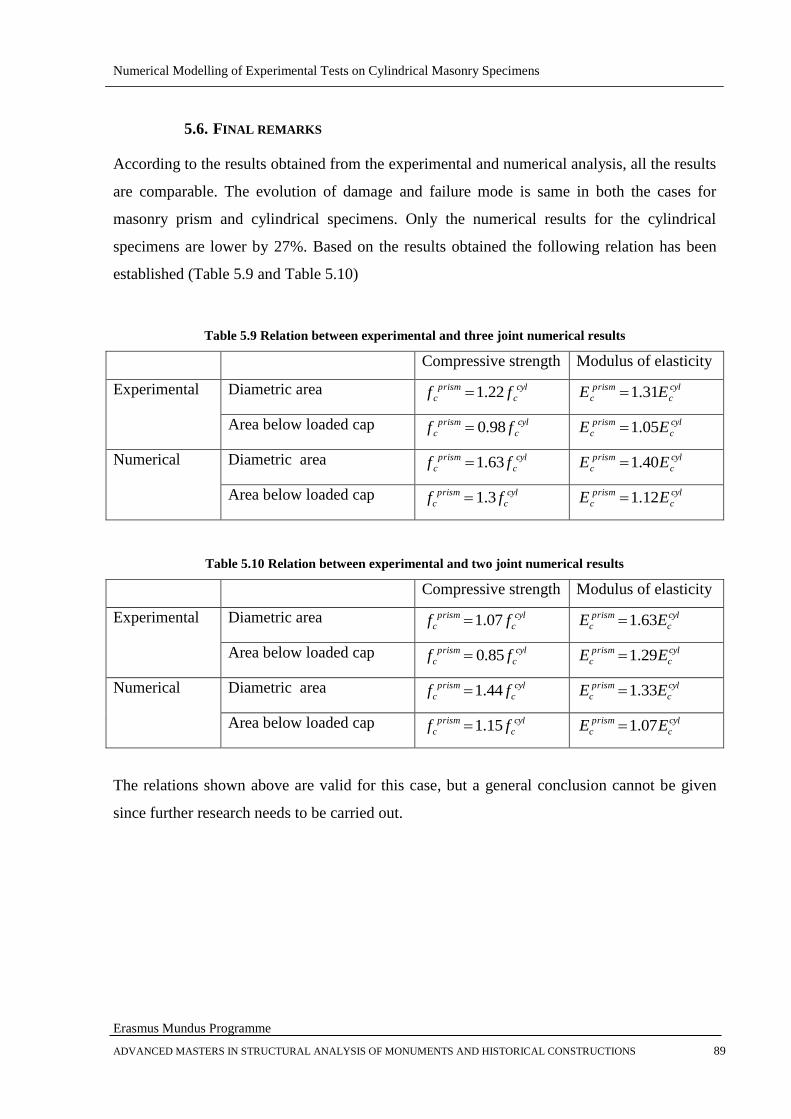
Numerical Modelling of Experimental Tests on Cylindrical Masonry Specimens
Erasmus Mundus Programme
ADVANCED MASTERS IN STRUCTURAL ANALYSIS OF MONUMENTS AND HISTORICAL CONSTRUCTIONS 89
5.6. FINAL REMARKS
According to the results obtained from the experimental and numerical analysis, all the results
are comparable. The evolution of damage and failure mode is same in both the cases for
masonry prism and cylindrical specimens. Only the numerical results for the cylindrical
specimens are lower by 27%. Based on the results obtained the following relation has been
established (Table 5.9 and Table 5.10)
Table 5.9 Relation between experimental and three joint numerical results
Compressive strength Modulus of elasticity
Experimental Diametric area cyl
c
prism
c ff 22.1 cyl
c
prism
c EE 31.1
Area below loaded cap cyl
c
prism
c ff 98.0 cyl
c
prism
c EE 05.1
Numerical Diametric area cyl
c
prism
c ff 63.1 cyl
c
prism
c EE 40.1
Area below loaded cap cyl
c
prism
c ff 3.1 cyl
c
prism
c EE 12.1
Table 5.10 Relation between experimental and two joint numerical results
Compressive strength Modulus of elasticity
Experimental Diametric area cyl
c
prism
c ff 07.1 cyl
c
prism
c EE 63.1
Area below loaded cap cyl
c
prism
c ff 85.0 cyl
c
prism
c EE 29.1
Numerical Diametric area cyl
c
prism
c ff 44.1 cyl
c
prism
c EE 33.1
Area below loaded cap cyl
c
prism
c ff 15.1 cyl
c
prism
c EE 07.1
The relations shown above are valid for this case, but a general conclusion cannot be given
since further research needs to be carried out.
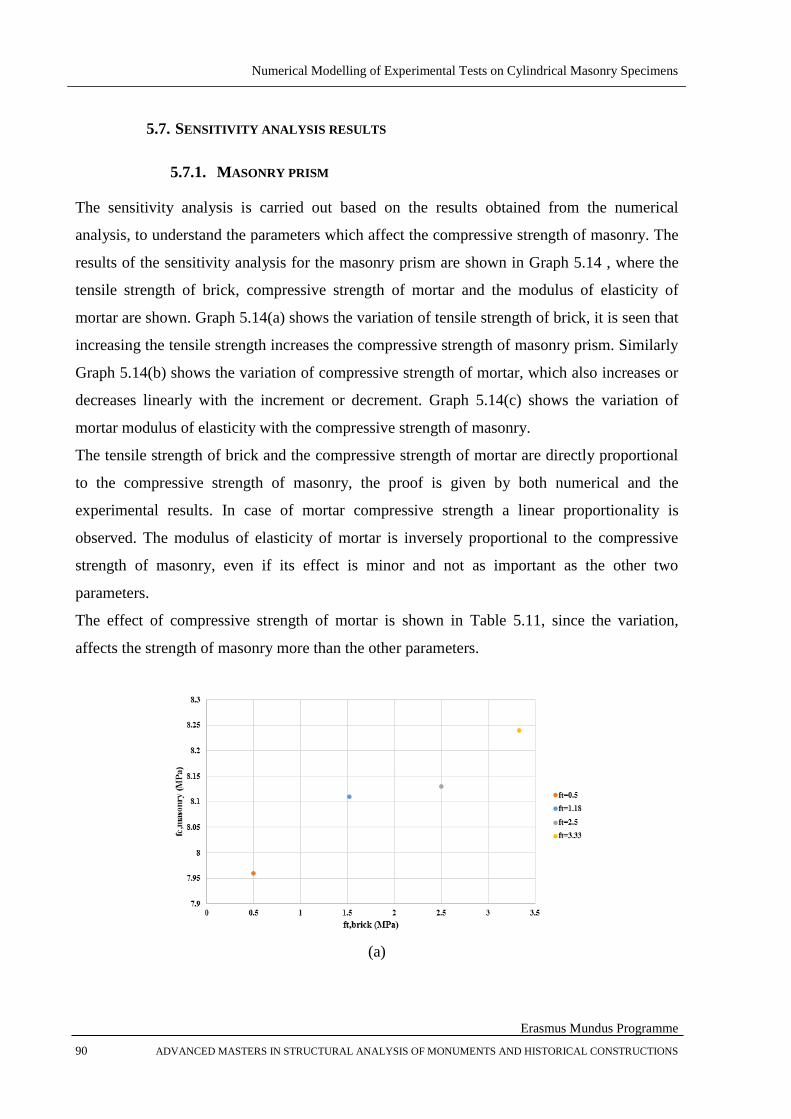
Numerical Modelling of Experimental Tests on Cylindrical Masonry Specimens
Erasmus Mundus Programme
90 ADVANCED MASTERS IN STRUCTURAL ANALYSIS OF MONUMENTS AND HISTORICAL CONSTRUCTIONS
5.7. SENSITIVITY ANALYSIS RESULTS
5.7.1. MASONRY PRISM
The sensitivity analysis is carried out based on the results obtained from the numerical
analysis, to understand the parameters which affect the compressive strength of masonry. The
results of the sensitivity analysis for the masonry prism are shown in Graph 5.14 , where the
tensile strength of brick, compressive strength of mortar and the modulus of elasticity of
mortar are shown. Graph 5.14(a) shows the variation of tensile strength of brick, it is seen that
increasing the tensile strength increases the compressive strength of masonry prism. Similarly
Graph 5.14(b) shows the variation of compressive strength of mortar, which also increases or
decreases linearly with the increment or decrement. Graph 5.14(c) shows the variation of
mortar modulus of elasticity with the compressive strength of masonry.
The tensile strength of brick and the compressive strength of mortar are directly proportional
to the compressive strength of masonry, the proof is given by both numerical and the
experimental results. In case of mortar compressive strength a linear proportionality is
observed. The modulus of elasticity of mortar is inversely proportional to the compressive
strength of masonry, even if its effect is minor and not as important as the other two
parameters.
The effect of compressive strength of mortar is shown in Table 5.11, since the variation,
affects the strength of masonry more than the other parameters.
(a)
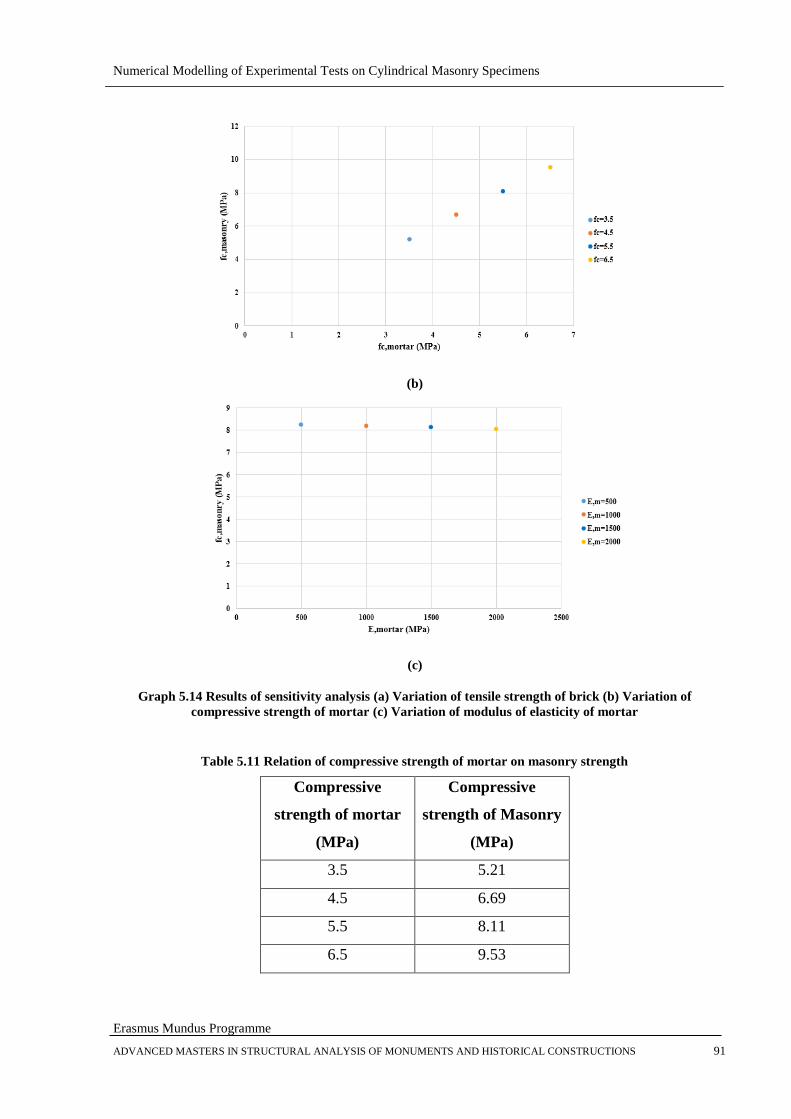
Numerical Modelling of Experimental Tests on Cylindrical Masonry Specimens
Erasmus Mundus Programme
ADVANCED MASTERS IN STRUCTURAL ANALYSIS OF MONUMENTS AND HISTORICAL CONSTRUCTIONS 91
(b)
(c)
Graph 5.14 Results of sensitivity analysis (a) Variation of tensile strength of brick (b) Variation of
compressive strength of mortar (c) Variation of modulus of elasticity of mortar
Table 5.11 Relation of compressive strength of mortar on masonry strength
Compressive
strength of mortar
(MPa)
Compressive
strength of Masonry
(MPa)
3.5 5.21
4.5 6.69
5.5 8.11
6.5 9.53
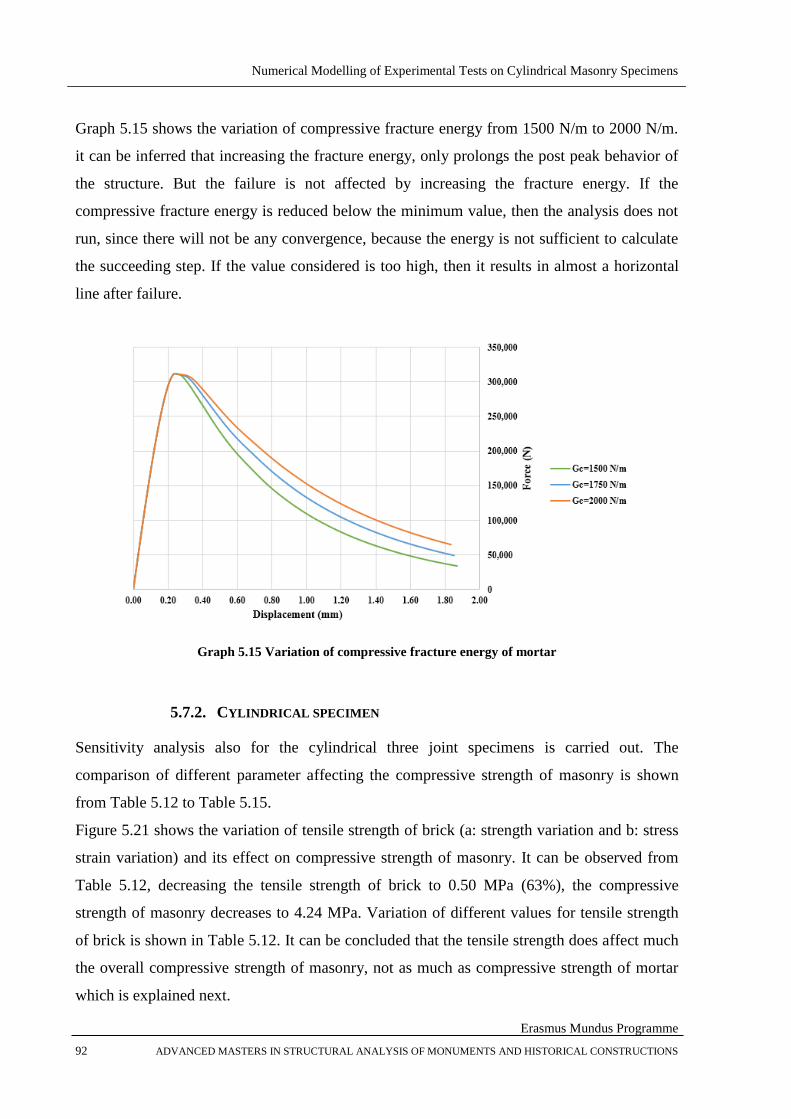
Numerical Modelling of Experimental Tests on Cylindrical Masonry Specimens
Erasmus Mundus Programme
92 ADVANCED MASTERS IN STRUCTURAL ANALYSIS OF MONUMENTS AND HISTORICAL CONSTRUCTIONS
Graph 5.15 shows the variation of compressive fracture energy from 1500 N/m to 2000 N/m.
it can be inferred that increasing the fracture energy, only prolongs the post peak behavior of
the structure. But the failure is not affected by increasing the fracture energy. If the
compressive fracture energy is reduced below the minimum value, then the analysis does not
run, since there will not be any convergence, because the energy is not sufficient to calculate
the succeeding step. If the value considered is too high, then it results in almost a horizontal
line after failure.
Graph 5.15 Variation of compressive fracture energy of mortar
5.7.2. CYLINDRICAL SPECIMEN
Sensitivity analysis also for the cylindrical three joint specimens is carried out. The
comparison of different parameter affecting the compressive strength of masonry is shown
from Table 5.12 to Table 5.15.
Figure 5.21 shows the variation of tensile strength of brick (a: strength variation and b: stress
strain variation) and its effect on compressive strength of masonry. It can be observed from
Table 5.12, decreasing the tensile strength of brick to 0.50 MPa (63%), the compressive
strength of masonry decreases to 4.24 MPa. Variation of different values for tensile strength
of brick is shown in Table 5.12. It can be concluded that the tensile strength does affect much
the overall compressive strength of masonry, not as much as compressive strength of mortar
which is explained next.
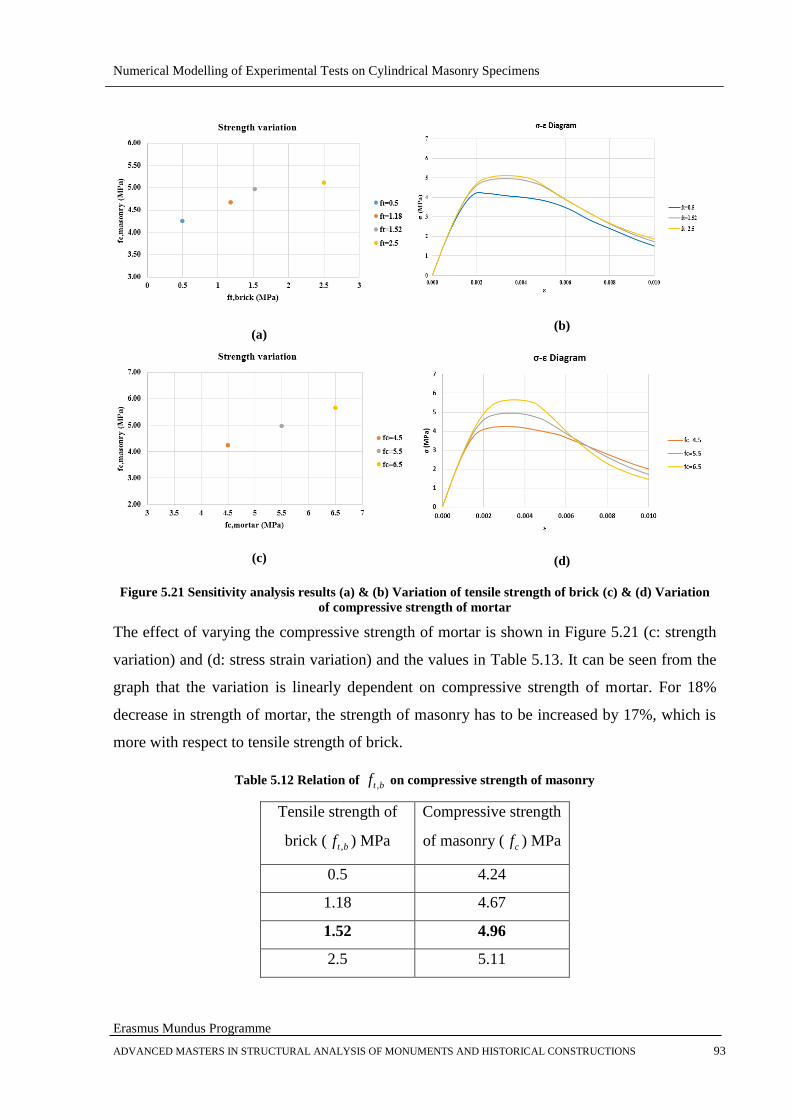
Numerical Modelling of Experimental Tests on Cylindrical Masonry Specimens
Erasmus Mundus Programme
ADVANCED MASTERS IN STRUCTURAL ANALYSIS OF MONUMENTS AND HISTORICAL CONSTRUCTIONS 93
(a)
(b)
(c)
(d)
Figure 5.21 Sensitivity analysis results (a) & (b) Variation of tensile strength of brick (c) & (d) Variation
of compressive strength of mortar
The effect of varying the compressive strength of mortar is shown in Figure 5.21 (c: strength
variation) and (d: stress strain variation) and the values in Table 5.13. It can be seen from the
graph that the variation is linearly dependent on compressive strength of mortar. For 18%
decrease in strength of mortar, the strength of masonry has to be increased by 17%, which is
more with respect to tensile strength of brick.
Table 5.12 Relation of btf , on compressive strength of masonry
Tensile strength of
brick ( btf , ) MPa
Compressive strength
of masonry ( cf ) MPa
0.5 4.24
1.18 4.67
1.52 4.96
2.5 5.11
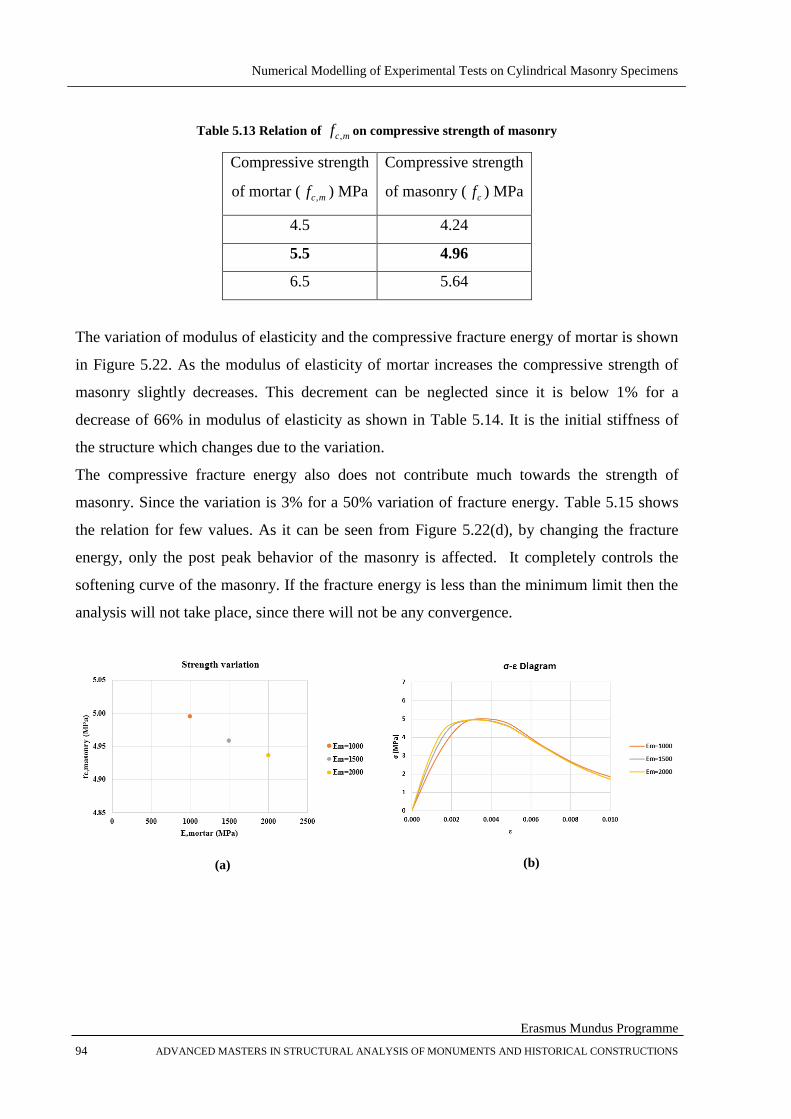
Numerical Modelling of Experimental Tests on Cylindrical Masonry Specimens
Erasmus Mundus Programme
94 ADVANCED MASTERS IN STRUCTURAL ANALYSIS OF MONUMENTS AND HISTORICAL CONSTRUCTIONS
Table 5.13 Relation of mcf , on compressive strength of masonry
Compressive strength
of mortar ( mcf , ) MPa
Compressive strength
of masonry ( cf ) MPa
4.5 4.24
5.5 4.96
6.5 5.64
The variation of modulus of elasticity and the compressive fracture energy of mortar is shown
in Figure 5.22. As the modulus of elasticity of mortar increases the compressive strength of
masonry slightly decreases. This decrement can be neglected since it is below 1% for a
decrease of 66% in modulus of elasticity as shown in Table 5.14. It is the initial stiffness of
the structure which changes due to the variation.
The compressive fracture energy also does not contribute much towards the strength of
masonry. Since the variation is 3% for a 50% variation of fracture energy. Table 5.15 shows
the relation for few values. As it can be seen from Figure 5.22(d), by changing the fracture
energy, only the post peak behavior of the masonry is affected. It completely controls the
softening curve of the masonry. If the fracture energy is less than the minimum limit then the
analysis will not take place, since there will not be any convergence.
(a)
(b)
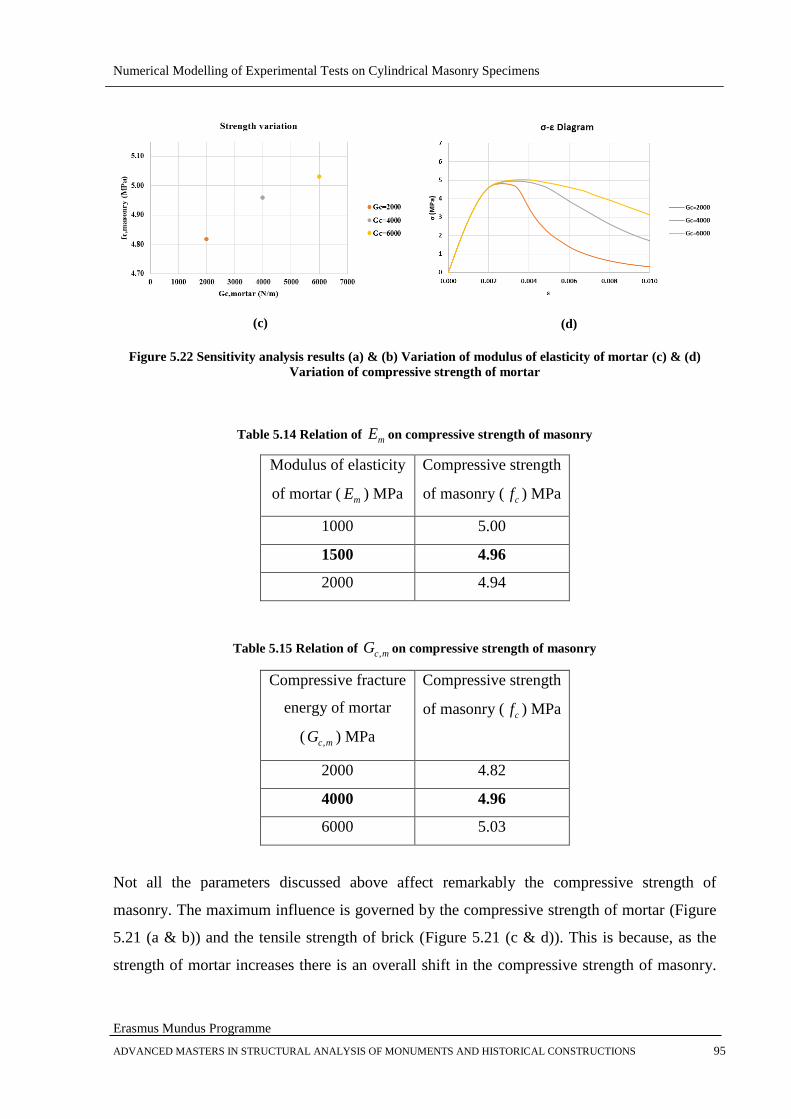
Numerical Modelling of Experimental Tests on Cylindrical Masonry Specimens
Erasmus Mundus Programme
ADVANCED MASTERS IN STRUCTURAL ANALYSIS OF MONUMENTS AND HISTORICAL CONSTRUCTIONS 95
(c)
(d)
Figure 5.22 Sensitivity analysis results (a) & (b) Variation of modulus of elasticity of mortar (c) & (d)
Variation of compressive strength of mortar
Table 5.14 Relation of mE on compressive strength of masonry
Modulus of elasticity
of mortar ( mE ) MPa
Compressive strength
of masonry ( cf ) MPa
1000 5.00
1500 4.96
2000 4.94
Table 5.15 Relation of mcG , on compressive strength of masonry
Compressive fracture
energy of mortar
( mcG , ) MPa
Compressive strength
of masonry ( cf ) MPa
2000 4.82
4000 4.96
6000 5.03
Not all the parameters discussed above affect remarkably the compressive strength of
masonry. The maximum influence is governed by the compressive strength of mortar (Figure
5.21 (a & b)) and the tensile strength of brick (Figure 5.21 (c & d)). This is because, as the
strength of mortar increases there is an overall shift in the compressive strength of masonry.
Numerical Modelling of Experimental Tests on Cylindrical Masonry Specimens
Erasmus Mundus Programme
96 ADVANCED MASTERS IN STRUCTURAL ANALYSIS OF MONUMENTS AND HISTORICAL CONSTRUCTIONS
This shift is only up to a limit viz., until the difference between compressive strength of
mortar and brick is high.
The failure of masonry is governed by the tensile failure of brick. As there is an increment in
compressive strength of mortar the tensile stresses contributing to the failure also increases,
mainly in the out of plane direction.
The variation of modulus elasticity controls the initial stiffness and the variation of fracture
energy controls the post peak behavior majorly, but both parameters do not affect appreciably
the compressive strength of masonry.

Numerical Modelling of Experimental Tests on Cylindrical Masonry Specimens
Erasmus Mundus Programme
ADVANCED MASTERS IN STRUCTURAL ANALYSIS OF MONUMENTS AND HISTORICAL CONSTRUCTIONS 97
6. CONCLUSIONS
6.1. SUMMARY
The present work deals with performing numerical analysis on cylindrical masonry specimens
to determine the compressive strength. The main idea is to extract cylindrical specimens from
a masonry wall and performing laboratory tests to determine their strengths according to UIC
778-3R guidelines (UIC 1995). In order to check the experimental results obtained and to
understand better the evolution of damage and stress distribution, numerical analysis is carried
out by assuming the same properties obtained from the experimental results of previous
research by Peverini (2014) and Usan Cano (2014).
Chapter 1 and 2 present the introduction and state of art of the thesis, with a general
description on the behaviour of masonry, units and mortar. The uniaxial behaviour of
masonry in tension and in compression is also mentioned. Few theories and formulae are
presented which are used in general to calculate the compressive strength of masonry which
involves the Euro code 6, equation proposed by Hilsdorf (1969), Khoo and Hendry (1975),
Ohler (1986). Methods to determine the compressive strength of old and new masonries is
also discussed, introducing the research on cylindrical specimens.
In chapter 3, the experimental campaign carried out and the results of the previous research
are presented. The chapter explains the new way of extracting cylindrical specimens from
masonry wall, which was carried out to overcome the drawbacks of previous campaign. Then
the methodology, codes, experiments and the results on brick, mortar, masonry prism and
cylindrical specimens carried out in the laboratory are discussed.
Chapter 4 deals with a brief introduction of constitutive model used in the present work. The
numerical analysis is carried out in the Finite element software “COMET (Cervera et al.
2002). In order to validate and check the results obtained by the new software, a bench mark
analysis in 2D and 3D is carried out referring to Berto et al (2005), from which the model was
referred and analysed. This analysis was chosen since the author uses almost the same
constitutive model, used in the present thesis. The results of both the analysis are in good
agreement.
After the calibration of the constitutive model and the software, the masonry prism was
analysed, taking the results from the experimental research. This was carried out to check and
Numerical Modelling of Experimental Tests on Cylindrical Masonry Specimens
Erasmus Mundus Programme
98 ADVANCED MASTERS IN STRUCTURAL ANALYSIS OF MONUMENTS AND HISTORICAL CONSTRUCTIONS
compare the results with the experimental testing, for the same properties of prisms and
cylindrical specimens. The tensile damage, compressive damage, tensile stress, compressive
stress and the vector distribution are all explained in detail with figures referring to specific
points in the force displacement diagram. After performing the sensitivity analysis, the results
were matched. Then the comparison of the results with the experimental results is carried out.
Finally the three joint and two joint cylindrical specimens are modelled and analysed. First
the linear analysis is carried out and then the non-linear analysis. Comparison of linear and
non-linear analysis is performed to understand the initiation of damage and the failure modes.
The experimental results are compared with non-linear analysis, to analyse if the strength,
damage and failure are in the same pattern. It is observed that in both the experimental and
numerical results, the damage and the failure appear to be the same. But only the strengths are
lower in the numerical analysis than in the experiments.
In the conclusion, relation between the experimental and numerical results are carried out,
which are closer to the relation given in Bilello et al., (2007). The results of the sensitivity
analysis carried out by varying the tensile strength of brick, compressive strength of mortar,
modulus of elasticity of mortar and compressive fracture energy of mortar and their effect on
the compressive strength of masonry is presented. It shows that varying tensile strength of
brick and compressive strength of mortar affects most the compressive strength of masonry.
All the research carried out is to widen the data available for the experimental and numerical
analysis in compressive strength determination of cylindrical masonry specimens.
6.2. CONCLUSIONS
In the light of the results obtained and observations made during the present investigation, it is
possible to draw the following conclusions:
The compressive strength of masonry can be adequately simulated by extracting
cylindrical masonry specimens from the existing structures and subjecting them to
laboratory testing;
The compressive strength of cylindrical specimens shows good relation with the
compressive strength of masonry prisms. The results are closer if the area below the
loaded cap is considered for strength estimation;
Numerical Modelling of Experimental Tests on Cylindrical Masonry Specimens
Erasmus Mundus Programme
ADVANCED MASTERS IN STRUCTURAL ANALYSIS OF MONUMENTS AND HISTORICAL CONSTRUCTIONS 99
The compressive strength of mortar and the tensile strength of brick are the main
parameters influencing the compressive strength of masonry;
The compressive fracture energy of mortar controls the post peak behaviour of
masonry and the Young’s modulus of mortar controls the stiffness of the masonry
structures.
The tensile damage initiates closer to the mortar propagating within the brick and the
compressive damage initiates in the mortar joints.
In brickwork, with strong brick and weak mortar combination, the failure is due to the
tensile failure of the bricks. Considerable contribution of the out of plane stresses for
the failure can be noticed.
6.3. SCOPE FOR FUTURE WORK
Based on the results obtained from numerical model and the experimental works, the
following suggestions can be carried out to deepen the information regarding the research
topic.
Performing experimental and numerical analysis simultaneously. It helps in
understanding the problem better. Because of the time constrain, the experimental
works were not completed viz., the testing of extracted cylindrical specimens needs to
be carried out in future.
To understand the position of extraction, which involves three joint, two joint or one
joint specimens for testing.
Research on dimensions of the regularization mortar, as it effects the confinement of
cylindrical specimens which in turn affects the results.
Performing experimental testing with the data necessary to obtain the tensile and
compressive fracture energies of brick and mortar, since they play an important role as
a value of input in the numerical analysis, affecting the results.
Improving the constitutive law, by changing the compression failure criterion of
mortar with one more pressure sensitive to account for the confinement effects.
Since this is a non-standard test carried out by following the UIC 778-3R guidelines,
scope for standardising the method.
Numerical Modelling of Experimental Tests on Cylindrical Masonry Specimens
Erasmus Mundus Programme
100 ADVANCED MASTERS IN STRUCTURAL ANALYSIS OF MONUMENTS AND HISTORICAL CONSTRUCTIONS
Carrying out tests also on bigger wallets, according to the EN 1052-1 standard, in
order to obtain a broader comparison between the behaviour of cores and that of larger
specimens.
Numerical Modelling of Experimental Tests on Cylindrical Masonry Specimens
Erasmus Mundus Programme
ADVANCED MASTERS IN STRUCTURAL ANALYSIS OF MONUMENTS AND HISTORICAL CONSTRUCTIONS 101
REFERENCES
Berto, L. (2005). Failure mechanism of masonry prism loaded in axial compression:
computational aspects. Materials and Structures, 38(276), 249–256. doi:10.1617/14096
Benedetti, Andrea & Pelà Luca (2012). Experimental characterization of mortar by testing on
small specimens, 15th International Brick and Block Masonry conference, Floriano.
Bilello, C., Brencich, A., Corradi, C., Paola, M. Di, & Sterpi, E. (2007). Experimental tests
and theoritical issues for the identification of existing brickwork, Tenth North Americal
masonry Conference, St. Louis, Missouri, USA pp 964–974.
Brencich, a., Corradi, C., & Gambarotta, L. (2008). Eccentrically loaded brickwork:
Theoretical and experimental results. Engineering Structures, 30(12), 3629–3643.
doi:10.1016/j.engstruct.2008.05.010
Brencich, A., Corradi, C., Gambarotta, L., Mantegazza, G., & Sterpi, E. (2006). Compressive
Strength of Solid Clay Brick Masonry under Eccentric Loading.
Brencich, A., & Sterpi, E. (2006). Compressive Strength of Solid Clay Brick Masonry :
Calibration of Experimental Tests and Theoretical Issues, Structural analysis of
Historical Constructions, New Delhi.
Brencich, A., Corradi, C., & Sterpi, E. (2004). Experimental Approaches to the compressive
response of solid clay brick masonry, 13th International Brick and Block Masonry
Conference Amsterdam, pp 1–10.
CEB-FIP - 1993 - Model Code 1990 COmite Euro-International Du Beton.
CEN - 2007 - BS-EN 1015-11 - Methods of test for mortar for masonry - Part 11
Determination of flexural and compressive strength of hardened mortar.
Cervera M, Agelet de Saracibar C, Chiumenti M. COMET: Coupled mechanical and Thermal
analysis – data input manual version 5.0. Technical report IT-308. CIMNE, Technical
University of Catalonia; 2002.
EN 772‐1 (2002). Methods of test for masonry units. Part 1: Determination of the
compressive strength. European Committee for Standardization, Brussels, Belgium.

Numerical Modelling of Experimental Tests on Cylindrical Masonry Specimens
Erasmus Mundus Programme
102 ADVANCED MASTERS IN STRUCTURAL ANALYSIS OF MONUMENTS AND HISTORICAL CONSTRUCTIONS
EN 1015‐11 (1999). Methods of test for mortar masonry. Part 11: Determination of flexural
and compressive strength of hardened mortar. European Committee for Standardization,
Brussels, Belgium.
Eurocode 6 part 1-1 (1996). Design of masonry structures, part 1-1: General rules for
reinforced and unreinforced masonry structures. UNE - ENV 1996-11.
Faria, R., Oliver, J., & Cervera, M. (1998). A strain-based plastic viscous-damage model for
massive concrete structures. International Journal of Solids and Structures, 35(14),
1533–1558. doi:10.1016/S0020-7683(97)00119-4
GiD: the personal pre and post-processor. CIMNE, Technical University of Catalonia; 2002.
<http://gid.cimne.upc.es.
Hendry A.W. (1990). Structural masonry. Macmillan Education, London, UK.
Hilsdorf, H. K. (1969). Investigation into the failure mechanism of brick masonry loaded in
axial compression. Designing, engineering and constructing with masonry products,
Gulf Publishing Company, Houston, Texas, USA.
C.L. Khoo and A.W. Hendry, 'A failure criterion for brickwork in Axial Compression'
Proceeding of the Third International Brick Masonry Conference (Essen) 1973, eds
L.Foertig and K. Gobel, pp. 139-45
C.L. Khoo and A.W. Hendry, 'Strength Tests on brick and mortar under complex Stresses for
the Development of a Failure Criterion for Brickwork in Compression', Proc. Br.
Ceram. Soc, 21 (1973) 57-66
Lourenço, P. B., Fernandes, F. M., & Castro, F. (2010). Handmade Clay Bricks: Chemical,
Physical and Mechanical Properties. International Journal of Architectural Heritage,
4(1), 38–58. doi:10.1080/15583050902871092
Ohler A, ‘Zur Berechnung der Druckfestigeit von Mauerwerk unter Berucksichting der
mehrachsigen Spannungszustande in Stein und Mortel’, Bautechnk, 5 (1986)
Page A W - 1978 - Finite element model for masonry. Journal of the structural division.
Page A W - 1981 - The biaxial compressive strength of masonry. Proc. Inst. Civil Engrs,;
71(2):893-906.

Numerical Modelling of Experimental Tests on Cylindrical Masonry Specimens
Erasmus Mundus Programme
ADVANCED MASTERS IN STRUCTURAL ANALYSIS OF MONUMENTS AND HISTORICAL CONSTRUCTIONS 103
Pelà L, Benedetti A., Marastoni D. (2012). Interpretation of experimental tests on small
specimens of historical mortars. 8th International Conference on Structural Analysis of
Historical Constructions. Wroclaw, Poland.
Pelà, L., Cervera, M., & Roca, P. (n.d.). Author ’ s personal copy An orthotropic damage
model for the analysis of masonry structures.
Peverini, A. (2014). Experimental evaluation of the compressive behaviour of existing
masonry. Dissertation. Polytechnico Di Torino.
R. H. Atkinson, J. L Noland and D. P. Abrams, ‘A Deformation Theory for Stack Bonded
Masonry Prisms in Compression’, Proceedings of the Seventh International Brick Masonry
Conference (Melbourne) 1982, pp 565-76
Samarasinghe W., Hendry A.W. (1980). The strength of brickwork under biaxial tensile and
compressive strength. Proc. of the 7th Symposium on load bearing brickwork, London
Samarasinghe W., Page A. W., Hendry A. W. (1982). A finite element model for the in plane
behavior of brickwork. Proc. Inst. Civ. Eng., 71 (2): 171-178.
Sassoni, E., & Mazzotti, C. (2013). The use of small diameter cores for assessing the
compressive strength of clay brick masonries. Journal of Cultural Heritage, 14(3), e95–
e101. doi:10.1016/j.culher.2012.11.027
UIC 1995: UIC – International Union of Railways: UIC code 778-3R. Recommendations for
the assessment of the load carrying capacity of the existing mas. and mass-concrete arch
bridges. UIC, Paris.
Usan Caño C. (2014). Caracterización mecánica experimental de ladrillos macizos.
Dissertation. Polytechnic University of Catalonia. Barcelona