Embed Size (px)
Citation preview
ANNUAL REPORT 2015年報 2015
AN
NU
AL R
EP
OR
T 2015S
HE
LL ELE
CTR
IC H
OLD
ING
S LIM
ITED蜆壳電器控股有限公司
二零一五年報
Annual Report 2015
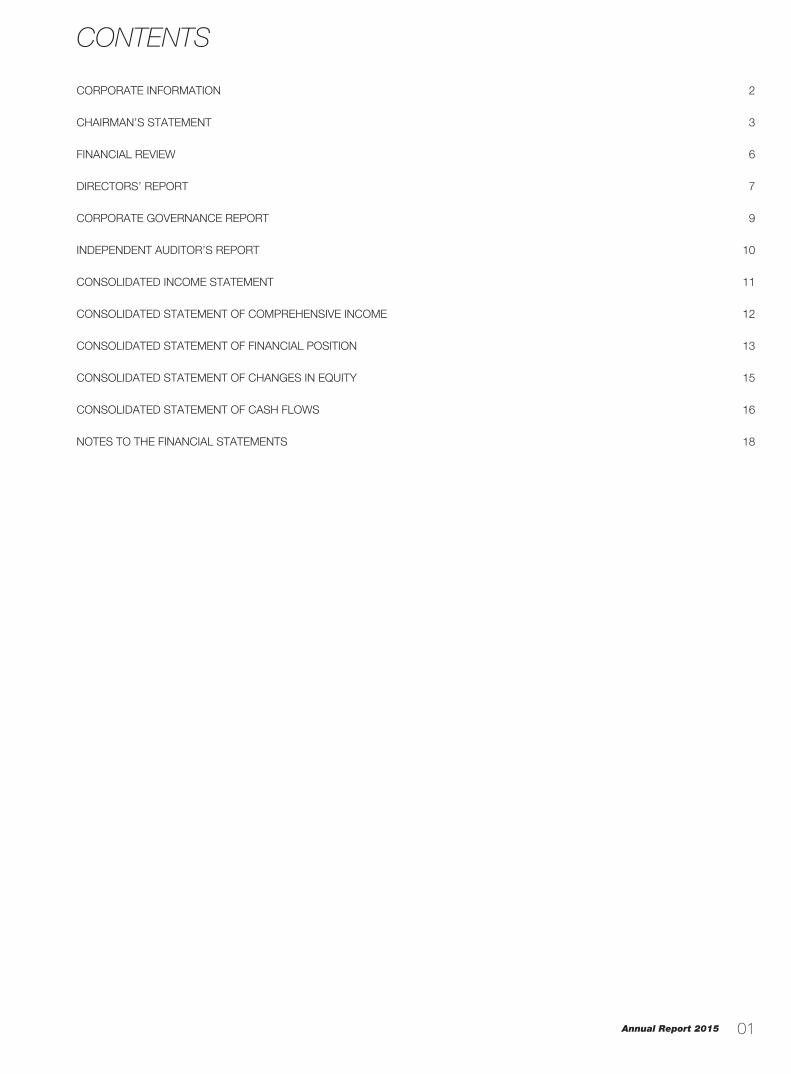
CONTENTS
01
CORPORATE INFORMATION 2
CHAIRMAN’S STATEMENT 3
FINANCIAL REVIEW 6
DIRECTORS’ REPORT 7
CORPORATE GOVERNANCE REPORT 9
INDEPENDENT AUDITOR’S REPORT 10
CONSOLIDATED INCOME STATEMENT 11
CONSOLIDATED STATEMENT OF COMPREHENSIVE INCOME 12
CONSOLIDATED STATEMENT OF FINANCIAL POSITION 13
CONSOLIDATED STATEMENT OF CHANGES IN EQUITY 15
CONSOLIDATED STATEMENT OF CASH FLOWS 16
NOTES TO THE FINANCIAL STATEMENTS 18

Shell Electric Holdings Limited
CORPORATE INFORMATION
02
DIRECTORSMr. YUNG Kwok Kee, Billy (Group Chairman and Chief Executive)Madam HSU VivianMr. CHOW Kai Chiu, DavidMadam LI Pik Mui, Cindy
BANKERSThe Hong Kong and Shanghai Banking Corporation LimitedHang Seng Bank LimitedChina Construction Bank (Asia) Corporation Limited
COMPANY SECRETARYMr. HUEN Po Wah
REGISTERED OFFICEClarendon House, 2 Church Street, Hamilton, HM 11, Bermuda
HONG KONG OFFICEShell Industrial Building, 12 Lee Chung Street, Chai Wan, Hong Kong
AUDITORBDO LimitedCertified Public Accountants
TRANSFER AGENTTricor Standard Limited, Level 22, Hopewell Centre, 183 Queen’s Road East, Hong Kong

Annual Report 2015
CHAIRMAN’S STATEMENT
03
PROFIT FOR THE YEARThe Group’s audited consolidated profit attributable to the owners of the Company for the year ended 31st December, 2015 amounted to HK$8,195,000. Basic profit per share was HK1.56 cent.
FINAL DIVIDENDThe board of directors recommends a final dividend of HK0.5 cent per share for the year ended 31st December, 2015 (2014: HK0.5 cent per share). The proposed final dividend, subject to approval by the members of the Company (the “Members”) at the annual general meeting to be held on Monday, 8th August, 2016 (the “AGM”), will be payable on or before Thursday, 20th October, 2016 to the Members on the register of members of the Company on Wednesday, 17th August, 2016.
CLOSURE OF REGISTER OF MEMBERSThe register of members of the Company will be closed from Thursday, 4th August, 2016 to Monday, 8th August, 2016, both days inclusive, during which period no transfer of shares will be effected for the purpose of ascertaining the Members’ entitlement to attend and vote at the AGM. In order to be eligible to attend and vote at the AGM, all share transfers, accompanied by the relevant share certificates, must be lodged with the Company’s Hong Kong Transfer Agent, Tricor Standard Limited, Level 22, Hopewell Centre, 183 Queen’s Road East, Hong Kong not later than 4:30 p.m. on Wednesday, 3rd August, 2016.
The register of members of the Company will be closed from Monday, 15th August, 2016 to Wednesday, 17th August, 2016, both days inclusive, during which period no transfer of shares will be effected for the purpose of ascertaining the Members’ entitlement to the proposed final dividend. In order to qualify for the proposed final dividend, all share transfers, accompanied by the relevant share certificates, must be lodged with the Company’s Hong Kong Transfer Agent, Tricor Standard Limited, Level 22, Hopewell Centre, 183 Queen’s Road East, Hong Kong not later than 4:30 p.m. on Friday, 12th August, 2016.
BUSINESS REVIEWContract Manufacturing — Electric and ElectronicsODM business for electric and electronics products reports more than 25% growth in turnover and it is expected to maintain the growth in 2016 as the new products will be launched.
Contract Manufacturing — Optics and ImagingOptics and Imaging Contract Manufacturing business edged down slightly in 2015 compared to 2014. The sales will improve in 2016 as the old model will be replaced by new models.
Electric FansThe Group’s overall electric fans business in 2015 declined year on year with a double-digit shrinkage in the ceiling fan business and a mediocre performance in the table fan and stand fan business. The plunge of oil price resulted in downturn in the Middle East market and the West African market. Global economic recession is continuing to depress the overall business in other markets although the European and Australian market showed a mild growth.
We do not expect a turnaround in the first half year of 2016 amid the falling international oil prices and declining purchasing power. We expect that there will be an improvement in the business following a world economy recovery in the second half of 2016.
Taxi OperationGuangzhou SMC Car Rental Company Limited currently owns 792 permanent Guangzhou taxi operating licenses and holds 35 taxi operating licenses with a 5-year operating term allocated from the Guangzhou Government, making a total of 827 taxi licenses. To diversify its business, the Company acquired Guangzhou Parklane Limousine Service Limited in the chauffeured limousine rental business. The Taxi business has started to improve after the Guangzhou Municipal Government started to impose tighter restraints on internet car-hailing services such as Uber and Didi Kuaidi.
Shell Electric Holdings Limited 04
CHAIRMAN’S STATEMENT
Real Estate Investment and DevelopmentPRC
Investment PropertiesAs at 31 December 2015, the Group’s portfolio of investment properties at Citic Plaza, Tianhe, Guangzhou maintain steady rental growth with an average occupancy of approximately 97%. Despite the challenging operating environment of office market at Guangzhou, we continue to expect a decent rental upward revision for various tenants upon expiration of their current leases.
Development PropertyIn June 2015, the Group acquired a 2,703 sqm residential site at Guangzhou Road South, Haizhu, Guangzhou via a court auction. Buildable GFA of the site is approximately 16,000 sqm. The Group is planning to develop the site into a residential tower targeting the increasingly affluent homeowners in the locality, while also adding a retail element on the ground level at this dynamic neighborhood in the Haizhu District.
United States
During 2015, occupancy of the Vineyard office complex in Livermore, California remained tepid. By signing an anchor tenant, the Group remains hopeful that the high cost of running a business in west and south Bay Area would lead to growth in the Tri-valley area, which will benefit Vineyard directly.
Hong Kong
The Group continued to conduct property renovation and optimization gradually for its headquarters at Shell Industrial Building at 12 Lee Chung Street, Chai Wan, Hong Kong to attract high quality tenants and generate a steady and improved stream of rental income.
The land use for the ground floor (9,400 sq. ft. approximately) of “Tak King Industrial Building” at 27 Lee Chung Street, Chai Wan, Hong Kong will be changed from industrial use to commercial use after completion of the on-going minor works. This will greatly increase the property value with much higher rental income in the near future.
The Group has completed disposal of certain land development projects in Yuen Long in 2015.
Development PropertyThe Group’s low-rise residential villa development at Shek Kong, Yuen Long received Foundation Plan and General Building Plan approvals on 2 February 2016 and 17 December 2015 respectively. Subsequent building works tendering and commencement application are well underway. The Group plan to further upgrade the quality of this project to furnish a stylish residence to meet the demand from local or out-bounded buyers who are looking for more than just an ordinary apartment.
The Group’s development plan of a low-density villa project located at Kam Tsin Road, Sheung Shui, New Territories will have a steady progress.
Technology InvestmentSemiconductor Device Products
The revenue of PFC Device grew 11.6% in 2015 while maintaining stable gross margin. The company continues to expand its market share in core segments in mobile, tablet, and laptop, with major growth coming from China’s Tier-1 mobile phone charger.
The company received ISO/TS16949 qualification in 2015, which is a pre-requisite for developing and manufacturing automotive-grade products. The company will focus to further expand into the automotive market in the future.
In 2015, the company launches a series of Synchronous Rectifiers and Super Junction MOSFET products to complement the current product line. These MOSFET products will be a significant growth factor for the company in 2016 and beyond. We expect a strong revenue growth of about 50% in 2016.

Annual Report 2015 05
CHAIRMAN’S STATEMENT
Enterprise Software Solutions
Appeon continues to operate a stable business of providing application deployment solutions for the SAP PowerBuilder development platform. A major new version of its Web deployment software (APB) was released. This new version added support for non-Microsoft Web browsers, which was a much-needed feature to keep the product relevant in the market. While revenue and profits were healthy in 2015, we expect strong growth when we complete our new licencing agreement with SAP within the next few months.
NIMBOXXNIMBOXX was unable to execute its vision and deliver on the promised, technological breakthroughs. The company is in the process of an orderly wind down.
Certa ScaleCertaScale is a start-up company in product development stage with new venture investments made in second half of 2015.
Financial InvestmentFor the year ended 31st December, 2015, the Group’s financial investment activities recorded profit of approximately HK$6,131,000 and the market value of the Group’s financial investment holdings amounted to about HK$370,716,000.
Shell Electric Holdings Limited
FINANCIAL REVIEW
06
REVENUE AND OPERATING RESULTSRevenue from the Group’s continuing operations for the year ended 31st December, 2015 stood at HK$1,147 million, down HK$121 million or 9.5% year on year, resulting mainly from shrinkage of the manufacturing businesses.
Profit attributable to the owners of the company for the year ended 31st December, 2015 went down from HK$146 million to HK$8 million representing a fall of HK$138 million or 94.5% over the corresponding period last year. The decline in profit was mainly attributable to (i) decrease in fair value gain (net of deferred taxation) of HK$195 million on trading of securities and derivative financial instruments within the Group, offset in part by (ii) increase in fair value gain (net of deferred taxation) of HK$55 million on certain investment properties within the Group.
FINANCIAL RESOURCES AND LIQUIDITY The Group was able to maintain a satisfactory financial position with its financial resources and liquidity position consistently monitored and put in place in a healthy state throughout the period under review. Given the current economic situation, the Group would constantly re-evaluate its operational and investment status with a view to improving its cash flow and minimising its financial risks.
The U.S. long term loan of US$9.7 million was secured by certain assets of the group located in the United States. In addition, the Group utilized certain long-term loans totalling HK$701 million. Apart from the above, all banking facilities of the Group were arranged on short-term basis.
The banking facilities of the Group were subject to a mix of fixed interest rates and floating interest rates. Interest cover of the Group as at 31st December, 2015, calculated as operating profit divided by total interest expenses net of interest income, stood at 3 times (31st December, 2014: 15 times).
FOREIGN EXCHANGE EXPOSURE The Group’s borrowings were mainly denominated in Hong Kong dollars and US dollars. The Group continued to conduct its sales mainly in US dollars and make payments either in US dollars or Hong Kong dollars. As the Group has staged an accumulation of investments in certain property leasing and land and property development projects in China in the past few years and with the looming volatility exposure of the Renminbi against the US dollars and Hong Kong dollars, the Group renews its primary focus on the hedging of the Renminbi against the US dollars and Hong Kong dollars and will adopt appropriate measures to mitigate foreign exchange risk.
GEARING RATIO The Group continued to adopt and follow its policy of maintaining a prudent gearing ratio. As at 31st December, 2015, the Group recorded a 20.7% gearing ratio (31st December, 2014: 20.7%), expressed as a percentage of total bank borrowings net of cash and pledged cash deposits to total equity of the Group.
CAPITAL COMMITMENTS AND GUARANTEEDuring the period under review, the Group had capital commitments totaling HK$192 million. In addition, the Company issued guarantees to the banks amounting to HK$627 million to facilitate certain subsidiaries in obtaining banking facilities.
CAPITAL EXPENDITURE AND CHARGES ON ASSETSThe Group had capital expenditures totalling HK$179 million during the period under review.
During the period under review, the Group had charges on assets totalling HK$1,847 million mainly for securing mortgage loans.
The Group also pledged its 100% interest of the issued share capital of its subsidiary, China Dynasty Development Ltd. to a bank to secure a long-term loan granted to the Group.
EMPLOYEESAs at 31st December, 2015, the Group has approximately 2,050 employees. The pay levels of these employees are commensurate with their responsibilities, performance and market condition.
Annual Report 2015
DIRECTORS’ REPORT
07
The directors present their annual report and the audited financial statements for the year ended 31st December, 2015.
PRINCIPAL ACTIVITIESDuring the current year, the principal activities of the Company are investment holding and property leasing. The principal activities carried out by the Company and its subsidiaries (collectively, the “Group”) mainly comprise investment holding, manufacturing and marketing of electric fans, as well as contract manufacturing of fusers, laser scanners, paper handling options and other electrical appliances and electronic components, property leasing, property investment and development, taxi rental and securities trading. Details of the activities of its principal subsidiaries, associates and joint ventures are set out in note 55 to note 57 to the financial statements. There were no significant changes in the nature of the Group’s principal activities during the year.
An analysis of the Group’s performance for the year by business and geographical segments is set out in note 6 to the financial statements.
RESULTS AND APPROPRIATIONSThe results of the Group for the year ended 31st December, 2015 are set out in the consolidated income statement on page 11.
Subject to the approval of shareholders at the forthcoming annual general meeting, the board of directors of the Company (the “Board”) now recommends the payment of a final dividend of HK0.5 cent per share to the shareholders on the register of members on Wednesday, 17th August, 2016, thus giving rise to a final dividend distribution amounting to HK$2,617,000.
SHARE CAPITALDetails of movements during the year in the share capital of the Company are set out in note 39 to the financial statements.
RESERVEDetails of the movements in the reserves of the Group and the Company during the year are set out in consolidated statement of changes in equity on page 15 and note 40 to the financial statements respectively.
DIVIDEND RESERVEDividend reserve of the Company at 31st December, 2015, calculated under the Companies Act 1981 of Bermuda (as amended) amounted to HK$2,617,000 (2014 : HK$2,617,000).
DONATIONSDuring the year, the Group made charitable and other donations totalling HK$1,322,000 (2014: HK$3,939,000).
PROPERTY, PLANT AND EQUIPMENTDetails of the movements in the property, plant and equipment of the Group are set out in note 15 to the financial statements.
PURCHASE, SALE OR REDEMPTION OF SECURITIES OF THE COMPANYThe Company has not purchased, sale or redeemed any of its shares during the year.
PRE-EMPTIVE RIGHTSThere are no provisions for pre-emptive rights under the Bye-laws of the Company or the laws of Bermuda, being the jurisdiction in which the Company is incorporated, which would oblige the Company to offer new shares on a pro-rata basis to existing shareholders.

Shell Electric Holdings Limited 08
DIRECTORS’ REPORT
DIRECTORSThe directors of the Company during the year and up to date of this report are as follows:
Mr. Yung Kwok Kee, Billy Madam Yung Ho Wun Ching (ceased on 8th June, 2016)Madam Hsu VivianMr. Chow Kai Chiu, DavidMadam Li Pik Mui, Cindy (appointed on 27th June, 2016)
In accordance with Bye-law 84 of the Bye-laws of the Company, Mr. Chow Kai Chiu, David shall retire by rotation at the forthcoming annual general meeting and, being eligible, offer himself for re-election.
In accordance with Bye-law 83 of the Bye-laws of the Company, Madam Li Pik Mui, Cindy shall hold office only until the forthcoming annual general meeting and, being eligible, offer herself for re-election.
DIRECTORS’ SERVICE CONTRACTSNone of the directors who are proposed for re-election at the forthcoming annual general meeting has a service contract with the Company which is not determinable within one year without payment of compensation, other than statutory compensation.
ARRANGEMENT TO PURCHASE SHARES OR DEBENTURESAt no time during the year was the Company or any of its subsidiaries a party to any arrangements to enable the directors of the Company to acquire benefits by means of the acquisition of shares in, or debentures of, the Company or any other body corporate.
MAJOR SUPPLIERS AND CUSTOMERSFor the financial year ended 31st December, 2015, the five largest customers accounted for approximately 60% of the total sales of the Group’s turnover, of which 22% was attributable to the largest customer. Purchases from the Group’s five largest suppliers accounted for less than 27% of the total purchases for the year.
None of the directors, their associates or any shareholder (which to the knowledge of the directors owns more than 5% of the Company’s issued share capital) has an interest in the major suppliers or customers noted above.
DIRECTORS’ INTERESTS IN COMPETING BUSINESSNone of the Directors and their respective associates has any interest in a business or is interested in any business which competes or may compete either directly or indirectly with, or is similar to, the business of the Group as at 31st December, 2015.
AUDITORThe financial statements for the year ended 31st December, 2015 were audited by BDO Limited (“BDO”). A resolution will be submitted to the forthcoming annual general meeting to re-appoint BDO as auditor of the Company.
On behalf of the Board
Mr. Yung Kwok Kee, Billy Chairman
Hong Kong, 27th June, 2016

Annual Report 2015
CORPORATE GOVERNANCE REPORT
09
The Company is firmly committed to maintaining a high standard corporate governance practices and adhering to the principles of corporate governance emphasizing transparency, independence, accountability, responsibility and fairness.
The board of directors of the Company (the “Board”) will continuously review and improve the corporate governance practices and standards of the Company to ensure that business and decision making processes are regulated in a proper and prudent manner.
BOARD OF DIRECTORSThe Board comprises of four members and supervises the management of the business and affairs of the Group. It has established self-regulatory and monitoring mechanisms to ensure that effective corporate governance is practiced. There is a clear division of responsibilities between the Board and the management. The Board is responsible for overseeing the Group’s overall strategic plans, approval of major funding and investment proposals and reviewing the financial performance of the Group. The day-to-day management, administration and operation of the Group are delegated to the Committee of the Directors comprising of two members, namely Mr. Yung Kwok Kee, Billy and Mr. Chow Kai Chiu, David.
The Board meets regularly and additional meetings are convened when deemed necessary by the Board. Board members are provided with complete, adequate and timely information to allow the Directors to fulfill their duties properly.
CHAIRMAN AND CHIEF EXECUTIVE OFFICERMr. Yung Kwok Kee, Billy is the Group Chairman and the Chief Executive Officer. The Board considers that the structure is more conducive to the efficient formulation and implementation of the Company’s strategies.
NOMINATION OF DIRECTORSThe Board has established a formal and transparent process for the Company in the appointment of new Directors and re-nomination and re-election of Directors at regular intervals.
In accordance with the provisions of the Bye-laws of the Company, any Director appointed by the Board during the year to fill casual vacancy shall retire and submit themselves for re-election immediately following his/her appointment at the first general meeting or at the next following annual general meeting of the Company in the case of an addition to the existing Board. Further, at each annual general meeting, one-third of the directors for the time being shall retire from office by rotation provided that every Director shall be subject to retirement at least once every three years.
As such, the Company considers that sufficient measures have been taken to ensure that the formal and transparent process for the nomination and appointment of Directors is maintained.
REMUNERATION OF DIRECTORS AND SENIOR MANAGEMENTThe Board is charged with the responsibility of determining the specific remuneration packages of all Directors and senior management, including benefits-in-kind, pension rights, and compensation payments. In developing remuneration policies and making recommendation as to the remuneration of the Directors and key executives, the Board takes into account the performance of the Group as well as those individual Directors and key executives.
ACCOUNTABILITY AND AUDITThe Directors have acknowledged by executing a management representation letter with the auditor that they bear the ultimate responsibility of preparing the Group’s financial statements in accordance with statutory requirements and applicable accounting standards. The statement of the auditor of the Company about their reporting responsibilities on the financial statements of the Group is set out in the Independent Auditor’s Report on page 10.
The Board has reviewed with management and auditor of the Company the accounting principles and practices adopted by the Group and discussed the audited financial statements for the year ended 31st December, 2015.
The Board has recommended that BDO Limited, Certified Public Accountants, be nominated for re-appointment as auditor of the Company at the forthcoming annual general meeting of the Company.
INTERNAL CONTROLSManagement has implemented a system of internal controls to provide reasonable assurance that the Group’s assets are safeguarded, proper accounting records maintained, appropriate legislation and regulations complied with, reliable financial information provided for management and publication purposes and investment and business risks affecting the Group identified and properly managed. The Company’s internal audit department is responsible for monitoring adherence to policies on the safekeeping of assets and effectiveness and efficiency of operational procedures. Periodical audit plan is prepared in determining the audit focus and frequencies.
The Board has conducted a review of the effectiveness of the system of internal control. Such review will consider the adequacy of resources, qualifications and experience of staff of the Group’s accounting and financial reporting function, and their training programmes and budget. The Board considers that the Group’s internal control system is satisfactory.
Shell Electric Holdings Limited
INDEPENDENT AUDITOR’S REPORT
10
TO THE SHAREHOLDERS OF SHELL ELECTRIC HOLDINGS LIMITED蜆壳電器控股有限公司(incorporated in Bermuda with limited liability)
We have audited the consolidated financial statements of Shell Electric Holdings Limited (the “Company”) and its subsidiaries (hereinafter referred to as the “Group”) set out on pages 11 to 84, which comprise the consolidated statement of financial position as at 31st December, 2015, and the consolidated income statement, the consolidated statement of comprehensive income, the consolidated statement of changes in equity and the consolidated statement of cash flows for the year then ended, and a summary of significant accounting policies and other explanatory information.
DIRECTORS’ RESPONSIBILITY FOR THE CONSOLIDATED FINANCIAL STATEMENTSThe directors of the Company are responsible for the preparation of consolidated financial statements that give a true and fair view in accordance with Hong Kong Financial Reporting Standards issued by the Hong Kong Institute of Certified Public Accountants, and for such internal control as the directors determine is necessary to enable the preparation of consolidated financial statements that are free from material misstatement, whether due to fraud or error.
AUDITOR’S RESPONSIBILITYOur responsibility is to express an opinion on these consolidated financial statements based on our audit. This report is made solely to you, as a body, in accordance with Section 90 of the Companies Act, and for no other purpose. We do not assume responsibility towards or accept liability to any other person for the contents of this report.
We conducted our audit in accordance with Hong Kong Standards on Auditing issued by the Hong Kong Institute of Certified Public Accountants. Those standards require that we comply with ethical requirements and plan and perform the audit to obtain reasonable assurance about whether the consolidated financial statements are free from material misstatement.
An audit involves performing procedures to obtain audit evidence about the amounts and disclosures in the consolidated financial statements. The procedures selected depend on the auditor’s judgment, including the assessment of the risks of material misstatement of the consolidated financial statements, whether due to fraud or error. In making those risk assessments, the auditor considers internal control relevant to the entity’s preparation of consolidated financial statements that give a true and fair view in order to design audit procedures that are appropriate in the circumstances, but not for the purpose of expressing an opinion on the effectiveness of the entity’s internal control. An audit also includes evaluating the appropriateness of accounting policies used and the reasonableness of accounting estimates made by the directors, as well as evaluating the overall presentation of the consolidated financial statements.
We believe that the audit evidence we have obtained is sufficient and appropriate to provide a basis for our audit opinion.
OPINIONIn our opinion, the consolidated financial statements give a true and fair view of the financial position of the Group as at 31st December, 2015 and of its financial performance and cash flows for the year then ended in accordance with Hong Kong Financial Reporting Standards.
BDO LimitedCertified Public AccountantsLee Ming WaiPractising Certificate no. P05682
Hong Kong, 27th June, 2016
BDO Limited
香港立信德豪會計師事務所有限公司
BDO Limited, a Hong Kong limited company, is a member of BDO International Limited, a UK company limited by guarantee,
and forms part of the international BDO network of independent member firms.
Annual Report 2015
For the year ended 31st December, 2015
CONSOLIDATED INCOME STATEMENT
11
2015 2014NOTES HK$’000 HK$’000
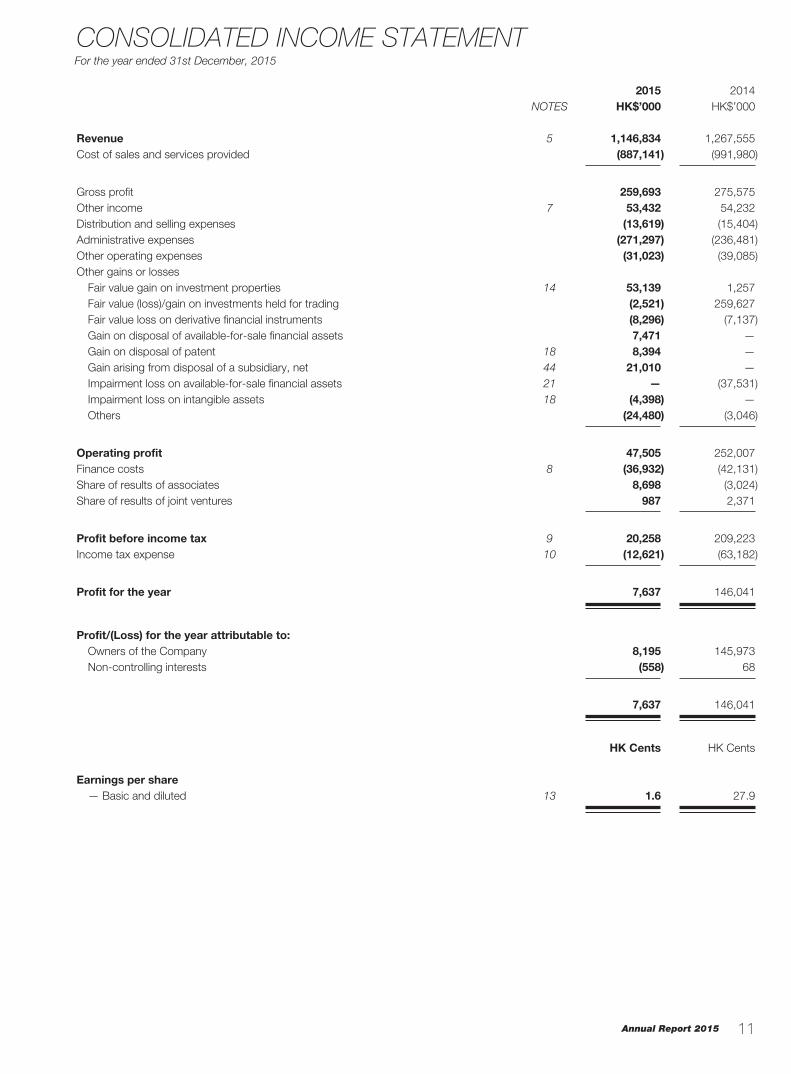
Revenue 5 1,146,834 1,267,555 Cost of sales and services provided (887,141) (991,980)
Gross profit 259,693 275,575Other income 7 53,432 54,232Distribution and selling expenses (13,619) (15,404)Administrative expenses (271,297) (236,481)Other operating expenses (31,023) (39,085)Other gains or losses Fair value gain on investment properties 14 53,139 1,257 Fair value (loss)/gain on investments held for trading (2,521) 259,627 Fair value loss on derivative financial instruments (8,296) (7,137) Gain on disposal of available-for-sale financial assets 7,471 — Gain on disposal of patent 18 8,394 — Gain arising from disposal of a subsidiary, net 44 21,010 — Impairment loss on available-for-sale financial assets 21 — (37,531) Impairment loss on intangible assets 18 (4,398) — Others (24,480) (3,046)
Operating profit 47,505 252,007Finance costs 8 (36,932) (42,131)Share of results of associates 8,698 (3,024)Share of results of joint ventures 987 2,371
Profit before income tax 9 20,258 209,223Income tax expense 10 (12,621) (63,182)
Profit for the year 7,637 146,041
Profit/(Loss) for the year attributable to: Owners of the Company 8,195 145,973 Non-controlling interests (558) 68
7,637 146,041
HK Cents HK Cents
Earnings per share — Basic and diluted 13 1.6 27.9
Shell Electric Holdings Limited
For the year ended 31st December, 2015
CONSOLIDATED STATEMENT OF COMPREHENSIVE INCOME
12
2015 2014HK$’000 HK$’000
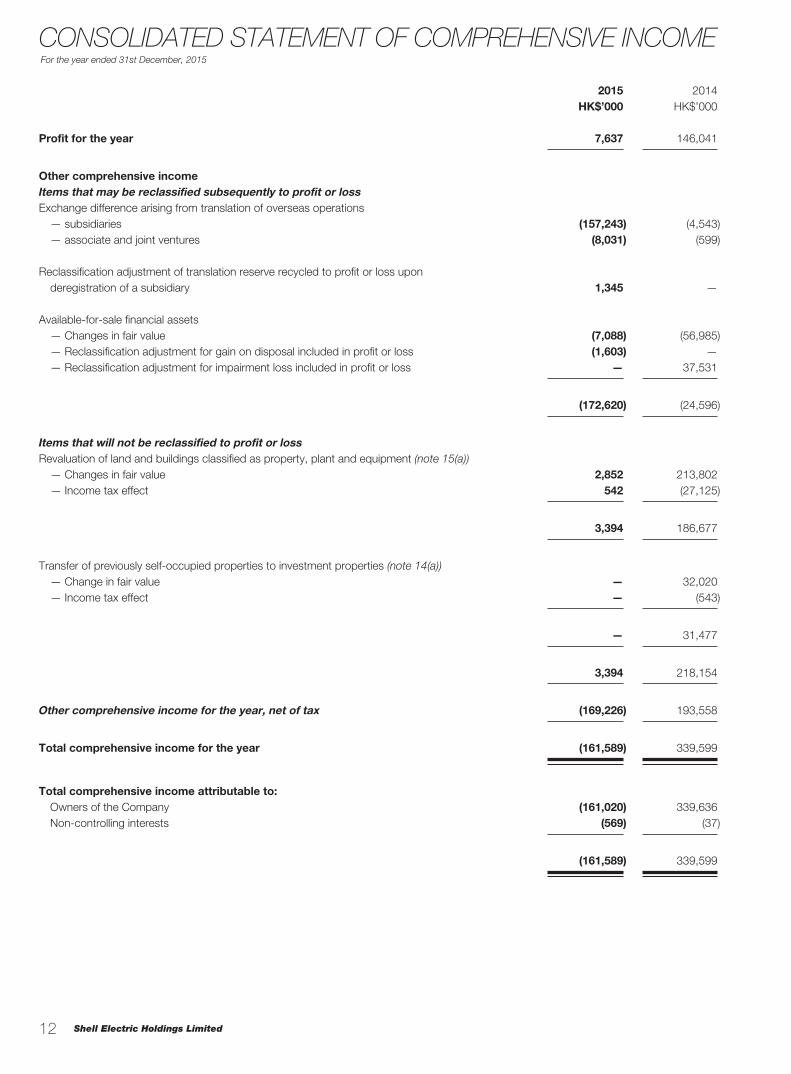
Profit for the year 7,637 146,041
Other comprehensive incomeItems that may be reclassified subsequently to profit or lossExchange difference arising from translation of overseas operations — subsidiaries (157,243) (4,543) — associate and joint ventures (8,031) (599)
Reclassification adjustment of translation reserve recycled to profit or loss upon deregistration of a subsidiary 1,345 —
Available-for-sale financial assets — Changes in fair value (7,088) (56,985) — Reclassification adjustment for gain on disposal included in profit or loss (1,603) — — Reclassification adjustment for impairment loss included in profit or loss — 37,531
(172,620) (24,596)
Items that will not be reclassified to profit or lossRevaluation of land and buildings classified as property, plant and equipment (note 15(a)) — Changes in fair value 2,852 213,802 — Income tax effect 542 (27,125)
3,394 186,677
Transfer of previously self-occupied properties to investment properties (note 14(a)) — Change in fair value — 32,020 — Income tax effect — (543)
— 31,477
3,394 218,154
Other comprehensive income for the year, net of tax (169,226) 193,558
Total comprehensive income for the year (161,589) 339,599
Total comprehensive income attributable to: Owners of the Company (161,020) 339,636 Non-controlling interests (569) (37)
(161,589) 339,599
Annual Report 2015
As at 31st December, 2015
CONSOLIDATED STATEMENT OF FINANCIAL POSITION
13
As at 31st December,
2015
As at 31st December,
2014NOTES HK$’000 HK$’000
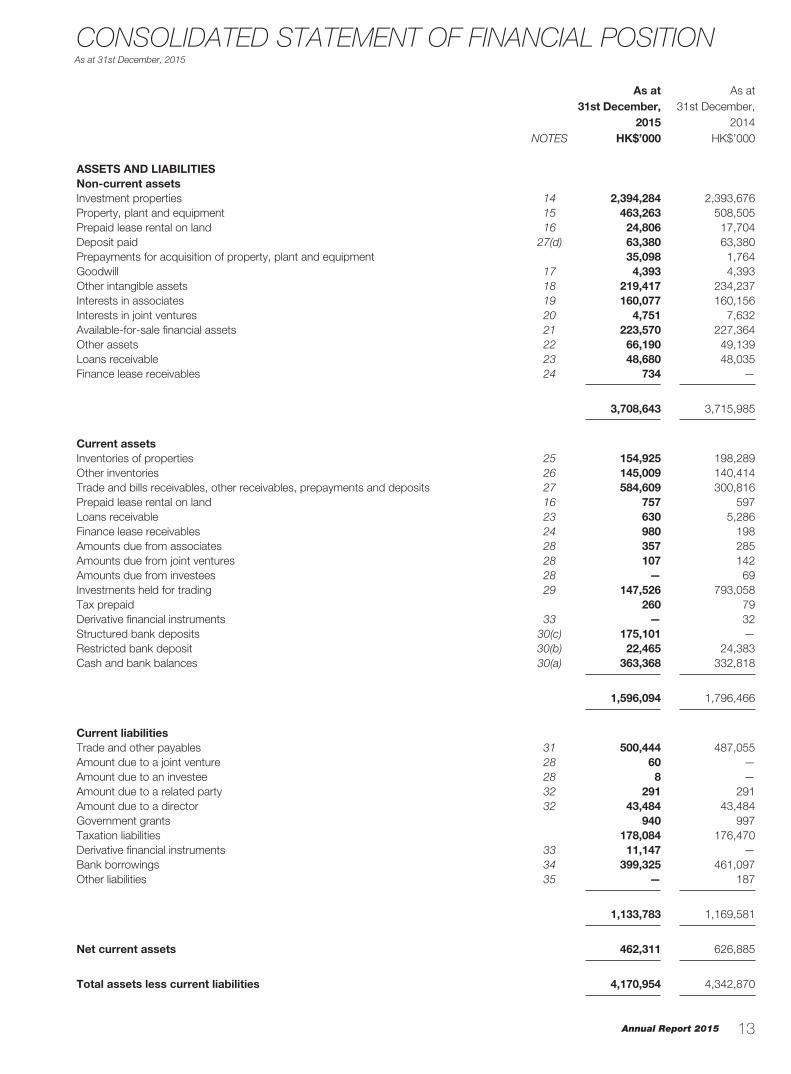
ASSETS AND LIABILITIESNon-current assetsInvestment properties 14 2,394,284 2,393,676Property, plant and equipment 15 463,263 508,505Prepaid lease rental on land 16 24,806 17,704Deposit paid 27(d) 63,380 63,380Prepayments for acquisition of property, plant and equipment 35,098 1,764Goodwill 17 4,393 4,393Other intangible assets 18 219,417 234,237Interests in associates 19 160,077 160,156Interests in joint ventures 20 4,751 7,632Available-for-sale financial assets 21 223,570 227,364Other assets 22 66,190 49,139Loans receivable 23 48,680 48,035Finance lease receivables 24 734 —
3,708,643 3,715,985
Current assetsInventories of properties 25 154,925 198,289Other inventories 26 145,009 140,414Trade and bills receivables, other receivables, prepayments and deposits 27 584,609 300,816Prepaid lease rental on land 16 757 597Loans receivable 23 630 5,286Finance lease receivables 24 980 198Amounts due from associates 28 357 285Amounts due from joint ventures 28 107 142Amounts due from investees 28 — 69Investments held for trading 29 147,526 793,058Tax prepaid 260 79Derivative financial instruments 33 — 32Structured bank deposits 30(c) 175,101 —Restricted bank deposit 30(b) 22,465 24,383Cash and bank balances 30(a) 363,368 332,818
1,596,094 1,796,466
Current liabilitiesTrade and other payables 31 500,444 487,055Amount due to a joint venture 28 60 —Amount due to an investee 28 8 —Amount due to a related party 32 291 291Amount due to a director 32 43,484 43,484Government grants 940 997Taxation liabilities 178,084 176,470Derivative financial instruments 33 11,147 —Bank borrowings 34 399,325 461,097Other liabilities 35 — 187
1,133,783 1,169,581
Net current assets 462,311 626,885
Total assets less current liabilities 4,170,954 4,342,870

Shell Electric Holdings Limited
As at 31st December, 2015
14
CONSOLIDATED STATEMENT OF FINANCIAL POSITION
As at 31st December,
2015
As at 31st December,
2014NOTES HK$’000 HK$’000
Non-current liabilitiesDerivative financial instruments 33 — 6,632Government grants 816 1,864Bank borrowings 34 622,110 566,228Loan from non-controlling shareholder 36 5,402 5,406Deferred tax liabilities 38 476,284 532,938
1,104,612 1,113,068
Net assets 3,066,342 3,229,802
CAPITAL AND RESERVESShare capital 39 82 82Reserves 40 3,057,590 3,220,514
Equity attributable to owners of the Company 3,057,672 3,220,596Non-controlling interests 37 8,670 9,206
Total equity 3,066,342 3,229,802
On behalf of the Directors
YUNG KWOK KEE, BILLY CHOW KAI CHIU, DAVIDDirector Director
Annual Report 2015
For the year ended 31st December, 2015
CONSOLIDATED STATEMENT OF CHANGES IN EQUITY
15
Equity attributable to owners of the Company
Share capital
Capital reserve
Available-for-sale
financial assets
revaluation reserve
Shareoption
reserveTranslation
reserve
Assets revaluation
reserveDividend
reserveStatutory
reserveRetained
profits Total
Non-controlling
interestsTotal
equityHK$’000 HK$’000 HK$’000 HK$’000 HK$’000 HK$’000 HK$’000 HK$’000 HK$’000 HK$’000 HK$’000 HK$’000
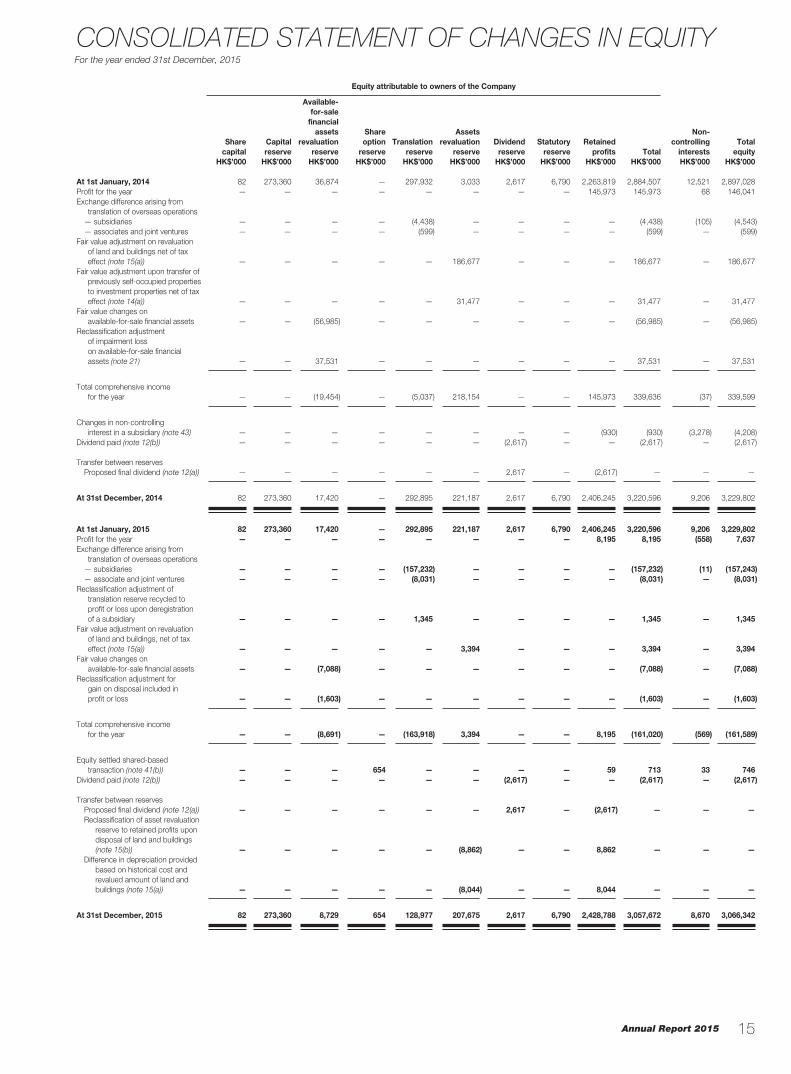
At 1st January, 2014 82 273,360 36,874 — 297,932 3,033 2,617 6,790 2,263,819 2,884,507 12,521 2,897,028Profit for the year — — — — — — — — 145,973 145,973 68 146,041Exchange difference arising from
translation of overseas operations — subsidiaries — — — — (4,438) — — — — (4,438) (105) (4,543) — associates and joint ventures — — — — (599) — — — — (599) — (599)Fair value adjustment on revaluation
of land and buildings net of tax effect (note 15(a)) — — — — — 186,677 — — — 186,677 — 186,677
Fair value adjustment upon transfer of previously self-occupied properties to investment properties net of tax effect (note 14(a)) — — — — — 31,477 — — — 31,477 — 31,477
Fair value changes on available-for-sale financial assets — — (56,985) — — — — — — (56,985) — (56,985)
Reclassification adjustment of impairment loss on available-for-sale financial assets (note 21) — — 37,531 — — — — — — 37,531 — 37,531
Total comprehensive income for the year — — (19,454) — (5,037) 218,154 — — 145,973 339,636 (37) 339,599
Changes in non-controlling interest in a subsidiary (note 43) — — — — — — — — (930) (930) (3,278) (4,208)
Dividend paid (note 12(b)) — — — — — — (2,617) — — (2,617) — (2,617)
Transfer between reserves Proposed final dividend (note 12(a)) — — — — — — 2,617 — (2,617) — — —
At 31st December, 2014 82 273,360 17,420 — 292,895 221,187 2,617 6,790 2,406,245 3,220,596 9,206 3,229,802
At 1st January, 2015 82 273,360 17,420 — 292,895 221,187 2,617 6,790 2,406,245 3,220,596 9,206 3,229,802Profit for the year — — — — — — — — 8,195 8,195 (558) 7,637Exchange difference arising from
translation of overseas operations — subsidiaries — — — — (157,232) — — — — (157,232) (11) (157,243) — associate and joint ventures — — — — (8,031) — — — — (8,031) — (8,031)Reclassification adjustment of
translation reserve recycled to profit or loss upon deregistration of a subsidiary — — — — 1,345 — — — — 1,345 — 1,345
Fair value adjustment on revaluation of land and buildings, net of tax effect (note 15(a)) — — — — — 3,394 — — — 3,394 — 3,394
Fair value changes on available-for-sale financial assets — — (7,088) — — — — — — (7,088) — (7,088)
Reclassification adjustment for gain on disposal included in profit or loss — — (1,603) — — — — — — (1,603) — (1,603)
Total comprehensive income for the year — — (8,691) — (163,918) 3,394 — — 8,195 (161,020) (569) (161,589)
Equity settled shared-based transaction (note 41(b)) — — — 654 — — — — 59 713 33 746
Dividend paid (note 12(b)) — — — — — — (2,617) — — (2,617) — (2,617)
Transfer between reserves Proposed final dividend (note 12(a)) — — — — — — 2,617 — (2,617) — — —
Reclassification of asset revaluation reserve to retained profits upon disposal of land and buildings (note 15(b)) — — — — — (8,862) — — 8,862 — — —
Difference in depreciation provided based on historical cost and revalued amount of land and buildings (note 15(a)) — — — — — (8,044) — — 8,044 — — —
At 31st December, 2015 82 273,360 8,729 654 128,977 207,675 2,617 6,790 2,428,788 3,057,672 8,670 3,066,342
Shell Electric Holdings Limited
For the year ended 31st December, 2015
CONSOLIDATED STATEMENT OF CASH FLOWS
16
2015 2014HK$’000 HK$’000
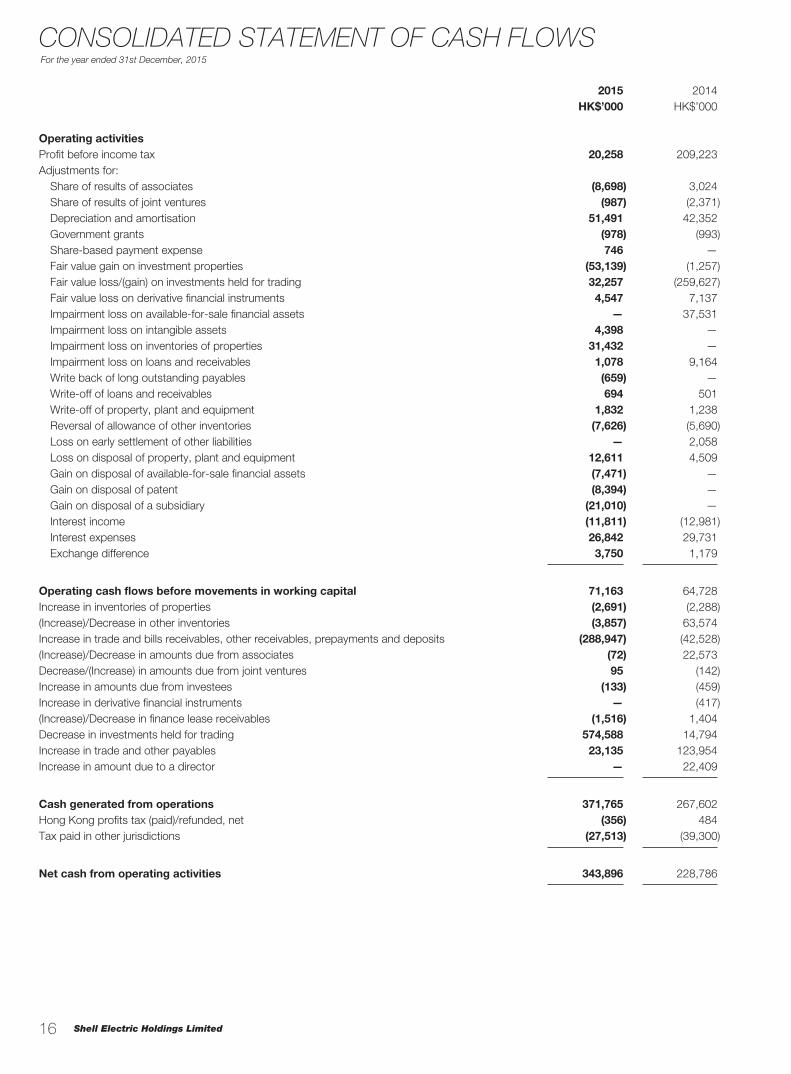
Operating activitiesProfit before income tax 20,258 209,223Adjustments for: Share of results of associates (8,698) 3,024 Share of results of joint ventures (987) (2,371) Depreciation and amortisation 51,491 42,352 Government grants (978) (993) Share-based payment expense 746 — Fair value gain on investment properties (53,139) (1,257) Fair value loss/(gain) on investments held for trading 32,257 (259,627) Fair value loss on derivative financial instruments 4,547 7,137 Impairment loss on available-for-sale financial assets — 37,531 Impairment loss on intangible assets 4,398 — Impairment loss on inventories of properties 31,432 — Impairment loss on loans and receivables 1,078 9,164 Write back of long outstanding payables (659) — Write-off of loans and receivables 694 501 Write-off of property, plant and equipment 1,832 1,238 Reversal of allowance of other inventories (7,626) (5,690) Loss on early settlement of other liabilities — 2,058 Loss on disposal of property, plant and equipment 12,611 4,509 Gain on disposal of available-for-sale financial assets (7,471) — Gain on disposal of patent (8,394) — Gain on disposal of a subsidiary (21,010) — Interest income (11,811) (12,981) Interest expenses 26,842 29,731 Exchange difference 3,750 1,179
Operating cash flows before movements in working capital 71,163 64,728Increase in inventories of properties (2,691) (2,288)(Increase)/Decrease in other inventories (3,857) 63,574Increase in trade and bills receivables, other receivables, prepayments and deposits (288,947) (42,528)(Increase)/Decrease in amounts due from associates (72) 22,573Decrease/(Increase) in amounts due from joint ventures 95 (142)Increase in amounts due from investees (133) (459)Increase in derivative financial instruments — (417)(Increase)/Decrease in finance lease receivables (1,516) 1,404Decrease in investments held for trading 574,588 14,794Increase in trade and other payables 23,135 123,954Increase in amount due to a director — 22,409
Cash generated from operations 371,765 267,602Hong Kong profits tax (paid)/refunded, net (356) 484Tax paid in other jurisdictions (27,513) (39,300)
Net cash from operating activities 343,896 228,786
Annual Report 2015
For the year ended 31st December, 2015
17
CONSOLIDATED STATEMENT OF CASH FLOWS
2015 2014HK$’000 HK$’000
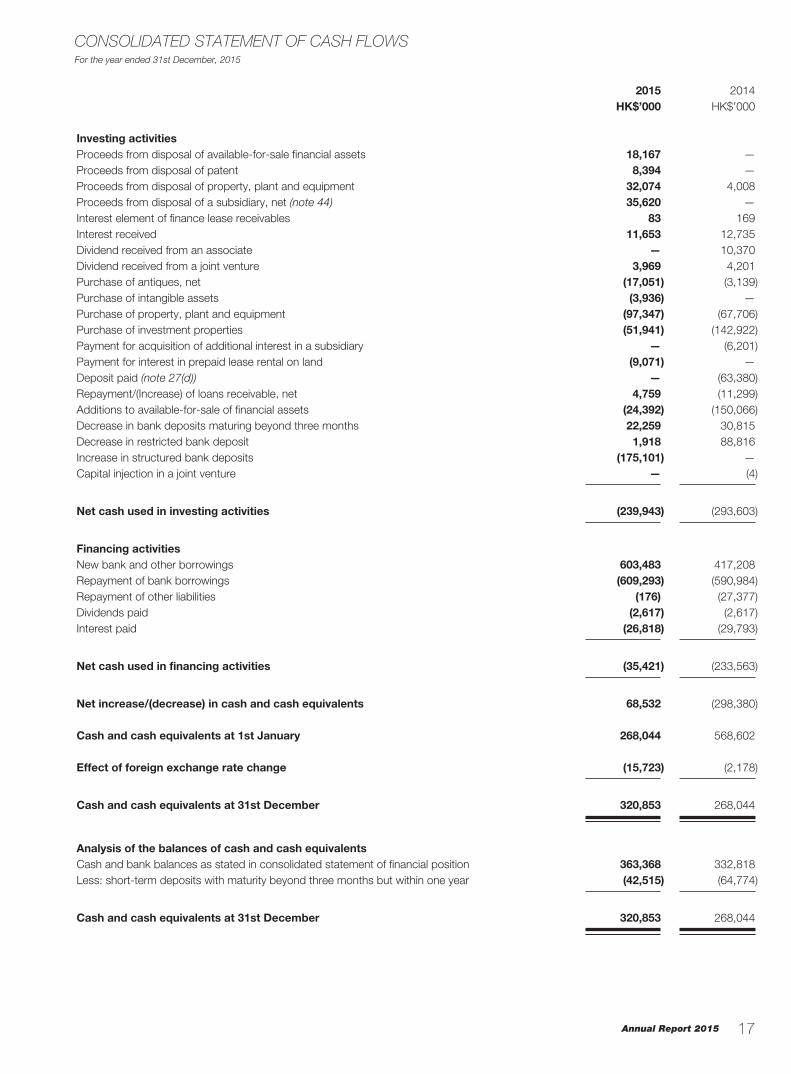
Investing activitiesProceeds from disposal of available-for-sale financial assets 18,167 —Proceeds from disposal of patent 8,394 —Proceeds from disposal of property, plant and equipment 32,074 4,008Proceeds from disposal of a subsidiary, net (note 44) 35,620 —Interest element of finance lease receivables 83 169Interest received 11,653 12,735Dividend received from an associate — 10,370Dividend received from a joint venture 3,969 4,201Purchase of antiques, net (17,051) (3,139)Purchase of intangible assets (3,936) —Purchase of property, plant and equipment (97,347) (67,706)Purchase of investment properties (51,941) (142,922)Payment for acquisition of additional interest in a subsidiary — (6,201)Payment for interest in prepaid lease rental on land (9,071) —Deposit paid (note 27(d)) — (63,380)Repayment/(Increase) of loans receivable, net 4,759 (11,299)Additions to available-for-sale of financial assets (24,392) (150,066)Decrease in bank deposits maturing beyond three months 22,259 30,815Decrease in restricted bank deposit 1,918 88,816Increase in structured bank deposits (175,101) —Capital injection in a joint venture — (4)
Net cash used in investing activities (239,943) (293,603)
Financing activitiesNew bank and other borrowings 603,483 417,208Repayment of bank borrowings (609,293) (590,984)Repayment of other liabilities (176) (27,377)Dividends paid (2,617) (2,617)Interest paid (26,818) (29,793)
Net cash used in financing activities (35,421) (233,563)
Net increase/(decrease) in cash and cash equivalents 68,532 (298,380)
Cash and cash equivalents at 1st January 268,044 568,602
Effect of foreign exchange rate change (15,723) (2,178)
Cash and cash equivalents at 31st December 320,853 268,044
Analysis of the balances of cash and cash equivalentsCash and bank balances as stated in consolidated statement of financial position 363,368 332,818Less: short-term deposits with maturity beyond three months but within one year (42,515) (64,774)
Cash and cash equivalents at 31st December 320,853 268,044
Shell Electric Holdings Limited
For the year ended 31st December, 2015
NOTES TO THE FINANCIAL STATEMENTS
18
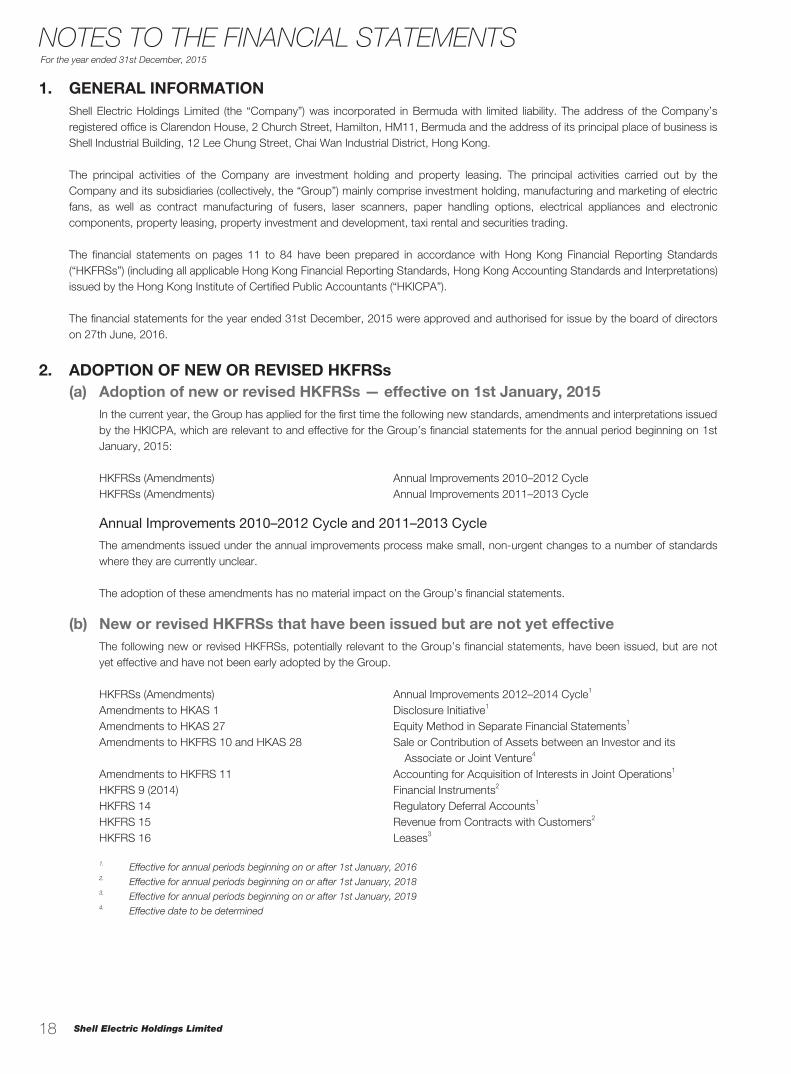
1. GENERAL INFORMATIONShell Electric Holdings Limited (the “Company”) was incorporated in Bermuda with limited liability. The address of the Company’s registered office is Clarendon House, 2 Church Street, Hamilton, HM11, Bermuda and the address of its principal place of business is Shell Industrial Building, 12 Lee Chung Street, Chai Wan Industrial District, Hong Kong.
The principal activities of the Company are investment holding and property leasing. The principal activities carried out by the Company and its subsidiaries (collectively, the “Group”) mainly comprise investment holding, manufacturing and marketing of electric fans, as well as contract manufacturing of fusers, laser scanners, paper handling options, electrical appliances and electronic components, property leasing, property investment and development, taxi rental and securities trading.
The financial statements on pages 11 to 84 have been prepared in accordance with Hong Kong Financial Reporting Standards (“HKFRSs”) (including all applicable Hong Kong Financial Reporting Standards, Hong Kong Accounting Standards and Interpretations) issued by the Hong Kong Institute of Certified Public Accountants (“HKICPA”).
The financial statements for the year ended 31st December, 2015 were approved and authorised for issue by the board of directors on 27th June, 2016.
2. ADOPTION OF NEW OR REVISED HKFRSs(a) Adoption of new or revised HKFRSs — effective on 1st January, 2015
In the current year, the Group has applied for the first time the following new standards, amendments and interpretations issued by the HKICPA, which are relevant to and effective for the Group’s financial statements for the annual period beginning on 1st January, 2015:
HKFRSs (Amendments) Annual Improvements 2010–2012 CycleHKFRSs (Amendments) Annual Improvements 2011–2013 Cycle
Annual Improvements 2010–2012 Cycle and 2011–2013 Cycle
The amendments issued under the annual improvements process make small, non-urgent changes to a number of standards where they are currently unclear.
The adoption of these amendments has no material impact on the Group’s financial statements.
(b) New or revised HKFRSs that have been issued but are not yet effectiveThe following new or revised HKFRSs, potentially relevant to the Group’s financial statements, have been issued, but are not yet effective and have not been early adopted by the Group.
HKFRSs (Amendments) Annual Improvements 2012–2014 Cycle1
Amendments to HKAS 1 Disclosure Initiative1
Amendments to HKAS 27 Equity Method in Separate Financial Statements1
Amendments to HKFRS 10 and HKAS 28 Sale or Contribution of Assets between an Investor and its Associate or Joint Venture4
Amendments to HKFRS 11 Accounting for Acquisition of Interests in Joint Operations1
HKFRS 9 (2014) Financial Instruments2
HKFRS 14 Regulatory Deferral Accounts1
HKFRS 15 Revenue from Contracts with Customers2
HKFRS 16 Leases3
1. Effective for annual periods beginning on or after 1st January, 20162. Effective for annual periods beginning on or after 1st January, 20183. Effective for annual periods beginning on or after 1st January, 20194. Effective date to be determined
Annual Report 2015
For the year ended 31st December, 2015
19
NOTES TO THE FINANCIAL STATEMENTS
2. ADOPTION OF NEW OR REVISED HKFRSs (Continued)
(b) New or revised HKFRSs that have been issued but are not yet effective (Continued)
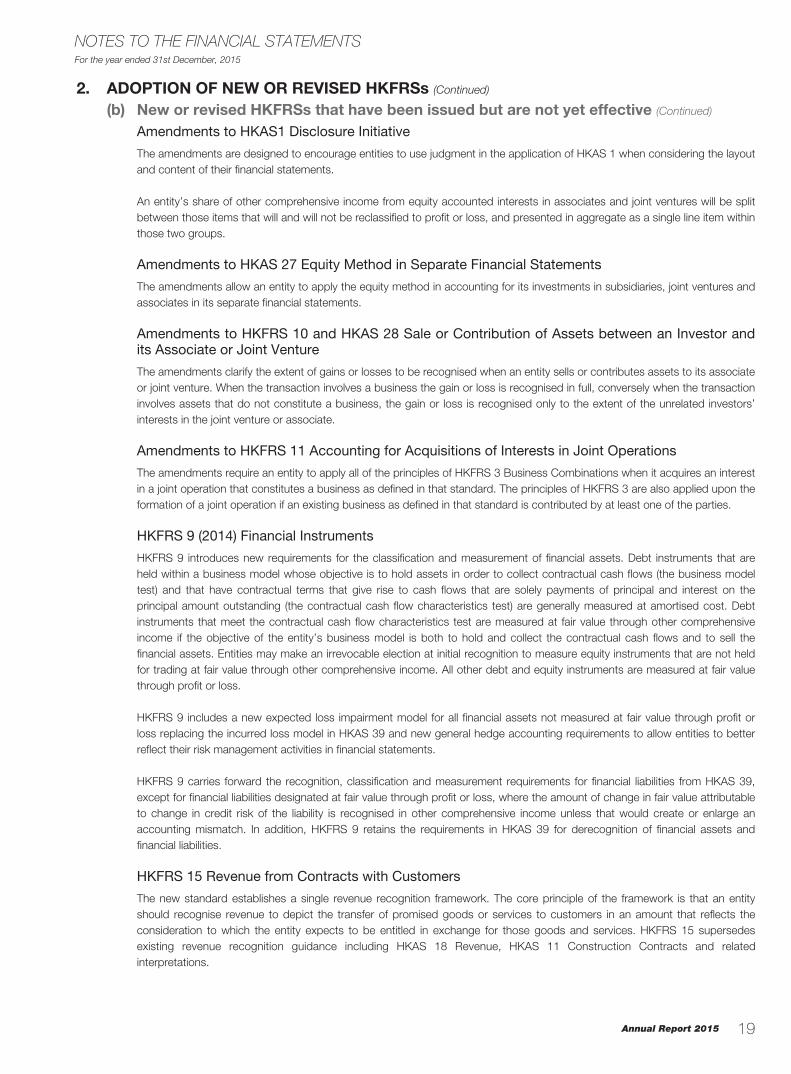
Amendments to HKAS1 Disclosure Initiative
The amendments are designed to encourage entities to use judgment in the application of HKAS 1 when considering the layout and content of their financial statements.
An entity’s share of other comprehensive income from equity accounted interests in associates and joint ventures will be split between those items that will and will not be reclassified to profit or loss, and presented in aggregate as a single line item within those two groups.
Amendments to HKAS 27 Equity Method in Separate Financial Statements
The amendments allow an entity to apply the equity method in accounting for its investments in subsidiaries, joint ventures and associates in its separate financial statements.
Amendments to HKFRS 10 and HKAS 28 Sale or Contribution of Assets between an Investor and its Associate or Joint Venture
The amendments clarify the extent of gains or losses to be recognised when an entity sells or contributes assets to its associate or joint venture. When the transaction involves a business the gain or loss is recognised in full, conversely when the transaction involves assets that do not constitute a business, the gain or loss is recognised only to the extent of the unrelated investors’ interests in the joint venture or associate.
Amendments to HKFRS 11 Accounting for Acquisitions of Interests in Joint Operations
The amendments require an entity to apply all of the principles of HKFRS 3 Business Combinations when it acquires an interest in a joint operation that constitutes a business as defined in that standard. The principles of HKFRS 3 are also applied upon the formation of a joint operation if an existing business as defined in that standard is contributed by at least one of the parties.
HKFRS 9 (2014) Financial Instruments
HKFRS 9 introduces new requirements for the classification and measurement of financial assets. Debt instruments that are held within a business model whose objective is to hold assets in order to collect contractual cash flows (the business model test) and that have contractual terms that give rise to cash flows that are solely payments of principal and interest on the principal amount outstanding (the contractual cash flow characteristics test) are generally measured at amortised cost. Debt instruments that meet the contractual cash flow characteristics test are measured at fair value through other comprehensive income if the objective of the entity’s business model is both to hold and collect the contractual cash flows and to sell the financial assets. Entities may make an irrevocable election at initial recognition to measure equity instruments that are not held for trading at fair value through other comprehensive income. All other debt and equity instruments are measured at fair value through profit or loss.
HKFRS 9 includes a new expected loss impairment model for all financial assets not measured at fair value through profit or loss replacing the incurred loss model in HKAS 39 and new general hedge accounting requirements to allow entities to better reflect their risk management activities in financial statements.
HKFRS 9 carries forward the recognition, classification and measurement requirements for financial liabilities from HKAS 39, except for financial liabilities designated at fair value through profit or loss, where the amount of change in fair value attributable to change in credit risk of the liability is recognised in other comprehensive income unless that would create or enlarge an accounting mismatch. In addition, HKFRS 9 retains the requirements in HKAS 39 for derecognition of financial assets and financial liabilities.
HKFRS 15 Revenue from Contracts with Customers
The new standard establishes a single revenue recognition framework. The core principle of the framework is that an entity should recognise revenue to depict the transfer of promised goods or services to customers in an amount that reflects the consideration to which the entity expects to be entitled in exchange for those goods and services. HKFRS 15 supersedes existing revenue recognition guidance including HKAS 18 Revenue, HKAS 11 Construction Contracts and related interpretations.
Shell Electric Holdings Limited
For the year ended 31st December, 2015
20
NOTES TO THE FINANCIAL STATEMENTS
2. ADOPTION OF NEW OR REVISED HKFRSs (Continued)
(b) New or revised HKFRSs that have been issued but are not yet effective (Continued)
HKFRS 15 Revenue from Contracts with Customers (Continued)
HKFRS 15 requires the application of a 5 steps approach to revenue recognition:
Step 1: Identify the contract(s) with a customerStep 2: Identify the performance obligations in the contractStep 3: Determine the transaction priceStep 4: Allocate the transaction price to each performance obligationStep 5: Recognise revenue when each performance obligation is satisfied
HKFRS 15 includes specific guidance on particular revenue related topics that may change the current approach taken under HKFRSs. The standard also significantly enhances the qualitative and quantitative disclosures related to revenue.
HKFRS 16 Leases
The new standard specifies how an entity to recognise, measure, present and disclose leases.
HKFRS 16 requires lessees to recognise assets and liabilities for all leases unless the lease term is 12 months or less or the underlying asset has a low value. Lessors continue to classify leases as operating or finance with HKFRS 16’s approach to lessor accounting substantially unchanged from its predecessor HKAS 17.
The Group is in the progress of making an assessment of the potential impact of these new or revised HKFRSs. Other new or revised HKFRSs that have been issued but are not yet effective are unlikely to have material impact on the Group’s financial performance and financial position upon application.
3. SUMMARY OF SIGNIFICANT ACCOUNTING POLICIESThe significant accounting policies adopted in the preparation of these financial statements are summarised below. These policies have been consistently applied to all the years presented unless otherwise stated.
3.1 Basis of preparationThese financial statements have been prepared under the historical cost basis except for investment properties, land and buildings classified as property, plant and equipment and certain financial instruments which are measured at fair value. Disposal groups and non-current assets held for sale (other than investment properties) are stated at the lower of their carrying amounts and fair values less costs to sell. The measurement bases are fully described in the accounting policies below.
Accounting estimates and assumptions have been used in preparing these financial statements. Although these estimates and assumptions are based on management’s best knowledge and judgment of current events and actions, actual results may ultimately differ from those estimates and assumptions. The areas involving a higher degree of judgment or complexity, or areas where assumptions and estimates are significant to the financial statements, are disclosed in note 4.
3.2 Basis of combination and basis of consolidationThe consolidated financial statements incorporate the financial statements of the Company and its subsidiaries (see note 3.3 below) made up to 31st December each year. Subsidiaries are consolidated from the date of acquisition, being the date on which the Group obtains control, and continue to be consolidated until the date that such control ceases. All intercompany transactions, balances and unrealised gains and losses on transactions within the Group are eliminated on consolidation. Unrealised losses resulting from intercompany transaction are also eliminated unless the transaction provides evidence of an impairment of the asset transferred, in which case they are recognised immediately in profit or loss.

Annual Report 2015
For the year ended 31st December, 2015
21
NOTES TO THE FINANCIAL STATEMENTS
3. SUMMARY OF SIGNIFICANT ACCOUNTING POLICIES (Continued)
3.2 Basis of combination and basis of consolidation (Continued)
Acquisition of subsidiaries or businesses is accounted for using the acquisition method. The cost of an acquisition is measured at the aggregate of the acquisition-date fair value of assets transferred, liabilities incurred and equity interests issued by the Group in exchange for control of the acquiree. The identifiable assets acquired and liabilities assumed are principally measured at acquisition-date fair value. If the business combination is achieved in stage, the Group’s previously held equity interest in the acquiree is re-measured at acquisition-date fair value and the resulting gains or losses are recognised in profit or loss. The Group may elect, on a transaction-by-transaction basis, to measure the non-controlling interests that represent present ownership interests in the subsidiary either at fair value or at the proportionate share of the acquiree’s identifiable net assets. All other non-controlling interests are measured at fair value unless another measurement basis is required by HKFRSs. Acquisition-related costs incurred are expensed unless they are incurred in issuing equity instruments, in which case the costs are deducted from equity.
Any contingent consideration to be transferred by the acquirer is recognised at acquisition-date fair value. Subsequent adjustments to the fair value of the contingent consideration are recognised against goodwill only to the extent that they arise from new information obtained within the measurement period (a maximum of 12 months from the acquisition date) about the fair value at the acquisition date. All other subsequent adjustments to contingent consideration classified as an asset or a liability are recognised in accordance with HKAS 39 either in profit or loss or as a charge to other comprehensive income. If the contingent consideration is classified as equity, it will not be remeasured.
Goodwill arising on business combination is measured according to the policies in note 3.5.
Changes in the Group’s interests in subsidiaries that do not result in a loss of control are accounted for as equity transactions. The carrying amounts of the Group’s interest and the non-controlling interest are adjusted to reflect the changes in their relative interests in the subsidiaries. Any difference between the amount by which the non-controlling interest is adjusted and the fair value of the consideration paid or received is recognised directly in equity and attributed to owners of the Company.
Subsequent to acquisition, the carrying amount of non-controlling interests that represent present ownership interests in the subsidiary is the amount of those interests at initial recognition plus such non-controlling interest’s share of subsequent changes in equity. Total comprehensive income is attributed to such non-controlling interests even if this results in those non-controlling interests having a deficit balance.
When the Group loses control of a subsidiary, the profit or loss on disposal is calculated as the difference between (i) the aggregate of the fair value of the consideration received and the fair value of any retained interest and (ii) the previous carrying amount of the assets (including goodwill), and liabilities of the subsidiary and any non-controlling interest, and also the cumulative translation differences recorded in equity. Amounts previously recognised in other comprehensive income in relation to the subsidiary are accounted for in the same manner as would be required if the relevant assets or liabilities were disposed of.
3.3 SubsidiariesA subsidiary is an investee over which the Company is able to exercise control. The Company controls an investee if all three of the following elements are present:
— power over the investee;
— exposure, or rights, to variable returns from the investee; and
— the ability to use its power to affect those variable returns.
Control is reassessed whenever facts and circumstances indicate that there may be a change in any of these elements of control.
In the Company’s statement of financial position, investments in subsidiaries are stated at cost less impairment loss, if any. The results of subsidiaries are accounted for by the Company on the basis of dividend received and receivable.

Shell Electric Holdings Limited
For the year ended 31st December, 2015
22
NOTES TO THE FINANCIAL STATEMENTS
3. SUMMARY OF SIGNIFICANT ACCOUNTING POLICIES (Continued)
3.4 Associates and Joint arrangementsThe Group is a party to a joint arrangement where there is a contractual arrangement that confers joint control over the relevant activities of the arrangement to the Group and at least one other party. Joint control is assessed under the same principles as control over subsidiaries.
The Group classifies its interests in joint arrangements as either:
— joint ventures: where the Group has rights to only the net assets of the joint arrangement; or
— joint operations: where the Group has both the rights to assets and obligations for the liabilities of the joint arrangement.
In assessing the classification of interests in joint arrangements, the Group considers:
— the structure of the joint arrangement;
— the legal form of joint arrangements structured through a separate vehicle;
— the contractual terms of the joint arrangement agreement; and
— any other facts and circumstances (including any other contractual arrangements).
An associate is an entity over which the Group has significant influence and that is neither a subsidiary nor a joint arrangement. Significant influence is the power to participate in the financial and operating policy decisions of the investee but not control or joint control over those policies.
Interests in associates and joint ventures are accounted for using the equity method whereby they are initially recognised at cost and thereafter, their carrying amount are adjusted for the Group’s share of the post-acquisition change in the associates’ and joint ventures’ net assets except that losses in excess of the Group’s interest in the associates and joint venture are not recognised unless there is an obligation to make good those losses.
Profits and losses arising on transactions between the Group and its associates and joint ventures are recognised only to the extent of unrelated investors’ interests in the associate and joint venture. The investor’s share in the associates and joint venture’s profits and losses resulting from these transactions is eliminated against the carrying value of the associate and joint venture. Where unrealised losses provide evidence of impairment of the asset transferred they are recognised immediately in profit or loss.
Any premium paid for investment in an associate and a joint venture above the fair value of the Group’s share of the identifiable assets, liabilities and contingent liabilities acquired is capitalised and included in the carrying amount of the investment in associate and joint venture. Where there is objective evidence that the investment in an associate and a joint venture has been impaired, the carrying amount of the investment is tested for impairment in the same way as other non-financial assets.
Joint operations are accounted for by recognising the Group’s share of assets, liabilities, revenue and expenses in accordance with its contractually conferred rights and obligations.
Annual Report 2015
For the year ended 31st December, 2015
23
NOTES TO THE FINANCIAL STATEMENTS
3. SUMMARY OF SIGNIFICANT ACCOUNTING POLICIES (Continued)
3.5 GoodwillGoodwill arising from the acquisition of subsidiaries, associates and joint ventures represents the excess of the aggregate of the consideration transferred, the amount recognised for non-controlling interests and any fair value of the Group’s previously held equity interests in the acquiree over the Group’s interest in the fair value of the identifiable assets acquired and liabilities including contingent liabilities as at the date of acquisition.
Goodwill arising on acquisition is initially recognised in the consolidated statement of financial position as an asset at cost and subsequently measured at cost less any accumulated impairment losses. In case of associates and joint ventures, goodwill is included in the carrying amount of the interests in associates and joint ventures, respectively, rather than recognised as a separate asset on the consolidated statement of financial position.
Goodwill is reviewed for impairment annually at the end of reporting period or more frequently if events or changes in circumstances indicate that the carrying value of goodwill may be impaired (note 3.13). On subsequent disposal of a subsidiary, associate or joint ventures, the carrying amount of goodwill relating to the entity sold is included in determining the amount of gain or loss on disposal.
3.6 Bargain purchases in business combinationsAny excess of the Group’s interest in the fair value of the acquirees’ net identifiable assets, liabilities and contingent liabilities over the aggregate of the consideration transferred, the amount recognised for non-controlling interests and any fair value of the Group’s previously held equity interests in the acquiree is recognised immediately in profit or loss.
3.7 Investment propertiesInvestment properties are interests in land and buildings held to earn rental income and/or for capital appreciation, rather than for use in the production or supply of goods or services or for administrative purpose.
Investment property is initially stated at cost, including directly attributable costs, and subsequently stated at fair value as determined by external professional valuers to reflect the prevailing market conditions at the end of each reporting period. Any gain or loss resulting from either a change in the fair value or disposal of an investment property is immediately recognised in profit or loss. Rental income from investment properties is accounted for as described in note 3.29(iv).
For a transfer from investment property carried at fair value to owner-occupied property, the property’s deemed cost for subsequent accounting is its fair value at the date of change in use. For property occupied by the Group as an owner-occupied property which becomes an investment property, the Group revaluates such property on the date of change in use, and any difference at that date between the carrying amount and the fair value of the property is dealt with in assets revaluation reserve. The fair value at the date of the change in use is the deemed cost for subsequent accounting as investment properties. On disposal of the property, the assets revaluation reserve is transferred to retained profits as a movement in reserves.
For a transfer from inventories to investment properties, any difference between the fair value of the property at that date and its previous carrying amount is recognised in profit or loss.
3.8 Property, plant and equipmentExcept for freehold land which is not depreciated, property, plant and equipment are stated at cost or valuation less accumulated depreciation and any impairment losses (note 3.13). When an item of property, plant and equipment is classified as held for sale or when it is part of a disposal group classified as held for sale, it is not depreciated and is accounted for in accordance with HKFRS 5 (note 3.9).
The cost of an item of property, plant and equipment comprises its purchase price and any directly attributable costs of bringing the asset to the working condition and location for its intended use. Expenditure incurred after items of property, plant and equipment have been put into operation, such as repairs and maintenance, is normally charged to profit or loss in the period in which it is incurred. In situations where it can be demonstrated that the expenditure has resulted in an increase in the future economic benefits expected to be obtained from the use of an item of property, plant and equipment, and where the cost of the item can be measured reliably, the expenditure is capitalised as an additional cost of that asset or as a replacement.
Shell Electric Holdings Limited
For the year ended 31st December, 2015
24
NOTES TO THE FINANCIAL STATEMENTS
3. SUMMARY OF SIGNIFICANT ACCOUNTING POLICIES (Continued)
3.8 Property, plant and equipment (Continued)
Land and buildings are stated as revalued amount, being its fair value at the date of the revaluation less any subsequent accumulated depreciation and impairment losses. The revaluation surplus is recognised in equity. Revaluations are performed with sufficient regularity to ensure that the carrying amount does not differ materially from that which would be determined using fair value at the end of the reporting period. Increases in value arising on revaluation are recognised in other comprehensive income and accumulated in equity under assets revaluation reserve. Decreases in value arising on revaluation are first offset against increases on earlier valuations in respect of the same property and thereafter recognised in profit or loss. Any subsequent increases are recognised in profit or loss up to the amount previously charged and thereafter to the assets revaluation reserve.
Depreciation is provided to write off the cost or valuation of each item of property, plant and equipment less its residual value, if applicable, over its estimated useful lives on a straight-line basis at the following rates per annum:
Category of property, plant and equipment Annual rates
Freehold land No depreciatedLand and buildings (note 3.12) 2% to 5%Plant, machinery, tools, moulds and equipment 10% to 20%Furniture, fixtures and office equipment 10% to 33.33%Motor vehicles (including taxi) 20% to 25%
An annual transfer from assets revaluation reserve to retained profits is made for the difference between the depreciation based on the revalued amount of an asset and the depreciation based on the asset’s original cost.
Residual values, useful lives and depreciation method are reviewed, and adjusted if appropriate, at the end of each reporting period. Property, plant and equipment is derecognised upon disposal or when no future economic benefits are expected from its use or disposal. Any gain or loss arising from the disposal or retirement of an item of property, plant and equipment is determined as the difference between the sale proceeds and the carrying amount of the item and is recognised in profit or loss. When land and buildings are derecognised upon disposal, the relevant portion of the revaluation surplus will be directly transferred to retained profits.
3.9 Non-current assets and disposal groups held for saleNon-current assets and disposal groups are classified as held for sale if their carrying amount will be recovered principally through a sale transaction rather than through continuing use. This condition is regarded as met only when the sale is highly probable and the asset or disposal group is available for immediate sale in its present condition subject only to terms that are usual and customary for the sale of such assets or disposal groups. Non-current assets and disposal groups (other than investment properties) classified as held for sale are measured at the lower of the assets’ previous carrying amount and fair value less costs to sell. Property, plant and equipment and intangible assets classified as held for sale are not depreciated or amortised.
3.10 Intangible assets (Other than goodwill)Intangible assets are recognised initially at cost. After initial recognition, intangible assets with finite useful lives are amortised over the economic useful life and assessed for impairment (note 3.13) whenever there is an indication that the intangible asset may be impaired. Intangible assets with indefinite useful lives are not amortised but reviewed for impairment at least annually (note 3.13) either individually or at the cash-generating unit level. The useful life of an intangible asset with an indefinite life is reviewed annually to determine whether indefinite life assessment continues to be supportable. If not, the change in the useful life assessment from indefinite to finite is accounted for on a prospective basis.

Annual Report 2015
For the year ended 31st December, 2015
25
NOTES TO THE FINANCIAL STATEMENTS
3. SUMMARY OF SIGNIFICANT ACCOUNTING POLICIES (Continued)
3.10 Intangible assets (Other than goodwill) (Continued)
Taxi licences
Cost incurred in the acquisition of permanent taxi operating licences, which have indefinite useful lives, are carried at cost less any impairment losses and are not amortised.
Taxi licences which are granted for free are amortised over their estimated useful life of five years.
Car rental licences
Cost incurred in the acquisition of car rental licences, which have indefinite useful lives, are carried at cost less any impairment losses and are not amortised.
Patent
Separately acquired patent is shown at historical cost. Patent acquired in a business combination is recognised at fair value at the acquisition date. Patent has a finite useful life and are carried at cost less accumulated amortisation. Amortisation is calculated using the straight-line method to allocate the cost of patent over its estimated useful live of eight years.
3.11 Other assetsOther assets represent antiques held for long-term investment purposes and are stated at cost less accumulated impairment losses.
3.12 LeasesLeases are classified as finance leases whenever the terms of the lease transfer substantially all the risk and rewards of ownership to the lessee. All other leases are classified as operating leases.
The Group as lessor
Assets leased by the Group under operating leases are included in non-current asset, and rental receivable under the operating leases are credited to profit or loss on a straight-line basis over the lease terms.
Amounts due from lessees under finance leases are recorded as receivables at the amount of the Group’s net investment in the leases. Finance lease income is allocated to accounting periods so as to reflect a constant periodic rate of return on the Group’s net investment outstanding in respect of the leases.
The Group as lessee
Rentals payable under the operating leases, net of any incentives received or receivable, are charged to profit or loss on a straight-line basis over the lease terms. Prepaid lease rental on land are up-front prepayments made for the leasehold land and land use rights which are stated at cost less accumulated amortisation and any impairment losses. Amortisation is calculated on a straight-line basis over the lease term. When the lease payments cannot be allocated reliably between the land and buildings elements, the entire lease payments are included in cost of land and buildings as a finance lease in property, plant and equipment (note 3.8).
When the Group’s interests in leasehold land and buildings are in the course of development for investment purpose, the leasehold land component is included in properties under development. During the development period of such properties, the amortisation charge of the prepaid land lease is capitalised as part of the building costs but charged to profit or loss on completion of development of such properties.
3.13 Impairment of non-financial assetsGoodwill, other intangible assets, other assets, property, plant and equipment, prepaid lease rental on land and interests in subsidiaries, associates and joint ventures are subject to impairment testing. Goodwill, other intangible assets and other assets with an indefinite useful life or those not yet available for use are tested for impairment at least annually, irrespective of whether there is any indication that they are impaired. All other assets are tested for impairment whenever there are indications that the assets’ carrying amount may not be recoverable.

Shell Electric Holdings Limited
For the year ended 31st December, 2015
26
NOTES TO THE FINANCIAL STATEMENTS
3. SUMMARY OF SIGNIFICANT ACCOUNTING POLICIES (Continued)
3.13 Impairment of non-financial assets (Continued)
An impairment loss is recognised as an expense immediately for the amount by which the asset’s carrying amount exceeds its recoverable amount. The recoverable amount is the higher of fair value, reflecting market conditions less costs to sell, and value-in-use. In assessing value-in-use, the estimated future cash flows are discounted to their present value using a pre-tax discount rate that reflects current market assessment of the time value of money and the risk specific to the asset.
For the purposes of assessing impairment, where an asset does not generate cash inflows largely independent from those from other assets, the recoverable amount is determined for the smallest group of assets that generate cash inflows independently (i.e. a cash-generating unit). As a result, some assets are tested individually for impairment and some are tested at cash-generating unit level. Goodwill in particular is allocated to those cash-generating units that are expected to benefit from synergies of the related business combination and represent the lowest level within the Group at which the goodwill is monitored for internal management purpose.
Impairment losses recognised for cash-generating units to which goodwill has been allocated are credited initially to the carrying amount of goodwill. Any remaining impairment loss is charged pro rata to the other assets in the cash generating unit, except that the carrying value of an asset will not be reduced below its individual fair value less cost to sell, or value-in-use, if determinable.
An impairment loss on goodwill is not reversed in subsequent periods including impairment losses recognised in an interim period. In respect of other assets, an impairment loss is reversed if there has been a favourable change in the estimates used to determine the asset’s recoverable amount but only to the extent that the asset’s carrying amount does not exceed the carrying amount that would have been determined (net of depreciation or amortisation) had no impairment loss been recognised.
A reversal of such impairment is credited to profit or loss in the period in which it arises unless that asset is carried at revalued amount, in which case the reversal of impairment loss is accounted for in accordance with the relevant accounting policy for the revalued amount.
3.14 Investments and other financial assetsManagement determines the classification of its financial assets at initial recognition depending on the purpose for which the financial assets were acquired and, where allowed and appropriate, re-evaluates this designation at each reporting period.
All financial assets are recognised when, and only when, the Group becomes a party to the contractual provisions of the instrument. The Group assesses whether a contract contains an embedded derivative when the Group first becomes a party to it. The embedded derivatives are separated from the host contract when the analysis shows that the economic characteristics and the risks of the embedded derivatives are not closely related to those of the host contract.
All regular way purchases and sales of financial assets are recognised and derecognised on trade date. Regular way purchases or sales are purchases or sales of financial assets under a contract whose terms require delivery of assets within the period generally established by regulation or convention in the marketplace concerned.
When financial assets are recognised initially, they are measured at fair value plus directly attributable transaction costs, except in the case of financial assets recorded at fair value through profit or loss. Derecognition of financial assets occurs when the rights to receive cash flows from the investments expire or are transferred and substantially all of the risks and rewards of ownership have been transferred.
Financial assets at fair value through profit or loss
Financial assets at fair value through profit or loss include financial assets held for trading which are classified as “Investments held for trading” in the consolidated statement of financial position and financial assets designated upon initial recognition as at fair value through profit or loss. Financial assets are classified as held for trading if they are acquired for the purpose of selling in the near term, or they are part of a portfolio of identified financial instruments that are managed together and for which there is evidence of a recent pattern of short-term profit-taking. Derivatives, including separated embedded derivatives, are also classified as held for trading unless they are designated as effective hedging instruments or financial guarantee contracts.
Annual Report 2015
For the year ended 31st December, 2015
27
NOTES TO THE FINANCIAL STATEMENTS
3. SUMMARY OF SIGNIFICANT ACCOUNTING POLICIES (Continued)
3.14 Investments and other financial assets (Continued)
Financial assets at fair value through profit or loss (Continued)
Where a contract contains one or more embedded derivatives, the entire hybrid contract may be designated as a financial asset at fair value through profit or loss, except where the embedded derivative does not significantly modify the cash flows or it is clear that separation of the embedded derivative is prohibited.
Financial assets may be designated upon initial recognition as at fair value through profit or loss if the following criteria are met: (i) the designation eliminates or significantly reduces the inconsistent treatment that would otherwise arise from measuring the assets or recognising gains or losses on them on a different basis; (ii) the assets are part of a group of financial assets which are managed and their performance evaluated on a fair value basis, in accordance with a documented risk management strategy; or (iii) the financial asset contains an embedded derivative that would need to be separately recorded.
Subsequent to initial recognition, financial assets included in this category are measured at fair value with changes in fair value recognised in profit or loss in the period in which they arise. Fair value is determined by reference to active market transactions or using a valuation technique where no active market exists. Fair value gain or loss does not include any dividends or interests earned on these financial assets. Interests or dividends earned on these financial assets are recognised in profit or loss in accordance with the policies set out in note 3.29.
Loans and receivablesLoans and receivables including amounts due from related parties are non-derivative financial assets with fixed or determinable payments that are not quoted in an active market. Such assets are subsequently measured at amortised cost using the effective interest method, less any allowance for impairment. Amortised cost is calculated taking into account any discount or premium on acquisition and includes fees or costs that are an integral part of the effective interest rate. Gains or losses are recognised in profit or loss when the loans and receivables are derecognised or impaired as well as through the amortisation process.
Available-for-sale financial assetsAvailable-for-sale financial assets are non-derivative financial assets that are designated as available-for-sale or are not classified as any other categories of financial assets. After initial recognition, available-for-sale financial assets are measured at fair value with gains or losses being recognised in other comprehensive income and accumulated in equity until the investment is derecognised or until the investment is determined to be impaired, at which time the cumulative gain or loss is recognised in profit or loss and removed from equity. Interests or dividends earned on these financial assets are recognised in profit or loss in accordance with the policies set out in note 3.29.
The fair value of available-for-sale monetary assets denominated in foreign currency is determined in that foreign currency and translated at the spot rate at the end of the reporting period. The change in fair value attributable to translation differences that result from a change in amortised cost of the asset is recognised in profit or loss, and other changes are recognised in other comprehensive income.
When the fair value of unlisted equity securities cannot be reliably measured because the variability in the range of reasonable fair value estimates is significant for that investment or the probabilities of the various estimates within the range cannot be reasonably assessed and used in estimating fair value, such securities are stated at cost less any impairment losses.
Derivative financial instrumentsDerivative financial instruments, in individual contracts or separated from hybrid financial instruments, are initially recognised at fair value on the date the derivative contract is entered into and subsequently remeasured at fair value. Derivatives that are not designated as hedging instruments are accounted for as financial assets at fair value through profit or loss. Gains or losses arising from changes in fair value are taken directly to profit or loss for the year.
3.15 Impairment of financial assetsAt the end of each reporting period, financial assets other than at fair value through profit or loss are reviewed to determine whether there is any objective evidence of impairment.
Objective evidence of impairment of individual financial assets includes observable data that come to the attention of the Group about one or more of the following loss events:
— significant financial difficulty of the debtor;
— a breach of contract, such as a default or delinquency in interest or principal payments;
— it becoming probable that the debtor will enter bankruptcy or other financial reorganisation;
— significant changes in the technological, market, economic or legal environment that have an adverse effect on the debtor; and
— a significant or prolonged decline in the fair value of an investment in an equity instrument below its cost.

Shell Electric Holdings Limited
For the year ended 31st December, 2015
28
NOTES TO THE FINANCIAL STATEMENTS
3. SUMMARY OF SIGNIFICANT ACCOUNTING POLICIES (Continued)
3.15 Impairment of financial assets (Continued)
Loss events in respect of a group of financial assets include observable data indicating that there is a measurable decrease in the estimated future cash flows from the group of financial assets. Such observable data include but not limited to adverse changes in the payment status of debtors in the group and, national or local economic conditions that correlate with defaults on the assets in the group.
If any such evidence exists, the impairment loss is measured and recognised as follows:
Financial assets carried at amortised cost
If there is objective evidence that an impairment loss has been incurred, the amount of the loss is measured as the difference between the asset’s carrying amount and the present value of estimated future cash flows (excluding future credit losses that have not been incurred) discounted at the financial asset’s original effective interest rate (i.e. the effective interest rate computed at initial recognition). The amount of impairment loss is recognised in profit or loss of the period in which the impairment occurs. Loan and receivables together with any associated allowance are written off when there is no realistic prospect of future recovery and all collateral has been realised or has been transferred to the Group.
If, in subsequent period, the amount of the impairment loss decreases and the decrease can be related objectively to an event occurring after the impairment was recognised, the previously recognised impairment loss is reversed to the extent that it does not result in a carrying amount of the financial asset exceeding what the amortised cost would have been had the impairment not been recognised at the date the impairment is reversed. The amount of the reversal is recognised in profit or loss of the period in which the reversal occurs.
Available-for-sale financial assets
If there is objective evidence that an available-for-sale financial asset is impaired, an amount comprising the difference between the asset’s acquisition cost (net of any principal repayment and amortisation) and its current fair value, less any impairment loss on that asset previously recognised in profit or loss, is removed from equity and recognised in profit or loss.
Impairment losses on equity instruments classified as available-for-sale are not reversed through profit or loss. Impairment losses in respect of debt instruments are reversed through profit or loss if the subsequent increase in fair value can be objectively related to an event occurring after the impairment loss was recognised.
Financial assets carried at cost
If there is objective evidence that an impairment loss on an unquoted investment that is not carried at fair value has been incurred, the amount of impairment loss is measured as the difference between the carrying amount of the financial asset and the present value of estimated future cash flows discounted at the current market rate of return for a similar financial asset. Such impairment losses are not reversed in subsequent periods.
3.16 Inventory of propertiesInventory of properties represent properties under development. Properties under development are investments in land and buildings on which construction work has not been completed and which, upon completion, management intends to hold for sale purposes. Inventory of properties are stated at the lower of cost and net realisable value. Net realisable value is determined on the basis of anticipated sales proceeds less estimated cost to completion and estimated selling expenses. The costs of inventory of properties consist of land held under operating lease (note 3.12), development expenditures including construction costs, borrowing costs and other direct costs attributable to the development of such properties.
3.17 Other inventoriesOther inventories are stated at the lower of cost, computed using weighted average method, and net realisable value. Cost includes all expenses directly attributable to the manufacturing process as well as suitable portions of related production overheads. Net realisable value is the estimated selling price in the ordinary course of business less any applicable selling expenses.
Annual Report 2015
For the year ended 31st December, 2015
29
NOTES TO THE FINANCIAL STATEMENTS
3. SUMMARY OF SIGNIFICANT ACCOUNTING POLICIES (Continued)
3.18 Foreign currenciesThe financial statements are presented in Hong Kong Dollars (“HK$”), which is also the functional currency of the Company. Each entity in the Group determines its own functional currency and items included in the financial statements of each entity are measured using that functional currency. In the separate financial statements of the consolidated entities, foreign currency transactions are translated into the functional currency of the individual entity using the exchange rates prevailing at the dates of the transactions. Foreign exchange gains and losses resulting from the settlement of such transactions and from the translation of monetary assets and liabilities denominated in foreign currencies at the rates ruling at the end of the reporting period are recognised in profit or loss. Non-monetary items that are measured in terms of historical cost in a foreign currency are translated using the exchange rates at the dates of the initial transactions. Non-monetary items carried at fair value that are denominated in foreign currencies are translated at the rates prevailing on the date when the fair value was determined.
The functional currencies of certain entities of the Group are currencies other than HK$. For the purpose of the consolidated financial statements, assets and liabilities of those entities at the end of reporting period are translated into HK$ at exchange rate prevailing at the end of reporting period. Income and expense items are translated into HK$ at the average exchange rate for the period, unless exchange rates fluctuate significantly during the period, in which case, the rates approximating to those ruling when the transactions took place are used. The resulting exchange differences are recognised in other comprehensive income and accumulated separately in equity in the Group’s translation reserve.
On disposal of a foreign operation, the cumulative exchange differences recognised in the translation reserve relating to that operation up to the date of disposal are reclassified to profit or loss as part of the profit or loss on disposal.
Goodwill and fair value adjustments arising on acquisition of a foreign operation are treated as assets and liabilities of the foreign operation and translated at the closing rate. Exchange differences arising are recognised in the translation reserve.
3.19 Cash and cash equivalentsCash and cash equivalents include cash at bank and in hand, demand deposits with banks and short-term highly liquid investments with original maturities of three months or less that are readily convertible into known amounts of cash and which are subject to an insignificant risk of changes in value.
3.20 Income taxIncome taxes for the year comprise current tax and deferred tax.
Current tax is based on the profit or loss from ordinary activities adjusted for items that are non-assessable or disallowable for income tax purposes and is calculated using tax rates that have been enacted or substantively enacted at the end of reporting period.
Deferred tax is recognised in respect of temporary differences between the carrying amounts of assets and liabilities for financial reporting purposes and the corresponding amounts used for tax purposes. Except for goodwill and recognised assets and liabilities that affect neither accounting nor taxable profits, deferred tax liabilities are recognised for all taxable temporary differences. Deferred tax assets are recognised to the extent that it is probable that taxable profits will be available against which deductible temporary differences can be utilised. Deferred tax is measured at the tax rates appropriate to the expected manner in which the carrying amount of the asset or liability is realised or settled and that have been enacted or substantively enacted at the end of reporting period.
An exception to the general requirement on determining the appropriate tax rate used in measuring deferred tax amount is when an investment property is carried at fair value under HKAS 40 Investment Property. Unless the presumption is rebutted, the deferred tax amounts on these investment properties are measured using the tax rates that would apply on sale of these investment properties at their carrying amounts at the end of reporting period. The presumption is rebutted when the investment property is depreciable and is held within a business model whose objective is to consume substantially all the economic benefits embodied in the property over time, rather than through sale.
Deferred tax liabilities are recognised for taxable temporary differences arising on interests in subsidiaries, associates and joint ventures, except where the Group is able to control the reversal of the temporary differences and it is probable that the temporary differences will not reverse in the foreseeable future.
Shell Electric Holdings Limited
For the year ended 31st December, 2015
30
NOTES TO THE FINANCIAL STATEMENTS
3. SUMMARY OF SIGNIFICANT ACCOUNTING POLICIES (Continued)
3.20 Income tax (Continued)
Income taxes are recognised in profit or loss except when they relate to items recognised in other comprehensive income in which case the taxes are also recognised in other comprehensive income or when they relate to items recognised directly in equity in which case the taxes are also recognised directly in equity.
3.21 Borrowing costsBorrowing costs directly attributable to the acquisition, construction or production of qualifying assets, which are assets that necessarily take a substantial period of time to be ready for their intended use or sale, are capitalised as part of the cost of those assets. The capitalisation of such borrowing costs ceases when the assets are substantially ready for their intended use or sale. Investment income earned on the temporary investment of specific borrowings pending their expenditure on qualifying assets is deducted from the borrowing costs capitalised. Other borrowing costs are recognised as an expense in the period in which they are incurred.
Borrowing costs include interest charges and other costs incurred in connection with the borrowing of funds.
3.22 Financial liabilitiesFinancial liabilities are recognised when the Group becomes a party to the contractual provisions of the instrument. All interest related charges are recognised in accordance with the Group’s accounting policy for borrowing costs (note 3.21). A financial liability is derecognised when the obligation under the liability is discharged or cancelled or expires.
Where an existing financial liability is replaced by another from the same lender on substantially different terms, or the terms of an existing liability are substantially modified, such an exchange or modification is treated as a derecognition of the original liability and the recognition of a new liability, and the difference in the respective carrying amount is recognised in profit or loss.
Financial liabilities at amortised costs
Borrowings and trade and other payables including amounts due to related parties are financial liabilities at amortised cost which are recognised initially at fair value (net of transaction costs incurred for borrowings) and subsequently measured at amortised cost using the effective interest method. Gains or losses are recognised in profit or loss when the liabilities are derecognised as well as through amortisation process.
Derivative financial instruments
Derivative financial instruments, in individual contracts or separated from hybrid financial instruments, are initially recognised at fair value on the date the derivative contract is entered into and subsequently remeasured at fair value. Derivatives that are not designated as hedging instruments are accounted for as financial liabilities at fair value through profit or loss. Gains or losses arising from changes in fair value are taken directly to profit or loss for the year.
3.23 Financial guarantee contractsA financial guarantee contract is a contract that requires the issuer (or guarantor) to make specified payments to reimburse the holder for a loss it incurs because a specified debtor fails to make payment when due in accordance with the terms of a debt instrument.
A financial guarantee contract issued by the Group and not designated as at fair value through profit or loss is recognised initially at its fair value less transaction costs that are directly attributable to the issue of the financial guarantee contract. Subsequent to initial recognition, the Group measures the financial guarantee contact at the higher of: (i) the amount determined in accordance with HKAS 37 Provisions, Contingent Liabilities and Contingent Assets; and (ii) the amount initially recognised less, when appropriate, cumulative amortisation recognised in accordance with HKAS 18 Revenue.
Annual Report 2015
For the year ended 31st December, 2015
31
NOTES TO THE FINANCIAL STATEMENTS
3. SUMMARY OF SIGNIFICANT ACCOUNTING POLICIES (Continued)
3.24 Employee benefitsShort-term employee benefits
Short-term employee benefits are employee benefits (other than termination benefits) that are expected to be settled wholly before twelve months after the end of the annual reporting period in which the employees render the related service. Short term employee benefits are recognised in the year when the employees render the related service.
Non-accumulating compensated absences such as sick leave and maternity leave are not recognised until the time of leave.
Defined contribution retirement plan
Contributions to defined contribution retirement plans are recognised as an expense in profit or loss when the services are rendered by the employees.
Termination benefits
Termination benefits are recognised on the earlier of when the Group can no longer withdraw the offer of those benefits and when the Group recognises restructuring costs involving the payment of termination benefits.
3.25 Share-based payment transactionsThe Group operates equity-settled share-based compensation plans for remuneration of its employees. All employee services received in exchange for the grant of financial instruments, for example, share options are measured at their fair values. The cost of equity-settled share-based compensation is measured by reference to the fair value of the equity instrument at the date on which they are granted. In determining the fair value, no account is taken of any non-market vesting conditions (for example, profitability and sales growth targets).
All equity-settled share-based compensation is ultimately recognised as an expense in profit or loss unless it qualifies for recognition as asset with a corresponding increase in equity. If vesting periods or other vesting conditions apply, the expense is allocated over the vesting period, based on the best available estimate of the number of equity instruments expected to vest. Non-market vesting conditions are included in assumptions about the number of equity instruments that are expected to become exercisable. Estimates are subsequently revised, if there is any indication that the number of equity instruments expected to vest differs from previous estimates.
No expense is recognised for awards that do not ultimately vest, except for awards where vesting is conditional upon a market condition, which are treated as vesting irrespective of whether or not the market condition is satisfied, provided that all other performance conditions are satisfied.
In respect of share options, the fair value of the share options granted by the Group to its employees is recognised in profit or loss with a corresponding increase in share option reserve. Upon exercise of the share options, the amount in the share option reserve is transferred to the share premium account. In case the share options lapsed, the amount in the share option reserve is released directly to retained profits.
3.26 Provisions and contingent liabilitiesProvision is recognised when the Group has a present obligation as a result of a past event, and it is probable that an outflow of economic benefits will be required to settle the obligation and a reliable estimate of the amount of the obligation can be made. When the effect of discounting is material, provision is stated at the present value of the expenditure expected to settle the obligation. The increase in the discounted present value amount arising from the passage of time is included in finance costs in profit or loss. All provisions are reviewed at the end of each reporting period and adjusted to reflect the current best estimate.
Where it is not probable that an outflow of economic benefits will be required, or the amount cannot be estimated reliably, the obligation is disclosed as a contingent liability, unless the probability of outflow of economic benefits is remote. Possible obligations, whose existence will only be confirmed by the occurrence or non-occurrence of one or more future uncertain events not wholly within the control of the Group, are also disclosed as contingent liabilities unless the probability of outflow of economic benefits is remote.
Shell Electric Holdings Limited
For the year ended 31st December, 2015
32
NOTES TO THE FINANCIAL STATEMENTS
3. SUMMARY OF SIGNIFICANT ACCOUNTING POLICIES (Continued)
3.27 Equity instrumentsEquity instruments issued by the Company are recorded at the proceeds received, net of direct issue costs.
3.28 DividendsFinal dividends proposed by the directors are classified as a separate allocation of retained profits within equity, until they have been approved by the shareholders in a general meeting. When these dividends are approved and declared, they are recognised as a liability. Interim dividends are simultaneously proposed and declared and consequently, interim dividends are recognised immediately as a liability when they are proposed and declared.
3.29 Recognition of revenue and other incomeRevenue and other income are recognised when it is probable that the economic benefits will flow to the Group and when the income can be measured reliably on the following bases:
(i) Sales of goods are recognised as revenue when goods are delivered and title has been passed.
(ii) Interest income is accrued on a time basis by reference to the principal outstanding and the effective interest rate applicable.
(iii) Dividend income from investments is recognised when the shareholders’ rights to receive payment have been established.
(iv) Rental income is recognised on a straight-line basis over the periods of the respective tenancies.
(v) Taxi rental, licence and management fee income is recognised in accordance with the substance of the licence and management agreement when the taxi licence holders’ right to receive payment has been established and the relevant services are delivered. Income received in advance which is attributable to the whole licensing contract arrangement is recognised as deferred income under current liabilities and amortised over the period of the licence contract.
(vi) Handling fee income and service income is recognised on an appropriate basis over the relevant period in which the services are rendered.
3.30 Government grantsGovernment grants are not recognised until there is reasonable assurance that the Group will comply with the conditions attaching to them and that the grants will be received.
When the Group receives a non-monetary grant, the asset and the grant are recorded at the fair value of the non-monetary asset. The grant is recognised as deferred income which is released to profit or loss over the expected useful life of the relevant asset by equal annual installments.
3.31 Related partiesFor the purpose of these financial statements, a party is considered to be related to the Group if:
(a) The party is a person or a close member of that person’s family and that person:
(i) has control or joint control over the Group;
(ii) has significant influence over the Group; or
(iii) is a member of key management personnel of the Group or of a parent of the Company.
Annual Report 2015
For the year ended 31st December, 2015
33
NOTES TO THE FINANCIAL STATEMENTS
3. SUMMARY OF SIGNIFICANT ACCOUNTING POLICIES (Continued)
3.31 Related parties (Continued)
(b) The party is an entity where any of the following conditions apply:
(i) the entity and the Group are members of the same Group (which means that each parent, subsidiary and fellow subsidiary is related to the others);
(ii) one entity is an associate or joint venture of the other entity (or an associate or joint venture of a member of a group of which the other entity is a member);
(iii) both entities are joint ventures of the same third party;
(iv) one entity is a joint venture of a third entity and the other entity is an associate of the third entity;
(v) the entity is a post-employment benefit plan for the benefit of the employees of either the Group or an entity related to the Group;
(vi) the entity is controlled or jointly controlled by a person identified in (a);
(vii) a person identified in (a)(i) has significant influence over the entity or is a member of the key management personnel of the entity (or of a parent of the entity); or
(viii) the entity, or any member of a group of which it is a part, provides key management personnel services to the Group or to the Company's parent.
Close members of the family of a person are those family members who may be expected to influence, or be influenced by, that person in their dealings with the entity and include:
(a) that person’s children and spouse or domestic partner;
(b) children of that person’s spouse or domestic partner; and
(c) dependents of that person or that person’s spouse or domestic partner.
3.32 Segment reportingOperating segments, and the amounts of each segment item reported in the financial statements, are identified from the financial information provided regularly to the chief operating decision-maker i.e. the most senior executive management for the purposes of allocating resources to, and assessing the performance of, the Group’s various lines of business and geographical locations. Individually material operating segments are not aggregated for financial reporting purposes unless the segments have similar economic characteristics and are similar in respect of the nature of products and services, the nature of production processes, the type or class of customers, the methods used to distribute the products or provide the services, and the nature of the regulatory environment. Operating segments which are not individually material may be aggregated if they share a majority of these criteria.

Shell Electric Holdings Limited
For the year ended 31st December, 2015
34
NOTES TO THE FINANCIAL STATEMENTS
4. CRITICAL ACCOUNTING ESTIMATES AND JUDGMENTSEstimates and judgments used in preparing financial statements are continually evaluated and are based on historical experience and other factors, including expectations of future events that are believed to be reasonable under the circumstances.
4.1 Key sources of estimation uncertaintyThe Group makes estimates and assumptions concerning the future. The resulting accounting estimates will, by definition, seldom equal the related actual results. The estimates and assumptions that have a significant effect on the carrying amounts of assets and liabilities within the next financial year are discussed below:
Fair value of investment properties and land and buildings classified as property, plant and equipment
As disclosed in notes 14 and 15, investment properties and land and buildings classified as property, plant and equipment were revalued at the end of each reporting period by independent professional valuers. Such valuations were based on certain assumptions which are subject to uncertainty and might materially differ from the actual results. In making the judgment, the Group considers information from current prices in an active market for similar properties and uses assumptions that are mainly based on market conditions existing at the end of each reporting period.
Please refer to notes 14 and 15 for more detailed information in relation to the fair value measurement of the investment properties and land and buildings.
Fair value of unlisted equity investments and share options granted
The fair value of the unlisted equity investments and share options granted have been estimated by management with reference to valuations conducted by independent professional valuer, which are based on Black Scholes Model. The valuation requires the Group to make estimates and assumptions that are subject to uncertainty. The fair value of the unlisted equity investments as at 31st December, 2015 was HK$145,619,000 (2014: HK$150,718,000) (note 21) whereas the fair value granted by Netlink Assets Limited (“Netlink”) and PFC Device Holdings Limited (“PFC Device Holdings”), indirect subsidiaries of the Company during the year ended 31st December, 2015 were nil and HK$767,000 respectively (note 41).
Impairment of non-financial assets
The Group reviews at least annually and assesses whether goodwill, taxi licences with indefinite useful lives and antiques have suffered any impairment. Other assets including property, plant and equipment, prepaid lease rental on land and intangible assets with definite useful lives are reviewed for impairment whenever events or changes in circumstance indicate that the carrying amount of the assets exceeds its recoverable amount. The recoverable amount of an asset or a cash-generating unit has been determined based on value-in-use calculation which requires the use of estimates including expected future cash flows of the asset/cash-generating unit and discount rate adopted to calculate the present value of those cash flows. Details about the estimates used in assessing impairment for goodwill, other intangible assets and antiques are set out in notes 17, 18 and 22 respectively.
Allowance for loans and receivables
The policy on allowance for bad and doubtful debts of the Group is based on the evaluation of collectability and ageing analysis of loans and receivables and on management’s judgment. A considerable amount of judgment is required in assessing the ultimate realisation of these receivables, including current creditworthiness and the past collection history of each customer or debtor. If the financial conditions of the customers or debtors of the Group deteriorate thus resulting in impairment as to their ability to make payments, additional allowances may be required.
Impairment of available-for-sale financial assets
The Group classifies certain investments as available-for-sale financial assets and recognises movements in their fair values in equity. When the fair value declines, management makes assumption about the decline in value to determine whether there is an impairment that should be recognised in profit or loss. For the year ended 31st December, 2015, no impairment losses has been recognised for available-for-sale financial assets whereas impairment losses amounting to HK$37,531,000 was recognised for the year ended 31st December, 2014,

Annual Report 2015
For the year ended 31st December, 2015
35
NOTES TO THE FINANCIAL STATEMENTS
4. CRITICAL ACCOUNTING ESTIMATES AND JUDGMENTS (Continued)
4.1 Key sources of estimation uncertainty (Continued)
Allowance for inventories
In determining the amount of allowance required for obsolete and slow-moving inventories, the Group would evaluate ageing analysis of inventories and compare the carrying value of inventories to their respective net realisable values. A considerable amount of judgment is required in determining such allowance. If conditions which have an impact on the net realisable value of inventories deteriorate, additional allowances may be required.
Estimate of net realisable value of inventory of properties
Management reviews the recoverable amount of inventory of properties at the end of each reporting period. The recoverable amount is the estimated selling price of the properties less estimated cost to completion and estimated costs to sell. Management has made significant estimation in determining the recoverable amount. During the year, the Group has made impairment provision amounting to HK$31,432,000 for inventories of properties (note 9).
Estimates of current tax and deferred tax
The Group is subject to taxation in various jurisdictions. Significant judgment is required in determining the amount of the provision for taxation, the timing of payment of the related taxation and the implementation of these taxes varies amongst various cities in the People’s Republic of China (the “PRC”). The Group recognised income tax and other taxes based on management’s best estimates according to their understanding of the tax rules. The final tax outcome could be different from the amounts that were initially recorded, and these differences will impact the tax expense in the period in which the tax calculations are finalised with the local tax authorities.
4.2 Critical judgments in applying accounting policiesDistinction between investment properties and owner-occupied properties
Some properties of the Group comprise a portion that is held to earn rentals or for capital appreciation and another portion that is held for use in the production or supply of goods or services or for administrative purposes. If these portions can be sold separately (or leased out separately under a finance lease), the Group accounts for the portions separately. If the portions cannot be sold separately, the property is accounted for as an investment property only if an insignificant portion is held for use in the production or supply of goods or services or for administrative purposes. Judgment is applied in determining whether ancillary services are so significant that a property does not qualify as investment property. The Group considers each property separately in marking its judgment.
Joint arrangements
As at 31st December, 2015 and 2014, the Group held certain percentage of the registered capital/paid up capital and voting right of certain joint arrangements. The contractual arrangements confer joint control over the relevant activities of the joint arrangements to the Group and at least one other party. In addition, the joint arrangements are structured as limited companies and provide the Group and the parties to the arrangements with rights to the net assets of the limited companies under the arrangements. Therefore, based on the judgment of the management, those arrangements are classified as joint ventures (note 20).
5. REVENUEThe principal activities of the Group are disclosed in note 1. Revenue from the Group’s principal activities recognised during the year is as follows:
2015 2014HK$’000 HK$’000
Sales of goods 927,495 1,025,746Taxi rental, licence and management fee income 110,525 127,819Property rental income 108,814 113,990
Total revenue 1,146,834 1,267,555
Shell Electric Holdings Limited
For the year ended 31st December, 2015
36
NOTES TO THE FINANCIAL STATEMENTS
6. SEGMENT INFORMATIONThe operating segments are reported in a manner consistent with the way in which information is reported internally to the Group’s most senior management for the purposes of resource allocation and assessment of segment performance. The Group has identified the following reportable and other segments for its operating segments:
Electrical appliances and electronic components
— This segment designs, manufactures and trades electrical appliances and electronic components. Electrical appliances include electric fans, vacuum cleaners, LED lighting products, paper handling options, fuser, laser and scanner. Electronic components comprise power discrete semiconductors and other electronic components. The Group’s manufacturing facilities are located in the PRC and products are mainly sold to customers in the PRC and overseas such as North America and European countries.
Property leasing — This segment leases industrial, commercial and residential properties in Hong Kong, other regions of the PRC, the United States (the “USA”) and the United Kingdom to generate rental income and gain from appreciation in the properties’ values in long-term. Part of the business is carried out through an associate.
Property investment and development
— This segment constructs commercial and residential properties in Hong Kong and other regions of the PRC for external customers.
Securities trading — This segment mainly carries out trading of securities and other instruments to generate gain from appreciation in securities and other instruments.
Taxi rental — This segment carries out taxi rental operation in the PRC and generates rental income.
Other segments — Operating segments which are not reportable comprise trading of computer software which generate revenue from sales of goods, as well as direct investments which derive gain from holding investments in enterprises engaging in high-tech business.
Revenue and expenses are allocated to the reportable segments with reference to sales generated by those segments and the expenses incurred by those segments. Segment profit/loss includes the Group’s share of profit/loss arising from the activities of the Group’s associates and joint ventures. Reportable segment profit/loss excludes corporate income and expenses from the Group’s profit/loss before income tax. Corporate income and expenses are income and expenses incurred by corporate headquarters which are not allocated to the operating segments. Each of the operating segments is managed separately as the resources requirement of each of them is different.
Segment assets include all assets with the exception of tax assets and corporate assets, including certain available-for-sale financial assets, bank balances and cash and other assets which are not directly attributable to the business activities of operating segments as these assets are managed on a group basis.
Segment liabilities include trade and other payables, accrued liabilities, amounts due to related parties, bank borrowings and other liabilities directly attributable to the business activities of operating segments and exclude tax liabilities, corporate liabilities and liabilities that are managed on a group basis.
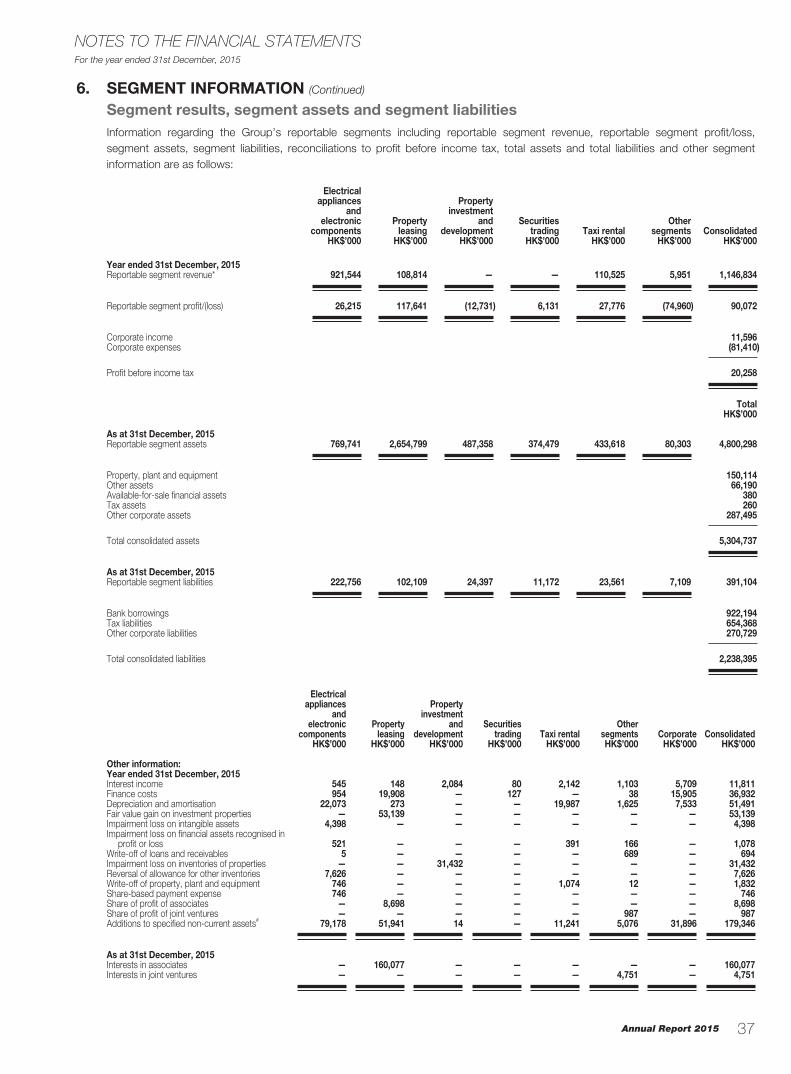
Annual Report 2015
For the year ended 31st December, 2015
37
NOTES TO THE FINANCIAL STATEMENTS
6. SEGMENT INFORMATION (Continued)
Segment results, segment assets and segment liabilitiesInformation regarding the Group’s reportable segments including reportable segment revenue, reportable segment profit/loss, segment assets, segment liabilities, reconciliations to profit before income tax, total assets and total liabilities and other segment information are as follows:
Electrical appliances
andelectronic
componentsProperty
leasing
Property investment
and development
Securities trading Taxi rental
Other segments Consolidated
HK$’000 HK$’000 HK$’000 HK$’000 HK$’000 HK$’000 HK$’000
Year ended 31st December, 2015Reportable segment revenue* 921,544 108,814 — — 110,525 5,951 1,146,834
Reportable segment profit/(loss) 26,215 117,641 (12,731) 6,131 27,776 (74,960) 90,072
Corporate income 11,596Corporate expenses (81,410)
Profit before income tax 20,258
TotalHK$’000
As at 31st December, 2015Reportable segment assets 769,741 2,654,799 487,358 374,479 433,618 80,303 4,800,298
Property, plant and equipment 150,114Other assets 66,190Available-for-sale financial assets 380Tax assets 260Other corporate assets 287,495
Total consolidated assets 5,304,737
As at 31st December, 2015Reportable segment liabilities 222,756 102,109 24,397 11,172 23,561 7,109 391,104
Bank borrowings 922,194Tax liabilities 654,368Other corporate liabilities 270,729
Total consolidated liabilities 2,238,395
Electrical appliances
andelectronic
componentsProperty
leasing
Property investment
and development
Securities trading Taxi rental
Other segments Corporate Consolidated
HK$’000 HK$’000 HK$’000 HK$’000 HK$’000 HK$’000 HK$’000 HK$’000
Other information:Year ended 31st December, 2015Interest income 545 148 2,084 80 2,142 1,103 5,709 11,811Finance costs 954 19,908 — 127 — 38 15,905 36,932Depreciation and amortisation 22,073 273 — — 19,987 1,625 7,533 51,491Fair value gain on investment properties — 53,139 — — — — — 53,139Impairment loss on intangible assets 4,398 — — — — — — 4,398Impairment loss on financial assets recognised in
profit or loss 521 — — — 391 166 — 1,078Write-off of loans and receivables 5 — — — — 689 — 694Impairment loss on inventories of properties — — 31,432 — — — — 31,432Reversal of allowance for other inventories 7,626 — — — — — — 7,626Write-off of property, plant and equipment 746 — — — 1,074 12 — 1,832Share-based payment expense 746 — — — — — — 746Share of profit of associates — 8,698 — — — — — 8,698Share of profit of joint ventures — — — — — 987 — 987Additions to specified non-current assets# 79,178 51,941 14 — 11,241 5,076 31,896 179,346
As at 31st December, 2015Interests in associates — 160,077 — — — — — 160,077Interests in joint ventures — — — — — 4,751 — 4,751
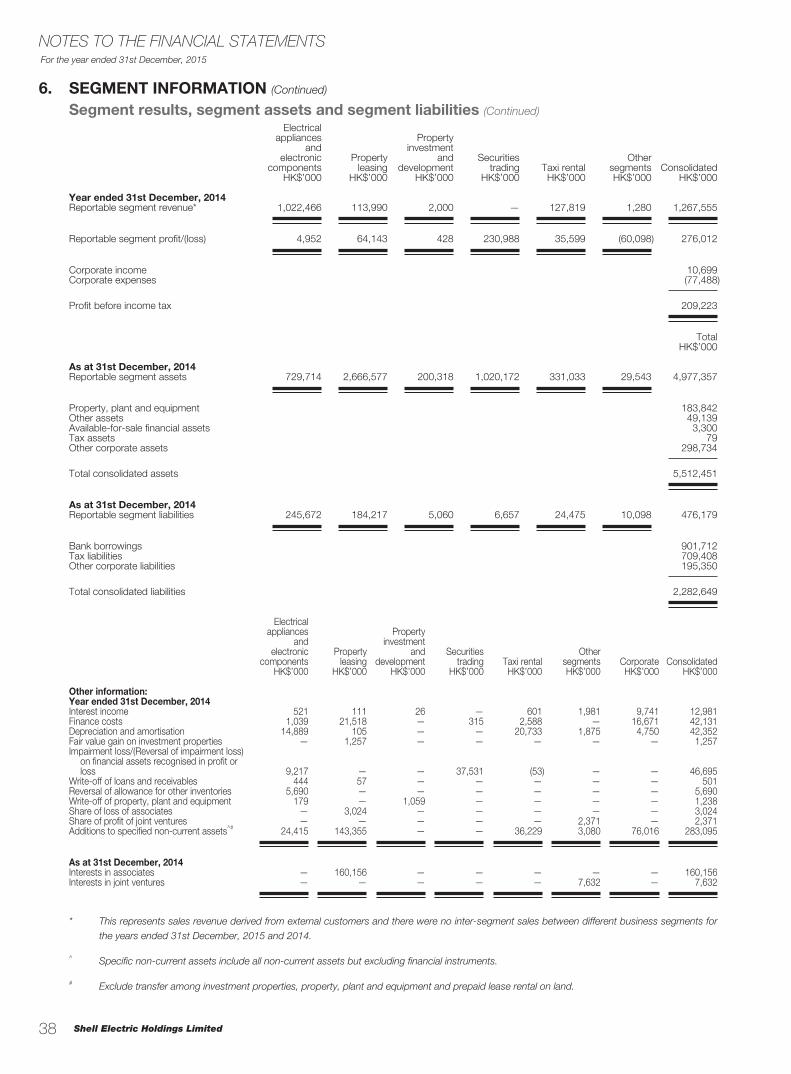
Shell Electric Holdings Limited
For the year ended 31st December, 2015
38
NOTES TO THE FINANCIAL STATEMENTS
6. SEGMENT INFORMATION (Continued)
Segment results, segment assets and segment liabilities (Continued)Electrical
appliancesand
electroniccomponents
Property leasing
Property investment
and development
Securities trading Taxi rental
Other segments Consolidated
HK$’000 HK$’000 HK$’000 HK$’000 HK$’000 HK$’000 HK$’000
Year ended 31st December, 2014Reportable segment revenue* 1,022,466 113,990 2,000 — 127,819 1,280 1,267,555
Reportable segment profit/(loss) 4,952 64,143 428 230,988 35,599 (60,098) 276,012
Corporate income 10,699Corporate expenses (77,488)
Profit before income tax 209,223
TotalHK$’000
As at 31st December, 2014Reportable segment assets 729,714 2,666,577 200,318 1,020,172 331,033 29,543 4,977,357
Property, plant and equipment 183,842Other assets 49,139Available-for-sale financial assets 3,300Tax assets 79Other corporate assets 298,734
Total consolidated assets 5,512,451
As at 31st December, 2014Reportable segment liabilities 245,672 184,217 5,060 6,657 24,475 10,098 476,179
Bank borrowings 901,712Tax liabilities 709,408Other corporate liabilities 195,350
Total consolidated liabilities 2,282,649
Electrical appliances
andelectronic
componentsProperty
leasing
Property investment
and development
Securities trading Taxi rental
Other segments Corporate Consolidated
HK$’000 HK$’000 HK$’000 HK$’000 HK$’000 HK$’000 HK$’000 HK$’000
Other information:Year ended 31st December, 2014Interest income 521 111 26 — 601 1,981 9,741 12,981Finance costs 1,039 21,518 — 315 2,588 — 16,671 42,131Depreciation and amortisation 14,889 105 — — 20,733 1,875 4,750 42,352Fair value gain on investment properties — 1,257 — — — — — 1,257Impairment loss/(Reversal of impairment loss)
on financial assets recognised in profit or loss 9,217 — — 37,531 (53) — — 46,695
Write-off of loans and receivables 444 57 — — — — — 501Reversal of allowance for other inventories 5,690 — — — — — — 5,690Write-off of property, plant and equipment 179 — 1,059 — — — — 1,238Share of loss of associates — 3,024 — — — — — 3,024Share of profit of joint ventures — — — — — 2,371 — 2,371Additions to specified non-current assets^# 24,415 143,355 — — 36,229 3,080 76,016 283,095
As at 31st December, 2014Interests in associates — 160,156 — — — — — 160,156Interests in joint ventures — — — — — 7,632 — 7,632
* This represents sales revenue derived from external customers and there were no inter-segment sales between different business segments for
the years ended 31st December, 2015 and 2014.
^ Specific non-current assets include all non-current assets but excluding financial instruments.
# Exclude transfer among investment properties, property, plant and equipment and prepaid lease rental on land.
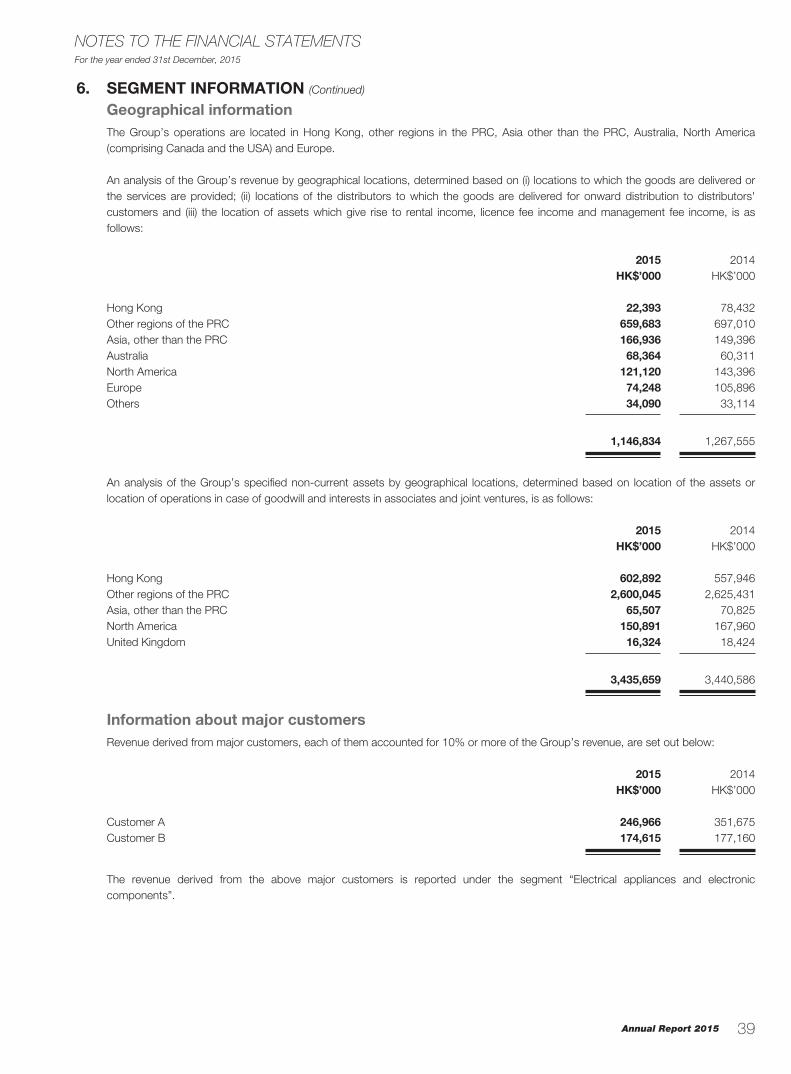
Annual Report 2015
For the year ended 31st December, 2015
39
NOTES TO THE FINANCIAL STATEMENTS
6. SEGMENT INFORMATION (Continued)
Geographical informationThe Group’s operations are located in Hong Kong, other regions in the PRC, Asia other than the PRC, Australia, North America (comprising Canada and the USA) and Europe.
An analysis of the Group’s revenue by geographical locations, determined based on (i) locations to which the goods are delivered or the services are provided; (ii) locations of the distributors to which the goods are delivered for onward distribution to distributors' customers and (iii) the location of assets which give rise to rental income, licence fee income and management fee income, is as follows:
2015 2014HK$’000 HK$’000
Hong Kong 22,393 78,432Other regions of the PRC 659,683 697,010Asia, other than the PRC 166,936 149,396Australia 68,364 60,311North America 121,120 143,396Europe 74,248 105,896Others 34,090 33,114
1,146,834 1,267,555
An analysis of the Group’s specified non-current assets by geographical locations, determined based on location of the assets or location of operations in case of goodwill and interests in associates and joint ventures, is as follows:
2015 2014HK$’000 HK$’000
Hong Kong 602,892 557,946Other regions of the PRC 2,600,045 2,625,431Asia, other than the PRC 65,507 70,825North America 150,891 167,960United Kingdom 16,324 18,424
3,435,659 3,440,586
Information about major customersRevenue derived from major customers, each of them accounted for 10% or more of the Group’s revenue, are set out below:
2015 2014HK$’000 HK$’000
Customer A 246,966 351,675Customer B 174,615 177,160
The revenue derived from the above major customers is reported under the segment “Electrical appliances and electronic components”.
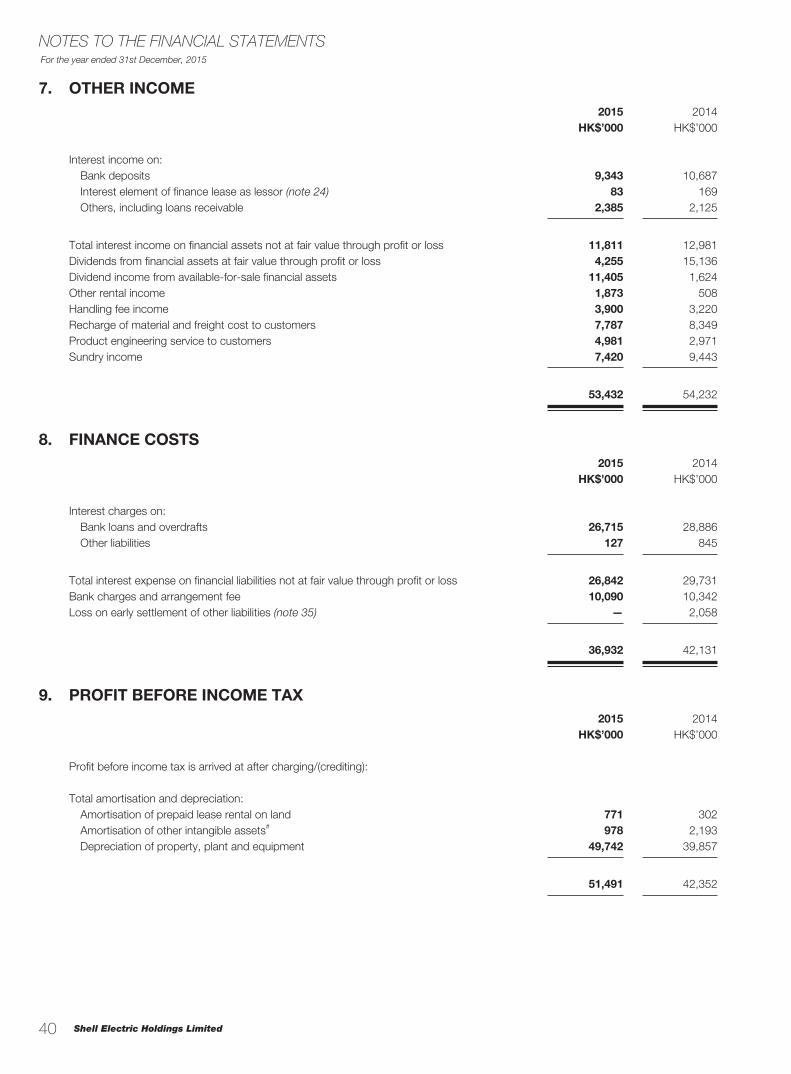
Shell Electric Holdings Limited
For the year ended 31st December, 2015
40
NOTES TO THE FINANCIAL STATEMENTS
7. OTHER INCOME2015 2014
HK$’000 HK$’000
Interest income on: Bank deposits 9,343 10,687 Interest element of finance lease as lessor (note 24) 83 169 Others, including loans receivable 2,385 2,125
Total interest income on financial assets not at fair value through profit or loss 11,811 12,981Dividends from financial assets at fair value through profit or loss 4,255 15,136Dividend income from available-for-sale financial assets 11,405 1,624Other rental income 1,873 508Handling fee income 3,900 3,220Recharge of material and freight cost to customers 7,787 8,349Product engineering service to customers 4,981 2,971Sundry income 7,420 9,443
53,432 54,232
8. FINANCE COSTS2015 2014
HK$’000 HK$’000
Interest charges on: Bank loans and overdrafts 26,715 28,886 Other liabilities 127 845
Total interest expense on financial liabilities not at fair value through profit or loss 26,842 29,731Bank charges and arrangement fee 10,090 10,342Loss on early settlement of other liabilities (note 35) — 2,058
36,932 42,131
9. PROFIT BEFORE INCOME TAX2015 2014
HK$’000 HK$’000
Profit before income tax is arrived at after charging/(crediting):
Total amortisation and depreciation: Amortisation of prepaid lease rental on land 771 302 Amortisation of other intangible assets# 978 2,193 Depreciation of property, plant and equipment 49,742 39,857
51,491 42,352

Annual Report 2015
For the year ended 31st December, 2015
41
NOTES TO THE FINANCIAL STATEMENTS
2015 2014HK$’000 HK$’000
Auditors’ remuneration: Current year 1,775 1,618 Under provision in prior year 40 94Cost of sales and services provided comprise: Amount of inventories recognised as expense 723,879 829,573 Reversal of allowance for other inventories (7,626) (5,690) Impairment loss on inventories of properties (note) 31,432 —Directors’ remuneration 26,374 24,963Donations 1,322 3,939Loss on disposal of property, plant and equipment 12,611 4,509Impairment loss on loans and receivables* 1,078 9,164Write-off of loans and receivables* 694 501Write-off of property, plant and equipment 1,832 1,238Write back of long outstanding payables (659) —Net foreign exchange loss/(gain) 10,315 (1,765)Outgoings in respect of investment properties 33,249 26,674Net rental income from investment properties (75,565) (87,316)Operating lease charge on land and buildings 7,569 7,904Research and development cost*^ 1,913 4,290Staff costs (note 11) 248,815 229,355
# included in “Administrative expenses” and “Cost of sales and services provided” in the consolidated income statement
* included in “Other operating expenses” in the consolidated income statement
^ excluding depreciation of property, plant and equipment and staff costs of HK$143,000 (2014: HK$78,000) and HK$779,000 (2014: HK$2,619,000) respectively
Note: During the year, the Group has written down the value of certain land parcels by HK$17,417,000 as detailed in note 49(d). In addition, the Group has written down the value of certain other inventories of properties. Based on the valuation report of those inventories of properties, their fair value is below their carrying value and accordingly, impairment provision of HK$14,015,000 has been made for these inventories of properties.
10. INCOME TAX EXPENSE2015 2014
HK$’000 HK$’000
Income tax expenses comprise:Current tax for the year Hong Kong profits tax 194 229 Other regions of the PRC — Enterprise Income Tax (“EIT”) 34,698 26,146 Others 3,387 1,294
38,279 27,669
Under/(Over) provision in prior years Hong Kong profits tax (42) (73) Other regions of the PRC 561 (1,283) Others (409) —
110 (1,356)
Deferred tax (note 38) PRC land appreciation tax (“LAT”) 569 3,020 Other income tax (26,337) 33,849
(25,768) 36,869
Income tax expense 12,621 63,182
9. PROFIT BEFORE INCOME TAX (Continued)
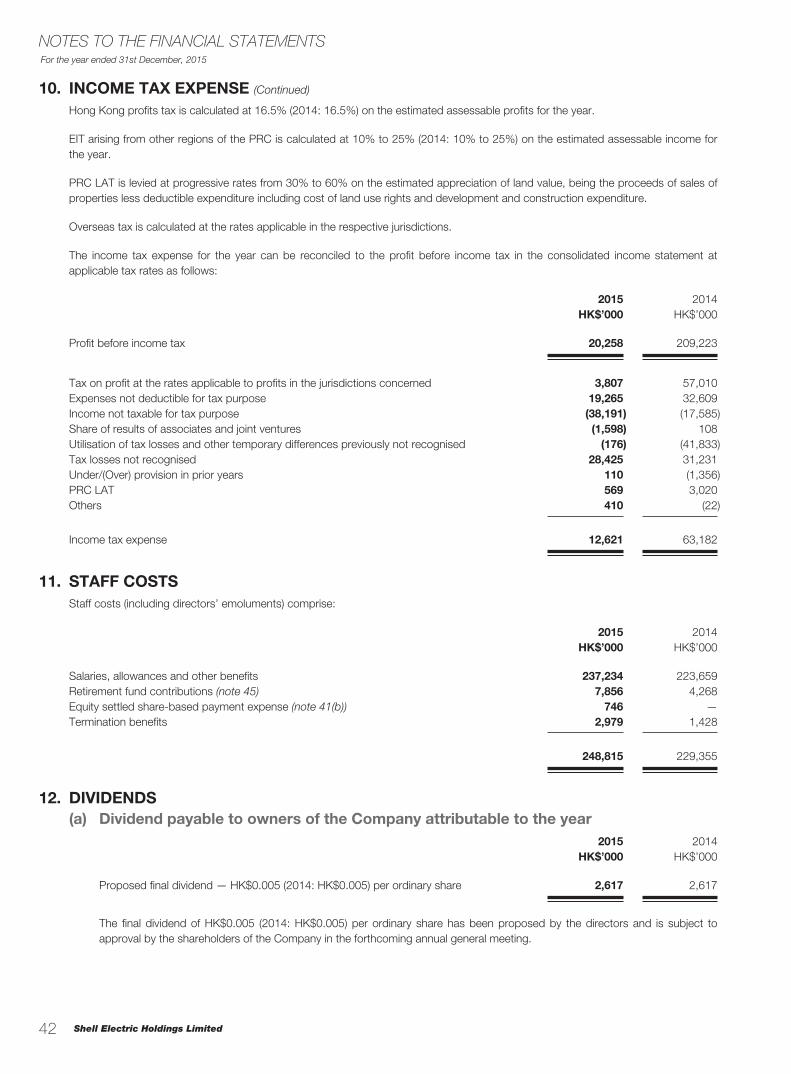
Shell Electric Holdings Limited
For the year ended 31st December, 2015
42
NOTES TO THE FINANCIAL STATEMENTS
10. INCOME TAX EXPENSE (Continued)
Hong Kong profits tax is calculated at 16.5% (2014: 16.5%) on the estimated assessable profits for the year.
EIT arising from other regions of the PRC is calculated at 10% to 25% (2014: 10% to 25%) on the estimated assessable income for the year.
PRC LAT is levied at progressive rates from 30% to 60% on the estimated appreciation of land value, being the proceeds of sales of properties less deductible expenditure including cost of land use rights and development and construction expenditure.
Overseas tax is calculated at the rates applicable in the respective jurisdictions.
The income tax expense for the year can be reconciled to the profit before income tax in the consolidated income statement at applicable tax rates as follows:
2015 2014HK$’000 HK$’000
Profit before income tax 20,258 209,223
Tax on profit at the rates applicable to profits in the jurisdictions concerned 3,807 57,010Expenses not deductible for tax purpose 19,265 32,609Income not taxable for tax purpose (38,191) (17,585)Share of results of associates and joint ventures (1,598) 108Utilisation of tax losses and other temporary differences previously not recognised (176) (41,833)Tax losses not recognised 28,425 31,231Under/(Over) provision in prior years 110 (1,356)PRC LAT 569 3,020Others 410 (22)
Income tax expense 12,621 63,182
11. STAFF COSTSStaff costs (including directors’ emoluments) comprise:
2015 2014HK$’000 HK$’000
Salaries, allowances and other benefits 237,234 223,659Retirement fund contributions (note 45) 7,856 4,268Equity settled share-based payment expense (note 41(b)) 746 —Termination benefits 2,979 1,428
248,815 229,355
12. DIVIDENDS(a) Dividend payable to owners of the Company attributable to the year
2015 2014HK$’000 HK$’000
Proposed final dividend — HK$0.005 (2014: HK$0.005) per ordinary share 2,617 2,617
The final dividend of HK$0.005 (2014: HK$0.005) per ordinary share has been proposed by the directors and is subject to approval by the shareholders of the Company in the forthcoming annual general meeting.
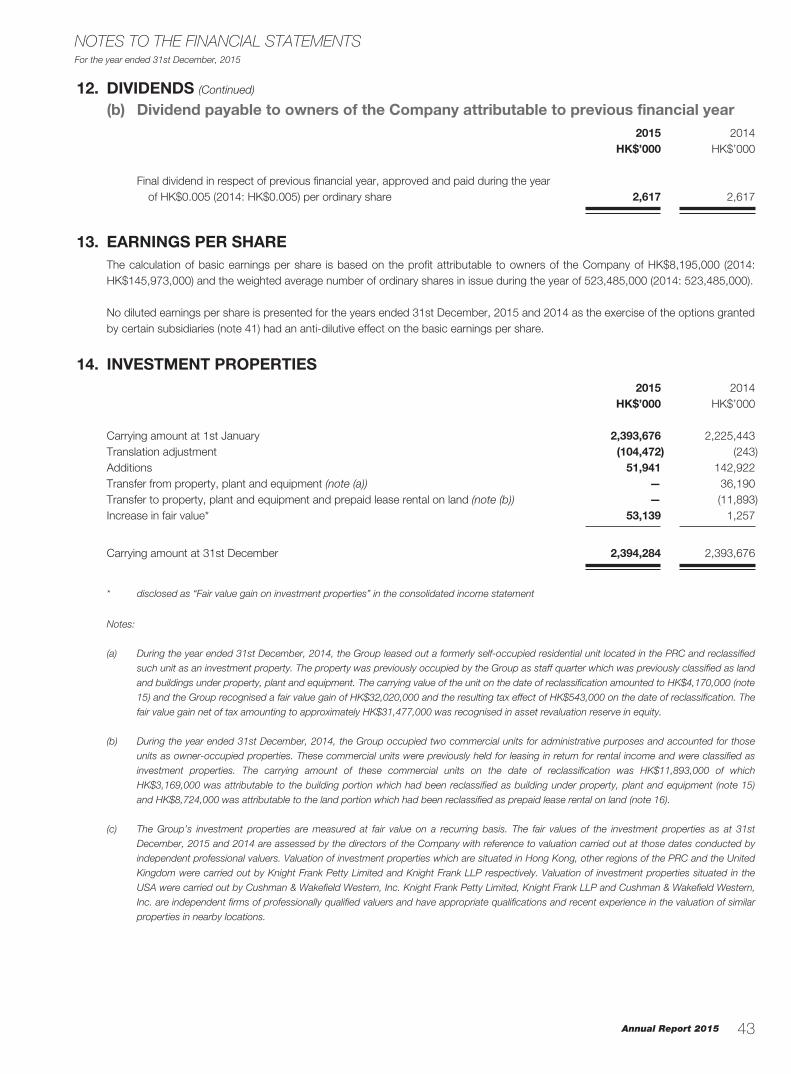
Annual Report 2015
For the year ended 31st December, 2015
43
NOTES TO THE FINANCIAL STATEMENTS
12. DIVIDENDS (Continued)
(b) Dividend payable to owners of the Company attributable to previous financial year2015 2014
HK$’000 HK$’000
Final dividend in respect of previous financial year, approved and paid during the year of HK$0.005 (2014: HK$0.005) per ordinary share 2,617 2,617
13. EARNINGS PER SHAREThe calculation of basic earnings per share is based on the profit attributable to owners of the Company of HK$8,195,000 (2014: HK$145,973,000) and the weighted average number of ordinary shares in issue during the year of 523,485,000 (2014: 523,485,000).
No diluted earnings per share is presented for the years ended 31st December, 2015 and 2014 as the exercise of the options granted by certain subsidiaries (note 41) had an anti-dilutive effect on the basic earnings per share.
14. INVESTMENT PROPERTIES2015 2014
HK$’000 HK$’000
Carrying amount at 1st January 2,393,676 2,225,443Translation adjustment (104,472) (243)Additions 51,941 142,922Transfer from property, plant and equipment (note (a)) — 36,190Transfer to property, plant and equipment and prepaid lease rental on land (note (b)) — (11,893)Increase in fair value* 53,139 1,257
Carrying amount at 31st December 2,394,284 2,393,676
* disclosed as “Fair value gain on investment properties” in the consolidated income statement
Notes:
(a) During the year ended 31st December, 2014, the Group leased out a formerly self-occupied residential unit located in the PRC and reclassified
such unit as an investment property. The property was previously occupied by the Group as staff quarter which was previously classified as land
and buildings under property, plant and equipment. The carrying value of the unit on the date of reclassification amounted to HK$4,170,000 (note
15) and the Group recognised a fair value gain of HK$32,020,000 and the resulting tax effect of HK$543,000 on the date of reclassification. The
fair value gain net of tax amounting to approximately HK$31,477,000 was recognised in asset revaluation reserve in equity.
(b) During the year ended 31st December, 2014, the Group occupied two commercial units for administrative purposes and accounted for those
units as owner-occupied properties. These commercial units were previously held for leasing in return for rental income and were classified as
investment properties. The carrying amount of these commercial units on the date of reclassification was HK$11,893,000 of which
HK$3,169,000 was attributable to the building portion which had been reclassified as building under property, plant and equipment (note 15)
and HK$8,724,000 was attributable to the land portion which had been reclassified as prepaid lease rental on land (note 16).
(c) The Group’s investment properties are measured at fair value on a recurring basis. The fair values of the investment properties as at 31st
December, 2015 and 2014 are assessed by the directors of the Company with reference to valuation carried out at those dates conducted by
independent professional valuers. Valuation of investment properties which are situated in Hong Kong, other regions of the PRC and the United
Kingdom were carried out by Knight Frank Petty Limited and Knight Frank LLP respectively. Valuation of investment properties situated in the
USA were carried out by Cushman & Wakefield Western, Inc. Knight Frank Petty Limited, Knight Frank LLP and Cushman & Wakefield Western,
Inc. are independent firms of professionally qualified valuers and have appropriate qualifications and recent experience in the valuation of similar
properties in nearby locations.
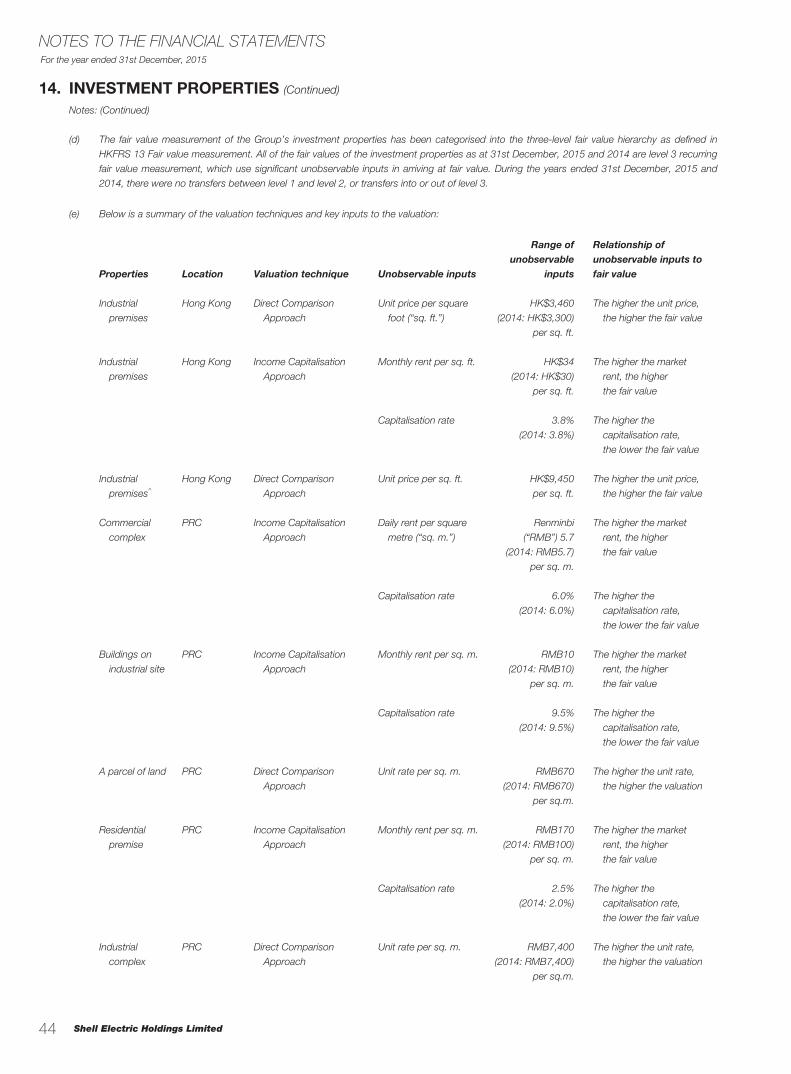
Shell Electric Holdings Limited
For the year ended 31st December, 2015
44
NOTES TO THE FINANCIAL STATEMENTS
14. INVESTMENT PROPERTIES (Continued)
Notes: (Continued)
(d) The fair value measurement of the Group’s investment properties has been categorised into the three-level fair value hierarchy as defined in
HKFRS 13 Fair value measurement. All of the fair values of the investment properties as at 31st December, 2015 and 2014 are level 3 recurring
fair value measurement, which use significant unobservable inputs in arriving at fair value. During the years ended 31st December, 2015 and
2014, there were no transfers between level 1 and level 2, or transfers into or out of level 3.
(e) Below is a summary of the valuation techniques and key inputs to the valuation:
Properties Location Valuation technique Unobservable inputs
Range of unobservable
inputs
Relationship of unobservable inputs to fair value
Industrial
premises
Hong Kong Direct Comparison
Approach
Unit price per square
foot (“sq. ft.”)
HK$3,460
(2014: HK$3,300)
per sq. ft.
The higher the unit price,
the higher the fair value
Industrial
premises
Hong Kong Income Capitalisation
Approach
Monthly rent per sq. ft. HK$34
(2014: HK$30)
per sq. ft.
The higher the market
rent, the higher
the fair value
Capitalisation rate 3.8%
(2014: 3.8%)
The higher the
capitalisation rate,
the lower the fair value
Industrial
premises^
Hong Kong Direct Comparison
Approach
Unit price per sq. ft. HK$9,450
per sq. ft.
The higher the unit price,
the higher the fair value
Commercial
complex
PRC Income Capitalisation
Approach
Daily rent per square
metre (“sq. m.”)
Renminbi
(“RMB”) 5.7
(2014: RMB5.7)
per sq. m.
The higher the market
rent, the higher
the fair value
Capitalisation rate 6.0%
(2014: 6.0%)
The higher the
capitalisation rate,
the lower the fair value
Buildings on
industrial site
PRC Income Capitalisation
Approach
Monthly rent per sq. m. RMB10
(2014: RMB10)
per sq. m.
The higher the market
rent, the higher
the fair value
Capitalisation rate 9.5%
(2014: 9.5%)
The higher the
capitalisation rate,
the lower the fair value
A parcel of land PRC Direct Comparison
Approach
Unit rate per sq. m. RMB670
(2014: RMB670)
per sq.m.
The higher the unit rate,
the higher the valuation
Residential
premise
PRC Income Capitalisation
Approach
Monthly rent per sq. m. RMB170
(2014: RMB100)
per sq. m.
The higher the market
rent, the higher
the fair value
Capitalisation rate 2.5%
(2014: 2.0%)
The higher the
capitalisation rate,
the lower the fair value
Industrial
complex
PRC Direct Comparison
Approach
Unit rate per sq. m. RMB7,400
(2014: RMB7,400)
per sq.m.
The higher the unit rate,
the higher the valuation

Annual Report 2015
For the year ended 31st December, 2015
45
NOTES TO THE FINANCIAL STATEMENTS
Properties Location Valuation technique Unobservable inputs
Range of unobservable
inputs
Relationship of unobservable inputs to fair value
Residential
premise
UK Sales Comparison
Approach
Discount/Premium on
quality of property
-16.0% to 3.0%
(2014: 5.0% to
17.0%)
The higher the discount/
premium, the lower/higher
the fair value
Commercial
complex
USA 2015 and 2014:
Income Capitalisation
Approach
— Discounted
cash flow method
Monthly rent per sq. ft. United States
Dollars (“US$”)
0.85 to US$1.20
(2014: US$0.70 to
US$1.0) per sq. ft.
The higher the market
rent, the higher the fair
value
Terminal capitalisation
rate
7.5% to 8.0%
(2014: 7.5% to
8.0%)
The higher the terminal
capitalisation rate,
the lower the fair value
Internal rate of return 9.5%
(2014: 9.5%)
The higher the internal
rate of return,
the lower the fair value
2014: Sales Comparison
Approach
Discount on quality
of property
37.0% to 47.0% The higher the discount
the lower the fair value
^ newly acquired during 2015
The fair value measurement is based on the highest and best use of the investment properties, which does not differ from their actual use.
Under Sales Comparison Approach or Direct Comparison Approach, the fair value is assessed by reference to market comparable transactions
available in the relevant market.
Under Income Capitalisation Approach, the fair value is assessed on the basis of capitalisation of net income.
Under Income Capitalisation Approach — Discounted cash flow method, the fair value is assessed by discounting cash flow series associated
with the properties using risk-adjusted discounted rates.
The investment properties are leased to third parties under operating leases to earn rental income, further details of which are included in note 47.
In securing the bank borrowings, the Group has undertaken, under a negative pledge clause, to obtain prior written consent from the relevant banks regarding the transfer, sales or disposal of certain investment properties with carrying amount of HK$437,650,000 (2014: HK$402,100,000) as at 31st December, 2015.
Certain investment properties of the Group are pledged as further detailed in note 46.
14. INVESTMENT PROPERTIES (Continued)
Notes: (Continued)
(e) (Continued)
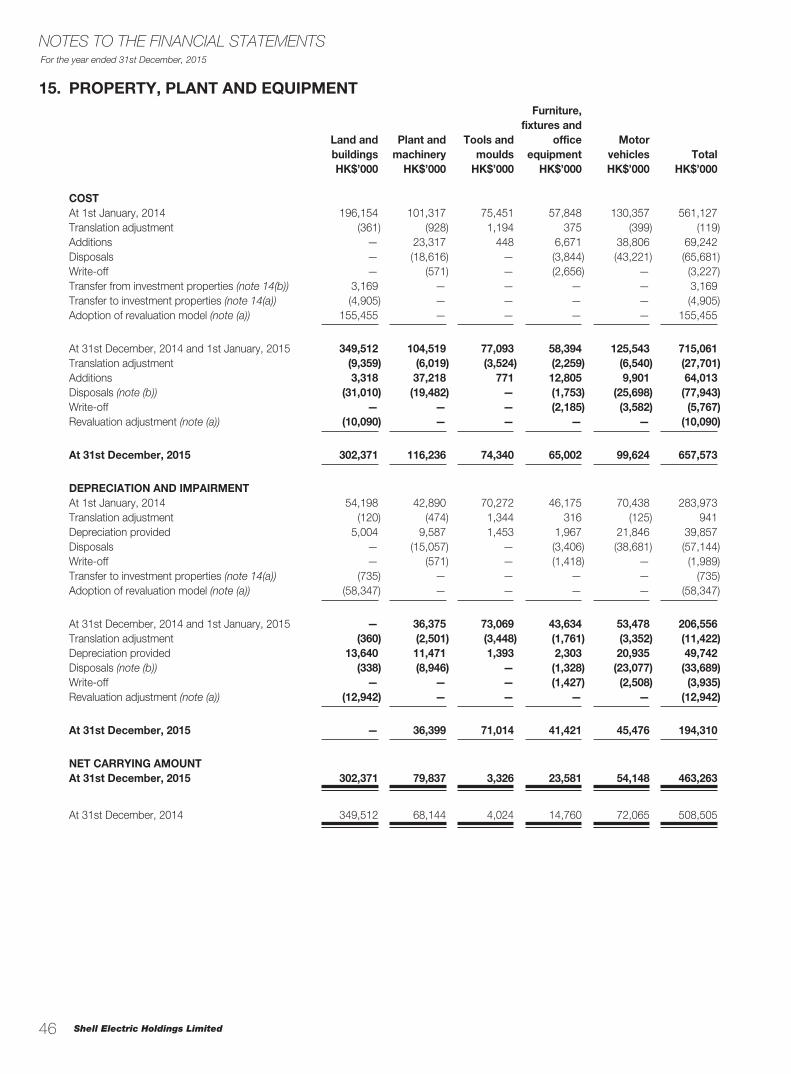
Shell Electric Holdings Limited
For the year ended 31st December, 2015
46
NOTES TO THE FINANCIAL STATEMENTS
15. PROPERTY, PLANT AND EQUIPMENT
Land and buildings
Plant and machinery
Tools and moulds
Furniture, fixtures and
office equipment
Motor vehicles Total
HK$’000 HK$’000 HK$’000 HK$’000 HK$’000 HK$’000
COSTAt 1st January, 2014 196,154 101,317 75,451 57,848 130,357 561,127Translation adjustment (361) (928) 1,194 375 (399) (119)Additions — 23,317 448 6,671 38,806 69,242Disposals — (18,616) — (3,844) (43,221) (65,681)Write-off — (571) — (2,656) — (3,227)Transfer from investment properties (note 14(b)) 3,169 — — — — 3,169Transfer to investment properties (note 14(a)) (4,905) — — — — (4,905)Adoption of revaluation model (note (a)) 155,455 — — — — 155,455
At 31st December, 2014 and 1st January, 2015 349,512 104,519 77,093 58,394 125,543 715,061Translation adjustment (9,359) (6,019) (3,524) (2,259) (6,540) (27,701)Additions 3,318 37,218 771 12,805 9,901 64,013Disposals (note (b)) (31,010) (19,482) — (1,753) (25,698) (77,943)Write-off — — — (2,185) (3,582) (5,767)Revaluation adjustment (note (a)) (10,090) — — — — (10,090)
At 31st December, 2015 302,371 116,236 74,340 65,002 99,624 657,573
DEPRECIATION AND IMPAIRMENTAt 1st January, 2014 54,198 42,890 70,272 46,175 70,438 283,973Translation adjustment (120) (474) 1,344 316 (125) 941Depreciation provided 5,004 9,587 1,453 1,967 21,846 39,857Disposals — (15,057) — (3,406) (38,681) (57,144)Write-off — (571) — (1,418) — (1,989)Transfer to investment properties (note 14(a)) (735) — — — — (735)Adoption of revaluation model (note (a)) (58,347) — — — — (58,347)
At 31st December, 2014 and 1st January, 2015 — 36,375 73,069 43,634 53,478 206,556Translation adjustment (360) (2,501) (3,448) (1,761) (3,352) (11,422)Depreciation provided 13,640 11,471 1,393 2,303 20,935 49,742Disposals (note (b)) (338) (8,946) — (1,328) (23,077) (33,689)Write-off — — — (1,427) (2,508) (3,935)Revaluation adjustment (note (a)) (12,942) — — — — (12,942)
At 31st December, 2015 — 36,399 71,014 41,421 45,476 194,310
NET CARRYING AMOUNTAt 31st December, 2015 302,371 79,837 3,326 23,581 54,148 463,263
At 31st December, 2014 349,512 68,144 4,024 14,760 72,065 508,505
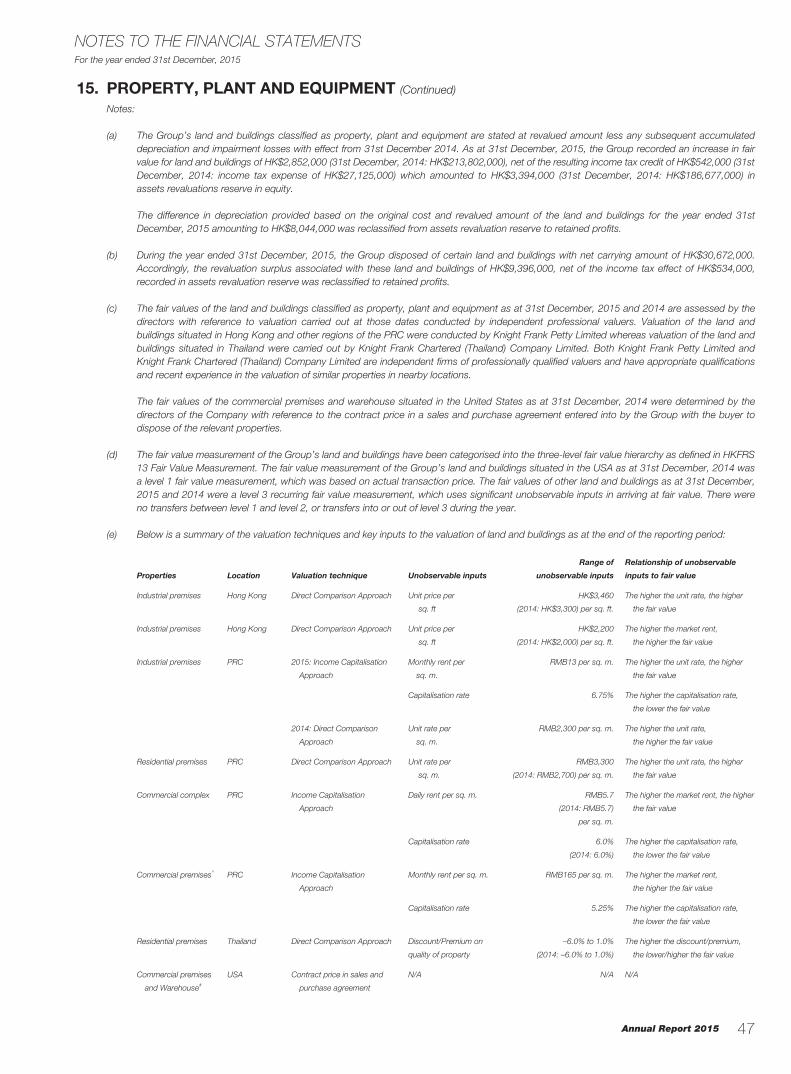
Annual Report 2015
For the year ended 31st December, 2015
47
NOTES TO THE FINANCIAL STATEMENTS
15. PROPERTY, PLANT AND EQUIPMENT (Continued)
Notes:
(a) The Group’s land and buildings classified as property, plant and equipment are stated at revalued amount less any subsequent accumulated depreciation and impairment losses with effect from 31st December 2014. As at 31st December, 2015, the Group recorded an increase in fair value for land and buildings of HK$2,852,000 (31st December, 2014: HK$213,802,000), net of the resulting income tax credit of HK$542,000 (31st December, 2014: income tax expense of HK$27,125,000) which amounted to HK$3,394,000 (31st December, 2014: HK$186,677,000) in assets revaluations reserve in equity.
The difference in depreciation provided based on the original cost and revalued amount of the land and buildings for the year ended 31st December, 2015 amounting to HK$8,044,000 was reclassified from assets revaluation reserve to retained profits.
(b) During the year ended 31st December, 2015, the Group disposed of certain land and buildings with net carrying amount of HK$30,672,000. Accordingly, the revaluation surplus associated with these land and buildings of HK$9,396,000, net of the income tax effect of HK$534,000, recorded in assets revaluation reserve was reclassified to retained profits.
(c) The fair values of the land and buildings classified as property, plant and equipment as at 31st December, 2015 and 2014 are assessed by the directors with reference to valuation carried out at those dates conducted by independent professional valuers. Valuation of the land and buildings situated in Hong Kong and other regions of the PRC were conducted by Knight Frank Petty Limited whereas valuation of the land and buildings situated in Thailand were carried out by Knight Frank Chartered (Thailand) Company Limited. Both Knight Frank Petty Limited and Knight Frank Chartered (Thailand) Company Limited are independent firms of professionally qualified valuers and have appropriate qualifications and recent experience in the valuation of similar properties in nearby locations.
The fair values of the commercial premises and warehouse situated in the United States as at 31st December, 2014 were determined by the directors of the Company with reference to the contract price in a sales and purchase agreement entered into by the Group with the buyer to dispose of the relevant properties.
(d) The fair value measurement of the Group’s land and buildings have been categorised into the three-level fair value hierarchy as defined in HKFRS 13 Fair Value Measurement. The fair value measurement of the Group’s land and buildings situated in the USA as at 31st December, 2014 was a level 1 fair value measurement, which was based on actual transaction price. The fair values of other land and buildings as at 31st December, 2015 and 2014 were a level 3 recurring fair value measurement, which uses significant unobservable inputs in arriving at fair value. There were no transfers between level 1 and level 2, or transfers into or out of level 3 during the year.
(e) Below is a summary of the valuation techniques and key inputs to the valuation of land and buildings as at the end of the reporting period:
Properties Location Valuation technique Unobservable inputs
Range of
unobservable inputs
Relationship of unobservable
inputs to fair value
Industrial premises Hong Kong Direct Comparison Approach Unit price per
sq. ft
HK$3,460
(2014: HK$3,300) per sq. ft.
The higher the unit rate, the higher
the fair value
Industrial premises Hong Kong Direct Comparison Approach Unit price per
sq. ft
HK$2,200
(2014: HK$2,000) per sq. ft.
The higher the market rent,
the higher the fair value
Industrial premises PRC 2015: Income Capitalisation
Approach
Monthly rent per
sq. m.
RMB13 per sq. m. The higher the unit rate, the higher
the fair value
Capitalisation rate 6.75% The higher the capitalisation rate,
the lower the fair value
2014: Direct Comparison
Approach
Unit rate per
sq. m.
RMB2,300 per sq. m. The higher the unit rate,
the higher the fair value
Residential premises PRC Direct Comparison Approach Unit rate per
sq. m.
RMB3,300
(2014: RMB2,700) per sq. m.
The higher the unit rate, the higher
the fair value
Commercial complex PRC Income Capitalisation
Approach
Daily rent per sq. m. RMB5.7
(2014: RMB5.7)
per sq. m.
The higher the market rent, the higher
the fair value
Capitalisation rate 6.0%
(2014: 6.0%)
The higher the capitalisation rate,
the lower the fair value
Commercial premises^ PRC Income Capitalisation
Approach
Monthly rent per sq. m. RMB165 per sq. m. The higher the market rent,
the higher the fair value
Capitalisation rate 5.25% The higher the capitalisation rate,
the lower the fair value
Residential premises Thailand Direct Comparison Approach Discount/Premium on
quality of property
–6.0% to 1.0%
(2014: –6.0% to 1.0%)
The higher the discount/premium,
the lower/higher the fair value
Commercial premises
and Warehouse#
USA Contract price in sales and
purchase agreement
N/A N/A N/A

Shell Electric Holdings Limited
For the year ended 31st December, 2015
48
NOTES TO THE FINANCIAL STATEMENTS
15. PROPERTY, PLANT AND EQUIPMENT (Continued)
Notes: (Continued)
(e) (Continued)
^ The commercial premises were newly acquired during 2015# The commercial premises and warehouse were disposed of during 2015
The fair value measurement is based on the highest and best use of the properties, which does not differ from their actual use.
Under Sales Comparison Approach or Direct Comparison Approach, the fair value is assessed by reference to market comparable transactions
available in the relevant market.
Under Income Capitalisation Approach, the fair value is assessed on the basis of capitalisation of net income.
Had the revalued properties been measured on cost model, their net carrying amount would have been HK$108,453,000 (2014:
HK$135,710,000).
In securing the bank borrowings 31st December, 2015, the Group undertook, under a negative pledge clause, to obtain prior written consent from the bank regarding the transfer, sales or disposal of certain property, plant and equipment with carrying amount of HK$237,832,000 (2014: HK$256,449,000) as at 31st December, 2015.
Certain property, plant and equipment of the Group are pledged as further details in note 46.
16. PREPAID LEASE RENTAL ON LAND2015 2014
HK$’000 HK$’000
Carrying amount at 1st January 18,301 9,913Translation adjustment (1,038) (34)Addition 9,071 —Amortisation charged (771) (302)Transfer from investment properties (note 14(b)) — 8,724
Carrying amount at 31st December 25,563 18,301
Analysed into: Non-current portion included in non-current assets 24,806 17,704 Current portion included in current assets 757 597
25,563 18,301
Certain of the Group’s interest in prepaid lease rental on land are pledged as further details in note 46.
17. GOODWILL2015 2014
HK$’000 HK$’000
Carrying amount at 1st January and 31st December 4,393 4,393
The amount of goodwill as at the end of each reporting period is allocated to the cash-generating unit of design and trading of semiconductors and electronic components within the segment of “Electrical appliances and electronic components” and is tested for impairment, together with other relevant assets by the management by estimating the recoverable amount of this cash-generating unit based on value-in-use calculations. The calculations use cash flow projections based on the financial budgets approved by the management. The period covered by the financial budgets is 3 (2014: 4) years. Cash flows beyond the budget period are extrapolated using an estimated growth rate of 3%. Based on the results of the impairment testing, management determines that there is no impairment in respect of this cash-generating unit.
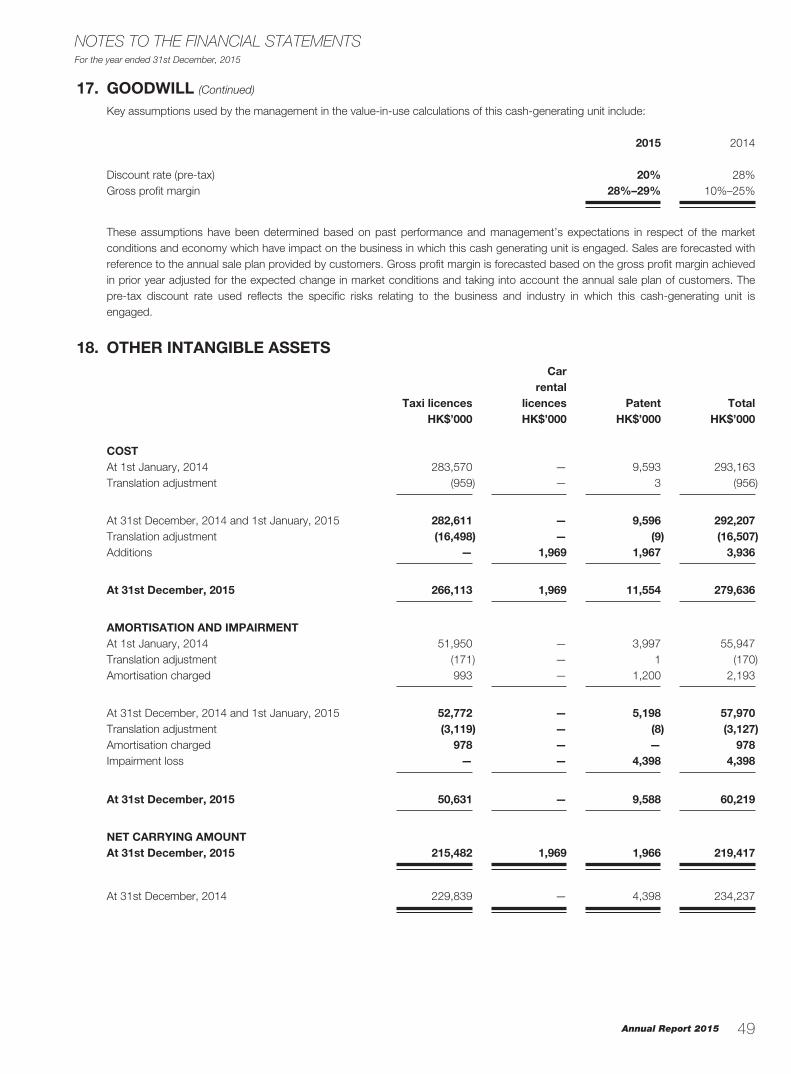
Annual Report 2015
For the year ended 31st December, 2015
49
NOTES TO THE FINANCIAL STATEMENTS
17. GOODWILL (Continued)
Key assumptions used by the management in the value-in-use calculations of this cash-generating unit include:
2015 2014
Discount rate (pre-tax) 20% 28%Gross profit margin 28%–29% 10%–25%
These assumptions have been determined based on past performance and management’s expectations in respect of the market conditions and economy which have impact on the business in which this cash generating unit is engaged. Sales are forecasted with reference to the annual sale plan provided by customers. Gross profit margin is forecasted based on the gross profit margin achieved in prior year adjusted for the expected change in market conditions and taking into account the annual sale plan of customers. The pre-tax discount rate used reflects the specific risks relating to the business and industry in which this cash-generating unit is engaged.
18. OTHER INTANGIBLE ASSETS
Taxi licences
Carrental
licences Patent TotalHK$’000 HK$’000 HK$’000 HK$’000
COSTAt 1st January, 2014 283,570 — 9,593 293,163Translation adjustment (959) — 3 (956)
At 31st December, 2014 and 1st January, 2015 282,611 — 9,596 292,207Translation adjustment (16,498) — (9) (16,507)Additions — 1,969 1,967 3,936
At 31st December, 2015 266,113 1,969 11,554 279,636
AMORTISATION AND IMPAIRMENTAt 1st January, 2014 51,950 — 3,997 55,947Translation adjustment (171) — 1 (170)Amortisation charged 993 — 1,200 2,193
At 31st December, 2014 and 1st January, 2015 52,772 — 5,198 57,970Translation adjustment (3,119) — (8) (3,127)Amortisation charged 978 — — 978Impairment loss — — 4,398 4,398
At 31st December, 2015 50,631 — 9,588 60,219
NET CARRYING AMOUNTAt 31st December, 2015 215,482 1,969 1,966 219,417
At 31st December, 2014 229,839 — 4,398 234,237
Shell Electric Holdings Limited
For the year ended 31st December, 2015
50
NOTES TO THE FINANCIAL STATEMENTS
18. OTHER INTANGIBLE ASSETS (Continued)
Taxi LicencesDuring the year ended 31st December, 2012, the PRC government granted to the Group 20 taxi licences for free (the “Free Taxi Licences”), which entitle the licence holders to operate the taxi vehicles during a fixed period of time in a day for a five-year period up to 1st March, 2017. During the year ended 31st December, 2013, the PRC government granted another 15 Free Taxi Licences to the Group which entitle the licence holders to operate the taxi vehicles during the specified time period in a day for a five-year period up to 1st August, 2018. The useful life of these Free Taxi Licences is therefore 5 years.
The Group recognised these Free Taxi Licences as intangible assets with a corresponding amount recognised as deferred government grants in accordance with the accounting policies set out in note 3.30. The fair value of the Free Taxi Licences on initial recognition amounting to HK$4,987,000 in aggregate was determined based on value-in-use calculations. Free Taxi Licences are subsequently measured at cost less amortisation and impairment and their carrying amount as at 31st December, 2015 was HK$1,755,000 (2014: HK$2,862,000).
In the opinion of the directors, the taxi licences except for the Free Taxi Licences (“Other Taxi Licences”), have indefinite useful life as there is no foreseeable limit on the period of time on which Other Taxi Licences are expected to generate cash flows.
Other Taxi Licences as at 31st December, 2015 are tested for impairment by the management by estimating its recoverable amount based on value-in-use calculations. The calculations use cash flow projections based on the financial budgets approved by the management. The financial budgets prepared for the year ended 31st December, 2015 are up to year 2033 as the application for extending the business period of the subsidiary engaging in taxi rental operation by 22 years to year 2033 has been approved by the PRC government on 27th September, 2011.
Other key assumptions used by management in the value-in-use calculations of Other Taxi Licences have been determined based on past performance and its expectations for the market development. Key assumptions underlying the cash flow projections include (i) the number of taxi licences held by the Group remains the same throughout the forecast period, and (ii) taxi rental income is determined based on the fee income to be received pursuant to the existing rental agreements, adjusted by the expected market development. The pre-tax discount rate applied to the cash flow projections is 13.0% (2014: 12.6%) which reflects specific risks relating to the taxi rental operation in the PRC. Based on the result of the impairment testing, management determines that there is no impairment in respect of the taxi licences (2014: nil).
Car Rental LicencesDuring the year ended 31st December, 2015, the Group acquired 22 car rental licences (“Car Rental Licences”) at aggregate consideration of approximately HK$1,969,000.
The Car Rental Licences entitle the licence holders to operate car rental business in Guangzhou, the PRC under specific rules and regulations for an unspecified period. From the rules and regulations made available to the Group, the directors are of the opinion that the Car Rental Licences carry an indefinite useful life.
PatentThe Group’s patent is utilised by the cash generating unit of trading of computer software and the cash-generating unit of design and trading of semiconductors and electronic components.
An impairment loss of HK$4,398,000 was recognised for patent in the current year as those patent is no longer being utilised in production due to the emergence of new products and technology.
During the year, the Group disposed of certain patent with nil carrying amount for a cash consideration of HK$8,394,000, resulting in a disposal gain amounting to HK$8,394,000.
Annual Report 2015
For the year ended 31st December, 2015
51
NOTES TO THE FINANCIAL STATEMENTS
19. INTERESTS IN ASSOCIATES2015 2014
HK$’000 HK$’000
Share of net assets 160,077 160,156
Details of the Group’s associates as at 31st December, 2015 are set out in note 56.
The following illustrates the summarised financial information in relation to the Group’s associates as at 31st December, 2015 with comparative information extracted from their management accounts which have been adjusted to ensure consistency in accounting policies adopted by the Group:
2015 2014HK$’000 HK$’000
Year ended 31st DecemberRevenue 97,053 98,476
Profit/(Loss) for the year 43,489 (15,119)Other comprehensive income (40,662) (2,363)
Total comprehensive income 2,827 (17,482)
Dividend received from associates — 10,370
As at 31st DecemberCurrent assets 51,850 6,296Non-current assets 1,412,567 1,490,328Current liabilities (121,359) (140,600)Non-current liabilities (542,672) (555,242)
Net assets 800,386 800,782
Carrying amount of the Group’s interest in the net assets of the associates 160,077 160,156
20. INTERESTS IN JOINT VENTURES2015 2014
HK$’000 HK$’000
Share of net assets 4,361 7,242Goodwill on acquisition 390 390
4,751 7,632
The contractual arrangement in relation to the Group’s joint arrangements provide the Group with only the rights to the net assets of the joint arrangements, with the rights to the assets and obligation for the liabilities of the joint arrangements resting primarily with the joint arrangements. Pursuant to HKFRS 11 Joint Arrangements, these joint arrangements are classified as joint ventures and have been accounted for in the consolidated financial statements using the equity method.
Shell Electric Holdings Limited
For the year ended 31st December, 2015
52
NOTES TO THE FINANCIAL STATEMENTS
20. INTERESTS IN JOINT VENTURES (Continued)
Details of the Group’s principal joint ventures as at 31st December, 2015 are set out in note 57.
The following table illustrates the aggregate financial information of the Group’s joint ventures that are not individually material:
2015 2014HK$’000 HK$’000
Year ended 31st DecemberShare of the joint ventures’ profit for the year 987 2,371Share of the joint ventures’ other comprehensive income for the year 101 (127)
Share of the joint ventures’ total comprehensive income for the year 1,088 2,244
2015 2014HK$’000 HK$’000
As at 31st DecemberAggregate carrying amount of the Group’s interests in joint ventures 4,361 7,242
21. AVAILABLE-FOR-SALE FINANCIAL ASSETS2015 2014
HK$’000 HK$’000
Unlisted investments: Club debentures (note) 380 3,300
Equity securities, listed in Hong Kong, at fair value 53,252 63,967Equity securities, unlisted in the PRC, at fair value 145,619 150,718Unlisted investment funds, at fair value — 9,379Debt securities listed outside Hong Kong, at fair value 24,319 —
223,570 227,364
Note: Club debentures are stated at cost less impairment.
During the year ended 31st December, 2015, the Group disposed of club debenture with carrying amount of HK$2,920,000 at consideration of HK$8,780,000 and recognised a gain HK$5,860,000. In addition, the Group disposed of certain available-for-sale financial assets which are measured at fair value, resulting in reclassification adjustment amounting to HK$1,603,000 from other comprehensive income to profit or loss.
During the year ended 31st December, 2014, there was significant decline in the market value of certain equity instruments. The directors considered that such decline indicated that the listed equity instruments had been impaired and an impairment loss of HK$37,531,000, which was reclassified from other comprehensive income, had been recognised in the consolidated income statement in prior year.
The Group does not intend to dispose of these investments in the near future.
22. OTHER ASSETSOther assets represent antiques held by the Group for long-term investment purposes. Antiques are reviewed for impairment by the management with reference to the valuation report issued by an independent professional valuer. In the opinion of the directors, the antiques worth at least their carrying value at the end of the reporting period.
Annual Report 2015
For the year ended 31st December, 2015
53
NOTES TO THE FINANCIAL STATEMENTS
23. LOANS RECEIVABLE2015 2014
HK$’000 HK$’000
Loans receivable from: Investees (note (a)) 17,286 19,205 Associate (note (b)) 48,680 48,035 Others (note (c)) 36,810 42,813
102,776 110,053Less: Impairment (notes (a) and (c)) (53,466) (56,732)
49,310 53,321
Analysed into: Amounts receivable in more than one year included in non-current assets 48,680 48,035 Amounts receivable within one year included in current assets 630 5,286
49,310 53,321
Notes:
(a) The loans to investees are unsecured, interest-bearing at 4.10%–5.00% (2014: 3.00%–5.00%) per annum and repayable within one year. Having
considered the financial position of the borrowers, management assessed that the entire loans at the end of the reporting period cannot be
recovered and accordingly, impairment provision for the loans of HK$17,286,000 has been made as at 31st December, 2015 (2014:
HK$19,205,000).
(b) The loan to an associate is unsecured and interest-free. The amortised cost of the loan at the end of the reporting period is calculated at the
present value of the expected settlement from the associate in accordance with the business plan of the respective associate, discounted at the
rate of return of similar financial assets. The loan is expected not to be repayable within twelve months from the end of the reporting period and
accordingly, it is classified as non-current assets. Having considered the financial position of the associate, and its repayment history, the
management assessed that there is no indication of impairment in respect of this loan.
(c) The balance is unsecured, interest-bearing at 5.00%–18.00% (2014: 5.00%–18.00%) per annum and repayable on demand except for an
amount of HK$105,000 as at 31st December, 2014, which was unsecured, interest-free and repayable on demand. Having considered the
financial position of the borrowers, management assessed that only a portion of the balances can be recovered and accordingly, impairment
provision for the loan of HK$36,180,000 has been made as at 31st December, 2015 (2014: HK$37,527,000).
24. FINANCE LEASE RECEIVABLESThe Group entered into agreements with a customer for replacing the light tubes of the properties managed by the customer by the LED light tubes produced by the Group. In return, the Group is entitled to monthly income for a period of five years which is arrived at on a pre-determined basis. Under the agreements, the Group is also responsible for free maintenance and replacement of LED light tubes. The agreements constitute finance leases of LED light tubes which have estimated useful life of three years. Accordingly, sales are recognised when the LED light tubes are installed in the properties. Costs related to the sales transactions are recognised in the same period. Sales revenue recognised at the commencement of the leases represents the present value of the minimum lease payments receivable from the customer over the lease period, computed at a market rate of interest. Finance income arising from the finance leases is allocated over the lease period on a systematic basis reflecting a constant periodic return on the Group’s net investment in the finance leases.
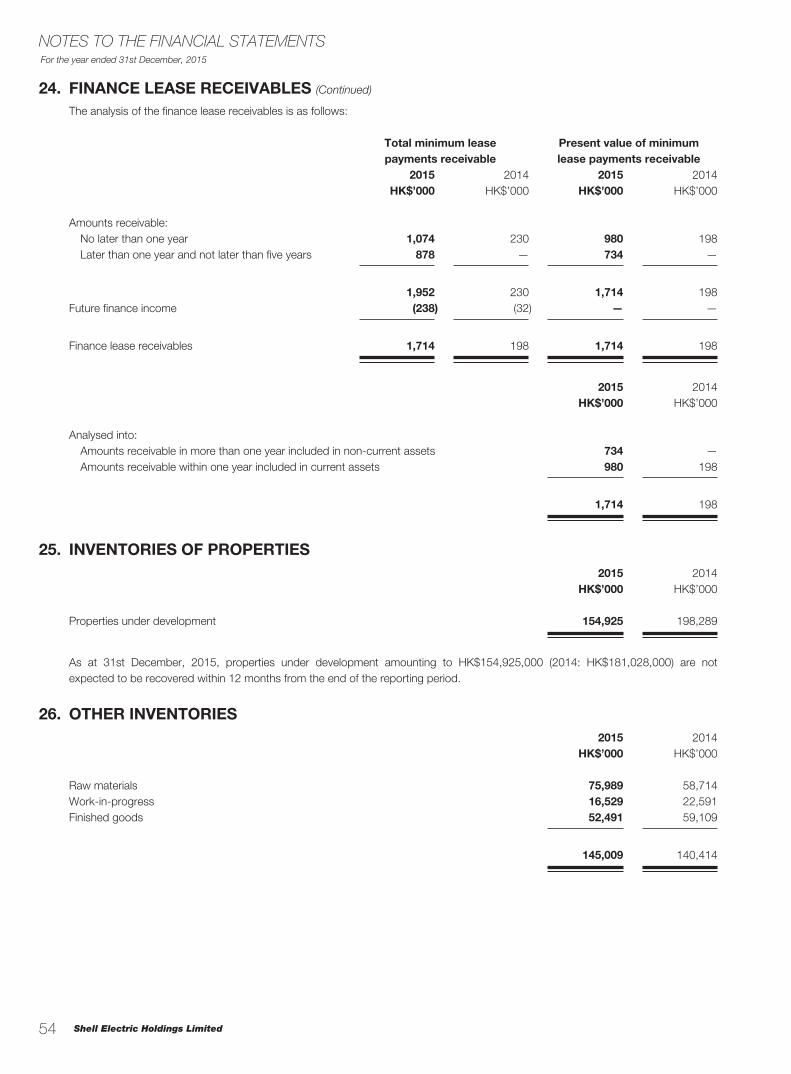
Shell Electric Holdings Limited
For the year ended 31st December, 2015
54
NOTES TO THE FINANCIAL STATEMENTS
24. FINANCE LEASE RECEIVABLES (Continued)
The analysis of the finance lease receivables is as follows:
Total minimum lease payments receivable
Present value of minimum lease payments receivable
2015 2014 2015 2014HK$’000 HK$’000 HK$’000 HK$’000
Amounts receivable: No later than one year 1,074 230 980 198 Later than one year and not later than five years 878 — 734 —
1,952 230 1,714 198Future finance income (238) (32) — —
Finance lease receivables 1,714 198 1,714 198
2015 2014HK$’000 HK$’000
Analysed into: Amounts receivable in more than one year included in non-current assets 734 — Amounts receivable within one year included in current assets 980 198
1,714 198
25. INVENTORIES OF PROPERTIES2015 2014
HK$’000 HK$’000
Properties under development 154,925 198,289
As at 31st December, 2015, properties under development amounting to HK$154,925,000 (2014: HK$181,028,000) are not expected to be recovered within 12 months from the end of the reporting period.
26. OTHER INVENTORIES2015 2014
HK$’000 HK$’000
Raw materials 75,989 58,714Work-in-progress 16,529 22,591Finished goods 52,491 59,109
145,009 140,414
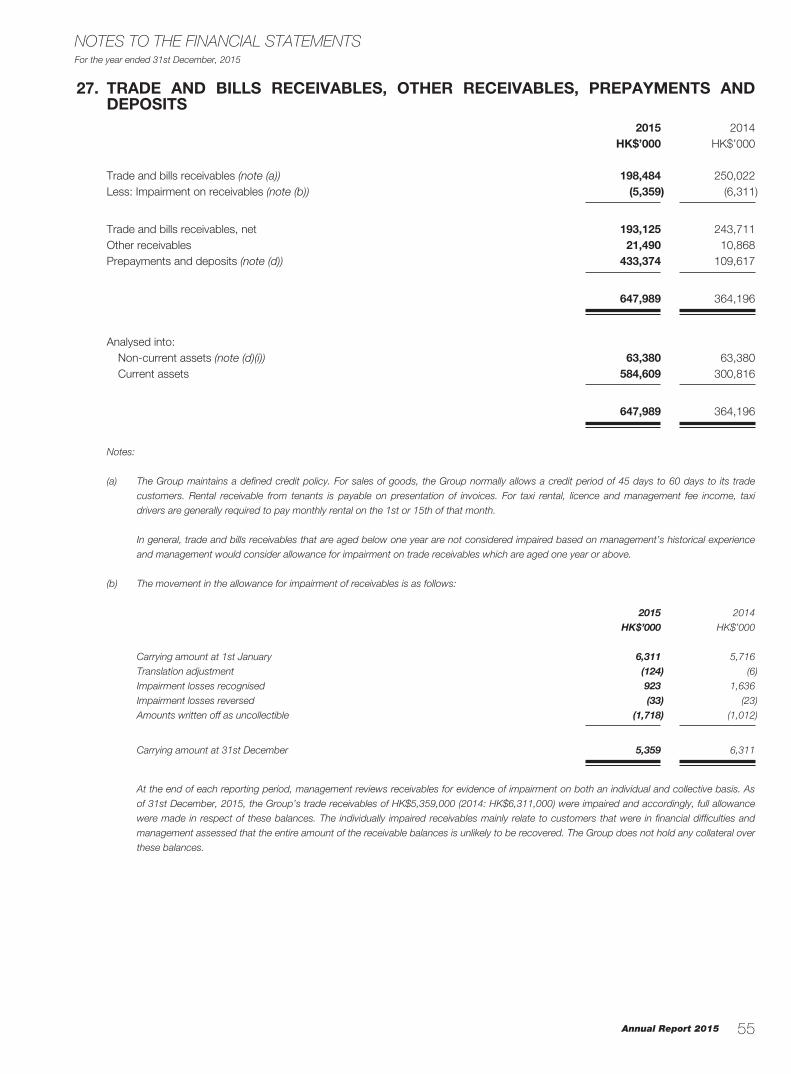
Annual Report 2015
For the year ended 31st December, 2015
55
NOTES TO THE FINANCIAL STATEMENTS
27. TRADE AND BILLS RECEIVABLES, OTHER RECEIVABLES, PREPAYMENTS AND DEPOSITS
2015 2014HK$’000 HK$’000
Trade and bills receivables (note (a)) 198,484 250,022Less: Impairment on receivables (note (b)) (5,359) (6,311)
Trade and bills receivables, net 193,125 243,711Other receivables 21,490 10,868Prepayments and deposits (note (d)) 433,374 109,617
647,989 364,196
Analysed into: Non-current assets (note (d)(i)) 63,380 63,380 Current assets 584,609 300,816
647,989 364,196
Notes:
(a) The Group maintains a defined credit policy. For sales of goods, the Group normally allows a credit period of 45 days to 60 days to its trade
customers. Rental receivable from tenants is payable on presentation of invoices. For taxi rental, licence and management fee income, taxi
drivers are generally required to pay monthly rental on the 1st or 15th of that month.
In general, trade and bills receivables that are aged below one year are not considered impaired based on management’s historical experience
and management would consider allowance for impairment on trade receivables which are aged one year or above.
(b) The movement in the allowance for impairment of receivables is as follows:
2015 2014
HK$’000 HK$’000
Carrying amount at 1st January 6,311 5,716
Translation adjustment (124) (6)
Impairment losses recognised 923 1,636
Impairment losses reversed (33) (23)
Amounts written off as uncollectible (1,718) (1,012)
Carrying amount at 31st December 5,359 6,311
At the end of each reporting period, management reviews receivables for evidence of impairment on both an individual and collective basis. As
of 31st December, 2015, the Group’s trade receivables of HK$5,359,000 (2014: HK$6,311,000) were impaired and accordingly, full allowance
were made in respect of these balances. The individually impaired receivables mainly relate to customers that were in financial difficulties and
management assessed that the entire amount of the receivable balances is unlikely to be recovered. The Group does not hold any collateral over
these balances.
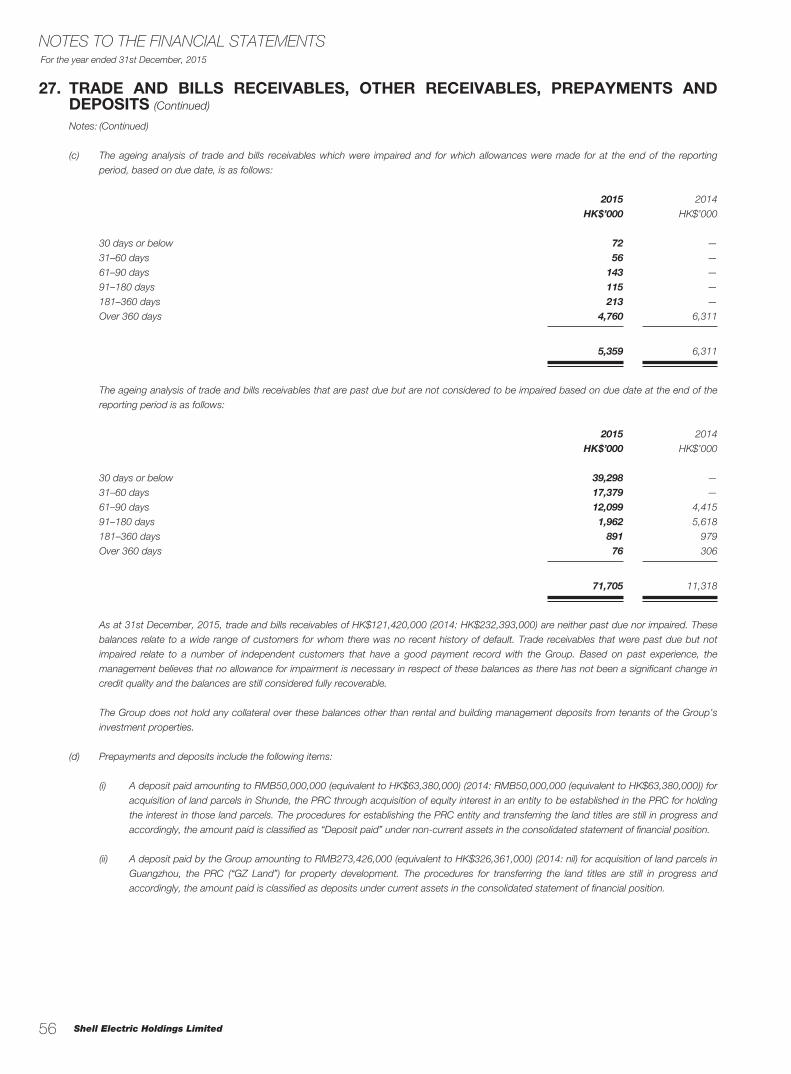
Shell Electric Holdings Limited
For the year ended 31st December, 2015
56
NOTES TO THE FINANCIAL STATEMENTS
27. TRADE AND BILLS RECEIVABLES, OTHER RECEIVABLES, PREPAYMENTS AND DEPOSITS (Continued)
Notes: (Continued)
(c) The ageing analysis of trade and bills receivables which were impaired and for which allowances were made for at the end of the reporting
period, based on due date, is as follows:
2015 2014
HK$’000 HK$’000
30 days or below 72 —
31–60 days 56 —
61–90 days 143 —
91–180 days 115 —
181–360 days 213 —
Over 360 days 4,760 6,311
5,359 6,311
The ageing analysis of trade and bills receivables that are past due but are not considered to be impaired based on due date at the end of the
reporting period is as follows:
2015 2014
HK$’000 HK$’000
30 days or below 39,298 —
31–60 days 17,379 —
61–90 days 12,099 4,415
91–180 days 1,962 5,618
181–360 days 891 979
Over 360 days 76 306
71,705 11,318
As at 31st December, 2015, trade and bills receivables of HK$121,420,000 (2014: HK$232,393,000) are neither past due nor impaired. These
balances relate to a wide range of customers for whom there was no recent history of default. Trade receivables that were past due but not
impaired relate to a number of independent customers that have a good payment record with the Group. Based on past experience, the
management believes that no allowance for impairment is necessary in respect of these balances as there has not been a significant change in
credit quality and the balances are still considered fully recoverable.
The Group does not hold any collateral over these balances other than rental and building management deposits from tenants of the Group’s
investment properties.
(d) Prepayments and deposits include the following items:
(i) A deposit paid amounting to RMB50,000,000 (equivalent to HK$63,380,000) (2014: RMB50,000,000 (equivalent to HK$63,380,000)) for
acquisition of land parcels in Shunde, the PRC through acquisition of equity interest in an entity to be established in the PRC for holding
the interest in those land parcels. The procedures for establishing the PRC entity and transferring the land titles are still in progress and
accordingly, the amount paid is classified as “Deposit paid” under non-current assets in the consolidated statement of financial position.
(ii) A deposit paid by the Group amounting to RMB273,426,000 (equivalent to HK$326,361,000) (2014: nil) for acquisition of land parcels in
Guangzhou, the PRC (“GZ Land”) for property development. The procedures for transferring the land titles are still in progress and
accordingly, the amount paid is classified as deposits under current assets in the consolidated statement of financial position.
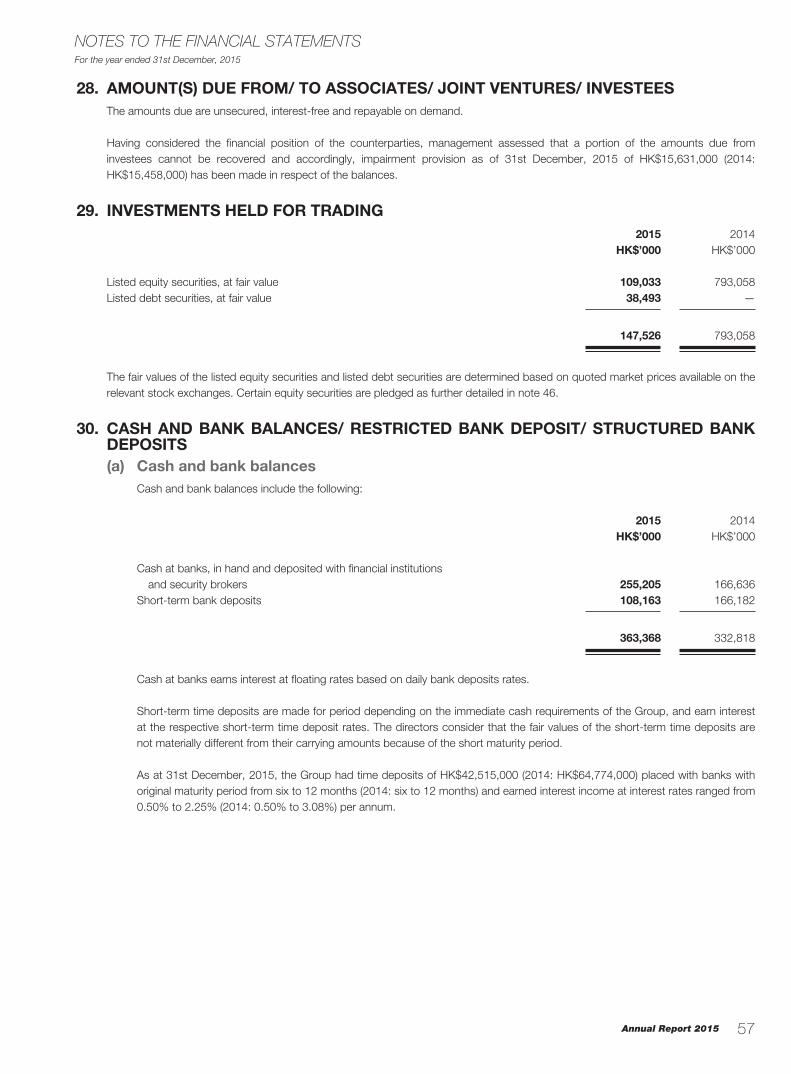
Annual Report 2015
For the year ended 31st December, 2015
57
NOTES TO THE FINANCIAL STATEMENTS
28. AMOUNT(S) DUE FROM/ TO ASSOCIATES/ JOINT VENTURES/ INVESTEESThe amounts due are unsecured, interest-free and repayable on demand.
Having considered the financial position of the counterparties, management assessed that a portion of the amounts due from investees cannot be recovered and accordingly, impairment provision as of 31st December, 2015 of HK$15,631,000 (2014: HK$15,458,000) has been made in respect of the balances.
29. INVESTMENTS HELD FOR TRADING2015 2014
HK$’000 HK$’000
Listed equity securities, at fair value 109,033 793,058Listed debt securities, at fair value 38,493 —
147,526 793,058
The fair values of the listed equity securities and listed debt securities are determined based on quoted market prices available on the relevant stock exchanges. Certain equity securities are pledged as further detailed in note 46.
30. CASH AND BANK BALANCES/ RESTRICTED BANK DEPOSIT/ STRUCTURED BANK DEPOSITS(a) Cash and bank balances
Cash and bank balances include the following:
2015 2014HK$’000 HK$’000
Cash at banks, in hand and deposited with financial institutions and security brokers 255,205 166,636
Short-term bank deposits 108,163 166,182
363,368 332,818
Cash at banks earns interest at floating rates based on daily bank deposits rates.
Short-term time deposits are made for period depending on the immediate cash requirements of the Group, and earn interest at the respective short-term time deposit rates. The directors consider that the fair values of the short-term time deposits are not materially different from their carrying amounts because of the short maturity period.
As at 31st December, 2015, the Group had time deposits of HK$42,515,000 (2014: HK$64,774,000) placed with banks with original maturity period from six to 12 months (2014: six to 12 months) and earned interest income at interest rates ranged from 0.50% to 2.25% (2014: 0.50% to 3.08%) per annum.

Shell Electric Holdings Limited
For the year ended 31st December, 2015
58
NOTES TO THE FINANCIAL STATEMENTS
30. CASH AND BANK BALANCES/RESTRICTED BANK DEPOSIT/STRUCTURED BANK DEPOSITS (Continued)
(b) Restricted bank depositRestricted bank deposit represents a deposit placed in a designated bank account pursuant to the agreements entered by the Group in relation to the acquisition of land and buildings located in Guangzhou, the PRC (the “GZ Property”).
On 30th October, 2013, the Group entered into a sale and purchase agreement (the “Master Agreement”) with an independent third party vendor (the “Vendor”) and a bank to which the GZ Property had been mortgaged (the “Mortgage Bank”) for acquiring the GZ Property at consideration of RMB60,000,000. The GZ Property had been pledged by the Vendor to the Mortgage Bank before the Master Agreement was entered into. Pursuant to the Master Agreement and the supplementary agreements signed on the same date, the Group placed a deposit into the designated bank account operated by the Mortgage Bank which amounted to RMB89,000,000 (equivalent to HK$113,199,000) as at 31st December, 2013. Funds deposited to this designated bank account are subject to monitoring by the Mortgage Bank. Upon completion of transferring the legal title of GZ Property to the Group and settling the mortgage loan by the fund deposited to this designated bank account, the Mortgage Bank released the charge on the GZ Property. The legal title of the GZ Property was transferred to the Group in September 2014. The deposit outstanding in the designated bank account amounted to RMB18,821,000 (equivalent to HK$22,465,000) as at 31st December, 2015 (2014: RMB19,220,000 (equivalent to HK$24,383,000)) which is requested by the Mortgage Bank to secure for the potential liabilities arising from a litigation in relation to the GZ Property (note 49(b)).
(c) Structured bank depositsStructured bank deposits as at 31st December, 2015 amounting to RMB146,700,000, (equivalent to approximately HK$175,101,000) represented bank deposits carrying a minimum interest rate of 1.25% per annum which can be enhanced to a maximum interest rate of 3.10% per annum to be determined with reference to the London Inter-Bank Offered Rate during a pre-determined period of 14 days. The structured bank deposits contained embedded derivatives representing a return which would vary with prevailing market interest rate. The directors of the Company consider that the fair value of the derivatives embedded in these structured bank deposits is minimal and hence, no derivative financial instrument was recognised during the year.
As at 31st December, 2015, cash balances of the Group denominated in RMB amounted to approximately HK$238,582,000 (2014: HK$267,325,000). RMB is not freely convertible into other currencies.
31. TRADE AND OTHER PAYABLES2015 2014
HK$’000 HK$’000
Trade payables 120,662 87,948Temporary receipts (note (a)) 145,446 151,195Other payables and accruals 172,644 204,247Deposits received and receipt in advance (note (b)) 61,692 43,665
500,444 487,055
Notes:
(a) Balance as at 31st December, 2015 included a temporary receipt of HK$124,936,000 (2014: HK$124,936,000) received from a third party in
relation to a proposed disposal of equity interest in a subsidiary of the Company. The transaction is subject to further negotiation with the third
party at the end of the reporting period.
(b) Balance as at 31st December, 2015 included an amount of HK$23,900,000 received from a third party in relation to a proposed disposal of land
parcels. Further details of the transaction are set out in note 49(d).
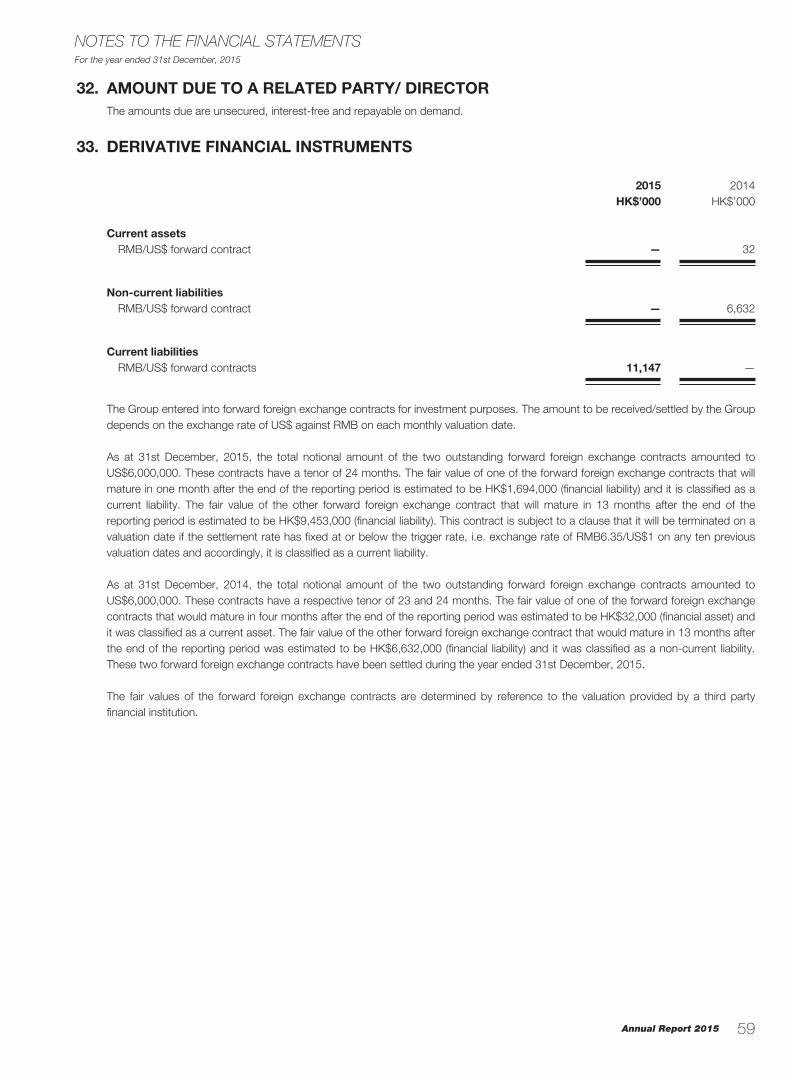
Annual Report 2015
For the year ended 31st December, 2015
59
NOTES TO THE FINANCIAL STATEMENTS
32. AMOUNT DUE TO A RELATED PARTY/ DIRECTORThe amounts due are unsecured, interest-free and repayable on demand.
33. DERIVATIVE FINANCIAL INSTRUMENTS
2015 2014HK$’000 HK$’000
Current assets RMB/US$ forward contract — 32
Non-current liabilities RMB/US$ forward contract — 6,632
Current liabilities RMB/US$ forward contracts 11,147 —
The Group entered into forward foreign exchange contracts for investment purposes. The amount to be received/settled by the Group depends on the exchange rate of US$ against RMB on each monthly valuation date.
As at 31st December, 2015, the total notional amount of the two outstanding forward foreign exchange contracts amounted to US$6,000,000. These contracts have a tenor of 24 months. The fair value of one of the forward foreign exchange contracts that will mature in one month after the end of the reporting period is estimated to be HK$1,694,000 (financial liability) and it is classified as a current liability. The fair value of the other forward foreign exchange contract that will mature in 13 months after the end of the reporting period is estimated to be HK$9,453,000 (financial liability). This contract is subject to a clause that it will be terminated on a valuation date if the settlement rate has fixed at or below the trigger rate, i.e. exchange rate of RMB6.35/US$1 on any ten previous valuation dates and accordingly, it is classified as a current liability.
As at 31st December, 2014, the total notional amount of the two outstanding forward foreign exchange contracts amounted to US$6,000,000. These contracts have a respective tenor of 23 and 24 months. The fair value of one of the forward foreign exchange contracts that would mature in four months after the end of the reporting period was estimated to be HK$32,000 (financial asset) and it was classified as a current asset. The fair value of the other forward foreign exchange contract that would mature in 13 months after the end of the reporting period was estimated to be HK$6,632,000 (financial liability) and it was classified as a non-current liability. These two forward foreign exchange contracts have been settled during the year ended 31st December, 2015.
The fair values of the forward foreign exchange contracts are determined by reference to the valuation provided by a third party financial institution.
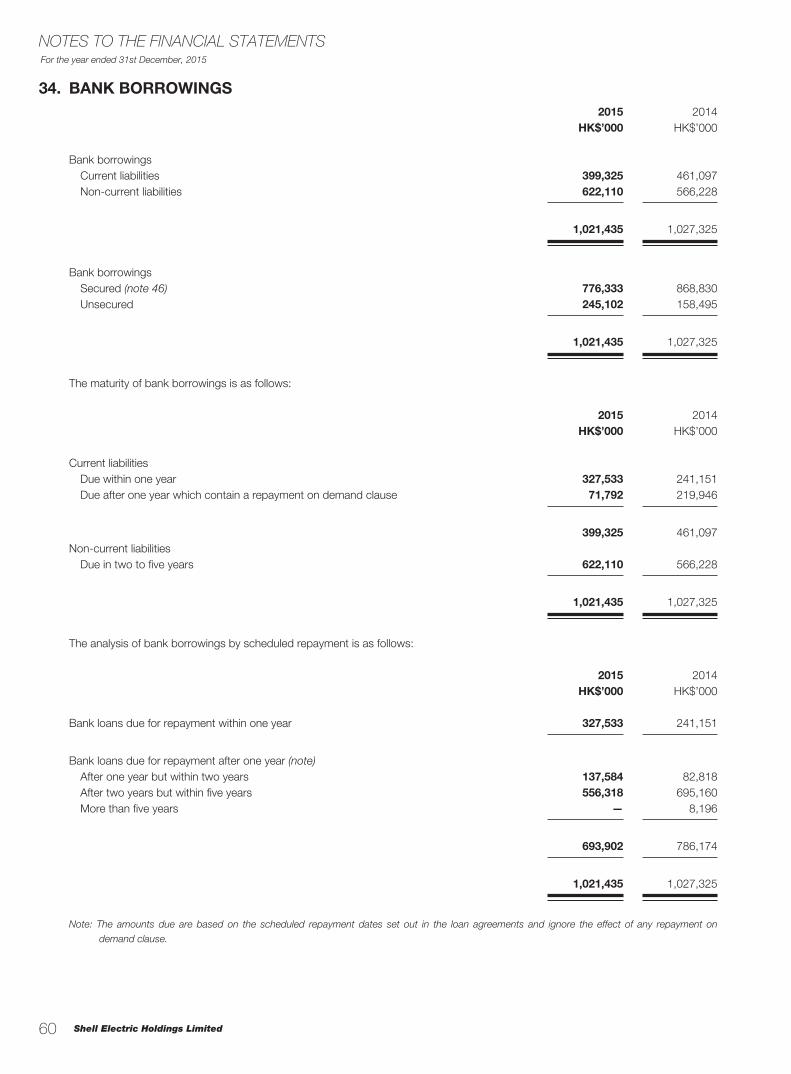
Shell Electric Holdings Limited
For the year ended 31st December, 2015
60
NOTES TO THE FINANCIAL STATEMENTS
34. BANK BORROWINGS2015 2014
HK$’000 HK$’000
Bank borrowings Current liabilities 399,325 461,097 Non-current liabilities 622,110 566,228
1,021,435 1,027,325
Bank borrowings Secured (note 46) 776,333 868,830 Unsecured 245,102 158,495
1,021,435 1,027,325
The maturity of bank borrowings is as follows:
2015 2014HK$’000 HK$’000
Current liabilities Due within one year 327,533 241,151 Due after one year which contain a repayment on demand clause 71,792 219,946
399,325 461,097Non-current liabilities Due in two to five years 622,110 566,228
1,021,435 1,027,325
The analysis of bank borrowings by scheduled repayment is as follows:
2015 2014HK$’000 HK$’000
Bank loans due for repayment within one year 327,533 241,151
Bank loans due for repayment after one year (note) After one year but within two years 137,584 82,818 After two years but within five years 556,318 695,160 More than five years — 8,196
693,902 786,174
1,021,435 1,027,325
Note: The amounts due are based on the scheduled repayment dates set out in the loan agreements and ignore the effect of any repayment on
demand clause.
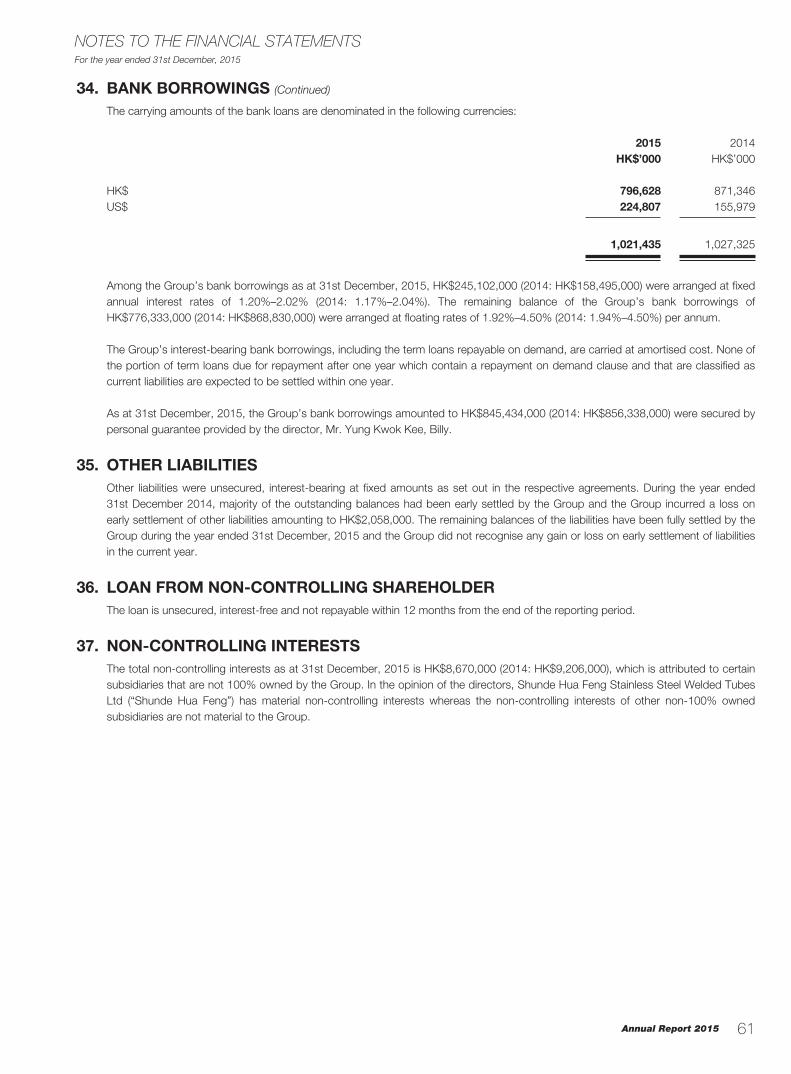
Annual Report 2015
For the year ended 31st December, 2015
61
NOTES TO THE FINANCIAL STATEMENTS
34. BANK BORROWINGS (Continued)
The carrying amounts of the bank loans are denominated in the following currencies:
2015 2014HK$’000 HK$’000
HK$ 796,628 871,346US$ 224,807 155,979
1,021,435 1,027,325
Among the Group’s bank borrowings as at 31st December, 2015, HK$245,102,000 (2014: HK$158,495,000) were arranged at fixed annual interest rates of 1.20%–2.02% (2014: 1.17%–2.04%). The remaining balance of the Group’s bank borrowings of HK$776,333,000 (2014: HK$868,830,000) were arranged at floating rates of 1.92%–4.50% (2014: 1.94%–4.50%) per annum.
The Group’s interest-bearing bank borrowings, including the term loans repayable on demand, are carried at amortised cost. None of the portion of term loans due for repayment after one year which contain a repayment on demand clause and that are classified as current liabilities are expected to be settled within one year.
As at 31st December, 2015, the Group’s bank borrowings amounted to HK$845,434,000 (2014: HK$856,338,000) were secured by personal guarantee provided by the director, Mr. Yung Kwok Kee, Billy.
35. OTHER LIABILITIESOther liabilities were unsecured, interest-bearing at fixed amounts as set out in the respective agreements. During the year ended 31st December 2014, majority of the outstanding balances had been early settled by the Group and the Group incurred a loss on early settlement of other liabilities amounting to HK$2,058,000. The remaining balances of the liabilities have been fully settled by the Group during the year ended 31st December, 2015 and the Group did not recognise any gain or loss on early settlement of liabilities in the current year.
36. LOAN FROM NON-CONTROLLING SHAREHOLDERThe loan is unsecured, interest-free and not repayable within 12 months from the end of the reporting period.
37. NON-CONTROLLING INTERESTSThe total non-controlling interests as at 31st December, 2015 is HK$8,670,000 (2014: HK$9,206,000), which is attributed to certain subsidiaries that are not 100% owned by the Group. In the opinion of the directors, Shunde Hua Feng Stainless Steel Welded Tubes Ltd (“Shunde Hua Feng”) has material non-controlling interests whereas the non-controlling interests of other non-100% owned subsidiaries are not material to the Group.
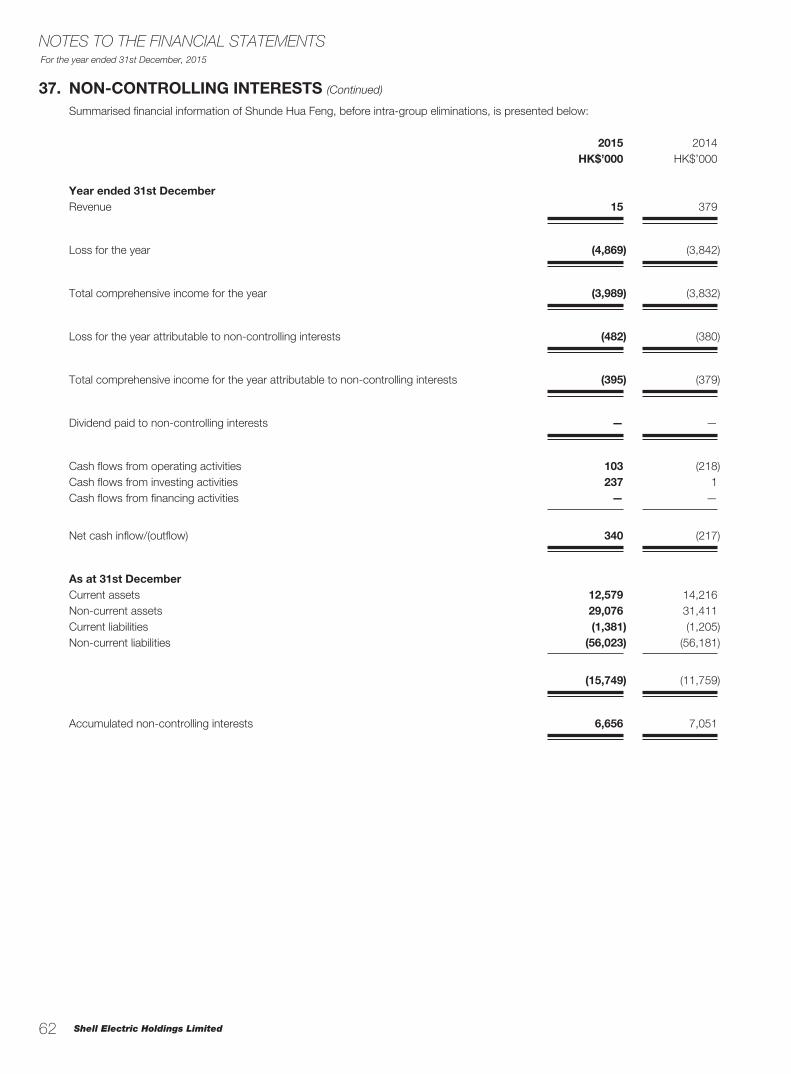
Shell Electric Holdings Limited
For the year ended 31st December, 2015
62
NOTES TO THE FINANCIAL STATEMENTS
37. NON-CONTROLLING INTERESTS (Continued)
Summarised financial information of Shunde Hua Feng, before intra-group eliminations, is presented below:
2015 2014HK$’000 HK$’000
Year ended 31st DecemberRevenue 15 379
Loss for the year (4,869) (3,842)
Total comprehensive income for the year (3,989) (3,832)
Loss for the year attributable to non-controlling interests (482) (380)
Total comprehensive income for the year attributable to non-controlling interests (395) (379)
Dividend paid to non-controlling interests — —
Cash flows from operating activities 103 (218)Cash flows from investing activities 237 1Cash flows from financing activities — —
Net cash inflow/(outflow) 340 (217)
As at 31st DecemberCurrent assets 12,579 14,216Non-current assets 29,076 31,411Current liabilities (1,381) (1,205)Non-current liabilities (56,023) (56,181)
(15,749) (11,759)
Accumulated non-controlling interests 6,656 7,051
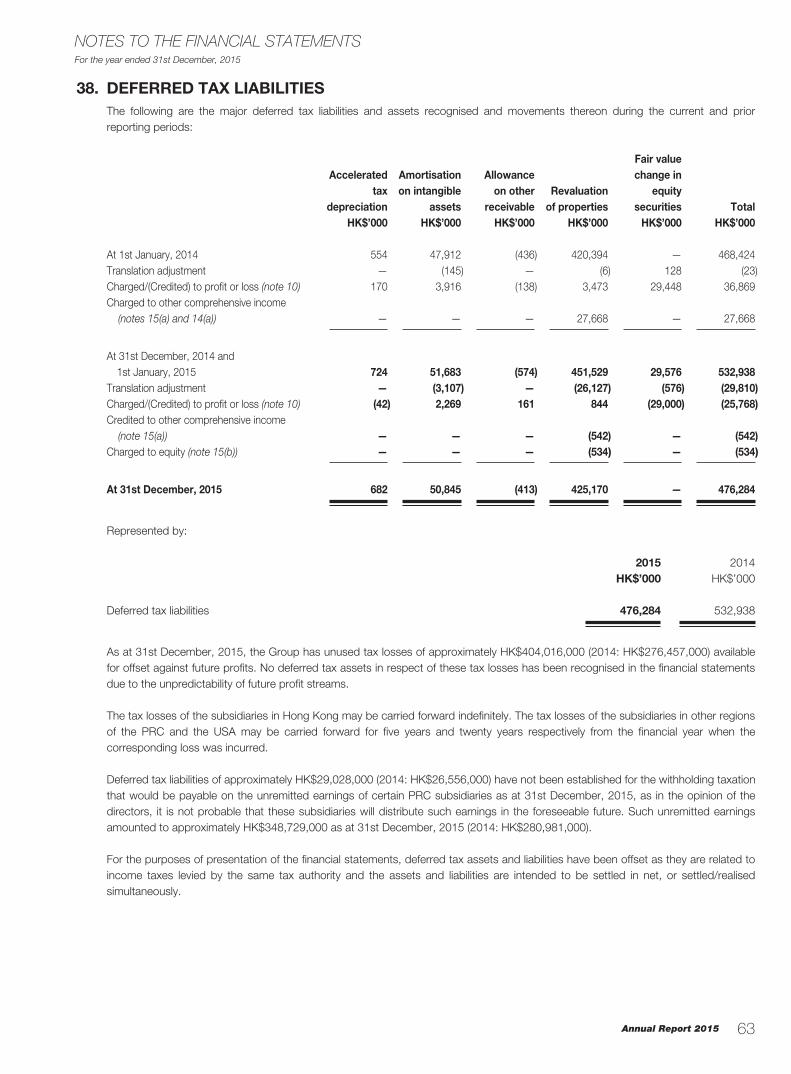
Annual Report 2015
For the year ended 31st December, 2015
63
NOTES TO THE FINANCIAL STATEMENTS
38. DEFERRED TAX LIABILITIESThe following are the major deferred tax liabilities and assets recognised and movements thereon during the current and prior reporting periods:
Accelerated tax
depreciation
Amortisation on intangible
assets
Allowance on other
receivableRevaluation
of properties
Fair value change in
equity securities Total
HK$’000 HK$’000 HK$’000 HK$’000 HK$’000 HK$’000
At 1st January, 2014 554 47,912 (436) 420,394 — 468,424Translation adjustment — (145) — (6) 128 (23)Charged/(Credited) to profit or loss (note 10) 170 3,916 (138) 3,473 29,448 36,869Charged to other comprehensive income
(notes 15(a) and 14(a)) — — — 27,668 — 27,668
At 31st December, 2014 and 1st January, 2015 724 51,683 (574) 451,529 29,576 532,938Translation adjustment — (3,107) — (26,127) (576) (29,810)Charged/(Credited) to profit or loss (note 10) (42) 2,269 161 844 (29,000) (25,768)Credited to other comprehensive income
(note 15(a)) — — — (542) — (542)Charged to equity (note 15(b)) — — — (534) — (534)
At 31st December, 2015 682 50,845 (413) 425,170 — 476,284
Represented by:
2015 2014HK$’000 HK$’000
Deferred tax liabilities 476,284 532,938
As at 31st December, 2015, the Group has unused tax losses of approximately HK$404,016,000 (2014: HK$276,457,000) available for offset against future profits. No deferred tax assets in respect of these tax losses has been recognised in the financial statements due to the unpredictability of future profit streams.
The tax losses of the subsidiaries in Hong Kong may be carried forward indefinitely. The tax losses of the subsidiaries in other regions of the PRC and the USA may be carried forward for five years and twenty years respectively from the financial year when the corresponding loss was incurred.
Deferred tax liabilities of approximately HK$29,028,000 (2014: HK$26,556,000) have not been established for the withholding taxation that would be payable on the unremitted earnings of certain PRC subsidiaries as at 31st December, 2015, as in the opinion of the directors, it is not probable that these subsidiaries will distribute such earnings in the foreseeable future. Such unremitted earnings amounted to approximately HK$348,729,000 as at 31st December, 2015 (2014: HK$280,981,000).
For the purposes of presentation of the financial statements, deferred tax assets and liabilities have been offset as they are related to income taxes levied by the same tax authority and the assets and liabilities are intended to be settled in net, or settled/realised simultaneously.
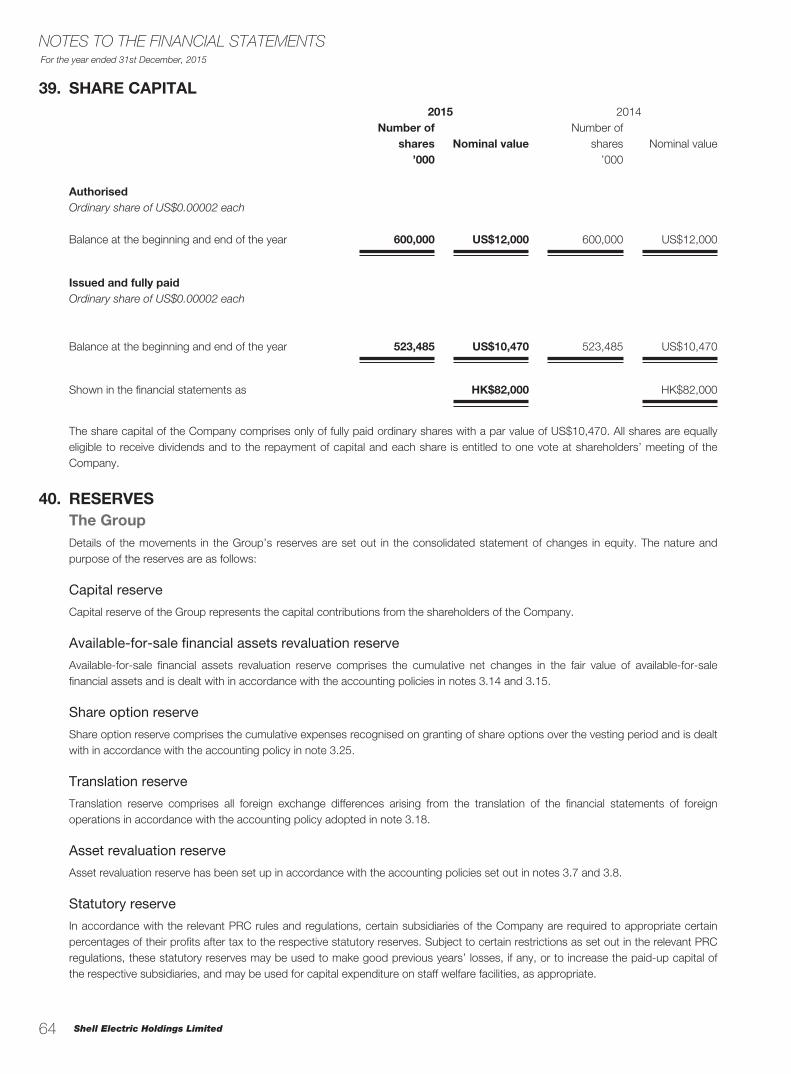
Shell Electric Holdings Limited
For the year ended 31st December, 2015
64
NOTES TO THE FINANCIAL STATEMENTS
39. SHARE CAPITAL2015 2014
Number of shares Nominal value
Number of shares Nominal value
’000 ’000
AuthorisedOrdinary share of US$0.00002 each
Balance at the beginning and end of the year 600,000 US$12,000 600,000 US$12,000
Issued and fully paidOrdinary share of US$0.00002 each
Balance at the beginning and end of the year 523,485 US$10,470 523,485 US$10,470
Shown in the financial statements as HK$82,000 HK$82,000
The share capital of the Company comprises only of fully paid ordinary shares with a par value of US$10,470. All shares are equally eligible to receive dividends and to the repayment of capital and each share is entitled to one vote at shareholders’ meeting of the Company.
40. RESERVESThe GroupDetails of the movements in the Group’s reserves are set out in the consolidated statement of changes in equity. The nature and purpose of the reserves are as follows:
Capital reserve
Capital reserve of the Group represents the capital contributions from the shareholders of the Company.
Available-for-sale financial assets revaluation reserve
Available-for-sale financial assets revaluation reserve comprises the cumulative net changes in the fair value of available-for-sale financial assets and is dealt with in accordance with the accounting policies in notes 3.14 and 3.15.
Share option reserve
Share option reserve comprises the cumulative expenses recognised on granting of share options over the vesting period and is dealt with in accordance with the accounting policy in note 3.25.
Translation reserve
Translation reserve comprises all foreign exchange differences arising from the translation of the financial statements of foreign operations in accordance with the accounting policy adopted in note 3.18.
Asset revaluation reserve
Asset revaluation reserve has been set up in accordance with the accounting policies set out in notes 3.7 and 3.8.
Statutory reserve
In accordance with the relevant PRC rules and regulations, certain subsidiaries of the Company are required to appropriate certain percentages of their profits after tax to the respective statutory reserves. Subject to certain restrictions as set out in the relevant PRC regulations, these statutory reserves may be used to make good previous years’ losses, if any, or to increase the paid-up capital of the respective subsidiaries, and may be used for capital expenditure on staff welfare facilities, as appropriate.
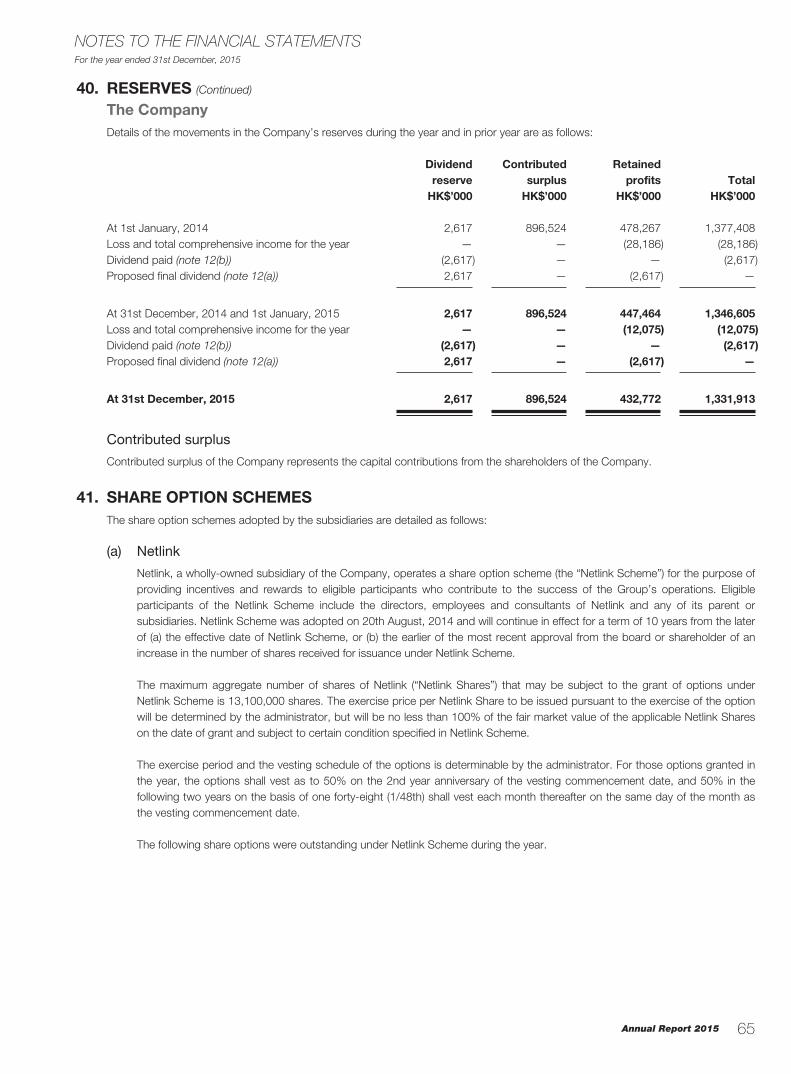
Annual Report 2015
For the year ended 31st December, 2015
65
NOTES TO THE FINANCIAL STATEMENTS
40. RESERVES (Continued)
The CompanyDetails of the movements in the Company’s reserves during the year and in prior year are as follows:
Dividend reserve
Contributed surplus
Retained profits Total
HK$’000 HK$’000 HK$’000 HK$’000
At 1st January, 2014 2,617 896,524 478,267 1,377,408Loss and total comprehensive income for the year — — (28,186) (28,186)Dividend paid (note 12(b)) (2,617) — — (2,617)Proposed final dividend (note 12(a)) 2,617 — (2,617) —
At 31st December, 2014 and 1st January, 2015 2,617 896,524 447,464 1,346,605Loss and total comprehensive income for the year — — (12,075) (12,075)Dividend paid (note 12(b)) (2,617) — — (2,617)Proposed final dividend (note 12(a)) 2,617 — (2,617) —
At 31st December, 2015 2,617 896,524 432,772 1,331,913
Contributed surplus
Contributed surplus of the Company represents the capital contributions from the shareholders of the Company.
41. SHARE OPTION SCHEMESThe share option schemes adopted by the subsidiaries are detailed as follows:
(a) Netlink
Netlink, a wholly-owned subsidiary of the Company, operates a share option scheme (the “Netlink Scheme”) for the purpose of providing incentives and rewards to eligible participants who contribute to the success of the Group’s operations. Eligible participants of the Netlink Scheme include the directors, employees and consultants of Netlink and any of its parent or subsidiaries. Netlink Scheme was adopted on 20th August, 2014 and will continue in effect for a term of 10 years from the later of (a) the effective date of Netlink Scheme, or (b) the earlier of the most recent approval from the board or shareholder of an increase in the number of shares received for issuance under Netlink Scheme.
The maximum aggregate number of shares of Netlink (“Netlink Shares”) that may be subject to the grant of options under Netlink Scheme is 13,100,000 shares. The exercise price per Netlink Share to be issued pursuant to the exercise of the option will be determined by the administrator, but will be no less than 100% of the fair market value of the applicable Netlink Shares on the date of grant and subject to certain condition specified in Netlink Scheme.
The exercise period and the vesting schedule of the options is determinable by the administrator. For those options granted in the year, the options shall vest as to 50% on the 2nd year anniversary of the vesting commencement date, and 50% in the following two years on the basis of one forty-eight (1/48th) shall vest each month thereafter on the same day of the month as the vesting commencement date.
The following share options were outstanding under Netlink Scheme during the year.
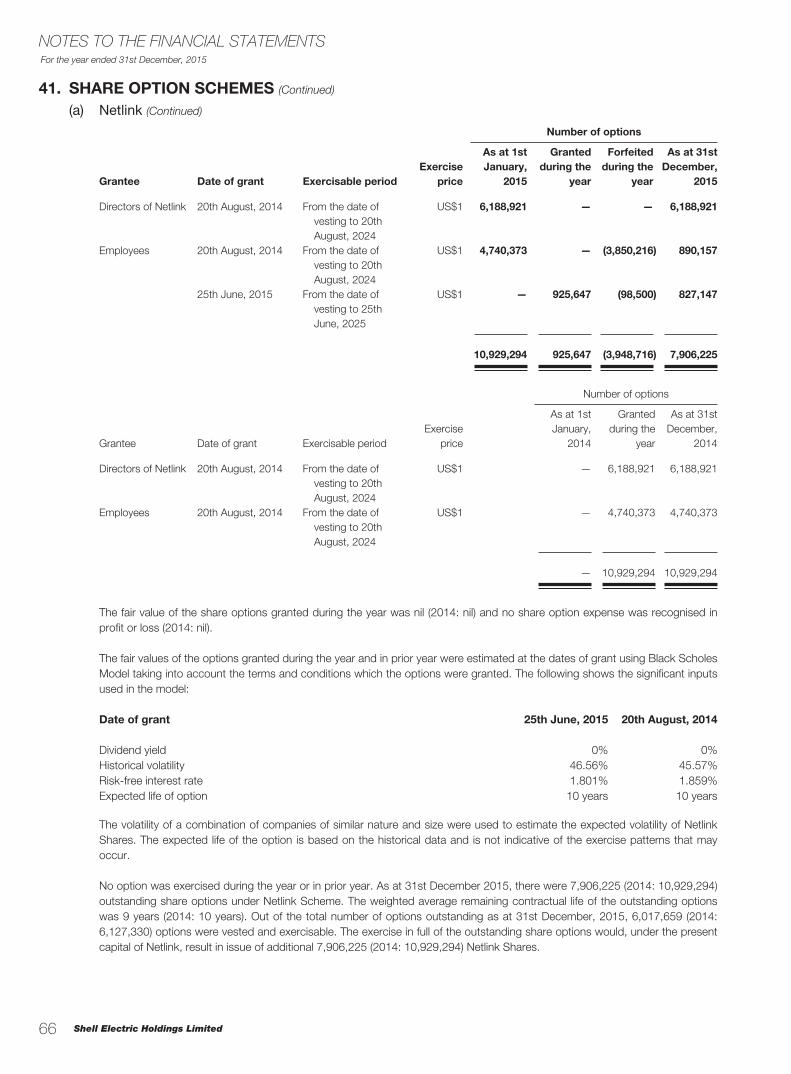
Shell Electric Holdings Limited
For the year ended 31st December, 2015
66
NOTES TO THE FINANCIAL STATEMENTS
41. SHARE OPTION SCHEMES (Continued)
(a) Netlink (Continued)
Number of options
Grantee Date of grant Exercisable periodExercise
price
As at 1st January,
2015
Granted during the
year
Forfeited during the
year
As at 31st December,
2015
Directors of Netlink 20th August, 2014 From the date of vesting to 20th August, 2024
US$1 6,188,921 — — 6,188,921
Employees 20th August, 2014 From the date of vesting to 20th August, 2024
US$1 4,740,373 — (3,850,216) 890,157
25th June, 2015 From the date of vesting to 25th June, 2025
US$1 — 925,647 (98,500) 827,147
10,929,294 925,647 (3,948,716) 7,906,225
Number of options
Grantee Date of grant Exercisable periodExercise
price
As at 1st January,
2014
Granted during the
year
As at 31st December,
2014
Directors of Netlink 20th August, 2014 From the date of vesting to 20th August, 2024
US$1 — 6,188,921 6,188,921
Employees 20th August, 2014 From the date of vesting to 20th August, 2024
US$1 — 4,740,373 4,740,373
— 10,929,294 10,929,294
The fair value of the share options granted during the year was nil (2014: nil) and no share option expense was recognised in profit or loss (2014: nil).
The fair values of the options granted during the year and in prior year were estimated at the dates of grant using Black Scholes Model taking into account the terms and conditions which the options were granted. The following shows the significant inputs used in the model:
Date of grant 25th June, 2015 20th August, 2014
Dividend yield 0% 0%Historical volatility 46.56% 45.57%Risk-free interest rate 1.801% 1.859%Expected life of option 10 years 10 years
The volatility of a combination of companies of similar nature and size were used to estimate the expected volatility of Netlink Shares. The expected life of the option is based on the historical data and is not indicative of the exercise patterns that may occur.
No option was exercised during the year or in prior year. As at 31st December 2015, there were 7,906,225 (2014: 10,929,294) outstanding share options under Netlink Scheme. The weighted average remaining contractual life of the outstanding options was 9 years (2014: 10 years). Out of the total number of options outstanding as at 31st December, 2015, 6,017,659 (2014: 6,127,330) options were vested and exercisable. The exercise in full of the outstanding share options would, under the present capital of Netlink, result in issue of additional 7,906,225 (2014: 10,929,294) Netlink Shares.
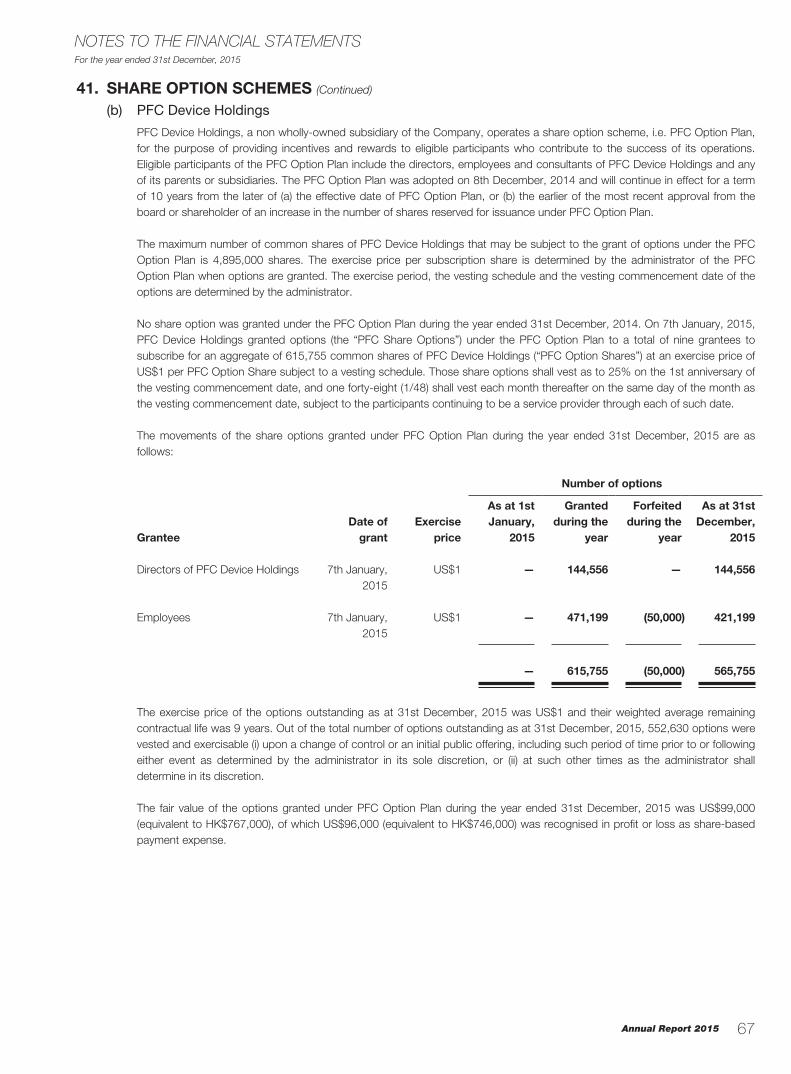
Annual Report 2015
For the year ended 31st December, 2015
67
NOTES TO THE FINANCIAL STATEMENTS
41. SHARE OPTION SCHEMES (Continued)
(b) PFC Device Holdings
PFC Device Holdings, a non wholly-owned subsidiary of the Company, operates a share option scheme, i.e. PFC Option Plan, for the purpose of providing incentives and rewards to eligible participants who contribute to the success of its operations. Eligible participants of the PFC Option Plan include the directors, employees and consultants of PFC Device Holdings and any of its parents or subsidiaries. The PFC Option Plan was adopted on 8th December, 2014 and will continue in effect for a term of 10 years from the later of (a) the effective date of PFC Option Plan, or (b) the earlier of the most recent approval from the board or shareholder of an increase in the number of shares reserved for issuance under PFC Option Plan.
The maximum number of common shares of PFC Device Holdings that may be subject to the grant of options under the PFC Option Plan is 4,895,000 shares. The exercise price per subscription share is determined by the administrator of the PFC Option Plan when options are granted. The exercise period, the vesting schedule and the vesting commencement date of the options are determined by the administrator.
No share option was granted under the PFC Option Plan during the year ended 31st December, 2014. On 7th January, 2015, PFC Device Holdings granted options (the “PFC Share Options”) under the PFC Option Plan to a total of nine grantees to subscribe for an aggregate of 615,755 common shares of PFC Device Holdings (“PFC Option Shares”) at an exercise price of US$1 per PFC Option Share subject to a vesting schedule. Those share options shall vest as to 25% on the 1st anniversary of the vesting commencement date, and one forty-eight (1/48) shall vest each month thereafter on the same day of the month as the vesting commencement date, subject to the participants continuing to be a service provider through each of such date.
The movements of the share options granted under PFC Option Plan during the year ended 31st December, 2015 are as follows:
Number of options
GranteeDate of
grantExercise
price
As at 1st January,
2015
Granted during the
year
Forfeited during the
year
As at 31st December,
2015
Directors of PFC Device Holdings 7th January, 2015
US$1 — 144,556 — 144,556
Employees 7th January, 2015
US$1 — 471,199 (50,000) 421,199
— 615,755 (50,000) 565,755
The exercise price of the options outstanding as at 31st December, 2015 was US$1 and their weighted average remaining contractual life was 9 years. Out of the total number of options outstanding as at 31st December, 2015, 552,630 options were vested and exercisable (i) upon a change of control or an initial public offering, including such period of time prior to or following either event as determined by the administrator in its sole discretion, or (ii) at such other times as the administrator shall determine in its discretion.
The fair value of the options granted under PFC Option Plan during the year ended 31st December, 2015 was US$99,000 (equivalent to HK$767,000), of which US$96,000 (equivalent to HK$746,000) was recognised in profit or loss as share-based payment expense.
Shell Electric Holdings Limited
For the year ended 31st December, 2015
68
NOTES TO THE FINANCIAL STATEMENTS
41. SHARE OPTION SCHEMES (Continued)
(b) PFC Device Holdings (Continued)
The fair value of the options granted under PFC Option Plan during the year was estimated at the date of grant using Black Scholes Model taking into account the terms and conditions of the options granted. The following table shows the significant inputs used in the models:
Lot 1 Lot 2
Dividend yield 0% 0%Historical volatility 30.913% 38.331%Risk-free interest rate 0.2566% 1.2226%Expected life of option 1.1 years 3.73 years
The historical volatility of a combination of companies of similar nature were used to estimate the historical volatility of the shares of PFC Device Holdings.
No option has been exercised during the year since they have been granted. Some options have been exercised subsequent to 31st December, 2015 as detailed in note 51(b).
As at 31st December, 2015, there were 565,755 outstanding options under PFC Option Plan. The exercise in full of these outstanding share options would, under the present capital of PFC Device Holdings, result in issue of additional 565,755 common shares of PFC Device Holdings.
Annual Report 2015
For the year ended 31st December, 2015
69
NOTES TO THE FINANCIAL STATEMENTS
42. HOLDING COMPANY STATEMENT OF FINANCIAL POSITIONAs at 31st
December,As at 31st
December,2015 2014
NOTES HK$’000 HK$’000
ASSETS AND LIABILITIES
Non-current assetsInvestment properties 89,200 79,200Property, plant and equipment 5,565 6,680Prepayments for acquisition of property, plant and equipment 1,021 —Interests in subsidiaries 9,191 9,190Deposit paid 63,380 63,380Available-for-sale financial assets 380 3,300Other assets 66,190 49,139
234,927 210,889
Current assetsOther receivables, prepayments and deposits 3,865 3,342Loans receivable — 106Amounts due from subsidiaries 2,474,010 2,491,238Cash and bank balances 16,059 18,459
2,493,934 2,513,145
Current liabilitiesOther payables and accruals 154,758 154,312Amounts due to subsidiaries 288,273 299,889Amount due to a director 31,485 31,485Bank borrowings 300,084 325,285
774,600 810,971
Net current assets 1,719,334 1,702,174
Non-current liabilitiesBank borrowings 622,110 566,228Deferred tax liabilities 156 148
622,266 566,376
Net assets 1,331,995 1,346,687
CAPITAL AND RESERVES
Share capital 39 82 82Reserves 40 1,331,913 1,346,605
Total equity 1,331,995 1,346,687
On behalf of the Directors
YUNG KWOK KEE, BILLY CHOW KAI CHIU, DAVID Director Director
Shell Electric Holdings Limited
For the year ended 31st December, 2015
70
NOTES TO THE FINANCIAL STATEMENTS
43. ACQUISITION OF NON-CONTROLLING INTERESTSDuring the year ended 31st December, 2014, the Group entered into an acquisition agreement with the non-controlling shareholder of 廣東匯泓投資有限公司 (“廣東匯泓”) to acquire the remaining 30% equity interest of 廣東匯泓 at a consideration of RMB3,348,000 (equivalent to HK$4,208,000). 廣東匯泓 is an investment holding company established in the PRC holding 100% equity interest in 廣州匯朗物業管理有限公司 (“廣州匯朗”), a company established in the PRC principally engaged in property investment and development. Following the acquisition, the Group’s equity interest in 廣東匯泓 and 廣州匯朗 increased from 70% to 100%. The transaction was accounted for as an equity transaction with the non-controlling interest as follows:
2014HK$’000
Consideration for acquiring 30% equity interest 4,208Net assets attributable to 30% equity interest (3,278)
Decrease in equity attributable to owners of the Company 930
The consideration for acquiring 30% equity interest of 廣東匯泓 amounting to HK$4,208,000 was settled during the year ended 31st December, 2014 by offsetting the consideration with the amount due from the non-controlling shareholder.
44. DISPOSAL OF A SUBSIDIARYDuring the year ended 31st December, 2015, the Group disposed of its entire equity interest in Landwick Development Limited (“Landwick”), an indirect wholly-owned subsidiary of the Company. The consideration of the disposal was HK$35,750,000. Landwick is a limited company incorporated in Hong Kong and is principally engaged in property development. The disposal was completed on 5th August, 2015.
The gain arising from the disposal of Landwick amounting to HK$21,010,000 was included in “Other gains or losses — Gain arising from disposal of a subsidiary, net” in the consolidated income statement and is calculated as follows:
2015HK$’000
Consideration pursuant to the agreement 35,750Less: Transaction costs (130)
35,620Net assets disposed of (note) (14,610)
Gain on disposal 21,010
Note:
The net assets of Landwick disposed of were as follows:
2015HK$’000
Net assets disposed of: Inventories of properties 14,623 Taxation liabilities (13)
14,610
Consideration, net settled by: Cash 35,620
Cash consideration received during the year 35,620Cash and bank balances disposed of —
Net inflow of cash and cash equivalents in respect of the disposal of a subsidiary 35,620
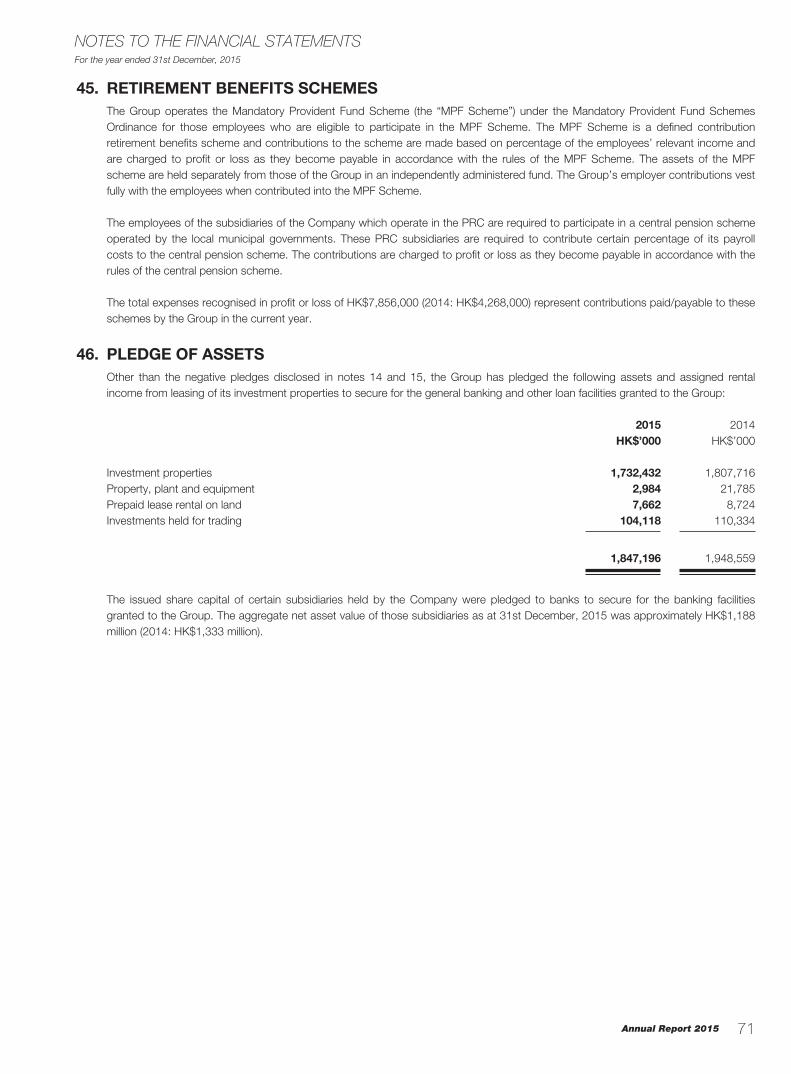
Annual Report 2015
For the year ended 31st December, 2015
71
NOTES TO THE FINANCIAL STATEMENTS
45. RETIREMENT BENEFITS SCHEMESThe Group operates the Mandatory Provident Fund Scheme (the “MPF Scheme”) under the Mandatory Provident Fund Schemes Ordinance for those employees who are eligible to participate in the MPF Scheme. The MPF Scheme is a defined contribution retirement benefits scheme and contributions to the scheme are made based on percentage of the employees’ relevant income and are charged to profit or loss as they become payable in accordance with the rules of the MPF Scheme. The assets of the MPF scheme are held separately from those of the Group in an independently administered fund. The Group’s employer contributions vest fully with the employees when contributed into the MPF Scheme.
The employees of the subsidiaries of the Company which operate in the PRC are required to participate in a central pension scheme operated by the local municipal governments. These PRC subsidiaries are required to contribute certain percentage of its payroll costs to the central pension scheme. The contributions are charged to profit or loss as they become payable in accordance with the rules of the central pension scheme.
The total expenses recognised in profit or loss of HK$7,856,000 (2014: HK$4,268,000) represent contributions paid/payable to these schemes by the Group in the current year.
46. PLEDGE OF ASSETSOther than the negative pledges disclosed in notes 14 and 15, the Group has pledged the following assets and assigned rental income from leasing of its investment properties to secure for the general banking and other loan facilities granted to the Group:
2015 2014HK$’000 HK$’000
Investment properties 1,732,432 1,807,716Property, plant and equipment 2,984 21,785Prepaid lease rental on land 7,662 8,724Investments held for trading 104,118 110,334
1,847,196 1,948,559
The issued share capital of certain subsidiaries held by the Company were pledged to banks to secure for the banking facilities granted to the Group. The aggregate net asset value of those subsidiaries as at 31st December, 2015 was approximately HK$1,188 million (2014: HK$1,333 million).
Shell Electric Holdings Limited
For the year ended 31st December, 2015
72
NOTES TO THE FINANCIAL STATEMENTS
47. OPERATING LEASE ARRANGEMENTSAs lesseeThe Group leases certain of its manufacturing plants and office properties under operating leases arrangements. Leases of these properties are negotiated for period ranging from one to five years (2014: one to five years), and rentals are fixed over the contracted period. At the end of the reporting period, the Group had commitments for future minimum lease payments under non-cancellable operating leases in respect of rented premises payable as follows:
2015 2014HK$’000 HK$’000
Within one year 4,427 6,364In the second to fifth year, inclusive 8,291 7,565
12,718 13,929
As lessorThe Group leases its investment properties (note 14) under operating lease arrangements with leases negotiated for period ranging from one year to twenty-four years (2014: one year to twenty-four years). At the end of the reporting period, the Group had contracted with tenants for the following future minimum lease payments receivable as follows:
2015 2014HK$’000 HK$’000
Within one year 87,674 98,267In the second to fifth year, inclusive 99,555 95,599Over five years 341 1,038
187,570 194,904
48. OTHER COMMITMENTSAt the end of the reporting period, the Group had other significant commitments as follows:
2015 2014HK$’000 HK$’000
Contracted for but not provided in the financial statements:Acquisition of property, plant and equipment 6,123 18,952Acquisition of equity interest 179,040 190,140Property development 6,858 —
Annual Report 2015
For the year ended 31st December, 2015
73
NOTES TO THE FINANCIAL STATEMENTS
49. CONTINGENT LIABILITIES(a) A lawsuit brought by a party (the “Party”) in 2014 alleging that the registration of the legal titles of the GZ Property passed to the
Group as mentioned in note 30(b) being illegal and requesting the PRC land bureau to revoke the certificates of the GZ Property issued by it to the Group. The lawsuit is still in progress at the end of the reporting period. Based on the advice from a PRC legal counsel, the transfer and the registration of the titles of the GZ Property are proper and the Group has legal titles and all relevant rights over the GZ Property since the transfer of titles is completed. Accordingly, the directors are of the opinion that the lawsuit would not result in significant financial impact to the Group.
(b) The Group has undertaken to bear the legal and professional fees as well as any economic obligation arising from the lawsuit initiated by the Mortgage Bank as referred to in note 30(b) against the Party as mentioned in note (a) above regarding the termination of the sale and purchase agreement entered into by the Mortgage Bank with the Party in 2007. A deposit amounting to RMB18,821,000 (equivalent to HK$22,465,000) as at 31st December, 2015 (2014: RMB19,220,000 (equivalent to HK$24,383,000)) has been placed by the Group in the bank account designated by the Mortgage Bank to secure for the undertaking. Based on the advice from a PRC legal counsel, the director are of the opinion that such undertaking would not result in significant financial impact to the Group.
(c) During the year ended 31st December 2015, the Group acquired the GZ Land as mentioned in note 27(d) for property development and the GZ Land has been occupied by certain tenants. To prepare for the property development project, lawsuits were brought by the Group to request those tenants to move out of the GZ Land and certain tenants claim the Group for compensation. Based on the advice from a PRC legal counsel, the Group has legal title over the GZ Land upon the completion of the transfer of the title of the relevant land. Accordingly, the Group should have right to request those tenants to return the GZ Land to the Group and the Group has no obligation to pay compensation to those tenants. Based on the aforementioned legal advice, the directors are of the opinion that these lawsuits would not result in significant financial impact to the Group.
(d) During the year ended 31st December, 2015, the Group entered into a sale and purchase agreement with an independent third party to dispose of certain land parcels in Hong Kong which have been held by the Group for property development. The consideration for the disposal of those land parcels amounted to HK$26,600,000. However, the directors of the Company have come to know that there may have potential legality issue in respect of the titles of those land parcels which would therefore render the sale and purchase agreement ineffective. As assessed by the directors, it is uncertain as to when the legality issue of those land titles can be addressed. Accordingly, the Group has written down the net carrying amount of the concerned land parcels in the year which amounted to HK$17,417,000 and recorded the consideration paid by the buyer as deposit received. As assessed by the directors, potential claims in this regard would not result in material effect to the Group.
Shell Electric Holdings Limited
For the year ended 31st December, 2015
74
NOTES TO THE FINANCIAL STATEMENTS
50. RELATED PARTY TRANSACTIONSTransactions between the entities among the Group have been eliminated on consolidation and are not disclosed in this note. Details of transactions between the Group and other related parties including key management personnel are disclosed below.
(a) Save as disclosed elsewhere in these financial statements, the Group had the following significant transactions with related parties:
2015 2014HK$’000 HK$’000
Service fee paid to a director 10,050 10,050
Service fee was paid to Mr. Yung Kwok Kee, Billy, director of the Company, for providing personal guarantee to banks in respect of the banking facilities granted to the Group, which is charged at the rate of 0.75% (2014: 0.75%) on the amount of facilities granted.
(b) Compensation of key management personnel:
The remuneration of directors and other members of key management were as follows:
2015 2014HK$’000 HK$’000
Salaries, allowances and other benefits 38,288 37,120Contributions to defined contribution retirement plan 1,219 680
39,507 37,800
51. EVENTS AFTER THE REPORTING PERIOD
(a) On 25th April, 2016, the Group entered into a sale and purchase agreement with an independent third party to dispose of its 100% equity interest in Charm Harvest Development Limited (“Charm Harvest”) for a cash consideration of HK$57,000,000. Charm Harvest is a limited company incorporated in Hong Kong which is principally engaged in property investment. The disposal has not been completed as of the date of this report.
(b) On 15th February, 2016, a subsidiary, PFC Device Holdings served a written notice to inform the eligible grantees that they can exercise the PFC Share Options granted under the PFC Option Plan as disclosed in note 41(b). On 19th February, 2016, 553,255 PFC Share Options were exercised, resulting in the issue of 553,255 common shares of PFC Device Holdings. As a result, the Group’s equity interest in PFC Device Holdings has been diluted from 95.5% to 86.0%. The PFC Option Plan was terminated with effect on 19th February, 2016.
(c) On 30th March, 2016, the management submitted listing application to The Stock Exchange of Hong Kong Limited (the “Stock Exchange”) to apply for listing of the semiconductor business on the Growth Enterprise Market of the Stock Exchange (the “Listing”). The listing application is under detailed vetting process carried out by the Stock Exchange. Management is in the process of making an assessment of the spin-off and the Listing and is not yet in a position to state whether it will have material impact of the Group’s financial performance and financial position.
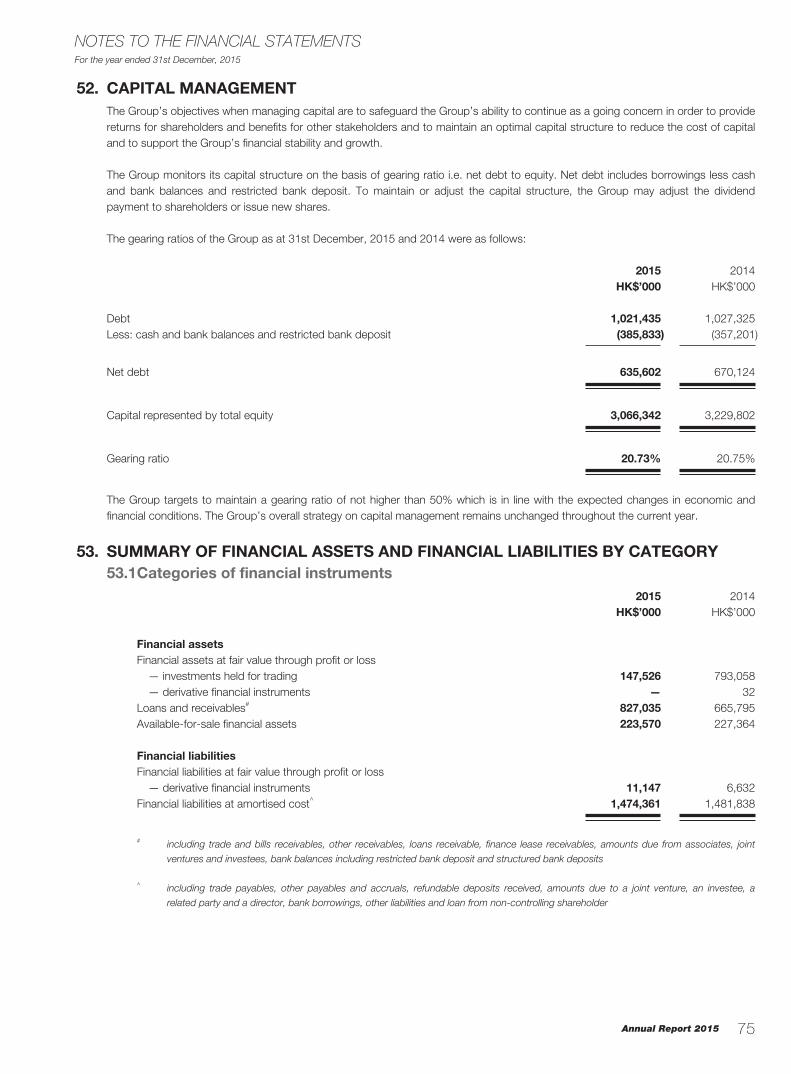
Annual Report 2015
For the year ended 31st December, 2015
75
NOTES TO THE FINANCIAL STATEMENTS
52. CAPITAL MANAGEMENTThe Group’s objectives when managing capital are to safeguard the Group’s ability to continue as a going concern in order to provide returns for shareholders and benefits for other stakeholders and to maintain an optimal capital structure to reduce the cost of capital and to support the Group’s financial stability and growth.
The Group monitors its capital structure on the basis of gearing ratio i.e. net debt to equity. Net debt includes borrowings less cash and bank balances and restricted bank deposit. To maintain or adjust the capital structure, the Group may adjust the dividend payment to shareholders or issue new shares.
The gearing ratios of the Group as at 31st December, 2015 and 2014 were as follows:
2015 2014HK$’000 HK$’000
Debt 1,021,435 1,027,325Less: cash and bank balances and restricted bank deposit (385,833) (357,201)
Net debt 635,602 670,124
Capital represented by total equity 3,066,342 3,229,802
Gearing ratio 20.73% 20.75%
The Group targets to maintain a gearing ratio of not higher than 50% which is in line with the expected changes in economic and financial conditions. The Group’s overall strategy on capital management remains unchanged throughout the current year.
53. SUMMARY OF FINANCIAL ASSETS AND FINANCIAL LIABILITIES BY CATEGORY53.1 Categories of financial instruments
2015 2014HK$’000 HK$’000
Financial assetsFinancial assets at fair value through profit or loss — investments held for trading 147,526 793,058 — derivative financial instruments — 32Loans and receivables# 827,035 665,795Available-for-sale financial assets 223,570 227,364
Financial liabilitiesFinancial liabilities at fair value through profit or loss — derivative financial instruments 11,147 6,632Financial liabilities at amortised cost^ 1,474,361 1,481,838
# including trade and bills receivables, other receivables, loans receivable, finance lease receivables, amounts due from associates, joint
ventures and investees, bank balances including restricted bank deposit and structured bank deposits
^ including trade payables, other payables and accruals, refundable deposits received, amounts due to a joint venture, an investee, a
related party and a director, bank borrowings, other liabilities and loan from non-controlling shareholder

Shell Electric Holdings Limited
For the year ended 31st December, 2015
76
NOTES TO THE FINANCIAL STATEMENTS
53. SUMMARY OF FINANCIAL ASSETS AND FINANCIAL LIABILITIES BY CATEGORY (Continued)
53.2 Fair value measurement(a) Financial instruments measured at fair value
The following table presents the carrying value of financial instruments measured at fair value as at 31st December, 2015 and 2014 across the three levels of the fair value hierarchy defined in HKFRS 7 “Financial Instruments: Disclosures”, with the fair value of each financial instruments categorised in its entirety based on the lowest level of input that is significant to the fair value measurement. The levels are defined as follows:
— Level 1 (highest level): fair values measured using quoted prices (unadjusted) in active markets for identical financial instruments
— Level 2: fair values measured using quoted prices in active markets for similar financial instruments, or using valuation techniques in which all significant inputs are directly or indirectly based on observable market data
— Level 3 (lowest level): fair values measured using valuation techniques in which any significant input is not based on observable market data
Level 1 Level 2 Level 3 TotalHK$’000 HK$’000 HK$’000 HK$’000
(note)
As at 31st December, 2015Financial assetsAvailable-for-sale financial assets — Listed equity securities 53,252 — — 53,252 — Unlisted equity securities (note) — — 145,619 145,619 — Listed debt securities 24,319 — — 24,319Investments held for trading — Listed equity securities 109,033 — — 109,033 — Listed debt securities 38,493 — — 38,493
Financial liabilitiesDerivative financial instruments — 11,147 — 11,147
As at 31st December, 2014Financial assetsAvailable-for-sale financial assets — Listed equity securities 63,967 — — 63,967 — Unlisted equity securities (note) — — 150,718 150,718 — Unlisted investment funds — 9,379 — 9,379Investments held for trading — Listed equity securities 793,058 — — 793,058Derivative financial instruments — 32 — 32
Financial liabilitiesDerivative financial instruments — 6,632 — 6,632
During the years ended 31st December, 2015 and 2014, there were no transfers between instruments in Level 1 and Level 2.
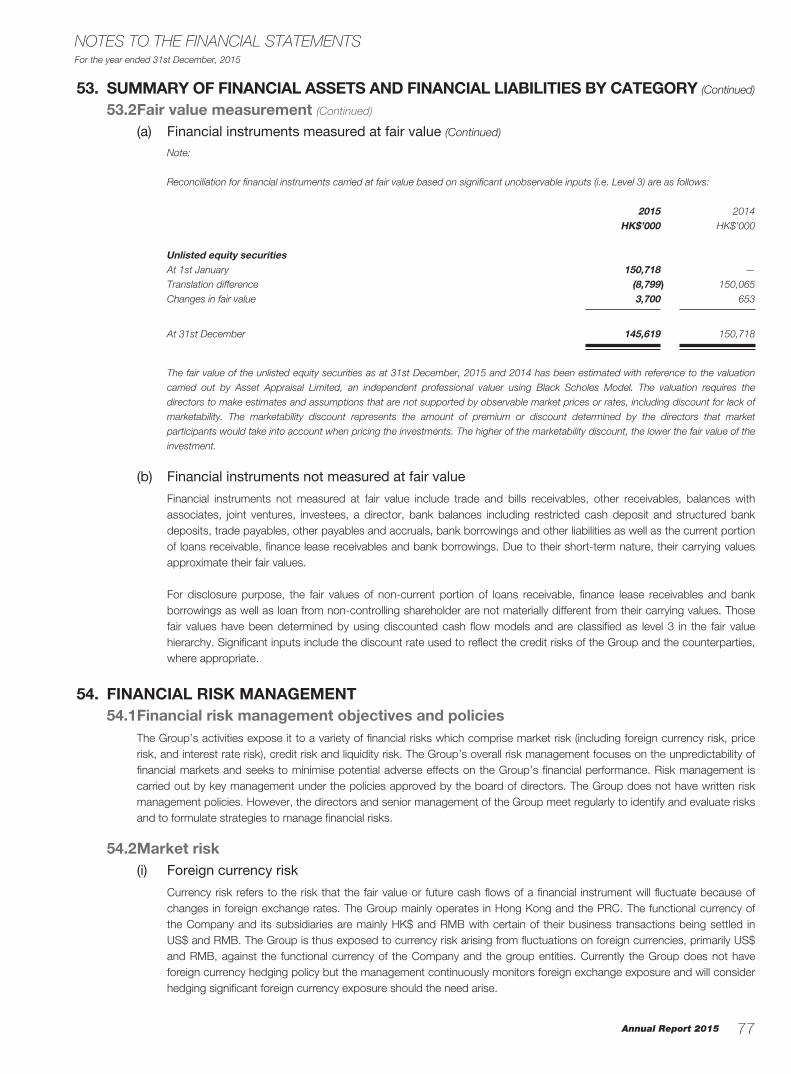
Annual Report 2015
For the year ended 31st December, 2015
77
NOTES TO THE FINANCIAL STATEMENTS
53. SUMMARY OF FINANCIAL ASSETS AND FINANCIAL LIABILITIES BY CATEGORY (Continued)
53.2 Fair value measurement (Continued)
(a) Financial instruments measured at fair value (Continued)
Note:
Reconciliation for financial instruments carried at fair value based on significant unobservable inputs (i.e. Level 3) are as follows:
2015 2014
HK$’000 HK$’000
Unlisted equity securitiesAt 1st January 150,718 —
Translation difference (8,799) 150,065
Changes in fair value 3,700 653
At 31st December 145,619 150,718
The fair value of the unlisted equity securities as at 31st December, 2015 and 2014 has been estimated with reference to the valuation
carried out by Asset Appraisal Limited, an independent professional valuer using Black Scholes Model. The valuation requires the
directors to make estimates and assumptions that are not supported by observable market prices or rates, including discount for lack of
marketability. The marketability discount represents the amount of premium or discount determined by the directors that market
participants would take into account when pricing the investments. The higher of the marketability discount, the lower the fair value of the
investment.
(b) Financial instruments not measured at fair value
Financial instruments not measured at fair value include trade and bills receivables, other receivables, balances with associates, joint ventures, investees, a director, bank balances including restricted cash deposit and structured bank deposits, trade payables, other payables and accruals, bank borrowings and other liabilities as well as the current portion of loans receivable, finance lease receivables and bank borrowings. Due to their short-term nature, their carrying values approximate their fair values.
For disclosure purpose, the fair values of non-current portion of loans receivable, finance lease receivables and bank borrowings as well as loan from non-controlling shareholder are not materially different from their carrying values. Those fair values have been determined by using discounted cash flow models and are classified as level 3 in the fair value hierarchy. Significant inputs include the discount rate used to reflect the credit risks of the Group and the counterparties, where appropriate.
54. FINANCIAL RISK MANAGEMENT54.1 Financial risk management objectives and policies
The Group’s activities expose it to a variety of financial risks which comprise market risk (including foreign currency risk, price risk, and interest rate risk), credit risk and liquidity risk. The Group’s overall risk management focuses on the unpredictability of financial markets and seeks to minimise potential adverse effects on the Group’s financial performance. Risk management is carried out by key management under the policies approved by the board of directors. The Group does not have written risk management policies. However, the directors and senior management of the Group meet regularly to identify and evaluate risks and to formulate strategies to manage financial risks.
54.2 Market risk(i) Foreign currency risk
Currency risk refers to the risk that the fair value or future cash flows of a financial instrument will fluctuate because of changes in foreign exchange rates. The Group mainly operates in Hong Kong and the PRC. The functional currency of the Company and its subsidiaries are mainly HK$ and RMB with certain of their business transactions being settled in US$ and RMB. The Group is thus exposed to currency risk arising from fluctuations on foreign currencies, primarily US$ and RMB, against the functional currency of the Company and the group entities. Currently the Group does not have foreign currency hedging policy but the management continuously monitors foreign exchange exposure and will consider hedging significant foreign currency exposure should the need arise.
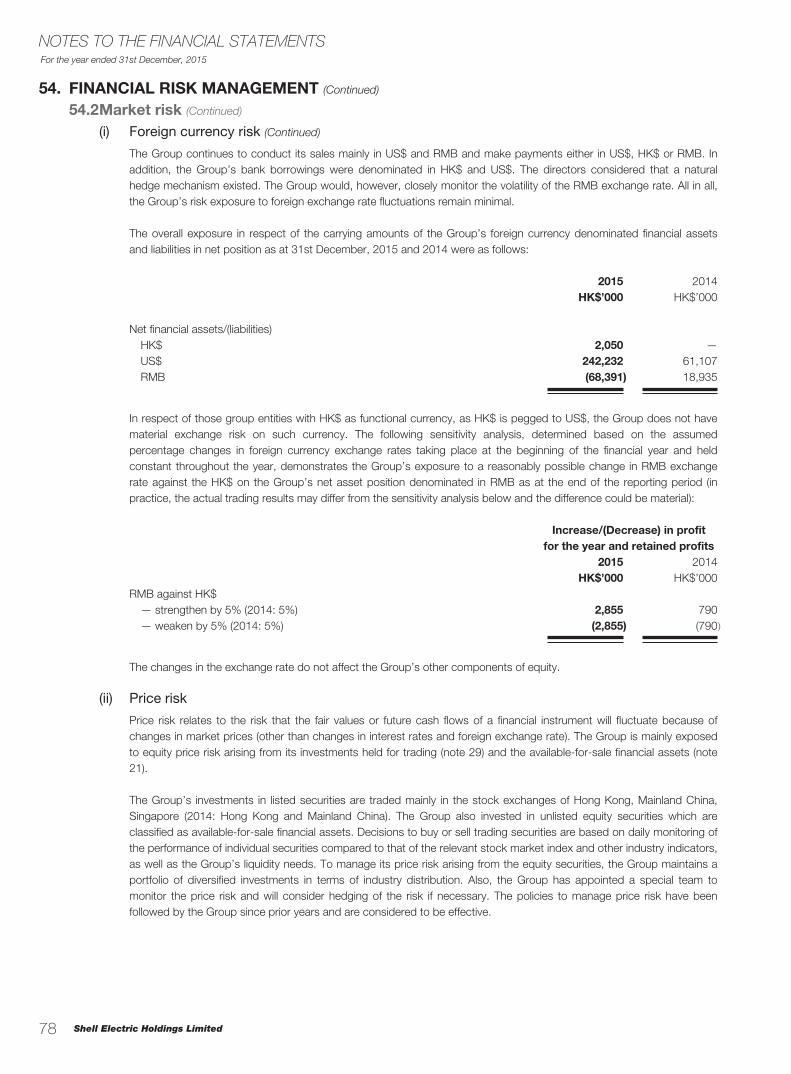
Shell Electric Holdings Limited
For the year ended 31st December, 2015
78
NOTES TO THE FINANCIAL STATEMENTS
54. FINANCIAL RISK MANAGEMENT (Continued)
54.2 Market risk (Continued)
(i) Foreign currency risk (Continued)
The Group continues to conduct its sales mainly in US$ and RMB and make payments either in US$, HK$ or RMB. In addition, the Group’s bank borrowings were denominated in HK$ and US$. The directors considered that a natural hedge mechanism existed. The Group would, however, closely monitor the volatility of the RMB exchange rate. All in all, the Group’s risk exposure to foreign exchange rate fluctuations remain minimal.
The overall exposure in respect of the carrying amounts of the Group’s foreign currency denominated financial assets and liabilities in net position as at 31st December, 2015 and 2014 were as follows:
2015 2014HK$’000 HK$’000
Net financial assets/(liabilities) HK$ 2,050 — US$ 242,232 61,107 RMB (68,391) 18,935
In respect of those group entities with HK$ as functional currency, as HK$ is pegged to US$, the Group does not have material exchange risk on such currency. The following sensitivity analysis, determined based on the assumed percentage changes in foreign currency exchange rates taking place at the beginning of the financial year and held constant throughout the year, demonstrates the Group’s exposure to a reasonably possible change in RMB exchange rate against the HK$ on the Group’s net asset position denominated in RMB as at the end of the reporting period (in practice, the actual trading results may differ from the sensitivity analysis below and the difference could be material):
Increase/(Decrease) in profitfor the year and retained profits
2015 2014HK$’000 HK$’000
RMB against HK$ — strengthen by 5% (2014: 5%) 2,855 790 — weaken by 5% (2014: 5%) (2,855) (790)
The changes in the exchange rate do not affect the Group’s other components of equity.
(ii) Price risk
Price risk relates to the risk that the fair values or future cash flows of a financial instrument will fluctuate because of changes in market prices (other than changes in interest rates and foreign exchange rate). The Group is mainly exposed to equity price risk arising from its investments held for trading (note 29) and the available-for-sale financial assets (note 21).
The Group’s investments in listed securities are traded mainly in the stock exchanges of Hong Kong, Mainland China, Singapore (2014: Hong Kong and Mainland China). The Group also invested in unlisted equity securities which are classified as available-for-sale financial assets. Decisions to buy or sell trading securities are based on daily monitoring of the performance of individual securities compared to that of the relevant stock market index and other industry indicators, as well as the Group’s liquidity needs. To manage its price risk arising from the equity securities, the Group maintains a portfolio of diversified investments in terms of industry distribution. Also, the Group has appointed a special team to monitor the price risk and will consider hedging of the risk if necessary. The policies to manage price risk have been followed by the Group since prior years and are considered to be effective.
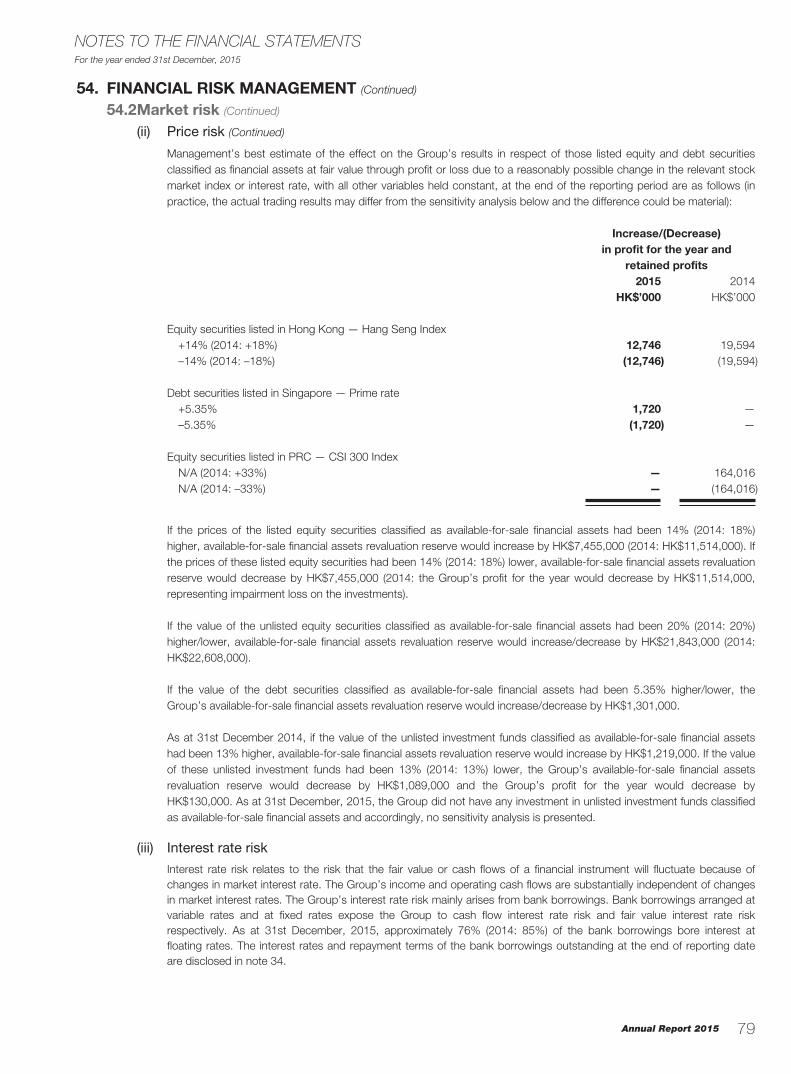
Annual Report 2015
For the year ended 31st December, 2015
79
NOTES TO THE FINANCIAL STATEMENTS
54. FINANCIAL RISK MANAGEMENT (Continued)
54.2 Market risk (Continued)
(ii) Price risk (Continued)
Management’s best estimate of the effect on the Group’s results in respect of those listed equity and debt securities classified as financial assets at fair value through profit or loss due to a reasonably possible change in the relevant stock market index or interest rate, with all other variables held constant, at the end of the reporting period are as follows (in practice, the actual trading results may differ from the sensitivity analysis below and the difference could be material):
Increase/(Decrease) in profit for the year and
retained profits2015 2014
HK$’000 HK$’000
Equity securities listed in Hong Kong — Hang Seng Index +14% (2014: +18%) 12,746 19,594 –14% (2014: –18%) (12,746) (19,594)
Debt securities listed in Singapore — Prime rate +5.35% 1,720 — –5.35% (1,720) —
Equity securities listed in PRC — CSI 300 Index N/A (2014: +33%) — 164,016 N/A (2014: –33%) — (164,016)
If the prices of the listed equity securities classified as available-for-sale financial assets had been 14% (2014: 18%) higher, available-for-sale financial assets revaluation reserve would increase by HK$7,455,000 (2014: HK$11,514,000). If the prices of these listed equity securities had been 14% (2014: 18%) lower, available-for-sale financial assets revaluation reserve would decrease by HK$7,455,000 (2014: the Group’s profit for the year would decrease by HK$11,514,000, representing impairment loss on the investments).
If the value of the unlisted equity securities classified as available-for-sale financial assets had been 20% (2014: 20%) higher/lower, available-for-sale financial assets revaluation reserve would increase/decrease by HK$21,843,000 (2014: HK$22,608,000).
If the value of the debt securities classified as available-for-sale financial assets had been 5.35% higher/lower, the Group’s available-for-sale financial assets revaluation reserve would increase/decrease by HK$1,301,000.
As at 31st December 2014, if the value of the unlisted investment funds classified as available-for-sale financial assets had been 13% higher, available-for-sale financial assets revaluation reserve would increase by HK$1,219,000. If the value of these unlisted investment funds had been 13% (2014: 13%) lower, the Group’s available-for-sale financial assets revaluation reserve would decrease by HK$1,089,000 and the Group’s profit for the year would decrease by HK$130,000. As at 31st December, 2015, the Group did not have any investment in unlisted investment funds classified as available-for-sale financial assets and accordingly, no sensitivity analysis is presented.
(iii) Interest rate risk
Interest rate risk relates to the risk that the fair value or cash flows of a financial instrument will fluctuate because of changes in market interest rate. The Group’s income and operating cash flows are substantially independent of changes in market interest rates. The Group’s interest rate risk mainly arises from bank borrowings. Bank borrowings arranged at variable rates and at fixed rates expose the Group to cash flow interest rate risk and fair value interest rate risk respectively. As at 31st December, 2015, approximately 76% (2014: 85%) of the bank borrowings bore interest at floating rates. The interest rates and repayment terms of the bank borrowings outstanding at the end of reporting date are disclosed in note 34.
Shell Electric Holdings Limited
For the year ended 31st December, 2015
80
NOTES TO THE FINANCIAL STATEMENTS
54. FINANCIAL RISK MANAGEMENT (Continued)
54.2 Market risk (Continued)
(iii) Interest rate risk (Continued)
The Group’s bank balances also expose it to cash flow interest rate risk due to the fluctuation of the prevailing market interest rate on the bank balances. The directors consider the Group’s exposure on bank deposits and bank borrowings to fair value interest rate risk is not significant as interest-bearing bank deposits and borrowings at fixed rate are within short maturity periods in general.
The Group currently does not have an interest rate hedging policy. However, the management monitors interest rate exposure and will consider hedging significant interest rate exposure should the need arise.
The following sensitivity demonstrates the Group’s exposure to a reasonably possible change in interest rates on its floating rate bank borrowings with all other variables held constant at the end of the reporting period (in practice, the actual trading results may differ from the sensitivity analysis below and the difference could be material):
2015 2014HK$’000 HK$’000
Increase/(Decrease) in profit for the year and retained profits +50 basis point (“bp”) (2014: +50 bp) (3,270) (3,661) –10 bp (2014: –10 bp) 586 652
The changes in interest rates do not affect the Group’s other components of equity.
The above sensitivity analysis is prepared based on the assumption that the borrowing period of borrowings outstanding at the end of the reporting period resembles that of the current financial year.
54.3 Credit riskCredit risk refers to the risk that the counterparty to a financial instrument would fail to discharge its obligation under the terms of the financial instrument and cause a financial loss to the Group. The Group’s exposure to credit risk mainly arises from granting credit to customers in the ordinary course of its operations and from its investing activities.
The Group limits its exposure to credit risk by rigorously selecting the counterparties and to deal with credit worthy counterparties. Since the Group trades only with recognised and creditworthy third parties, there is no requirement for collateral. Credit terms are granted to new customers after credit worthiness assessment. The Group performs ongoing credit evaluation on the financial condition of its debtors and tightly monitors the ageing of the receivable balances. Follow up action is taken in case of overdue balances. In addition, management reviews the recoverable amount of the receivables individually and collectively at the end of each reporting period to ensure that adequate impairment losses are made for irrecoverable amounts. Credit risk on cash and bank balances and restricted bank deposit (note 30) is mitigated as cash is deposited in banks of high credit rating. As to investment strategies, usually investments are liquid securities quoted on recognised stock exchanges. As to unlisted securities, investment is made after credit assessment by investment team. The credit and investment policies have been followed by the Group since prior years and are considered to have been effective in limiting the Group’s exposure to credit risk to a desirable level.
Concentration of credit risk is managed by the customer or counterparty. At 31st December, 2015, 21% (2014: 32%) of the total trade receivables was due from the Group’s largest customer (determined by sale) within the business segment — electrical appliances and electronic components.
Further quantitative data in respect of the Group’s exposure to credit risk arising from trade and bills receivables, and other receivables are disclosed in note 27.
54.4 Liquidity riskLiquidity risk relates to the risk that the Group will not be able to meet its obligations associated with its financial liabilities that are settled by delivering cash or another financial asset. The Group is exposed to liquidity risk in respect of settlement of trade and other payables and its financing obligations, and also in respect of its cash flow management. The Group’s objective is to maintain a prudent liquidity risk management which is to maintain sufficient cash and cash equivalents as well as to make available of fund through adequate amounts of committed credit facilities and the ability to close out market positions. The Group’s policy is to regularly monitor its liquidity requirements and its compliance with lending covenants, to ensure that it maintains sufficient reserves of cash and readily realisable marketable securities and adequate committed lines of funding from major financial institutions to meet its liquidity requirements in the short and longer term. The liquidity policies have been followed by the Group since prior years and are considered to have been effective in managing liquidity risk.
Annual Report 2015
For the year ended 31st December, 2015
81
NOTES TO THE FINANCIAL STATEMENTS
54. FINANCIAL RISK MANAGEMENT (Continued)
54.4 Liquidity risk (Continued)
The table below analyses the remaining contractual maturities of the Group’s financial liabilities at the end of the reporting period which are based on contractual undiscounted cash flows and the earliest date the Group may be required to pay:
Repayable on demand or less than
1 year1 to
2 years2 to
5 yearsOver
5 years
Total contractual
undiscounted cash flow
Carrying amount
HK$’000 HK$’000 HK$’000 HK$’000 HK$’000 HK$’000
As at 31st December, 2015Non-derivative financial liabilitiesInterest-bearing bank borrowings (note) 416,724 626,581 — — 1,043,305 1,021,435Trade payables 120,662 — — — 120,662 120,662Other payables and accruals 283,019 — — — 283,019 283,019Amounts due to joint venture 60 — — — 60 60Amount due to an investee 8 — — — 8 8Amount due to a related party 291 — — — 291 291Amount due to a director 43,484 — — — 43,484 43,484Loan from non-controlling shareholder — — — 5,402 5,402 5,402
864,248 626,581 — 5,402 1,496,231 1,474,361
Derivatives settled net:Forward exchange contracts 1,694 9,453 — — 11,147 11,147
As at 31st December, 2014Non-derivative financial liabilitiesInterest-bearing bank borrowings (note) 477,306 54,182 554,031 — 1,085,519 1,027,325Trade payables 87,948 — — — 87,948 87,948Other payables and accruals 317,197 — — — 317,197 317,197Amount due to a related party 291 — — — 291 291Amount due to a director 43,484 — — — 43,484 43,484Other liabilities 187 — — — 187 187Loan from non-controlling shareholder — — — 5,406 5,406 5,406
926,413 54,182 554,031 5,406 1,540,032 1,481,838
Derivatives settled net:Forward exchange contracts — 6,632 — — 6,632 6,632
Note:
For certain term loans which contain a repayment on demand clause which can be exercised at the lender’s sole discretion, the analysis above shows the cash outflow based on the earliest period in which the Group can be required to pay, that is if the lenders were to invoke their unconditional rights to call the loans with immediate effect.
The following table summaries the maturity analysis of term loans with a repayment on demand clause based on agreed scheduled repayments set out in the loan agreements. The amounts include interest payments computed using contractual rates. Taking into account the Group’s financial position, the directors do not consider that it is probable that the banks or financial institutions will exercise their discretion to demand immediate repayment. The directors believe that such term loans will be repaid in accordance with the scheduled repayment dates set out in the loan agreements.
Maturity analysis — bank borrowings based on scheduled repayments
Within 1 yearIn 2 to
5 yearsMore than
5 years
Total contractual undiscounted cash outflows
Total carrying amount
HK$’000 HK$’000 HK$’000 HK$’000 HK$’000
31st December, 2015 348,473 727,763 — 1,076,236 1,021,435
31st December, 2014 264,362 834,349 8,378 1,107,089 1,027,325
Shell Electric Holdings Limited
For the year ended 31st December, 2015
82
NOTES TO THE FINANCIAL STATEMENTS
55. PARTICULARS OF PRINCIPAL SUBSIDIARIESThe particulars of the principal subsidiaries as at 31st December, 2015 are as follows:
Name of subsidiaries
Place of incorporation/operation
Class ofshares held
Paid up issued/registered capital
Percentage of issued/registered capital held
by the CompanyPrincipal activitiesDirectly Indirectly
Atlantic Property Limited USA Ordinary 500 shares of US$1 each
— 100% Property investment
China Dynasty Development Ltd British Virgin Islands
Ordinary 1,000 shares of US$1 each
— 100% Property investment
Charm Harvest Development Limited Hong Kong Ordinary HK$1 — 100% Property investment
Extra-Fund Investment Limited Hong Kong Ordinary HK$2 100% — Securities trading
Famous Union Limited Hong Kong Ordinary HK$10,000 — 100% Property development
Fast-Gain Overseas Limited British Virgin Islands
Ordinary 1 share of US$1 — 100% Property investment
Fortress Link Investment Limited Hong Kong Ordinary HK$1 — 100% Property development
Full Revenue Inc. Samoa Ordinary 1 share of US$1 100% — Investment holding
Galactic Computing Corporation British Virgin Islands
Ordinary 23,861,240 shares of US$0.01 each
— 100% Investment holding
Grand Sea Development Limited Hong Kong Ordinary HK$1 — 100% Investment holding
Guangzhou SMC Car Rental Company Limited
PRC^ Paid up capital
HK$145,000,000 — 100% Taxi operations
Netlink Assets Limited British Virgin Islands
Ordinary 1 share of US$1 — 100% Investment holding
New Style Development Limited Hong Kong Ordinary HK$1 — 100% Property development
NImboxx Inc USA Paid up capital
US$100,000 — 100% Computer hardware and software development
PFC Device Corporation British Virgin Islands
Preferred 4,956,153 shares of US$5,522,820
— 100% Research and development and sales of power discrete semiconductors
Common 105,000 shares of US$105,000
PFC Device Holdings Limited British Virgin Islands
Preferred 4,956,153 shares of US$5,522,820
— 95.5% Investment and trade mark holding
Common 105,000 shares of US$105,000
PFC Device (HK) Limited Hong Kong Ordinary HK$1 — 100% Sales of power discrete semiconductors
Quanta Global Limited British Virgin Islands/ Hong Kong
Ordinary 1 share of US$1 — 100% Trading of electric fans
Shell Electric Mfg. (China) Company Limited
British Virgin Islands
Ordinary 100 shares of US$10 each
— 100% Trading of electric fans
Shell Electric Mfg. (H.K.) Company Limited
Hong Kong Ordinary HK$10,000 100% — Trading of electric fans
Shunde Hua Feng Stainless Steel Welded Tubes Limited
PRC* Paid up capital
US$6,792,000 — 90.1% Property investment
Silvergate Global Limited British Virgin Islands
Ordinary 1 share of US$1 — 100% Investment holding
Annual Report 2015
For the year ended 31st December, 2015
83
NOTES TO THE FINANCIAL STATEMENTS
Name of subsidiaries
Place of incorporation/operation
Class ofshares held
Paid up issued/registered capital
Percentage of issued/registered capital held
by the CompanyPrincipal activitiesDirectly Indirectly
SMC Investments Limited Hong Kong Ordinary HK$2 — 100% Property investment
SMC Marketing Corp. USA Ordinary 10,000 shares of US$1,021 each
100% — Marketing of the Group’s products
SMC Multi-Media Products Company Limited
British Virgin Islands
Ordinary 1 share of US$1 100% — Investment holding
SMC Multi-Media (H.K.) Limited Hong Kong Ordinary HK$2 — 100% Contract manufacturing for optics and imaging
SMC Multi-Media Trading Company Limited
Hong Kong Ordinary HK$1 — 100% Contract manufacturing for optics and imaging
SMC Property Investment Limited Hong Kong Ordinary HK$2 100% — Investment holding
Speed Power Limited Hong Kong Ordinary HK$2 — 100% Trading of electric fans
Sunny Resource Limited Hong Kong Ordinary HK$1 100% — Holding trade mark and patent of the Group
Sybond Venture Limited Cayman Islands Ordinary 1 share of US$1 100% — Investment holding
Timely Hero Limited Samoa Ordinary 1 share of US$1 100% — Investment holding
Vineyard Management Company USA Ordinary 1,000 shares of US$10 each
— 100% Property investment
Wellfame Development Limited Hong Kong Ordinary HK$1 — 100% Property development
佛山市順德區蜆華多媒體製品
有限公司
PRC^ Paid up capital
US$20,870,000 — 100% Manufacturing and trading of electrical appliances
業盈置業(深圳)有限公司 PRC^ Paid up capital
HK$10,000,000 — 100% Property investment
蜆壳星盈科技(深圳)有限公司 PRC^ Paid up capital
HK$90,000,000 — 100% Computer software and hardware development
佛山市順德區國潤投資有限公司 PRC# Paid up capital
RMB600,000 — 100% Investment holding
廣東匯泓投資有限公司 PRC# Paid up capital
RMB11,160,000 — 100% Investment holding
廣東普福斯節能元件有限公司 PRC^ Paid up capital
US$1,800,000 — 95.5% Manufacturing and sales of power discrete semiconductors
廣州匯朗物業管理有限公司 PRC# Paid up capital
RMB1,000,000 — 100% Property investment and development
普福斯電子元件(深圳)有限公司 PRC^ Paid up capital
US$300,000 — 95.5% Design and trading of power discrete semiconductors and electronic components
廣州市百聯汽車租賃有限公司 PRC# Paid up capital
RMB5,000,000 — 100% Chauffeured limousine rental business
^ The companies are incorporated in the PRC as wholly-owned foreign enterprises.* The company is incorporated in the PRC as sino-foreign equity joint ventures.# The companies are incorporated in the PRC as limited liability companies.
55. PARTICULARS OF PRINCIPAL SUBSIDIARIES (Continued)
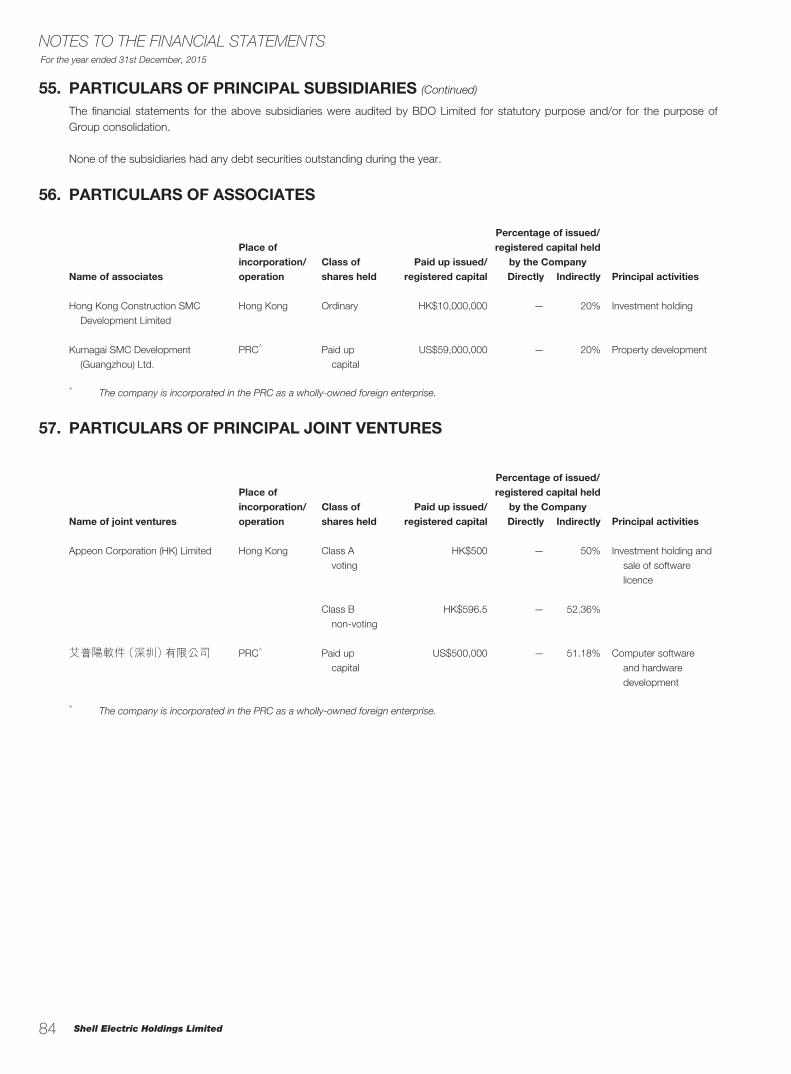
Shell Electric Holdings Limited
For the year ended 31st December, 2015
84
NOTES TO THE FINANCIAL STATEMENTS
55. PARTICULARS OF PRINCIPAL SUBSIDIARIES (Continued)
The financial statements for the above subsidiaries were audited by BDO Limited for statutory purpose and/or for the purpose of Group consolidation.
None of the subsidiaries had any debt securities outstanding during the year.
56. PARTICULARS OF ASSOCIATES
Name of associates
Place of incorporation/operation
Class ofshares held
Paid up issued/registered capital
Percentage of issued/registered capital held
by the CompanyPrincipal activitiesDirectly Indirectly
Hong Kong Construction SMC Development Limited
Hong Kong Ordinary HK$10,000,000 — 20% Investment holding
Kumagai SMC Development (Guangzhou) Ltd.
PRC^ Paid up capital
US$59,000,000 — 20% Property development
^ The company is incorporated in the PRC as a wholly-owned foreign enterprise.
57. PARTICULARS OF PRINCIPAL JOINT VENTURES
Name of joint ventures
Place of incorporation/operation
Class ofshares held
Paid up issued/registered capital
Percentage of issued/registered capital held
by the CompanyPrincipal activitiesDirectly Indirectly
Appeon Corporation (HK) Limited Hong Kong Class A voting
HK$500 — 50% Investment holding and sale of software licence
Class B non-voting
HK$596.5 — 52.36%
艾普陽軟件(深圳)有限公司 PRC^ Paid up capital
US$500,000 — 51.18% Computer software and hardware development
^ The company is incorporated in the PRC as a wholly-owned foreign enterprise.