Embed Size (px)
Citation preview
● Propensity score matching …………………………… 1
● Sample Size calculation …………………………………25
● 통계적방법 및 논문작성 ……………………………………55
차 례차 례
●●● 삼성서울병원 교육수련부 / 통계지원팀 ●●●
2011 의학통계 교육 (Special Topic)

●●● 삼성서울병원 교육수련부 / 통계지원팀 ●●●
2011 의학통계 교육 (기초)
●●● 삼성서울병원 교육수련부 / 통계지원팀 ●●●
2011 의학통계 교육 (Special Topic)
Propensity score matching
- 1 -

2011 의학통계 교육 (Special Topic) ◀
ContentsContents1. Introduction
관찰연 의- 관찰연구(Observational study) 의 bias control
2 P it 정의 & 추정방법2. Propensity score – 정의 & 추정방법
3. Propensity score – 사용법
4. 주의할점, FAQ
2
Propensity score matchingPropensity score matching
1
- 3 -
▶ 삼성서울병원 교육수련부/통계지원팀
RCT 처럼 관찰연구에서도RCT 처럼… 관찰연구에서도
Confounding bias를보정하고Regression, restriction, matching, stratification, etc..g g
Selection bias를보정하자Selection bias를보정하자.matching, stratification, etc.. (are not perfect)
4
RCT vs Observational studyRCT vs Observational studyRandomized clinical trial
공변량과무관하게무작위배정
Outcome에대한영향중 treatment 외의다른변수(공변량)에의한혼란이발생할가능성이작다 란이발생할가능성이작다.
Selection bias가나타날가능성이작다. - 만약 Follow up loss 가많이일어난다면? Bias가발생하는것.
관찰연구관찰연구(Observational study)Baseline covariate’s imbalance
관찰된다른변량들이결과변수에영향을끼치고있음관찰된다른변량들이결과변수에영향을끼치고있음.
대부분의경우 selection bias가존재함.
3
- 4 -
2011 의학통계 교육 (Special Topic) ◀
Adjusting Confoundings WeaknessAdjusting Confoundings - Weakness1. Data 구축단계에서- matching, stratification
1) 충분한크기의대조군을 확보하기힘들수있음 1) 충분한크기의대조군을 확보하기힘들수있음. 동일한 control subject 를찾지못할수있음. (substantial case-subject loss)
2) Matching 할공변량이많을경우 (Multi-variate matching)모든공변량이일치하는 subject 들을찾는것은불가능할수도있음.
3) Overmatching (non-confounding variable을기준으로 matching할경우)
2. 분석단계에서- multivariable analysis (ex: multiple logistic regression)1) 공변량이너무많을경우
문제점(overestimation, underestimation, poor SE)2) bias reduction 이완벽하지않을수있다.
Treatment effect의추정 or 검정이정확하지않을수있다 Treatment effect의추정 or 검정이정확하지않을수있다. 3) Selection bias를해결할수없음.
6
Observational study control confounding bias– control confounding bias
Outcome : 폐암의발생여부
석면 출여부Independent variable: 석면노출여부
Confounding variable: 흡연유무
Regression : multiple logistic regressionCancer = intercept + asbestos + smoking + errorCancer = intercept + asbestos + smoking + error
M hi (S ifi i )Matching (Stratification)1) asbestos with smoking VS non-asbestos with smoking
2) b t ith ki VS b t ith ki2) asbestos with non-smoking VS non-asbestos with non-smoking
1)과 2)로생성된 dataset에대한 stratified analysis
5
- 5 -
▶ 삼성서울병원 교육수련부/통계지원팀
Propensity score (경향 점수) definitionPropensity score (경향 점수) definition.T: treatment 또는관심비교 groupX: covariateX: covariate
Probability(T=1|X) = a function of X공변량 X 가주어졌을때 treatment 를받을확률 (0<ps<1)공변량 가주어졌을때 를받을확률 ( p )공변량 X로이루어진점수
The dimension reduction of covariates X
N(표본크기( 수)) P(공변량의개수 X의열수) d iN(표본크기(n수)) x P(공변량의개수, X의열수) data matrixN x 1(propensity score) vector
8
두집단간유사하게설정해야할공변량이많은경우
Propensity score method 를고려함.
7
- 6 -
2011 의학통계 교육 (Special Topic) ◀
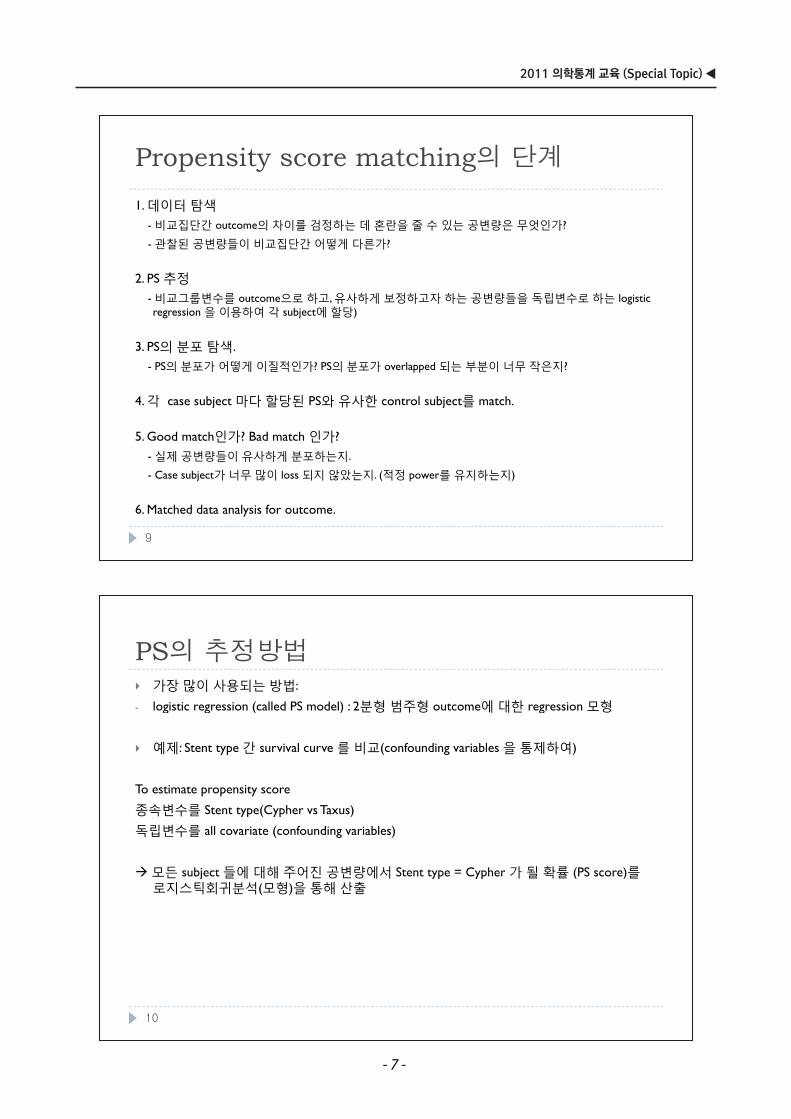
PS의 추정방법PS의 추정방법가장많이사용되는방법:
logistic regression (called PS model) : 2분형범주형 outcome에대한 regression 모형- logistic regression (called PS model) : 2분형범주형 outcome에대한 regression 모형
예제: Stent type 간 survival curve 를비교(confounding variables 을통제하여)
To estimate propensity score
종속변수를 Stent type(Cypher vs Taxus)
독립변수를 all covariate (confounding variables)
모든 subject 들에대해주어진공변량에서 Stent type = Cypher 가될확률 (PS score)를모든 subject 들에대해주어진공변량에서 Stent type = Cypher 가될확률 (PS score)를로지스틱회귀분석(모형)을통해산출
10
Propensity score matching의 단계p y g
1. 데이터탐색- 비교집단간 outcome의차이를검정하는데혼란을줄수있는공변량은무엇인가?- 비교집단간 outcome의차이를검정하는데혼란을줄수있는공변량은무엇인가?
- 관찰된공변량들이비교집단간어떻게다른가?
2. PS 추정2. PS 추정- 비교그룹변수를 outcome으로하고, 유사하게보정하고자하는공변량들을독립변수로하는 logistic regression 을이용하여각 subject에할당)
3. PS의분포탐색. - PS의분포가어떻게이질적인가? PS의분포가 overlapped 되는부분이너무작은지?
4. 각 case subject 마다할당된 PS와유사한 control subject를 match.
5. Good match인가? Bad match 인가?- 실제공변량들이유사하게분포하는지.
- Case subject가너무많이 loss 되지않았는지. (적정 power를유지하는지)
6. Matched data analysis for outcome.
9
- 7 -
▶ 삼성서울병원 교육수련부/통계지원팀
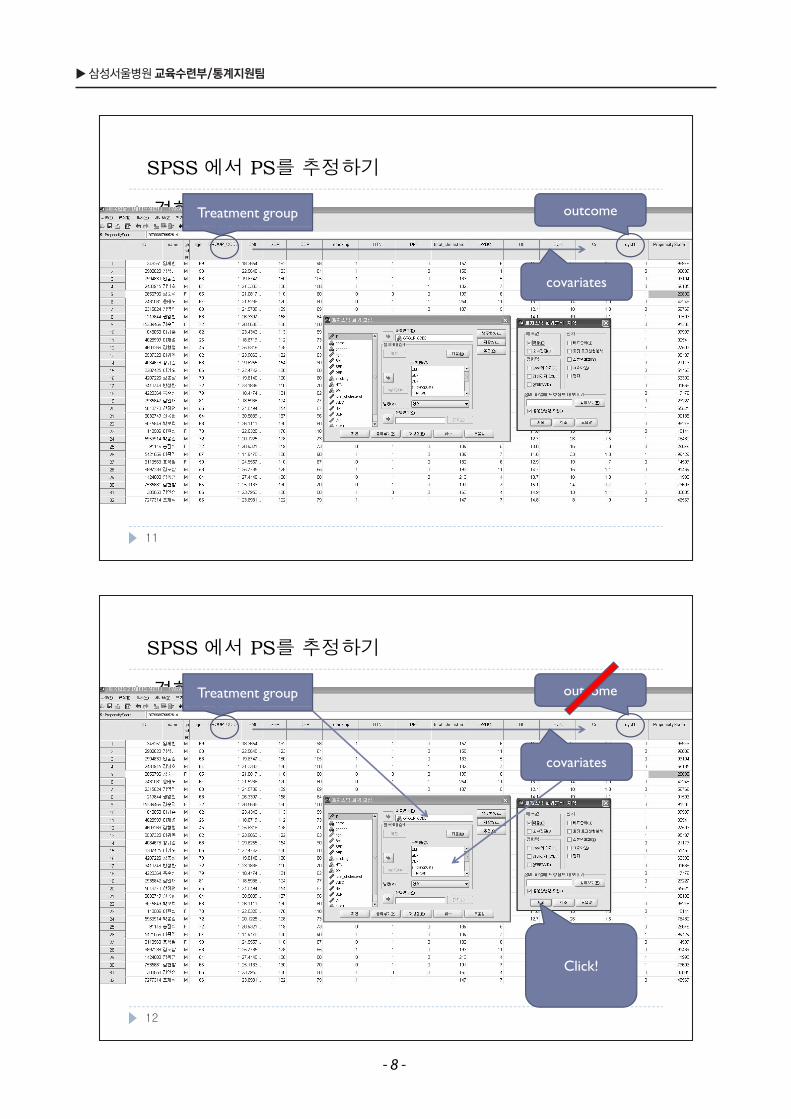
SPSS 에서 PS를 추정하기
경향(성향) 점수Treatment group outcome
SPSS 에서 PS를 추정하기
Treatment 를받을확률(점수)Exposed group 에속할확률
covariatesProbability(T=1|X) = a function of X
->공변량X 가주어졌을때 treatment 를받을확률 = X로이
covariates
루어진함수estimated by logistic regression
Click!
12
SPSS 에서 PS를 추정하기
경향(성향) 점수Treatment group outcome
SPSS 에서 PS를 추정하기
Treatment 를받을확률(점수)Exposed group 에속할확률
covariatesProbability(T=1|X) = a function of X
->공변량X 가주어졌을때 treatment 를받을확률 = X로이
covariates
루어진함수estimated by logistic regression
11
- 8 -
2011 의학통계 교육 (Special Topic) ◀
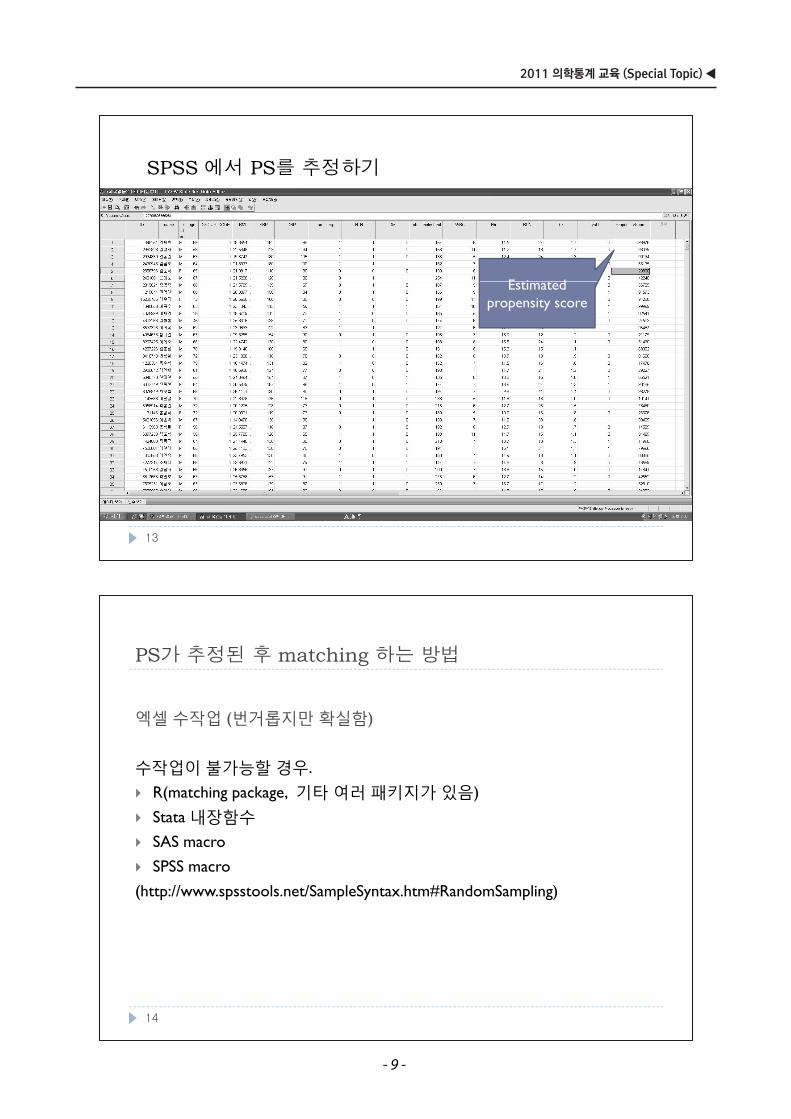
PS가 추정된 후 t hi 하는 방법PS가 추정된 후 matching 하는 방법
엑셀수작업 (번거롭지만확실함)
수작업이불가능할경우 수작업이불가능할경우.
R(matching package, 기타여러패키지가있음)
Stata 내장함수Stata 내장함수SAS macro
SPSS macro
(http://www.spsstools.net/SampleSyntax.htm#RandomSampling)
14
SPSS 에서 PS를 추정하기
경향(성향) 점수
SPSS 에서 PS를 추정하기
Treatment 를받을확률(점수)Exposed group 에속할확률
E ti t d Probability(T=1|X) = a function of X
->공변량X 가주어졌을때 treatment 를받을확률 = X로이
Estimated propensity score
루어진함수estimated by logistic regression
13
- 9 -
▶ 삼성서울병원 교육수련부/통계지원팀
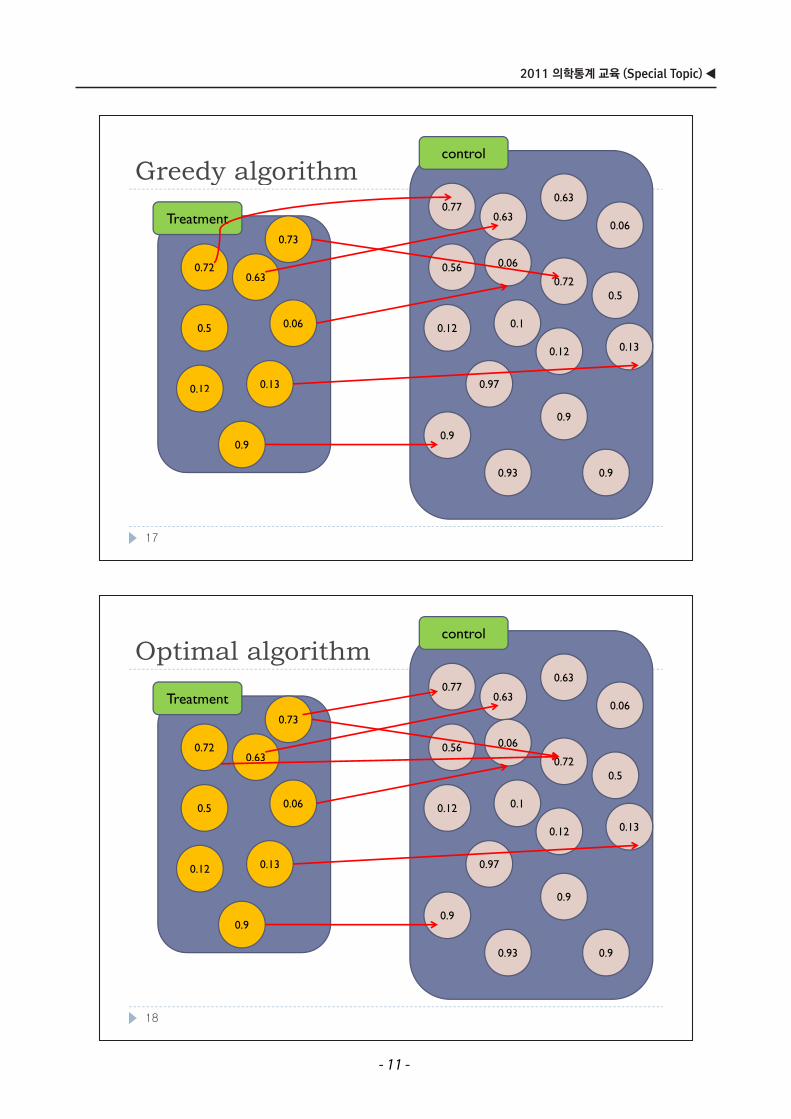
M t hi l ith i tMatching algorithm using computer
Greedy algorithmOptimal algorithmp g
16
잠깐 정리잠깐 정리.PS matching이란.
Matching 기준변수로 PS를이용하는것.
공변량이 age만있는경우?
Age로 ps를추정하여, ps matching 하는것과g p 를추정하여, p g 하는것과
age matching 은같은결과.
15
- 10 -
2011 의학통계 교육 (Special Topic) ◀
Optimal algorithmcontrol
Optimal algorithm0.77
0.63
0.63
0 06Treatment
0.720.63
0.56 0.06
0 72
0.060.73
0.5 0.06 0.12 0.1
0.720.5
0.12 0.13 0.97
0.12 0.13
0.
0.9
0.9
0.90.9
0.93 0.9
18
Greedy algorithmcontrol
Greedy algorithm0.77
0.63
0.63
0 06Treatment
0.720.63
0.56 0.06
0 72
0.060.73
0.5 0.06 0.12 0.1
0.720.5
0.12 0.13 0.97
0.12 0.13
0.
0.9
0.9
0.90.9
0.93 0.9
17
- 11 -
▶ 삼성서울병원 교육수련부/통계지원팀
How many of control subject?How many of control subject?
을위해서는 집단을충분히확Good matching 을위해서는 Control 집단을충분히확보!
~ therefore the rule of thumb is to choose a control data set at most nine ~ therefore, the rule of thumb is to choose a control data set at most nine times as large as the treatment group, ~
적절한검정력을갖는 sample size 산출가능
20
1:n matching1:n matching1:1 Matching vs 1:2 Matching
같은수의 들을 와 한다면 가같은수의 case subjets 들을 control subjects와 matching 한다면, 1:2 가더좋은 power(검정력)을가지게됨.
Case 와유사한 subject 를찾는것이힘들다면? Case 와유사한 subject 를찾는것이힘들다면? 더많은 case subject 가누락됨.
1:5 이상은 ? case 수가변하지않는다면, 많을수록좋아지지만, 그정도가미미함 정도가미미함.
19
- 12 -
2011 의학통계 교육 (Special Topic) ◀
Matching data descriptionb l t t C i t ’ t t- balance test>>Covariate’ status
Total Population Propensity-matched Population
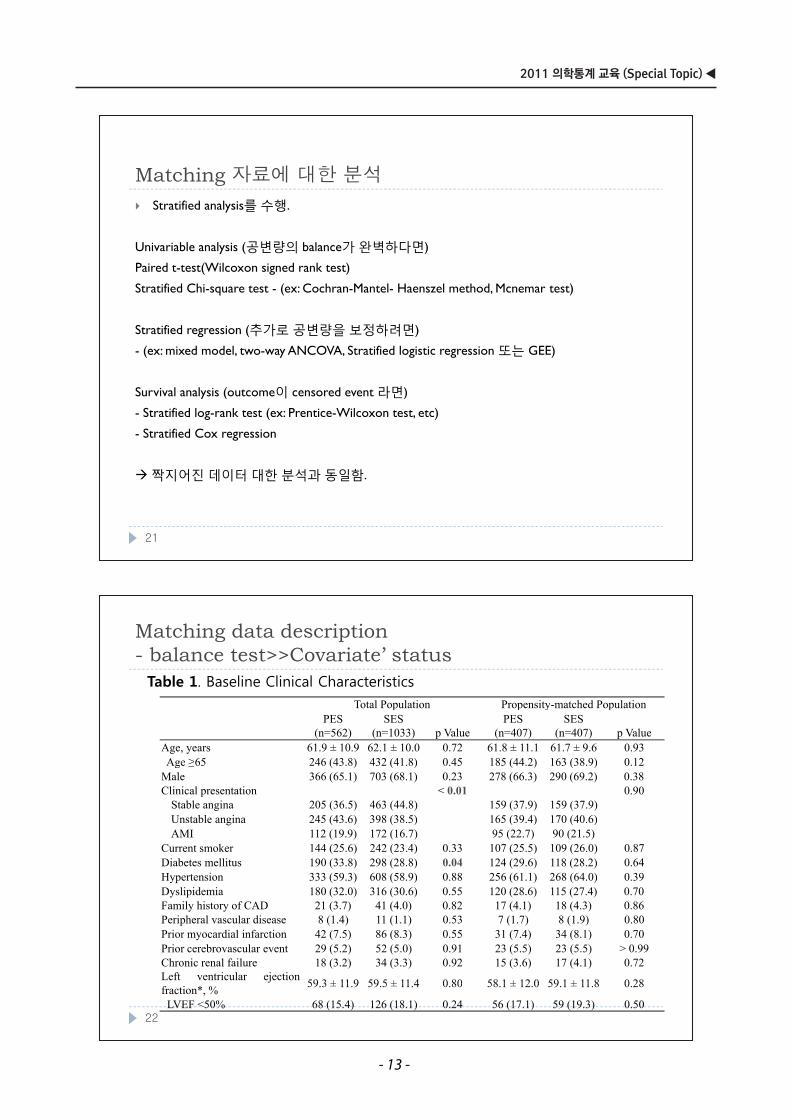
Table 1. Baseline Clinical CharacteristicsTotal Population Propensity matched Population
PES(n=562)
SES(n=1033) p Value
PES(n=407)
SES(n=407) p Value
Age, years 61.9 ± 10.9 62.1 ± 10.0 0.72 61.8 ± 11.1 61.7 ± 9.6 0.93Age ≥65 246 (43 8) 432 (41 8) 0 45 185 (44 2) 163 (38 9) 0 12Age ≥65 246 (43.8) 432 (41.8) 0.45 185 (44.2) 163 (38.9) 0.12
Male 366 (65.1) 703 (68.1) 0.23 278 (66.3) 290 (69.2) 0.38Clinical presentation < 0.01 0.90
Stable angina 205 (36.5) 463 (44.8) 159 (37.9) 159 (37.9)U t bl i 245 (43 6) 398 (38 5) 165 (39 4) 170 (40 6)Unstable angina 245 (43.6) 398 (38.5) 165 (39.4) 170 (40.6)AMI 112 (19.9) 172 (16.7) 95 (22.7) 90 (21.5)
Current smoker 144 (25.6) 242 (23.4) 0.33 107 (25.5) 109 (26.0) 0.87Diabetes mellitus 190 (33.8) 298 (28.8) 0.04 124 (29.6) 118 (28.2) 0.64
i ( ) ( ) ( ) ( )Hypertension 333 (59.3) 608 (58.9) 0.88 256 (61.1) 268 (64.0) 0.39Dyslipidemia 180 (32.0) 316 (30.6) 0.55 120 (28.6) 115 (27.4) 0.70Family history of CAD 21 (3.7) 41 (4.0) 0.82 17 (4.1) 18 (4.3) 0.86Peripheral vascular disease 8 (1.4) 11 (1.1) 0.53 7 (1.7) 8 (1.9) 0.80Prior myocardial infarction 42 (7.5) 86 (8.3) 0.55 31 (7.4) 34 (8.1) 0.70Prior cerebrovascular event 29 (5.2) 52 (5.0) 0.91 23 (5.5) 23 (5.5) > 0.99Chronic renal failure 18 (3.2) 34 (3.3) 0.92 15 (3.6) 17 (4.1) 0.72Left ventricular ejection 59 3 ± 11 9 59 5 ± 11 4 0 80 58 1 ± 12 0 59 1 ± 11 8 0 28fraction*, % 59.3 ± 11.9 59.5 ± 11.4 0.80 58.1 ± 12.0 59.1 ± 11.8 0.28
LVEF <50% 68 (15.4) 126 (18.1) 0.24 56 (17.1) 59 (19.3) 0.5022
M t hi 자료에 대한 분석Matching 자료에 대한 분석Stratified analysis를수행.
Univariable analysis (공변량의 balance가완벽하다면)
Paired t-test(Wilcoxon signed rank test)
Stratified Chi-square test - (ex: Cochran-Mantel- Haenszel method, Mcnemar test)
Stratified regression (추가로공변량을보정하려면)
- (ex: mixed model, two-way ANCOVA, Stratified logistic regression 또는 GEE)
Survival analysis (outcome이 censored event 라면)Survival analysis (outcome이 censored event 라면)
- Stratified log-rank test (ex: Prentice-Wilcoxon test, etc)
- Stratified Cox regression
짝지어진데이터대한분석과동일함.
21
- 13 -
▶ 삼성서울병원 교육수련부/통계지원팀
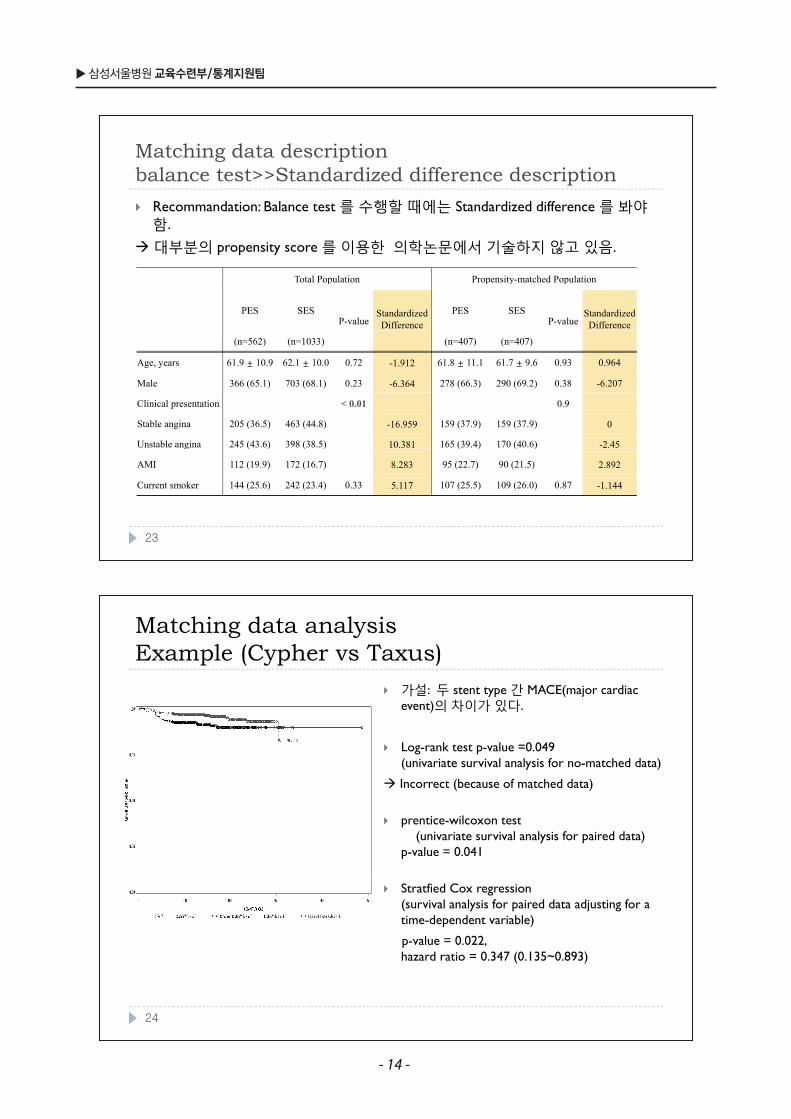
Matching data analysis Example (Cypher vs Taxus)Example (Cypher vs Taxus)
가설: 두 stent type 간 MACE(major cardiac event)의차이가있다 event)의차이가있다.
Log-rank test p-value =0.049 (univariate survival analysis for no matched data)(univariate survival analysis for no-matched data)
Incorrect (because of matched data)
ti il t tprentice-wilcoxon test(univariate survival analysis for paired data)
p-value = 0.041
Stratfied Cox regression (survival analysis for paired data adjusting for a time-dependent variable)
p-value = 0.022, hazard ratio = 0.347 (0.135~0.893)
24
Matching data descriptionb l t t St d di d diff d i tibalance test>>Standardized difference description
Recommandation: Balance test 를수행할때에는 Standardized difference 를봐야함 함.
대부분의 propensity score 를이용한 의학논문에서기술하지않고있음.
Total Population Propensity-matched PopulationTotal Population Propensity matched Population
PES SES P-value
Standardized Difference
PES SES P-value
Standardized Difference
(n=562) (n=1033) (n=407) (n=407)
Age, years 61.9 ± 10.9 62.1 ± 10.0 0.72 -1.912 61.8 ± 11.1 61.7 ± 9.6 0.93 0.964
Male 366 (65.1) 703 (68.1) 0.23 -6.364 278 (66.3) 290 (69.2) 0.38 -6.207
Clinical presentation < 0.01 0.9
Stable angina 205 (36.5) 463 (44.8) -16.959 159 (37.9) 159 (37.9) 0
Unstable angina 245 (43.6) 398 (38.5) 10.381 165 (39.4) 170 (40.6) -2.45g ( ) ( ) ( ) ( )
AMI 112 (19.9) 172 (16.7) 8.283 95 (22.7) 90 (21.5) 2.892
Current smoker 144 (25.6) 242 (23.4) 0.33 5.117 107 (25.5) 109 (26.0) 0.87 -1.144
23
- 14 -
2011 의학통계 교육 (Special Topic) ◀
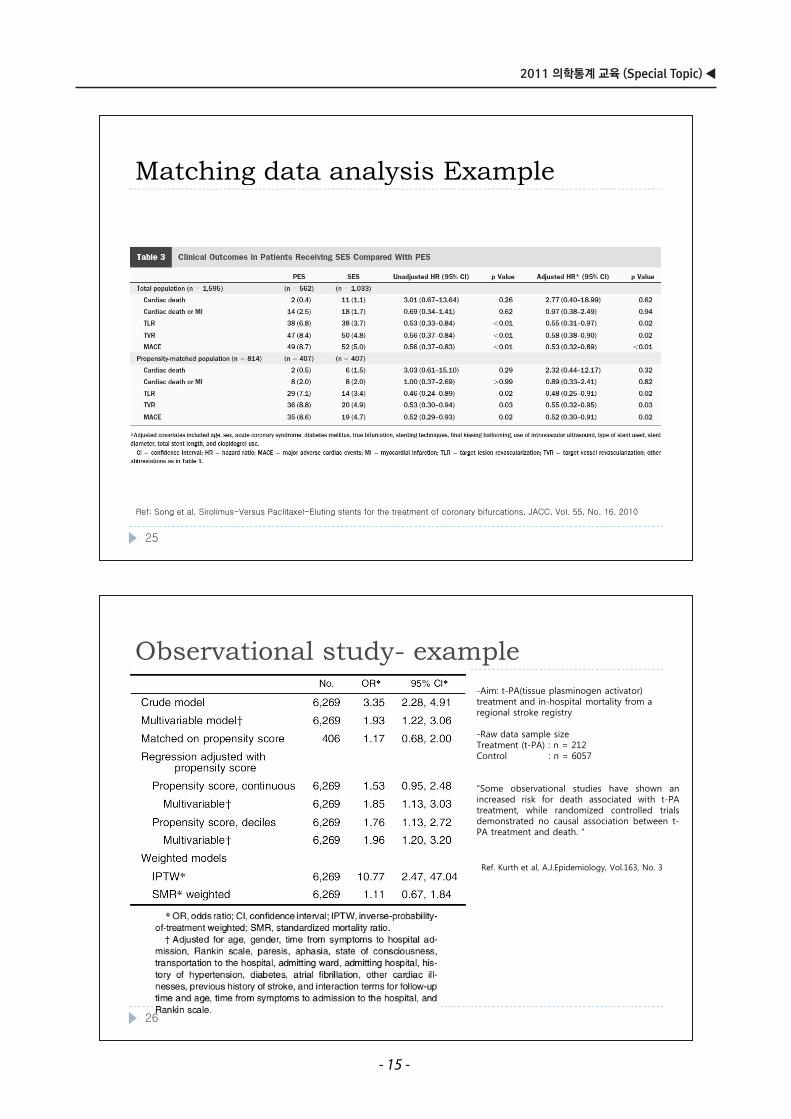
Observational study exampleObservational study- example-Aim: t-PA(tissue plasminogen activator) treatment and in-hospital mortality from a p yregional stroke registry
-Raw data sample sizeTreatment (t-PA) : n = 212Control : n = 6057
“Some observational studies have shown anincreased risk for death associated with t-PAtreatment, while randomized controlled trialsdemonstrated no causal association between t-PA treatment and death. “
Ref. Kurth et al, A.J.Epidemiology, Vol.163, No. 3
26
Matching data analysis ExampleMatching data analysis Example
Ref: Song et al, Sirolimus-Versus Paclitaxel-Eluting stents for the treatment of coronary bifurcations, JACC, Vol. 55, No, 16, 2010
25
- 15 -
▶ 삼성서울병원 교육수련부/통계지원팀
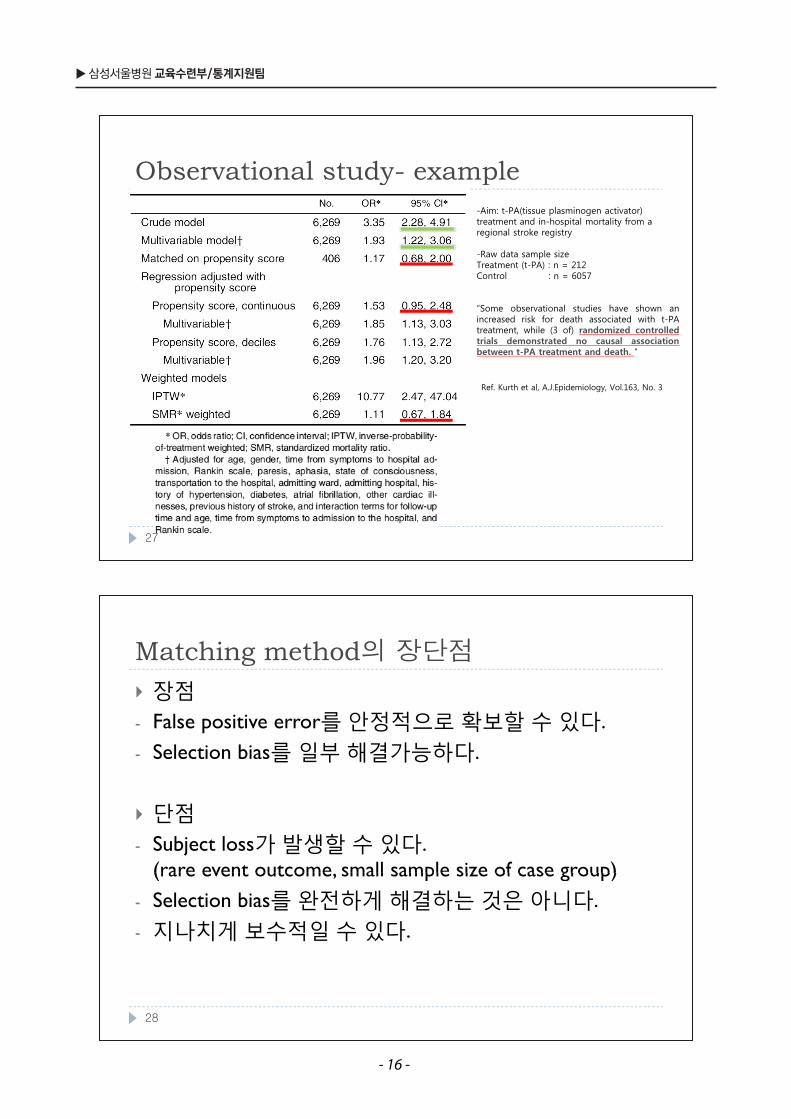
Matching method의 장단점Matching method의 장단점장점
- False positive error를안정적으로확보할수있다. - Selection bias를일부해결가능하다.를일부해결가능하다
단점단점- Subject loss가발생할수있다.
(rare event outcome small sample size of case group)(rare event outcome, small sample size of case group)- Selection bias를완전하게해결하는것은아니다.지나치게보수적일수있다 - 지나치게보수적일수있다.
28
Observational study exampleObservational study- example-Aim: t-PA(tissue plasminogen activator) treatment and in-hospital mortality from a p yregional stroke registry
-Raw data sample sizeTreatment (t-PA) : n = 212Control : n = 6057
“Some observational studies have shown anincreased risk for death associated with t-PAtreatment, while (3 of) randomized controlledtrials demonstrated no causal associationbetween t-PA treatment and death. “
Ref. Kurth et al, A.J.Epidemiology, Vol.163, No. 3
27
- 16 -
2011 의학통계 교육 (Special Topic) ◀
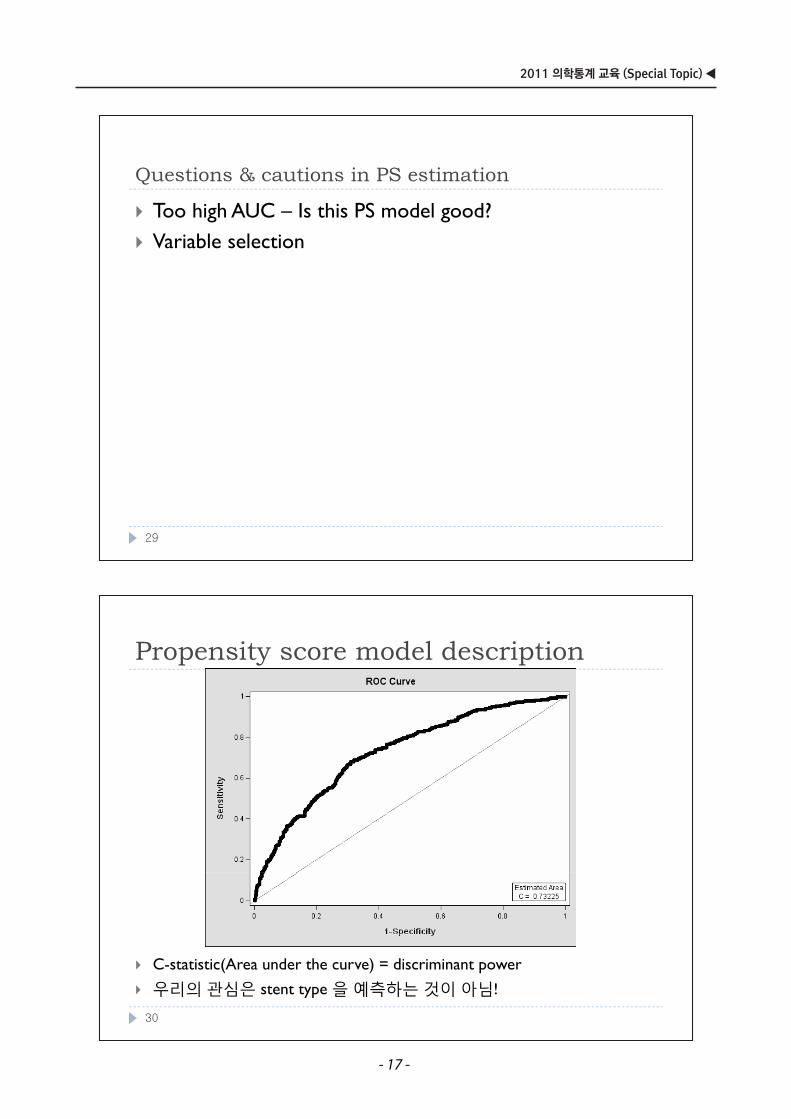
Propensity score model descriptionPropensity score model description
C-statistic(Area under the curve) = discriminant power
우리의관심은 을예측하는것이아님!우리의관심은 stent type 을예측하는것이아님!
30
Q ti & ti i PS ti tiQuestions & cautions in PS estimation
Too high AUC – Is this PS model good?Variable selection
29
- 17 -
▶ 삼성서울병원 교육수련부/통계지원팀
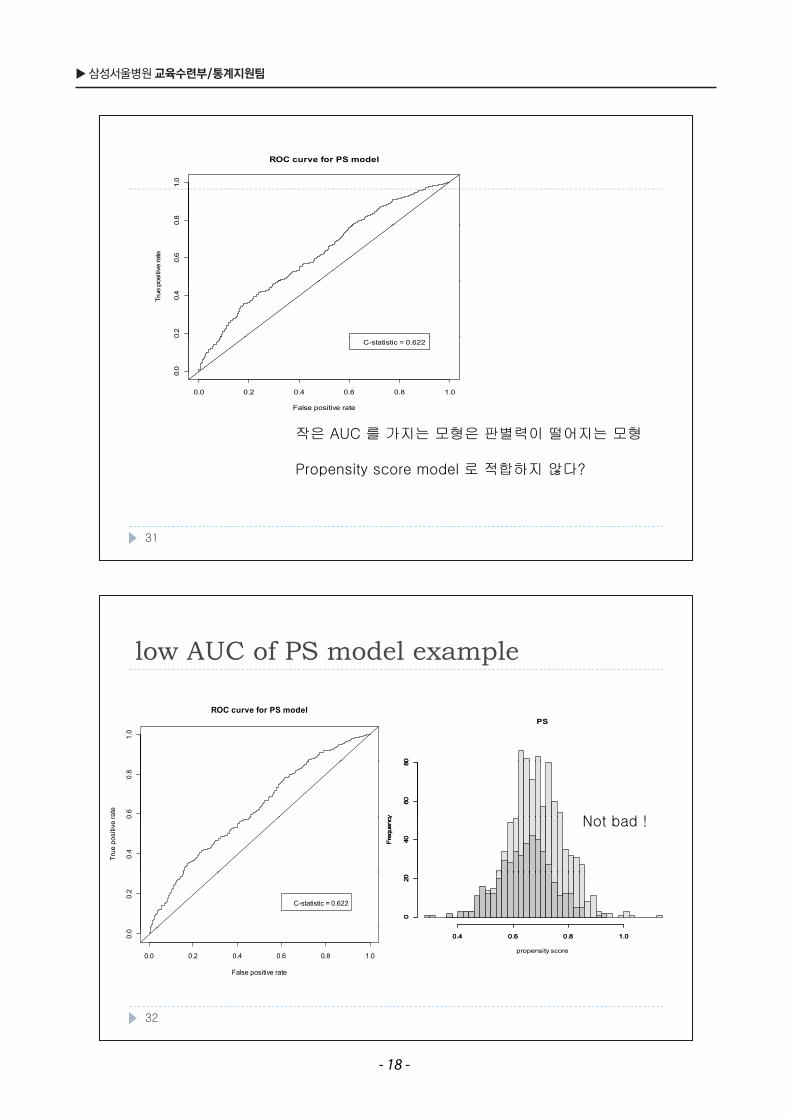
low AUC of PS model examplelow AUC of PS model example
ROC curve for PS model
1.0
0
PS
0
rate
0.6
0.8
y
6080
y
6080
N t b d !
True
pos
itive
r
0.4
0
Freq
uenc
y
40Freq
uenc
y
40
Not bad !
0.2
C-statistic = 0.622
020
020
False positive rate
0.0 0.2 0.4 0.6 0.8 1.0
0.0
propensity score
0.4 0.6 0.8 1.00.4 0.6 0.8 1.0
32
ROC curve for PS model
0.8
1.0
ositi
ve ra
te
0.6
True
po
0.2
0.4
0 0 0 2 0 4 0 6 0 8 1 0
0.0
0
C-statistic = 0.622
False positive rate
0.0 0.2 0.4 0.6 0.8 1.0
작은 AUC 를 가지는 모형은 판별력이 떨어지는 모형
Propensity score model 로 적합하지 않다?
31
- 18 -
2011 의학통계 교육 (Special Topic) ◀
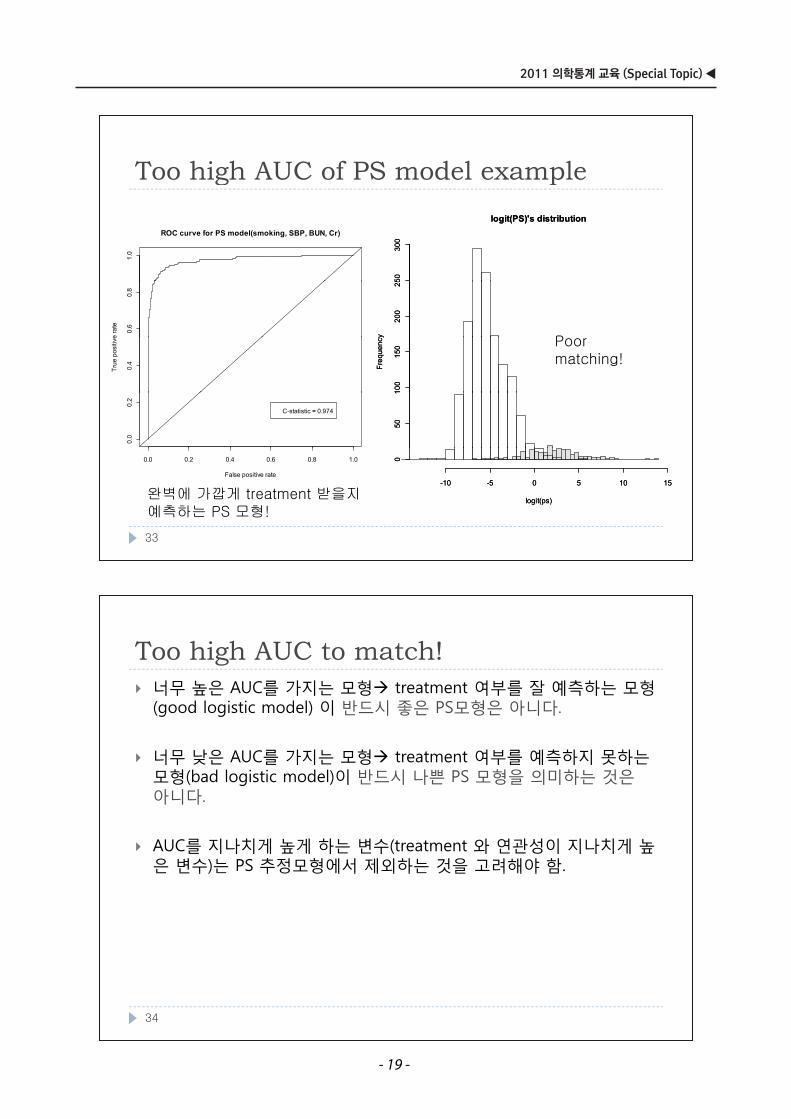
Too high AUC to match!Too high AUC to match!너무 높은 AUC를 가지는 모형 treatment 여부를 잘 예측하는 모형(good logistic model) 이 반드시 좋은 PS모형은 아니다(good logistic model) 이 반드시 좋은 PS모형은 아니다.
너무 낮은 AUC를 가지는 모형 treatment 여부를 예측하지 못하는너무 낮은 AUC를 가지는 모형 treatment 여부를 예측하지 못하는모형(bad logistic model)이 반드시 나쁜 PS 모형을 의미하는 것은아니다.
AUC를 지나치게 높게 하는 변수(treatment 와 연관성이 지나치게 높은 변수)는 PS 추정모형에서 제외하는 것을 고려해야 함. 은 변수)는 추정 형에서 제외하는 것을 려해야 함
34
Too high AUC of PS model exampleToo high AUC of PS model examplelogit(PS)'s distributionlogit(PS)'s distribution
5030
050
300
ROC curve for PS model(smoking, SBP, BUN, Cr)
1.0
y
200
25
y
200
25
e ra
te
0.6
0.8
P
Freq
uenc
y
100
150
Freq
uenc
y
100
150
True
pos
itive
0.4
Poor matching!
501
501
0.0
0.2
C-statistic = 0.974
logit(ps)
-10 -5 0 5 10 15
0
logit(ps)
-10 -5 0 5 10 15
0
False positive rate
0.0 0.2 0.4 0.6 0.8 1.0
완벽에 가깝게 treatment 받을지 g (p )g (p )
예측하는 PS 모형!
33
- 19 -
▶ 삼성서울병원 교육수련부/통계지원팀
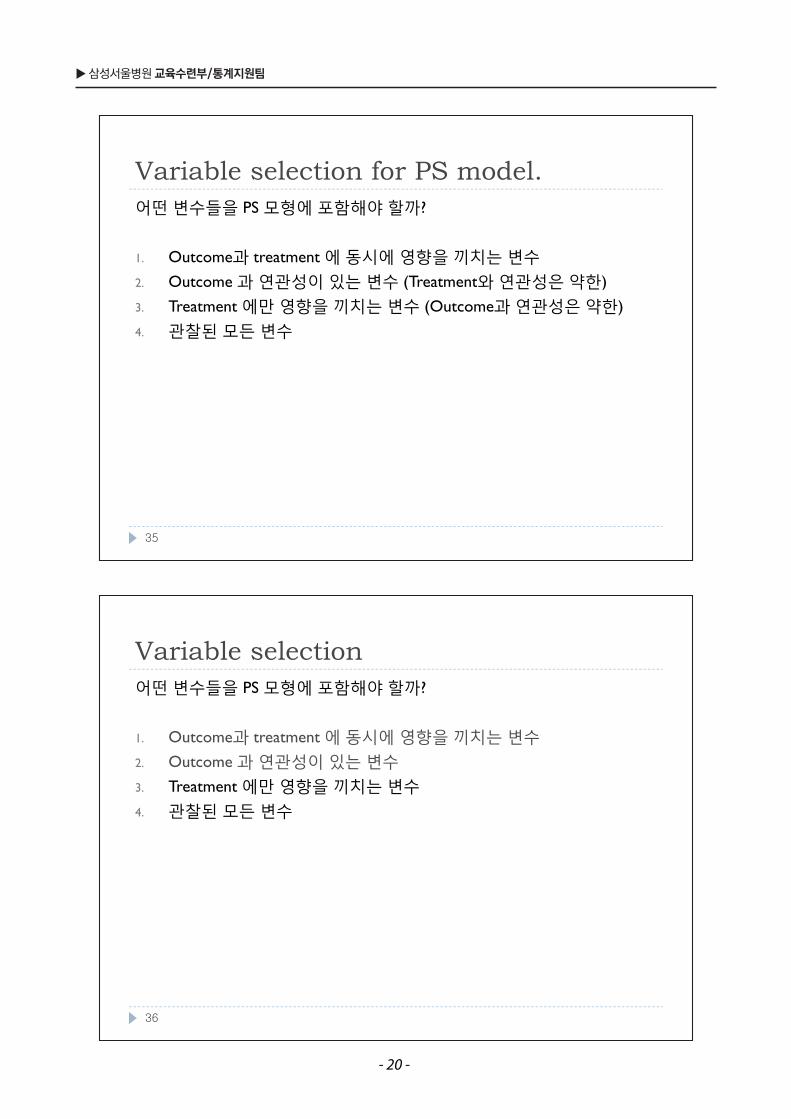
Variable selectionVariable selection어떤변수들을 PS 모형에포함해야할까?
1. Outcome과 treatment 에동시에영향을끼치는변수
2 Outcome 과연관성이있는변수2. Outcome 과연관성이있는변수
3. Treatment 에만영향을끼치는변수
4. 관찰된모든변수관찰된 든변수
36
Variable selection for PS model Variable selection for PS model. 어떤변수들을 PS 모형에포함해야할까?
1. Outcome과 treatment 에동시에영향을끼치는변수
2 Outcome 과연관성이있는변수 (Treatment와연관성은약한)2. Outcome 과연관성이있는변수 (Treatment와연관성은약한)
3. Treatment 에만영향을끼치는변수 (Outcome과연관성은약한)
4. 관찰된모든변수관찰된 든변수
35
- 20 -
2011 의학통계 교육 (Special Topic) ◀
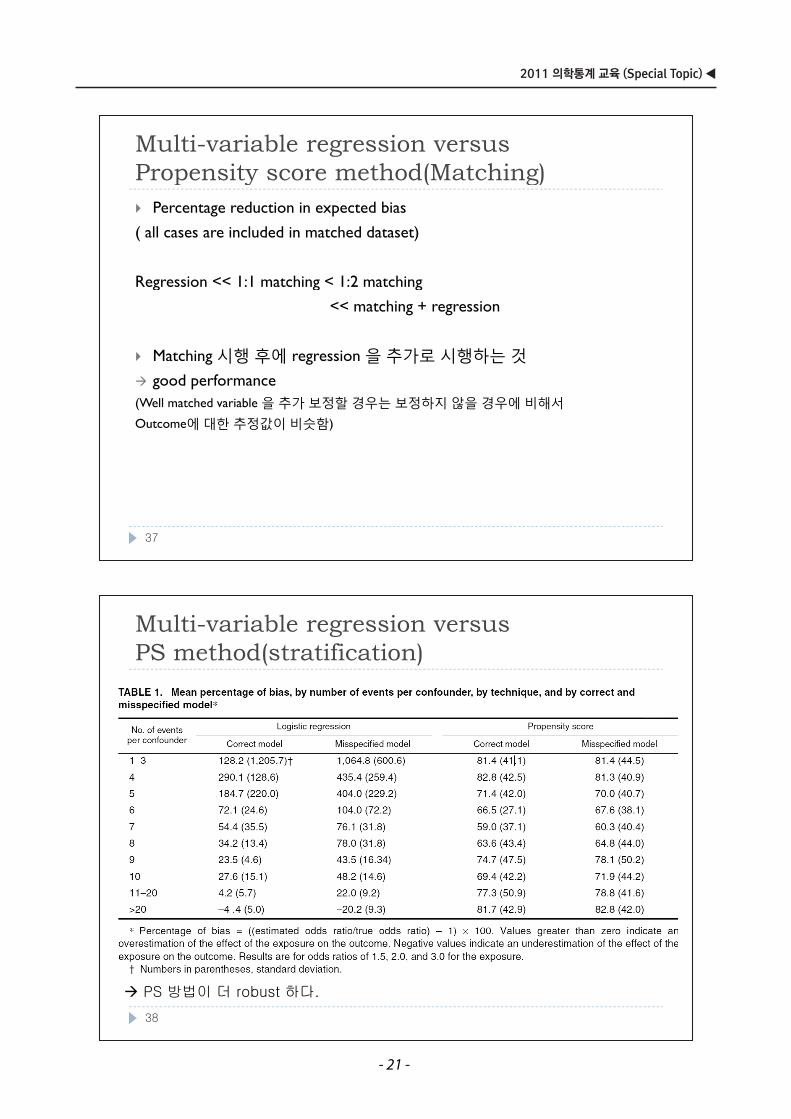
Multi-variable regression versus PS method(stratification)PS method(stratification)
PS 방법이 더 robust 하다.
38
Multi-variable regression versusPropensity score method(Matching)Propensity score method(Matching)
Percentage reduction in expected bias
( all cases are included in matched dataset)
Regression << 1:1 matching < 1:2 matching Regression << 1:1 matching < 1:2 matching
<< matching + regression
Matching 시행후에 regression 을추가로시행하는것
good performance (Well matched variable 을추가보정할경우는보정하지않을경우에비해서
Outcome에대한추정값이비슷함)
37
- 21 -
▶ 삼성서울병원 교육수련부/통계지원팀
RemindControl 집단이많지않으면 matching 결과는좋지않음.
Remind
Outcome variable이 rare event인경우 subject loss가발생하는 matching 은적당한방법이아니다.은적당한방법이아니다.
추천!! PS를이용한 matching 과 other covariate를이용한 regression 을혼용
40
RemindRemind좋은 matching을위해서는 PS 모형의AUC가지나치게높지않아야함.
Matching 후 matched dataset 에대한분석은 matched design 을고려한stratified analysis를수행해야함.stratified analysis를수행해야함.
Balance test – 반드시 matching 전과후의 covariate의상태를상세하게기술해야함.
PS 모형은 observable covariate에의한 bias 만을 control 할수있음PS 모형은 observable covariate 에의한 bias 만을 control 할수있음. can’t control the hidden bias
39
- 22 -
2011 의학통계 교육 (Special Topic) ◀
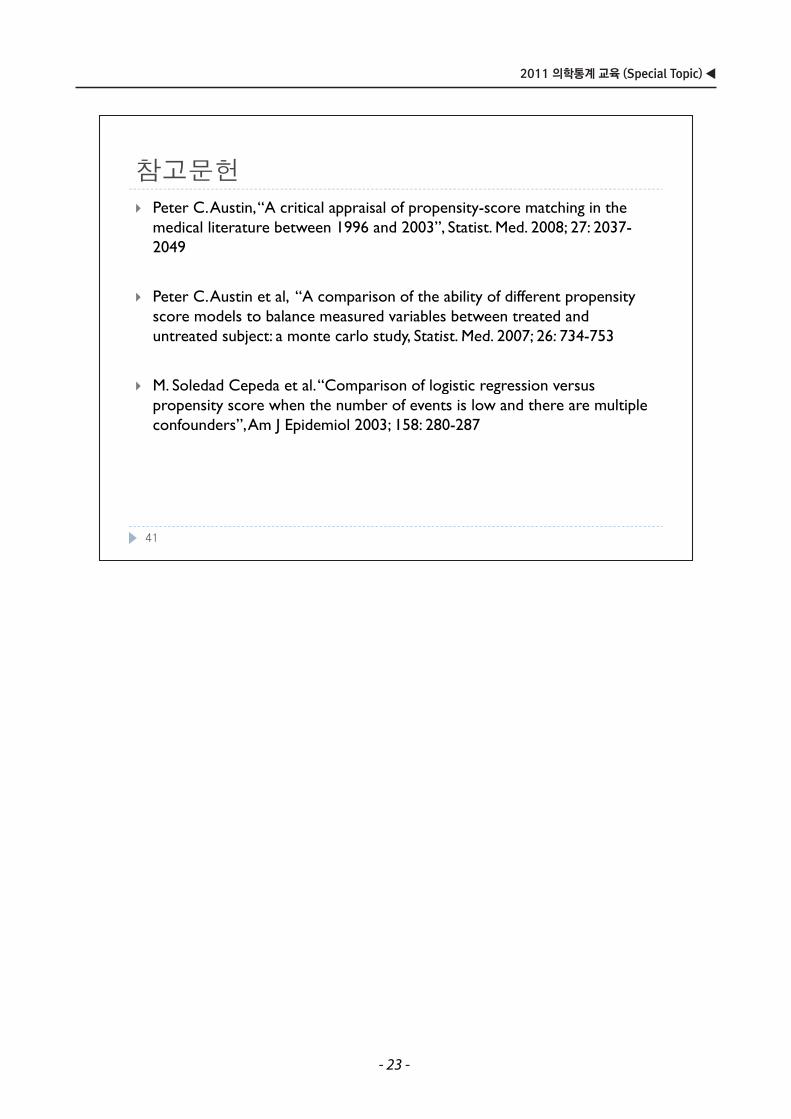
참고문헌참고문헌Peter C. Austin, “A critical appraisal of propensity-score matching in the medical literature between 1996 and 2003” Statist Med 2008; 27: 2037medical literature between 1996 and 2003 , Statist. Med. 2008; 27: 2037-2049
Peter C. Austin et al, “A comparison of the ability of different propensity score models to balance measured variables between treated and untreated subject: a monte carlo study Statist Med 2007; 26: 734-753untreated subject: a monte carlo study, Statist. Med. 2007; 26: 734-753
M. Soledad Cepeda et al. “Comparison of logistic regression versus p p g gpropensity score when the number of events is low and there are multiple confounders”, Am J Epidemiol 2003; 158: 280-287
41
- 23 -

●●● 삼성서울병원 교육수련부 / 통계지원팀 ●●●
2011 의학통계 교육 (Special Topic)
Sample Size calculation
- 25 -

2011 의학통계 교육 (Special Topic) ◀
IntroductionWhy sample size?Sample size depends on ……Basic sample size formulaExamples
2
- 27 -
▶ 삼성서울병원 교육수련부/통계지원팀
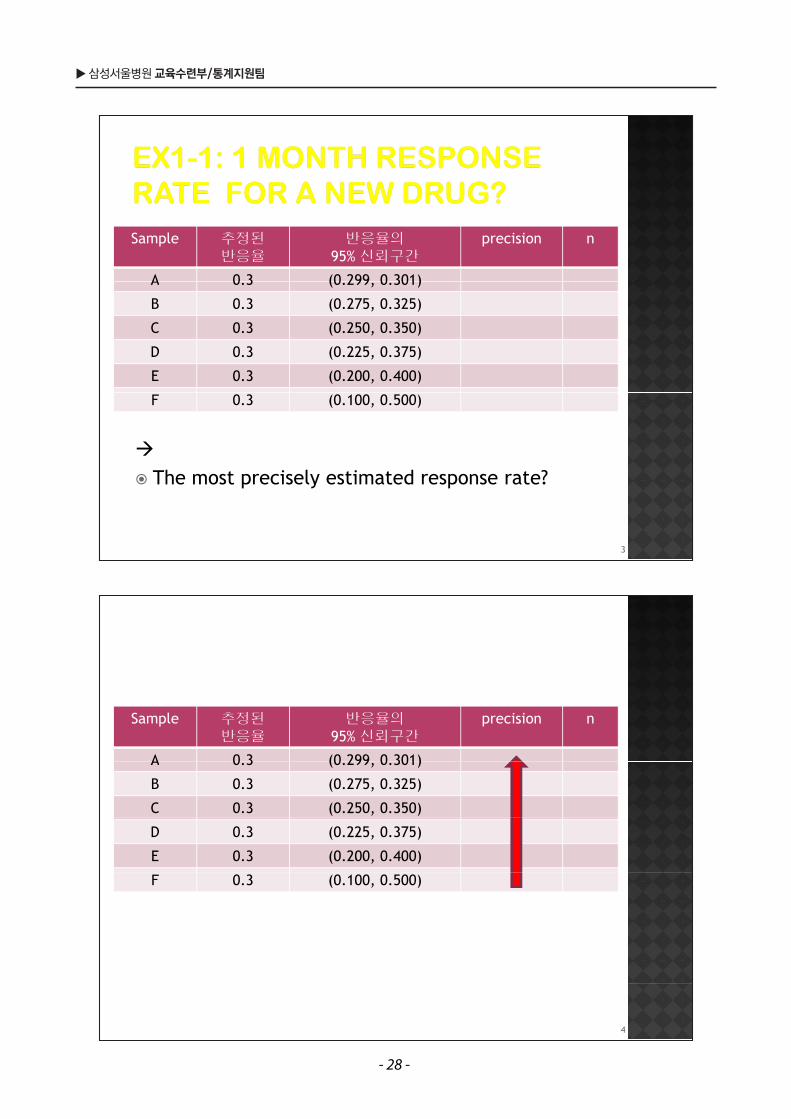
Sample 추정된반응율
반응율의95% 신뢰구간
precision n
A 0 3 (0 299 0 301)A 0.3 (0.299, 0.301)
B 0.3 (0.275, 0.325)
C 0.3 (0.250, 0.350)
D 0.3 (0.225, 0.375)
E 0.3 (0.200, 0.400)
F 0.3 (0.100, 0.500)
4
Sample 추정된반응율
반응율의95% 신뢰구간
precision n
A 0 3 (0 299 0 301)A 0.3 (0.299, 0.301)
B 0.3 (0.275, 0.325)
C 0.3 (0.250, 0.350)
D 0.3 (0.225, 0.375)
E 0.3 (0.200, 0.400)
F 0.3 (0.100, 0.500)
The most precisely estimated response rate?
3
- 28 -
2011 의학통계 교육 (Special Topic) ◀
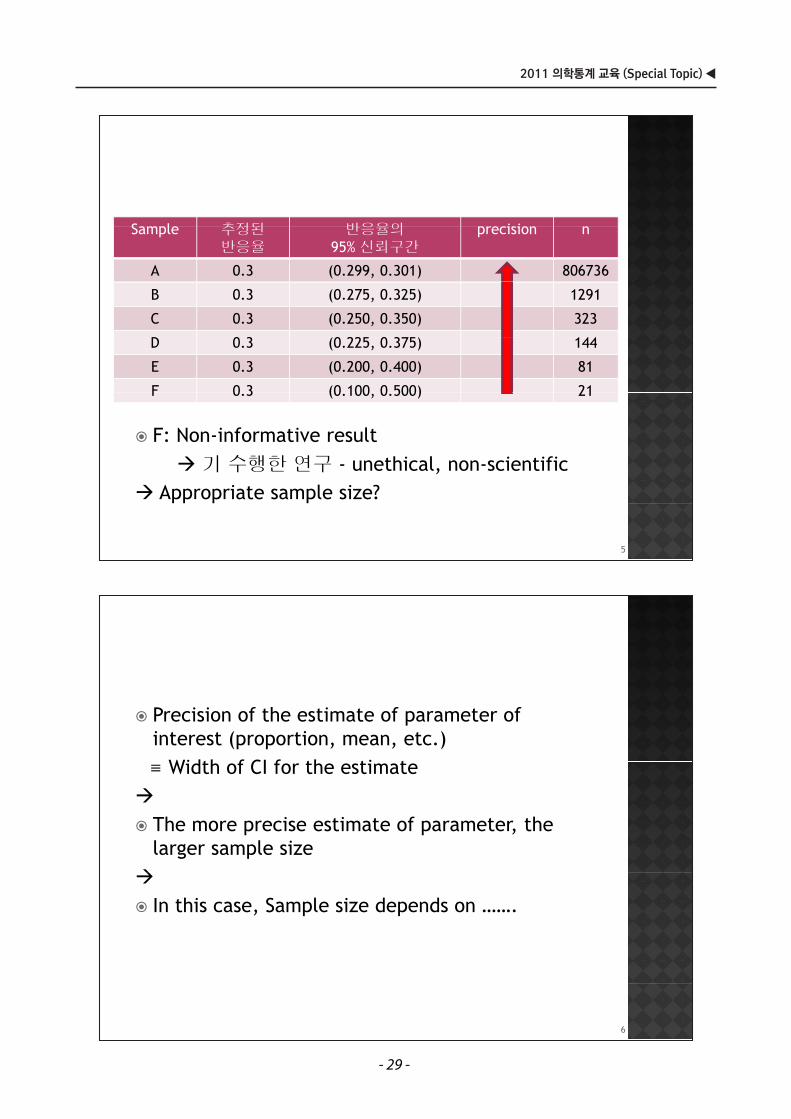
Precision of the estimate of parameter of interest (proportion, mean, etc.)
Width f CI f th ti t≡ Width of CI for the estimate
Th i i f h The more precise estimate of parameter, the larger sample size
In this case, Sample size depends on …….
6
S l 추정된 반응율의 i iSample 추정된반응율
반응율의95% 신뢰구간
precision n
A 0.3 (0.299, 0.301) 806736
B 0.3 (0.275, 0.325) 1291
C 0.3 (0.250, 0.350) 323
D 0 3 (0 225 0 375) 144D 0.3 (0.225, 0.375) 144
E 0.3 (0.200, 0.400) 81
F 0 3 (0 100 0 500) 21
F: Non-informative result
F 0.3 (0.100, 0.500) 21
기 수행한 연구 - unethical, non-scientificAppropriate sample size?
5
- 29 -
▶ 삼성서울병원 교육수련부/통계지원팀
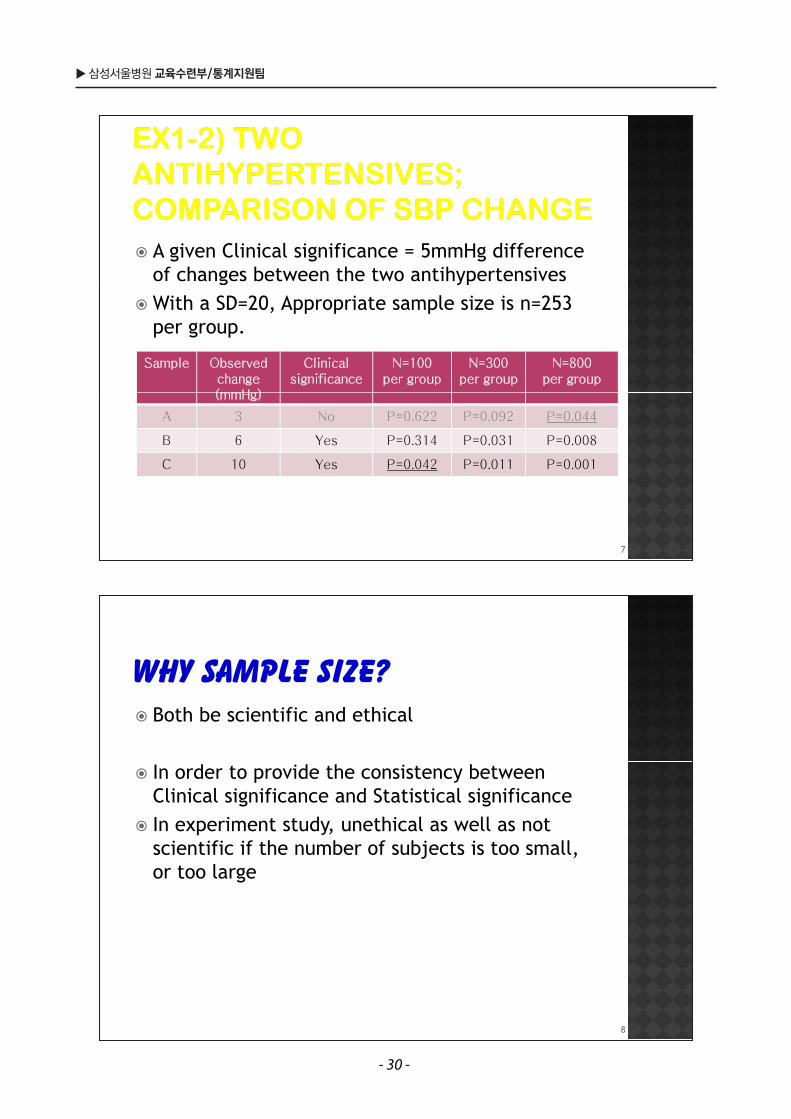
Both be scientific and ethical
In order to provide the consistency between Clinical significance and Statistical significanceI i d hi l ll In experiment study, unethical as well as not scientific if the number of subjects is too small, or too largeor too large
8
A given Clinical significance = 5mmHg difference of changes between the two antihypertensivesg ypWith a SD=20, Appropriate sample size is n=253 per group.p g p
�����e ��se��e������e������
C�������s����������e
N=100��e����o��
N=300��e����o��
N=800��e����o��
������
A 3 No P=0.622 P=0.092 P=0.044
B 6 Yes P=0.314 P=0.031 P=0.008
C 10 Yes P=0.042 P=0.011 P=0.001
7
- 30 -
2011 의학통계 교육 (Special Topic) ◀
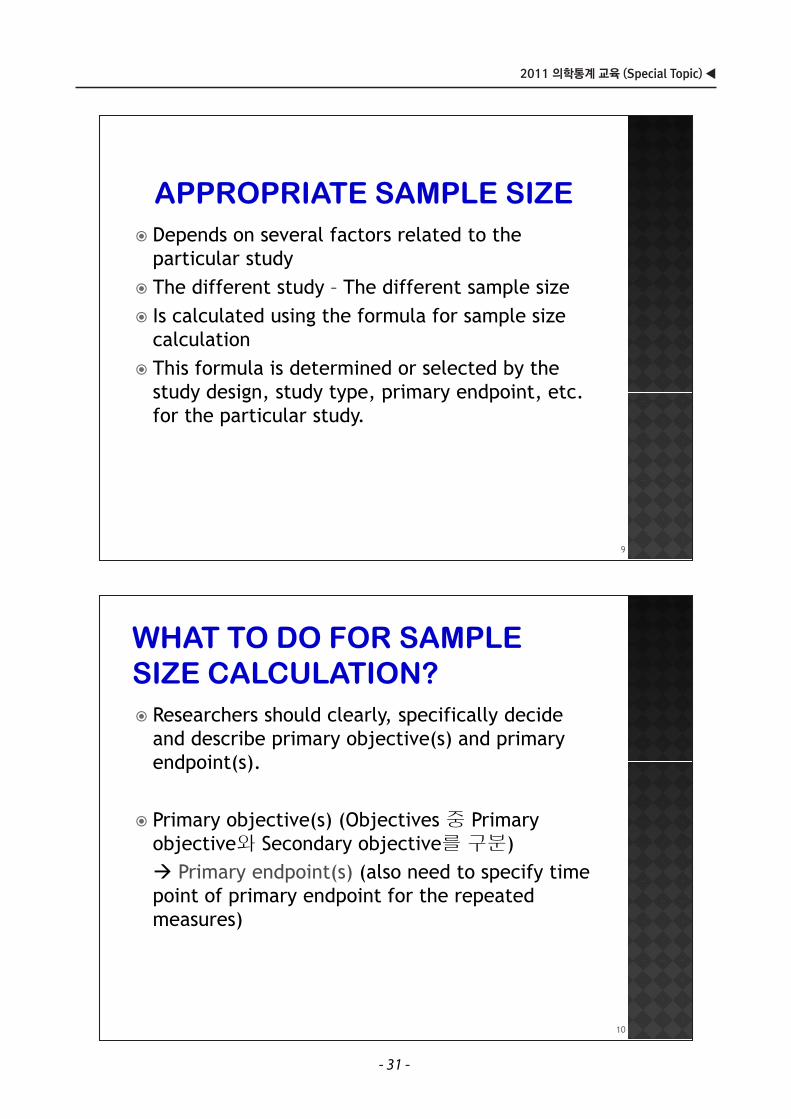
Researchers should clearly, specifically decide and describe primary objective(s) and primary endpoint(s)endpoint(s).
Primary objective(s) (Objectives 중 Primary Primary objective(s) (Objectives 중 Primary objective와 Secondary objective를 구분)
Primary endpoint(s) (also need to specify time Primary endpoint(s) (also need to specify time point of primary endpoint for the repeated measures))
10
Depends on several factors related to the particular studyTh diff t t d Th diff t l iThe different study – The different sample sizeIs calculated using the formula for sample size calculationcalculationThis formula is determined or selected by the study design study type primary endpoint etc study design, study type, primary endpoint, etc. for the particular study.
9
- 31 -
▶ 삼성서울병원 교육수련부/통계지원팀
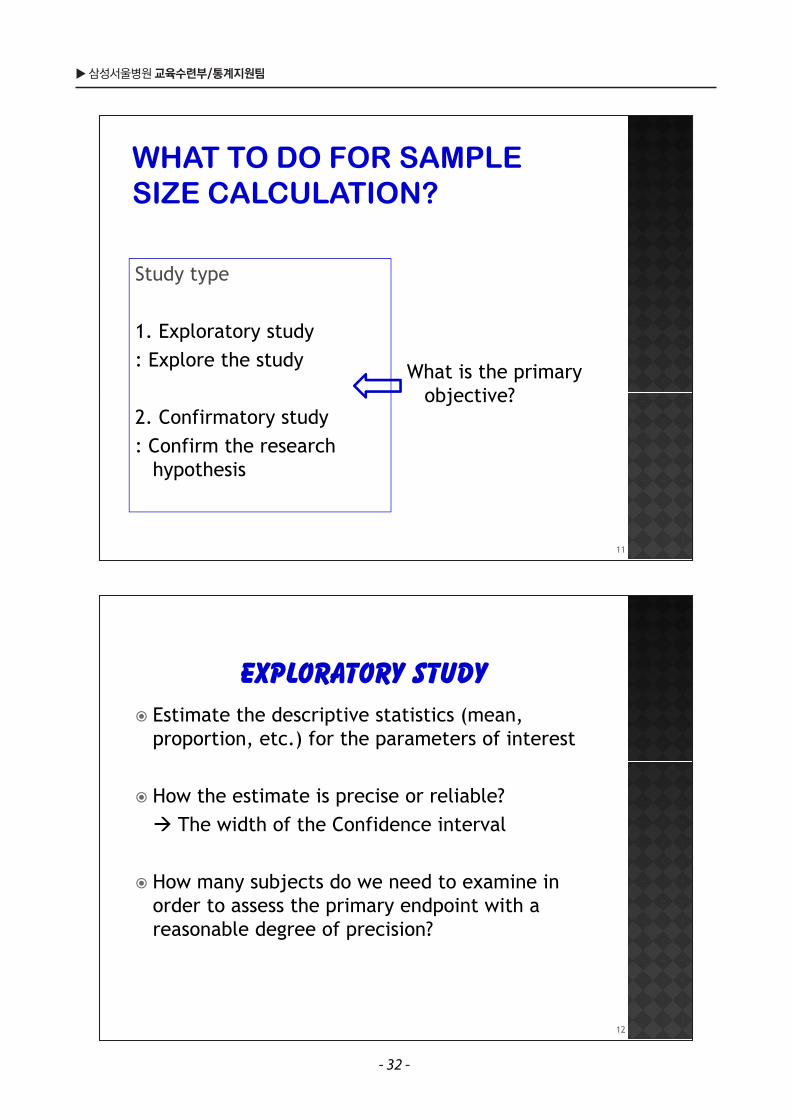
Estimate the descriptive statistics (mean, proportion, etc.) for the parameters of interest
How the estimate is precise or reliable? Th id h f h C fid i lThe width of the Confidence interval
How many subjects do we need to examine in order to assess the primary endpoint with a reasonable degree of precision?reasonable degree of precision?
12
Study typey yp
1. Exploratory study1. Exploratory study: Explore the study What is the primary
objective?2. Confirmatory study: Confirm the research
objective?
: Confirm the research hypothesis
11
- 32 -
2011 의학통계 교육 (Special Topic) ◀
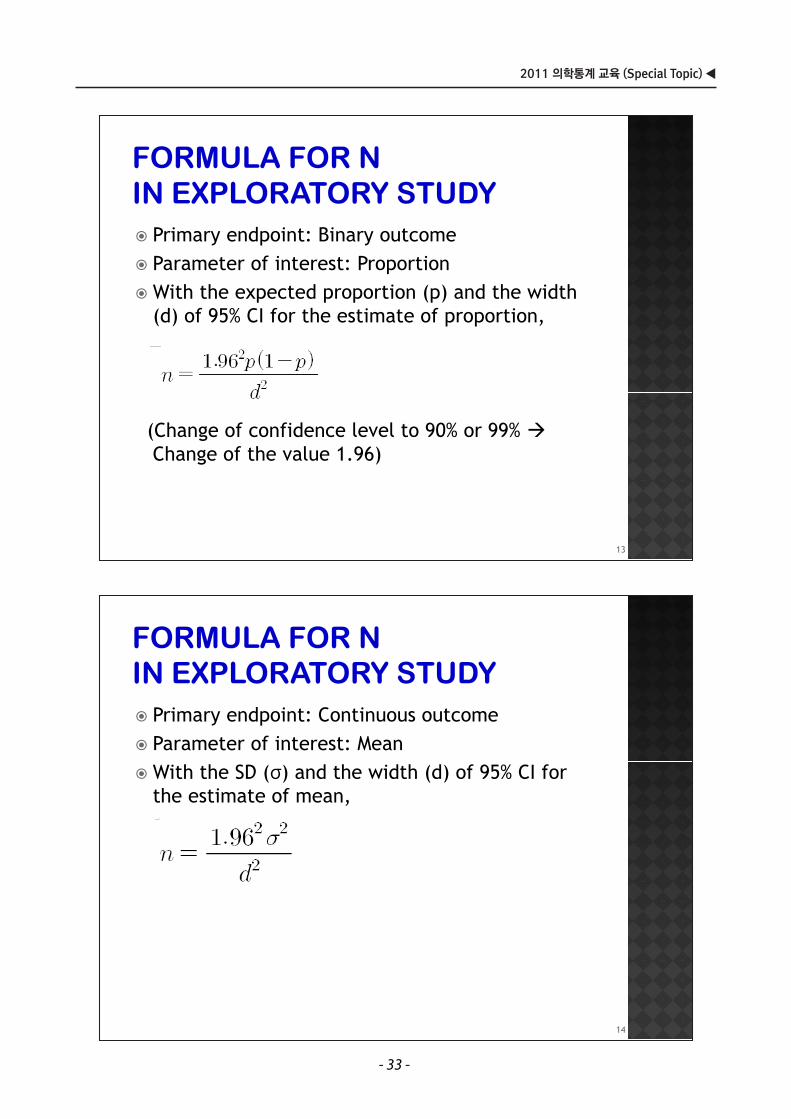
Primary endpoint: Continuous outcomeParameter of interest: MeanWith the SD (σ) and the width (d) of 95% CI for the estimate of mean,
14
Primary endpoint: Binary outcomeParameter of interest: ProportionWith the expected proportion (p) and the width (d) of 95% CI for the estimate of proportion,
(Change of confidence level to 90% or 99% Ch f th l 1 96)Change of the value 1.96)
13
- 33 -
▶ 삼성서울병원 교육수련부/통계지원팀
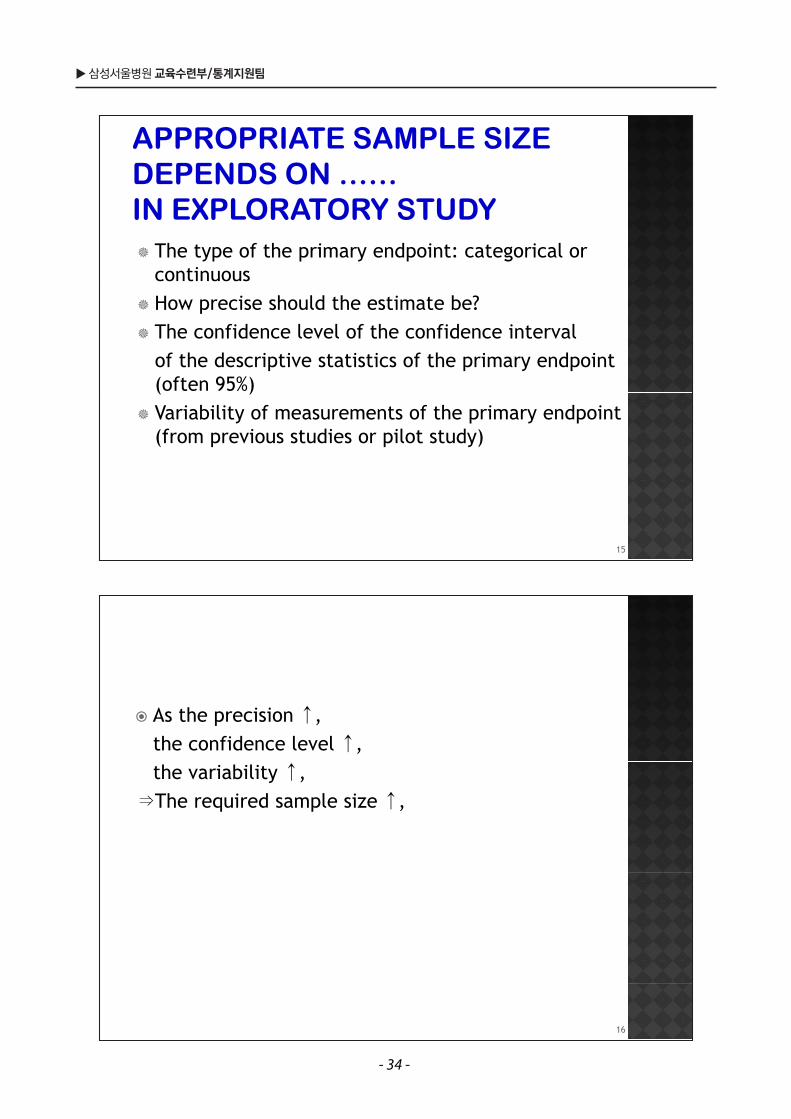
↑As the precision ↑, the confidence level ↑, the variability ↑,⇒The required sample size ↑,
16
The type of the primary endpoint: categorical or continuousHow precise should the estimate be?The confidence level of the confidence interval The confidence level of the confidence interval of the descriptive statistics of the primary endpoint (often 95%)( )Variability of measurements of the primary endpoint (from previous studies or pilot study)
15
- 34 -
2011 의학통계 교육 (Special Topic) ◀
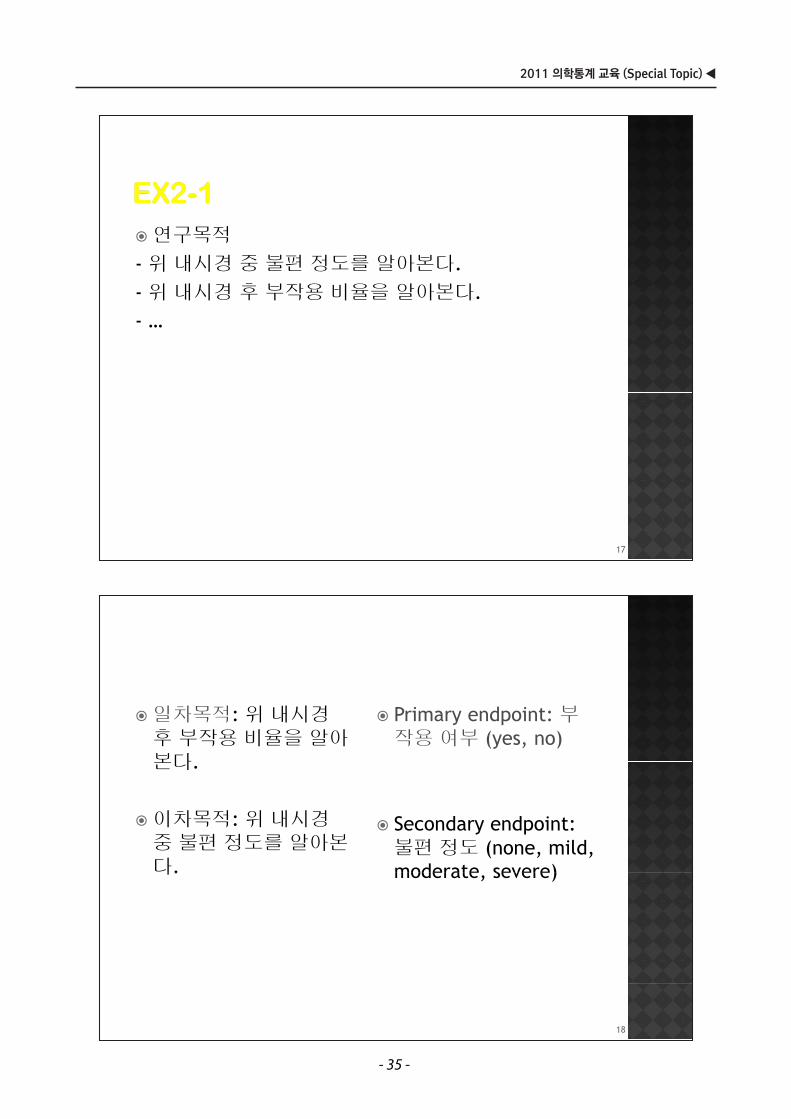
일차목적 위 내시경 부일차목적: 위 내시경후 부작용 비율을 알아본다
Primary endpoint: 부작용 여부 (yes, no)
본다.
이차목적: 위 내시경 S d d i 이차목적: 위 내시경중 불편 정도를 알아본다.
Secondary endpoint: 불편 정도 (none, mild, moderate severe)다. moderate, severe)
18
연구목적
- 위 내시경 중 불편 정도를 알아본다.- 위 내시경 후 부작용 비율을 알아본다.- …
17
- 35 -
▶ 삼성서울병원 교육수련부/통계지원팀
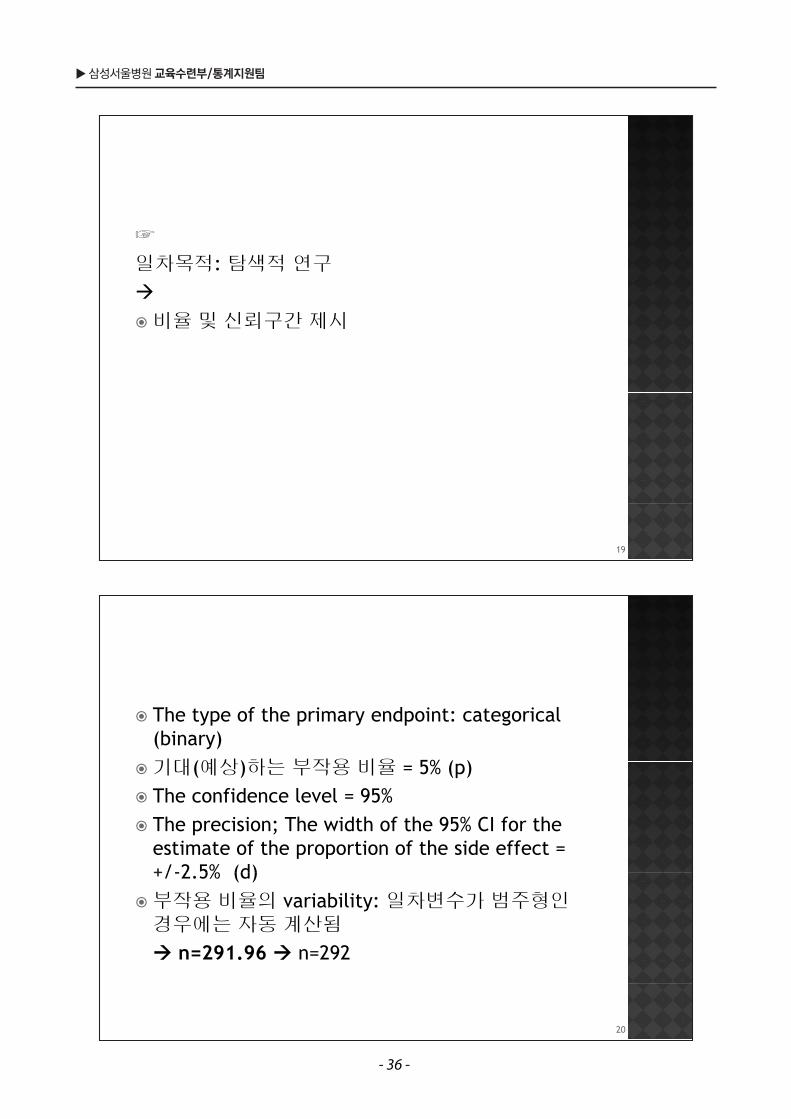
The type of the primary endpoint: categorical (binary)기대(예상)하는 부작용 비율 5% ( )기대(예상)하는 부작용 비율 = 5% (p)The confidence level = 95%Th i i Th id h f h 95% CI f h The precision; The width of the 95% CI for the estimate of the proportion of the side effect = +/-2 5% (d)+/-2.5% (d)부작용 비율의 variability: 일차변수가 범주형인경우에는 자동 계산됨경우에는 자동 계산됨
n=291.96 n=292
20
☞
일차목적: 탐색적 연구
비율 및 신뢰구간 제시
19
- 36 -
2011 의학통계 교육 (Special Topic) ◀
☞
일차목적: 탐색연구
평균 및 신뢰구간 제시
일차변수: 하루 평균 섭취 열량 연속형
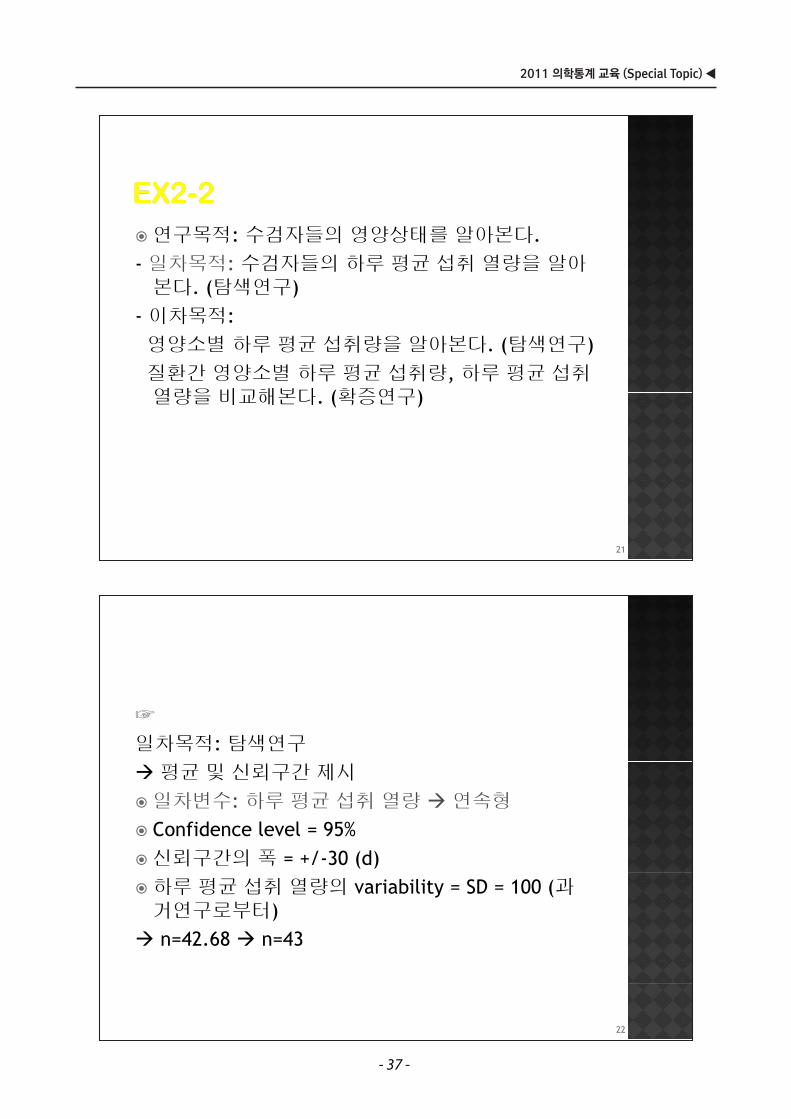
Confidence level = 95%신뢰구간의 폭 = +/-30 (d)하루 평균 섭취 열량의 variability = SD = 100 (과거연구로부터)n=42.68 n=43
22
수연구목적: 수검자들의 영양상태를 알아본다.- 일차목적: 수검자들의 하루 평균 섭취 열량을 알아본다 (탐색연구)본다. (탐색연구)
- 이차목적: 영양소별 하루 평균 섭취량을 알아본다 (탐색연구)영양소별 하루 평균 섭취량을 알아본다. (탐색연구)질환간 영양소별 하루 평균 섭취량, 하루 평균 섭취열량을 비교해본다 (확증연구)열량을 비교해본다. (확증연구)
21
- 37 -
▶ 삼성서울병원 교육수련부/통계지원팀
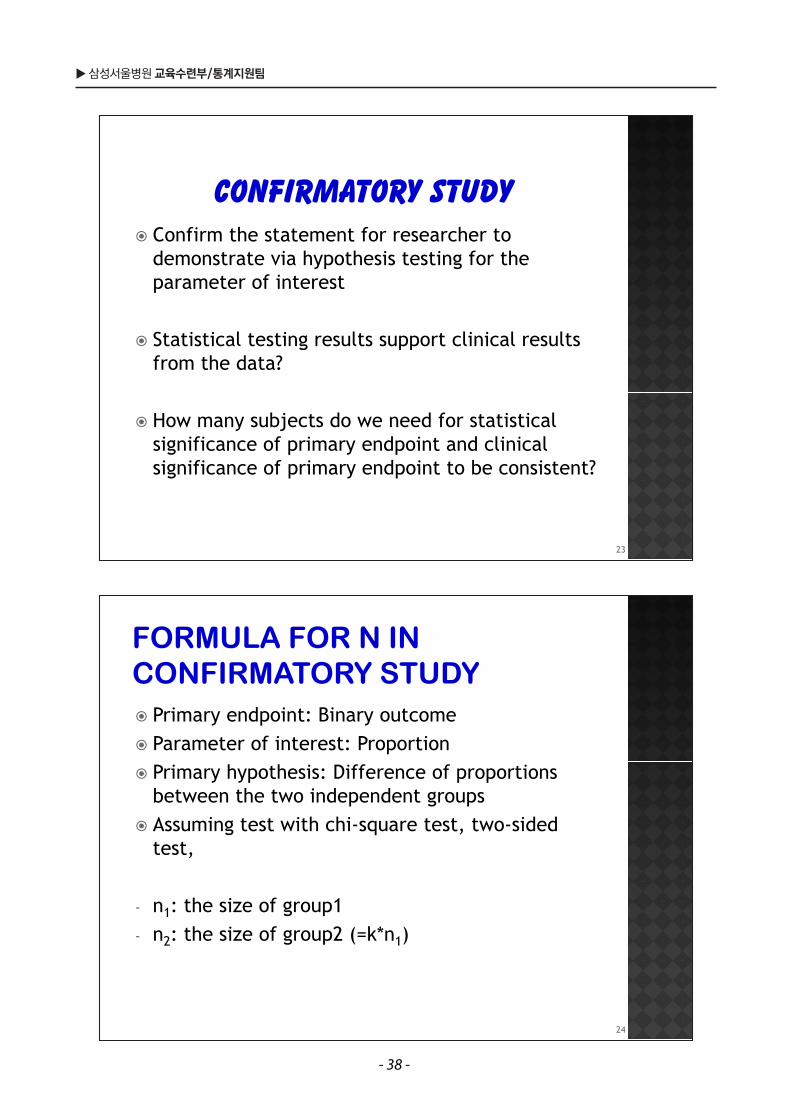
Primary endpoint: Binary outcomeParameter of interest: ProportionPrimary hypothesis: Difference of proportions between the two independent groupsA i i h hi id d Assuming test with chi-square test, two-sided test,
- n1: the size of group1 th i f 2 ( k* )- n2: the size of group2 (=k*n1)
24
Confirm the statement for researcher to demonstrate via hypothesis testing for the parameter of interestparameter of interest
Statistical testing results support clinical results Statistical testing results support clinical results from the data?
How many subjects do we need for statistical significance of primary endpoint and clinical significance of primary endpoint and clinical significance of primary endpoint to be consistent?
23
- 38 -
2011 의학통계 교육 (Special Topic) ◀
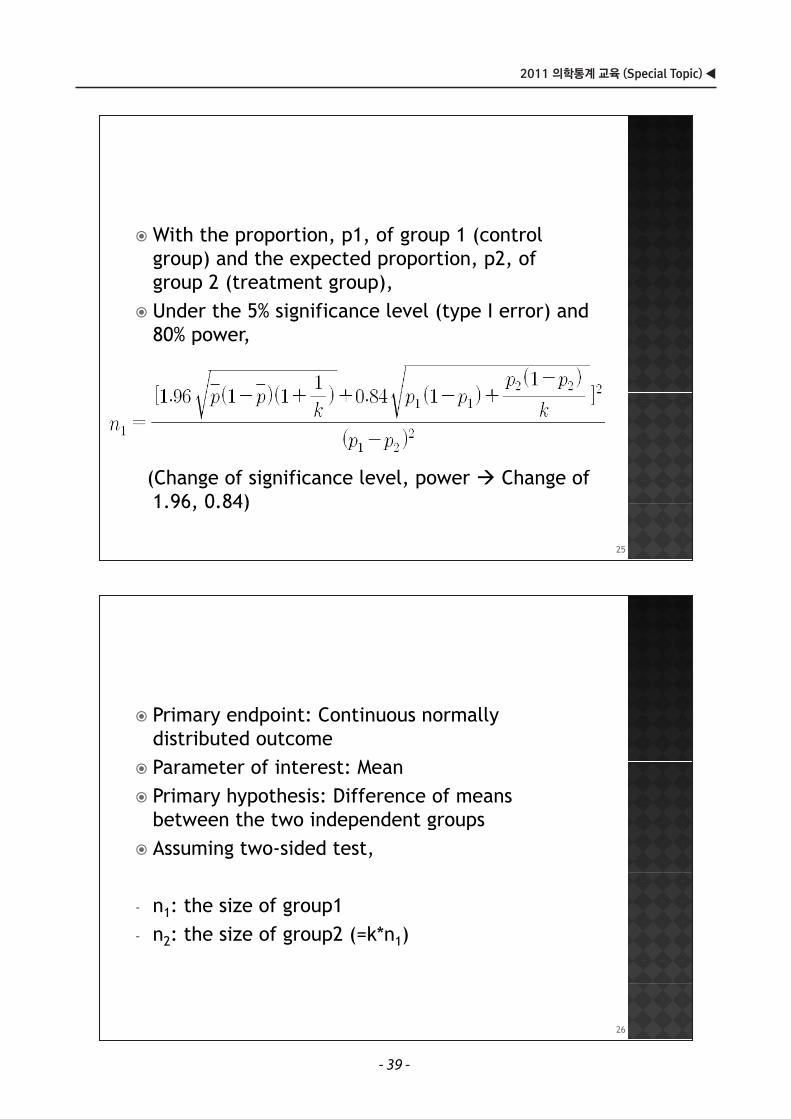
Primary endpoint: Continuous normally distributed outcomeP t f i t t MParameter of interest: MeanPrimary hypothesis: Difference of means between the two independent groupsbetween the two independent groupsAssuming two-sided test,
- n1: the size of group1 th i f 2 ( k* )- n2: the size of group2 (=k*n1)
26
With the proportion, p1, of group 1 (control group) and the expected proportion, p2, of group 2 (treatment group)group 2 (treatment group),Under the 5% significance level (type I error) and 80% power80% power,
(Change of significance level, power Change of 1 96 0 84) 1.96, 0.84)
25
- 39 -
▶ 삼성서울병원 교육수련부/통계지원팀
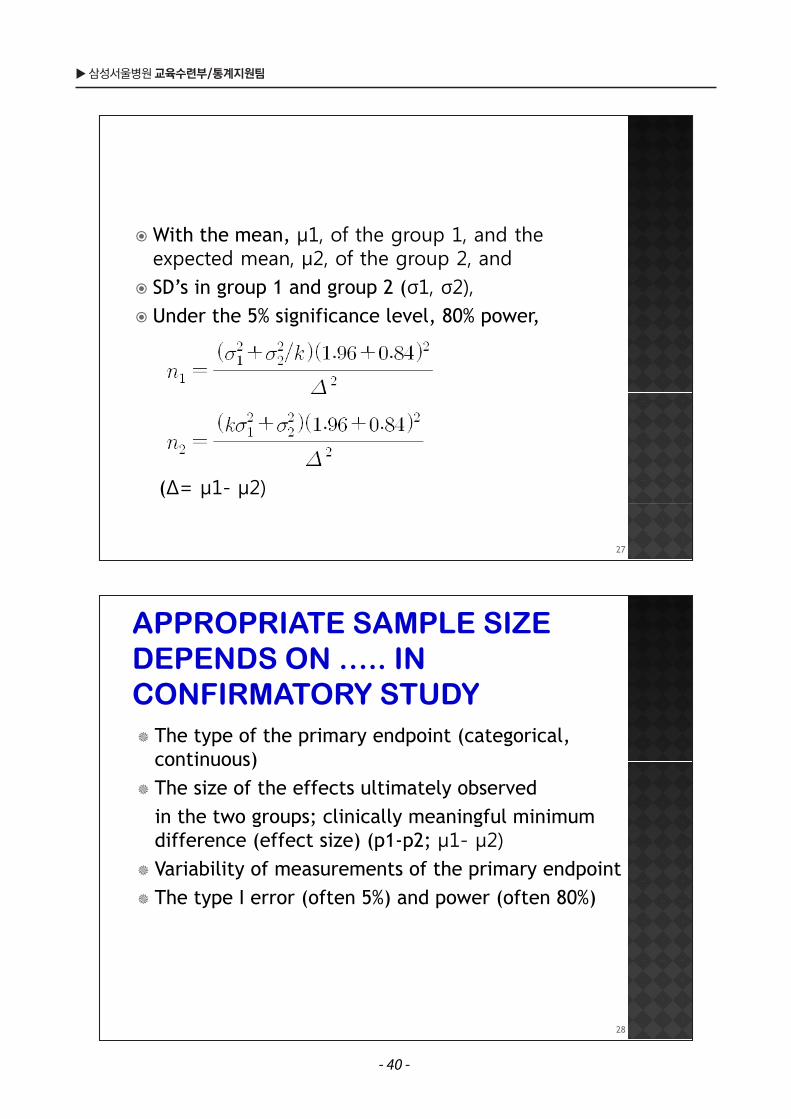
The type of the primary endpoint (categorical, continuous)continuous)The size of the effects ultimately observed in the two groups; clinically meaningful minimum in the two groups; clinically meaningful minimum difference (effect size) (p1-p2; μ1- μ2)Variability of measurements of the primary endpointVariability of measurements of the primary endpointThe type I error (often 5%) and power (often 80%)
28
With the mean, μ1, of the group 1, and the expected mean, μ2, of the group 2, andSD’ i 1 d 2 ( 1 2)SD’s in group 1 and group 2 (σ1, σ2), Under the 5% significance level, 80% power,
(Δ= μ1- μ2)
27
- 40 -
2011 의학통계 교육 (Special Topic) ◀
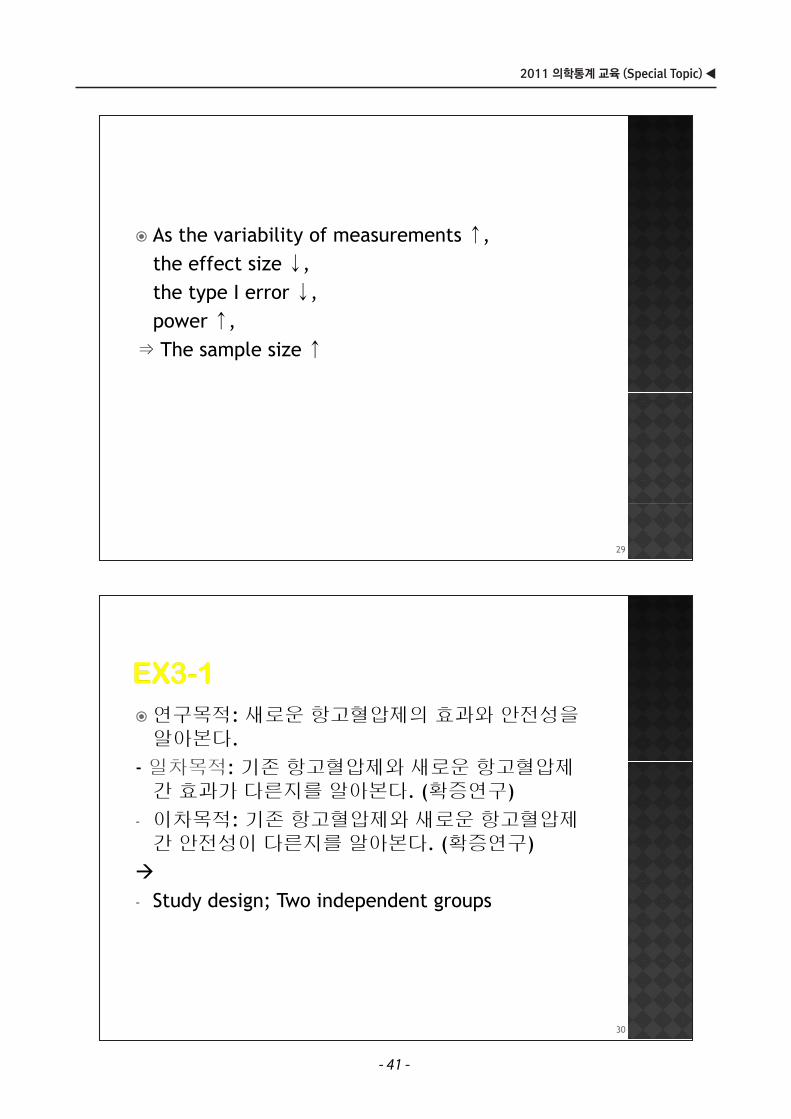
연구목적: 새로운 항고혈압제의 효과와 안전성을알아본다.일차목적 기존 항고혈압제와 새로운 항고혈압제- 일차목적: 기존 항고혈압제와 새로운 항고혈압제간 효과가 다른지를 알아본다. (확증연구)이차목적: 기존 항고혈압제와 새로운 항고혈압제- 이차목적: 기존 항고혈압제와 새로운 항고혈압제간 안전성이 다른지를 알아본다. (확증연구)
- Study design; Two independent groups
30
↑As the variability of measurements ↑, the effect size ↓, the type I error ↓, power ↑,⇒ The sample size ↑
29
- 41 -
▶ 삼성서울병원 교육수련부/통계지원팀
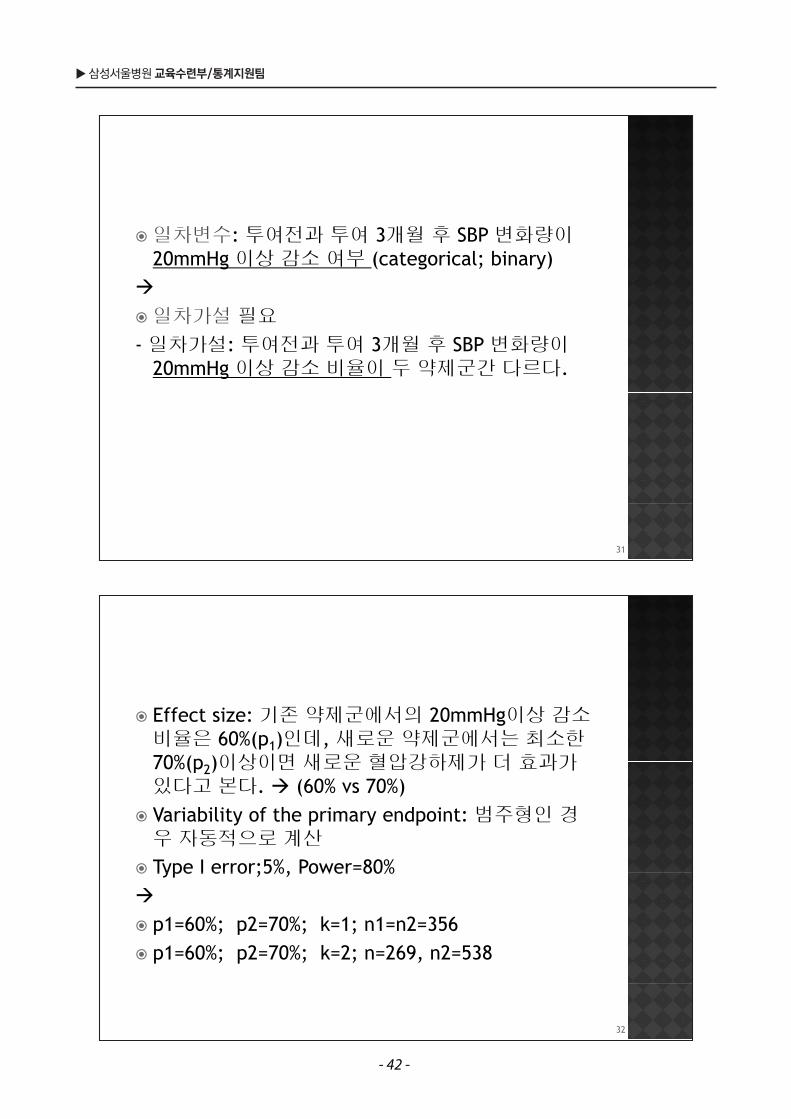
Effect size: 기존 약제군에서의 20mmHg이상 감소비율은 60%(p1)인데, 새로운 약제군에서는 최소한70%(p )이상이면 새로운 혈압강하제가 더 효과가70%(p2)이상이면 새로운 혈압강하제가 더 효과가있다고 본다. (60% vs 70%)Variability of the primary endpoint: 범주형인 경Variability of the primary endpoint: 범주형인 경우 자동적으로 계산
Type I error;5%, Power=80%Type I error;5%, Power 80%
p1=60%; p2=70%; k=1; n1=n2=356 p1 60%; p2 70%; k 1; n1 n2 356 p1=60%; p2=70%; k=2; n=269, n2=538
32
수일차변수: 투여전과 투여 3개월 후 SBP 변화량이20mmHg 이상 감소 여부 (categorical; binary)
일차가설 필요
일차가설 투여전과 투여 3개월 후 SBP 변화량이- 일차가설: 투여전과 투여 3개월 후 SBP 변화량이20mmHg 이상 감소 비율이 두 약제군간 다르다.
31
- 42 -
2011 의학통계 교육 (Special Topic) ◀
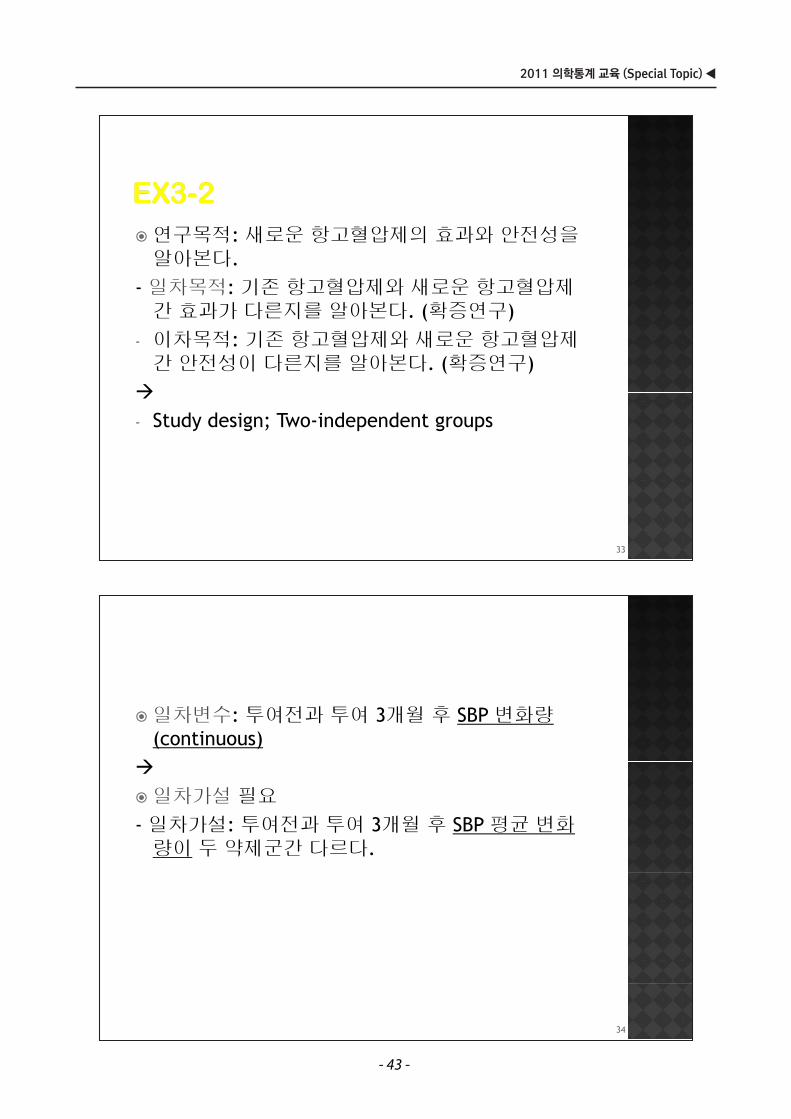
수일차변수: 투여전과 투여 3개월 후 SBP 변화량(continuous)
일차가설 필요
일차가설 투여전과 투여 3개월 후 SBP 평균 변화- 일차가설: 투여전과 투여 3개월 후 SBP 평균 변화량이 두 약제군간 다르다.
34
연구목적: 새로운 항고혈압제의 효과와 안전성을알아본다.일차목적 기존 항고혈압제와 새로운 항고혈압제- 일차목적: 기존 항고혈압제와 새로운 항고혈압제간 효과가 다른지를 알아본다. (확증연구)이차목적: 기존 항고혈압제와 새로운 항고혈압제- 이차목적: 기존 항고혈압제와 새로운 항고혈압제간 안전성이 다른지를 알아본다. (확증연구)
- Study design; Two-independent groups
33
- 43 -
▶ 삼성서울병원 교육수련부/통계지원팀
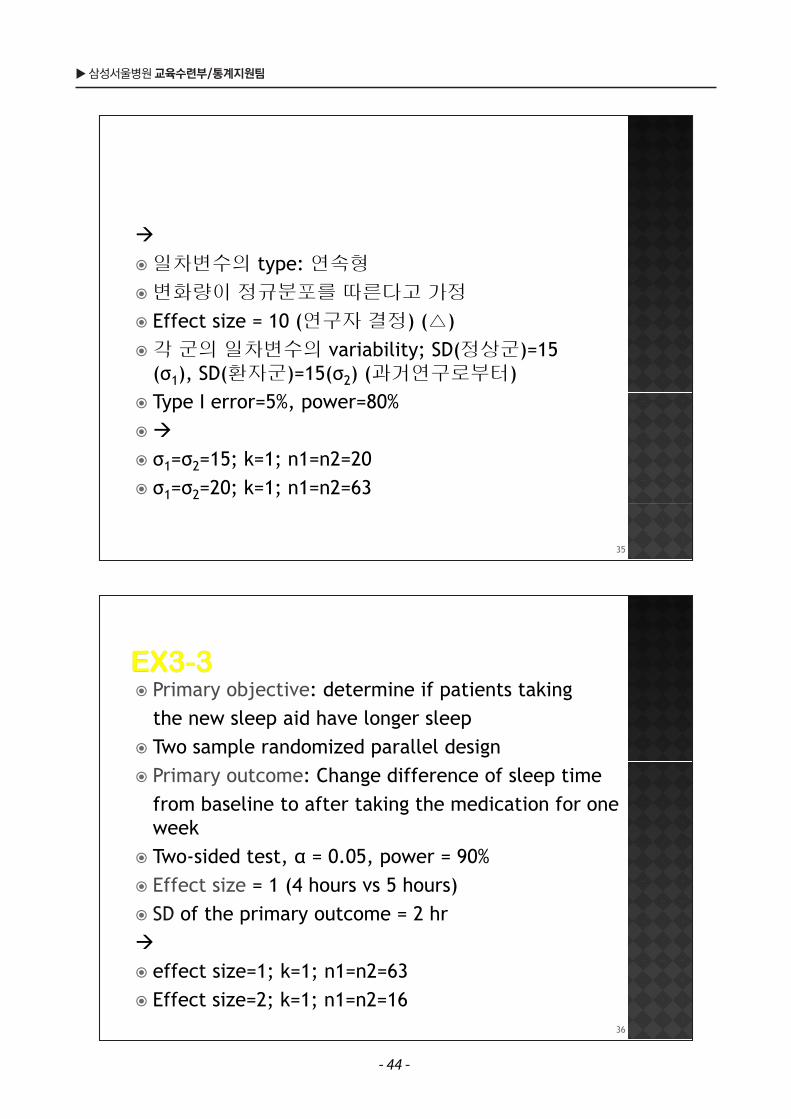
Primary objective: determine if patients taking the new sleep aid have longer sleepTwo sample randomized parallel designPrimary outcome: Change difference of sleep time from baseline to after taking the medication for one weekTwo-sided test, α = 0.05, power = 90%Effect size = 1 (4 hours vs 5 hours)SD of the primary outcome = 2 hr
effect size=1; k=1; n1=n2=63Effect size=2; k=1; n1=n2=16
36
일차변수의 type: 연속형
변화량이 정규분포를 따른다고 가정
Effect size = 10 (연구자 결정) (△)각 군의 일차변수의 variability; SD(정상군)=15 (σ1), SD(환자군)=15(σ2) (과거연구로부터)Type I error=5%, power=80%
σ1=σ2=15; k=1; n1=n2=20σ1=σ2=20; k=1; n1=n2=63
35
- 44 -
2011 의학통계 교육 (Special Topic) ◀
Objective: Demonstrate the difference between the groupsAlt ti Diff b t th Alternative: Difference between the groupsNull: No difference between the groups
Objective: Demonstrate the equivalence b t th gbetween the groupsAlternative: No difference between the groupsN ll Diff b t th Null: Difference between the groups
38
Power = 1-β = P( reject H0 | H1 true )“Probability of rejecting the null hypothesis if th lt ti h th i i t ”the alternative hypothesis is true.”
Hi h M bj tHigh power More subjects
Alt ti h th i Th h th i f th Alternative hypothesis: The hypothesis for the study to want to proveNull hypothesis: The opposite hypothesis of Null hypothesis: The opposite hypothesis of alternative hypothesis
37
- 45 -
▶ 삼성서울병원 교육수련부/통계지원팀
Design is …..
Randomized controlled trial (RCT) Block/stratified-block randomized trial Equivalence trial Non-randomized intervention study Observational study Prevalence study Measuring sensitivity and specificity …
40
Phase III: industry minimum = 80%Proteomics/genomics studies: aim for high power b T II b !because Type II error a bear!Phase II: sometime > 80%
39
- 46 -
2011 의학통계 교육 (Special Topic) ◀
Independence of the compared groups
Independent groupsPaired (Matched) groups
42
The number of compared groups
One groupTwo groupsMore than two groups
41
- 47 -
▶ 삼성서울병원 교육수련부/통계지원팀
Similar to non-equality (difference) study
Use equivalence margin (maximum difference to be equivalent) instead of effect sizeU Z i d f ZUse Z1-α instead of Z1-α/2
Use Z1-β/2 instead of Z1-β
Sample size required to demonstrate equivalence larger than required to demonstrate equivalence larger than required to demonstrate a difference
44
Paired (Matched) group design
Comparison of Means (paired t-test)N depends on
Expected Mean difference from paired data SD of differences between the pairs
Comparison of ProportionsN depends on
Proportion of the discordant pairs
43
- 48 -
2011 의학통계 교육 (Special Topic) ◀
Repeated measures Groups of equal sizes Hierarchical data
46
Use non-inferiority margin instead of effect size
45
- 49 -
▶ 삼성서울병원 교육수련부/통계지원팀
"A previous study in this area recruited 150 subjects and found highly significant results (p=0 014) and therefore a similar sample size (p=0.014), and therefore a similar sample size should be sufficient here."
Previous studies may have been 'lucky' to find Previous studies may have been lucky to find significant results, due to random sampling variation.
48
St d ’ i t i th i bl d Study’s primary outcome is the variable you do the sample size calculation for
If secondary outcome variables considered If secondary outcome variables considered important make sure sample size is sufficient
Increase the ‘real’ sample size to reflect loss to follow up, expected response rate, lack of compliance etccompliance, etc.
Make the link between the calculation and increaseincrease
47
- 50 -
2011 의학통계 교육 (Special Topic) ◀
No prior information on standard deviations Give the size of difference that may be d t t d i t f b f t d d detected in terms of number of standard deviations
50
"S l i t id d b th i "Sample sizes are not provided because there is no prior information on which to base them.”
Find previously published information Conduct small pre-studyConduct small pre study
If a very preliminary pilot study, sample size y p y p y, pcalculations not usually necessary
49
- 51 -
▶ 삼성서울병원 교육수련부/통계지원팀
"Th li i d 50 ti t f "The clinic sees around 50 patients a year, of whom 10% may refuse to take part in the study. Therefore over the 2 years of the study, the Therefore over the 2 years of the study, the sample size will be 90 patients. "
Although most studies need to balance feasibility with study power, the sample size should not be decided on the number of available patients decided on the number of available patients alone. If you know # of patients is an issue, can phrase y p , pin terms of power
52
Make a sample size or power tableUse a wide variety of possible standard d i tideviationsProtect with high sample size if possible
51
- 52 -
2011 의학통계 교육 (Special Topic) ◀
Get some input from a statisticianThis part of the design is vital and mistakes can b tl !be costly!
Take all calculations with a few grains of salt“F d f t ” i i t t!“Fudge factor” is important!
Analysis Follows Design
54
Questions → Hypotheses →Experimental Design → Samples →Data → Analyses →Conclusions
Take all of your design information to a statistician early and often
GuidanceAssumptions
53
- 53 -

●●● 삼성서울병원 교육수련부 / 통계지원팀 ●●●
2011 의학통계 교육 (기초)
●●● 삼성서울병원 교육수련부 / 통계지원팀 ●●●
2011 의학통계 교육 (Special Topic)
통계적방법 및 논문작성(실례 - Published Articles)
- 55 -

▶ 삼성서울병원 교육수련부/통계지원팀
Statistical issuesStatistical issues(Description of) Study design(Documenting) Statistical methods appliedData analysisSummarizing (and Presenting) Study dataInterpretation of study results
2
통계적방법 및 논문작성통계적방법 및 논문작성
– Published Articles
- 57 -
2011 의학통계 교육 (Special Topic) ◀
Statistical Errors and Deficiencies related to Data Analysisrelated to Data Analysis
Use of wrong statistical tests- Incomparability of statistical test with type of data examined- Unpaired tests for paired data or vice versa- Inappropriate use of parametric methods- Use of an inappropriate test for the hypothesis under investigation
Inflation of type I error- Failure to include a multiple testing correction including multiple comparison correction- Inappropriate post-hoc subgroup analysis
4
Common Statistical Errors and Deficiencies related to the Study designDeficiencies related to the Study design
Study aims and primary outcome measures not clearly stated or unclearor unclearFailure to report number of participants or observations (sample size), withdrawals from the studyNo a priori sample size calculationNo clear a priori statement or description of the hypothesis under investigationunder investigationFailure to use and report randomization; Method of randomization not clearly statedFailure to use and report blinding if possibleFailure to report initial equality of baseline characteristics and comparability of study groupscomparability of study groupsUse of an inappropriate control groupInappropriate testing for equality of baseline characteristics
3
- 58 -
▶ 삼성서울병원 교육수련부/통계지원팀
Errors related to the Documentation of Statistical methods appliedStatistical methods applied
Failure to specify/define all tests used clear and correctly- Failure to state number of tails- Failure to state if test was paired or unpairedWrong names for statistical testsReferring to unusual or obscure methods without explanation or referenceFailure to specify which test was applied on a given set of data if more than one test was done; “Where appropriate” statement
6
Statistical Errors and Deficiencies related to Data AnalysisData Analysis
Typical errors with Student’s t-test- Failure to prove test assumptions- Unequal sample sizes for paired t-test- Improper multiple pair-wise comparisons of more than two groups- Use of an unpaired t-test for paired data or vice versa
Failure to use multivariable techniques to adjust for confounding factorsPresenting only significant factors from multivariable analysis
5
- 59 -
2011 의학통계 교육 (Special Topic) ◀
Statistical Errors and Deficiencies related to the Presentation of Study datarelated to the Presentation of Study data
Inappropriate and poor reporting of results- Results given only as p-values, no confidence intervals given- Confidence intervals given for each group rather than for contrasts- “p=NS”, “p<0.05” or other arbitrary thresholds instead of
i lreporting exact p-values- Numerical information given to an unrealistic level of recisionprecision
8
Statistical Errors and Deficiencies related to the Presentation of Study datarelated to the Presentation of Study data
Inadequate graphical or numerical description of basic data- Mean but no indication of variability of the data- Giving SE instead of SD to describe data- Use of mean (SD) to describe non-normal data- Failure to define +/- notion for describing variability or use of unlabeled error bars
7
- 60 -
▶ 삼성서울병원 교육수련부/통계지원팀
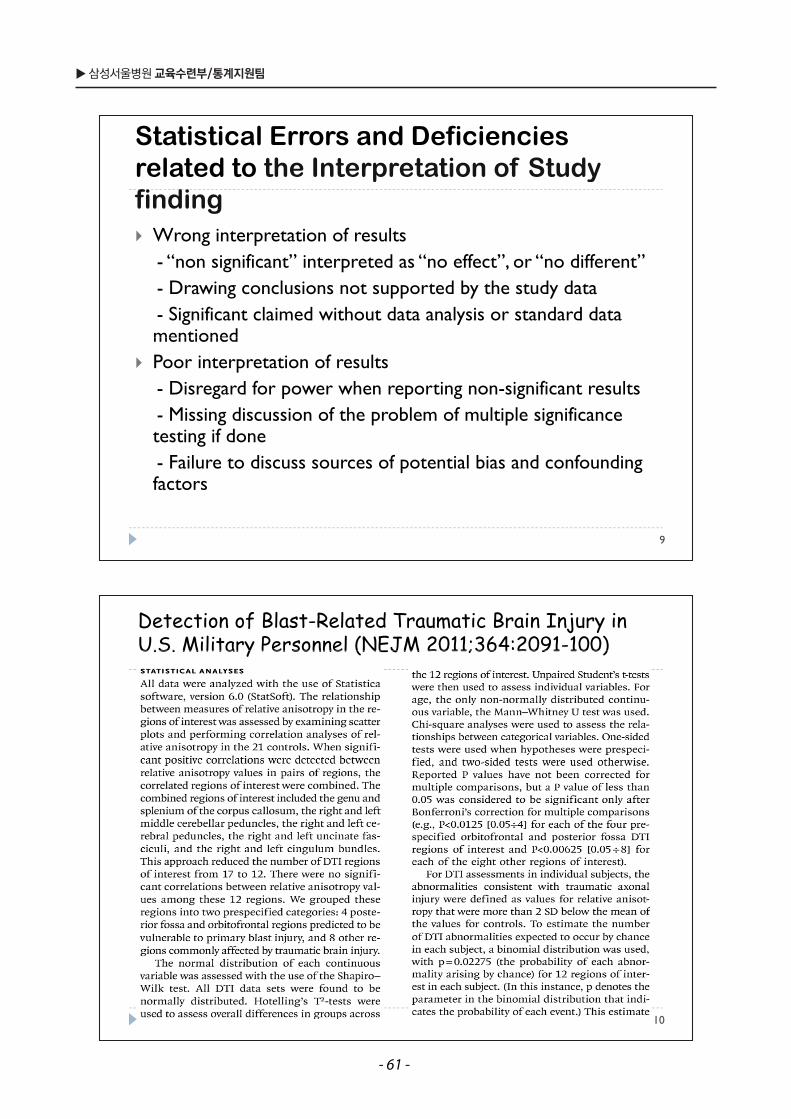
Detection of Blast-Related Traumatic Brain Injury in U.S. Military Personnel (NEJM 2011;364:2091-100)U.S. Military Personnel (NEJM 2011;364 2091 100)
10
Statistical Errors and Deficiencies related to the Interpretation of Study related to the Interpretation of Study finding
Wrong interpretation of results- “non significant” interpreted as “no effect”, or “no different”
D i l i d b h d d- Drawing conclusions not supported by the study data- Significant claimed without data analysis or standard data mentionedmentionedPoor interpretation of results- Disregard for power when reporting non-significant resultsDisregard for power when reporting non significant results- Missing discussion of the problem of multiple significance testing if done- Failure to discuss sources of potential bias and confounding factors
9
- 61 -
2011 의학통계 교육 (Special Topic) ◀
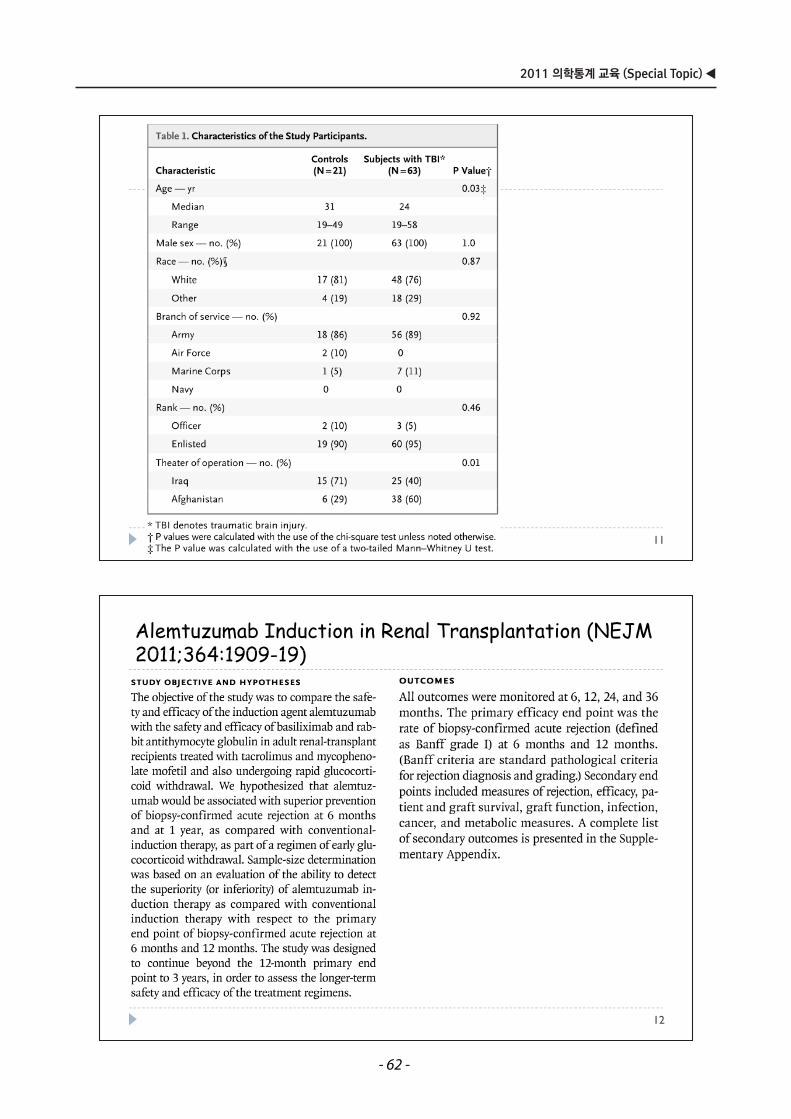
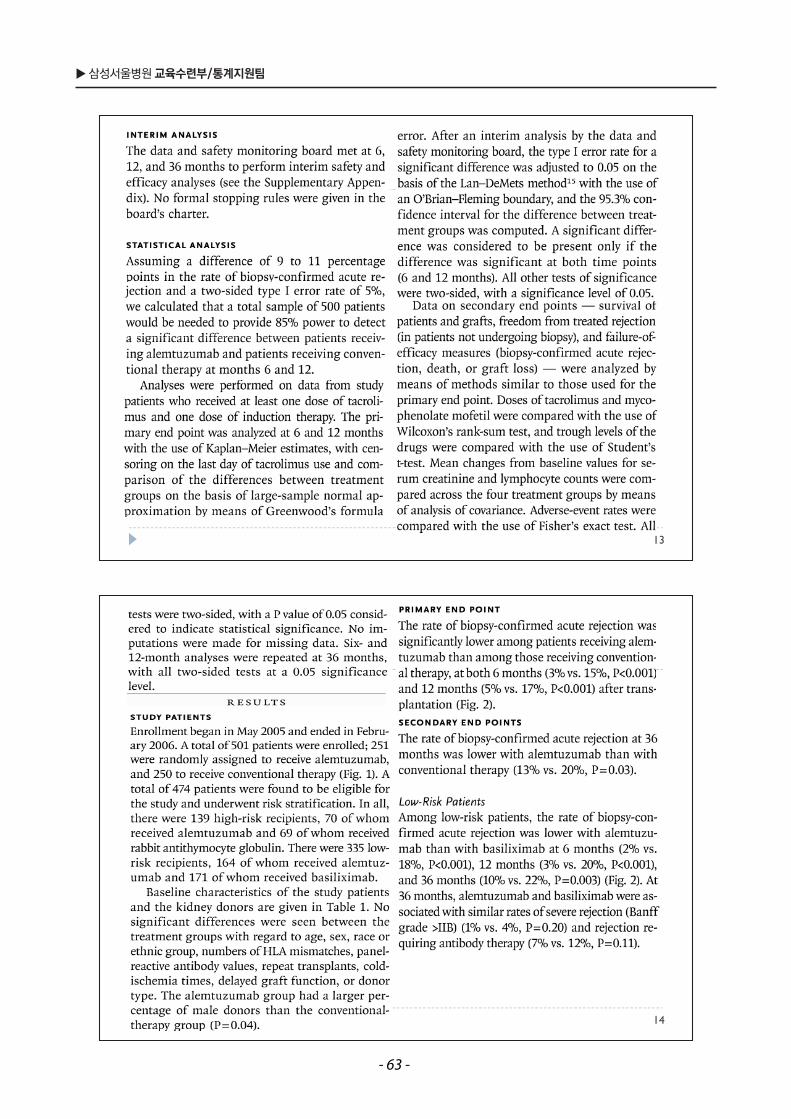
Alemtuzumab Induction in Renal Transplantation (NEJM 2011;364:1909 19)2011;364:1909-19)
12
11
- 62 -
▶ 삼성서울병원 교육수련부/통계지원팀
14
13
- 63 -
2011 의학통계 교육 (Special Topic) ◀
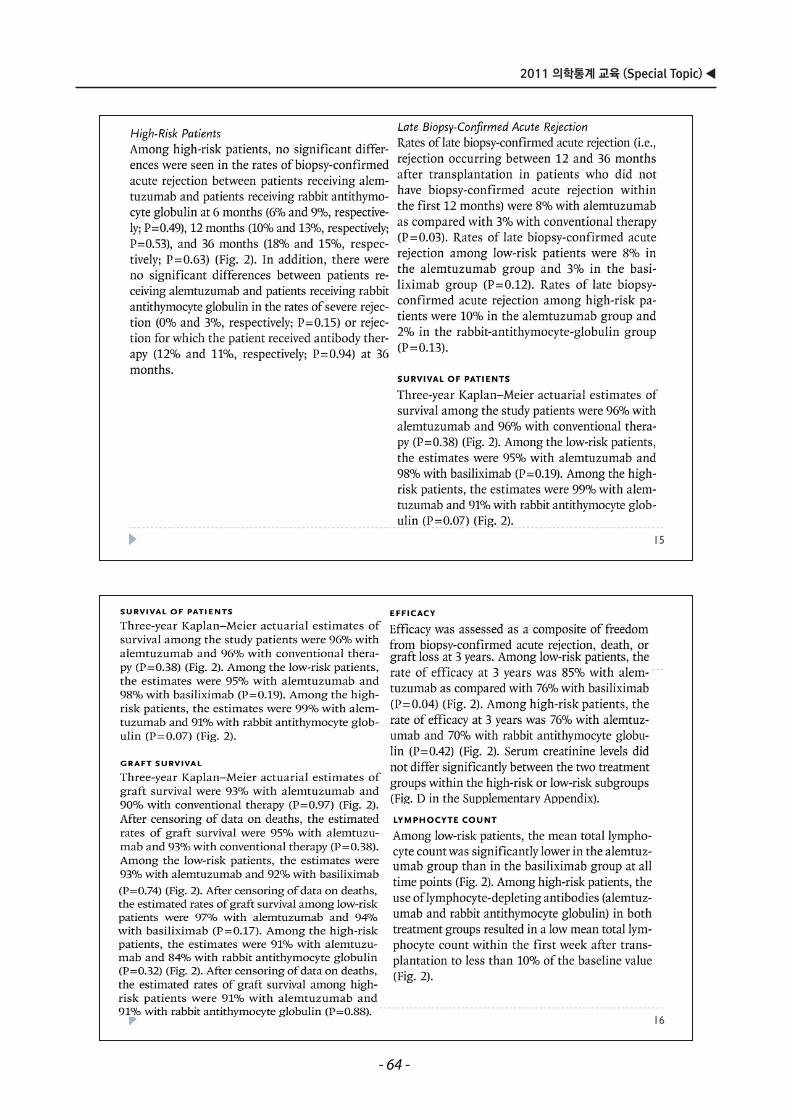
16
15
- 64 -
▶ 삼성서울병원 교육수련부/통계지원팀
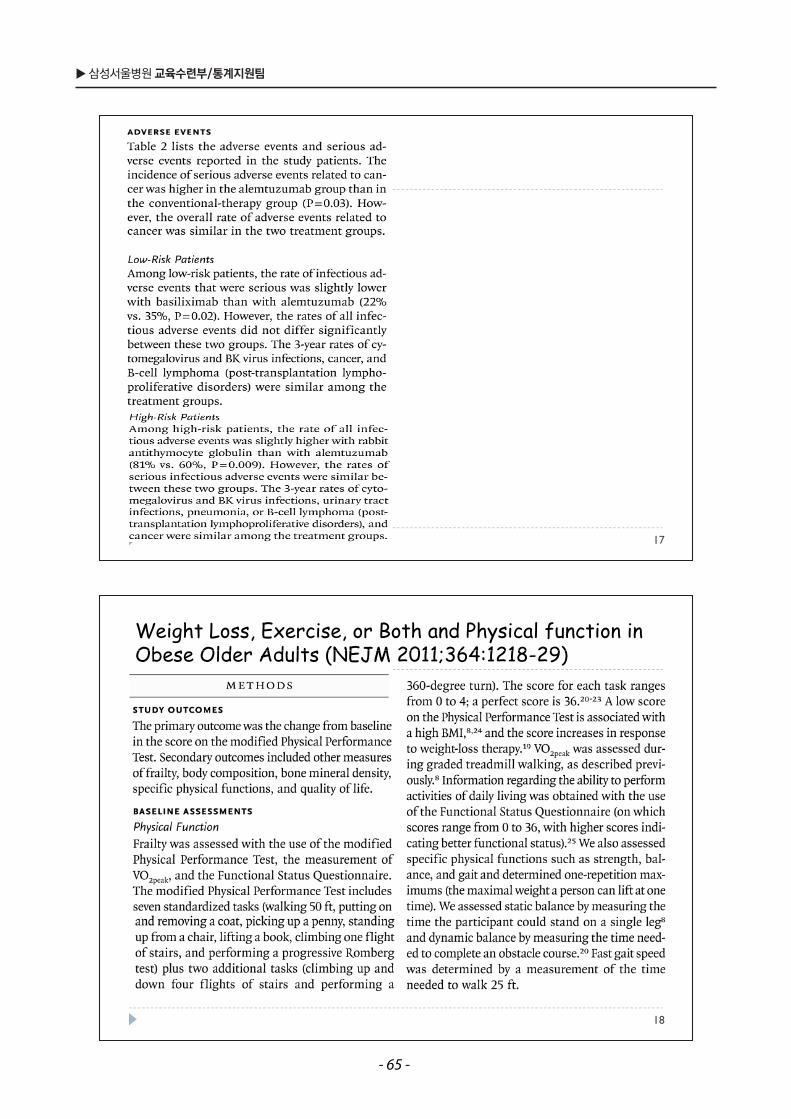
Weight Loss, Exercise, or Both and Physical function in Ob s Old Ad lts (NEJM 2011;364:1218 29)Obese Older Adults (NEJM 2011;364:1218-29)
18
17
- 65 -
2011 의학통계 교육 (Special Topic) ◀
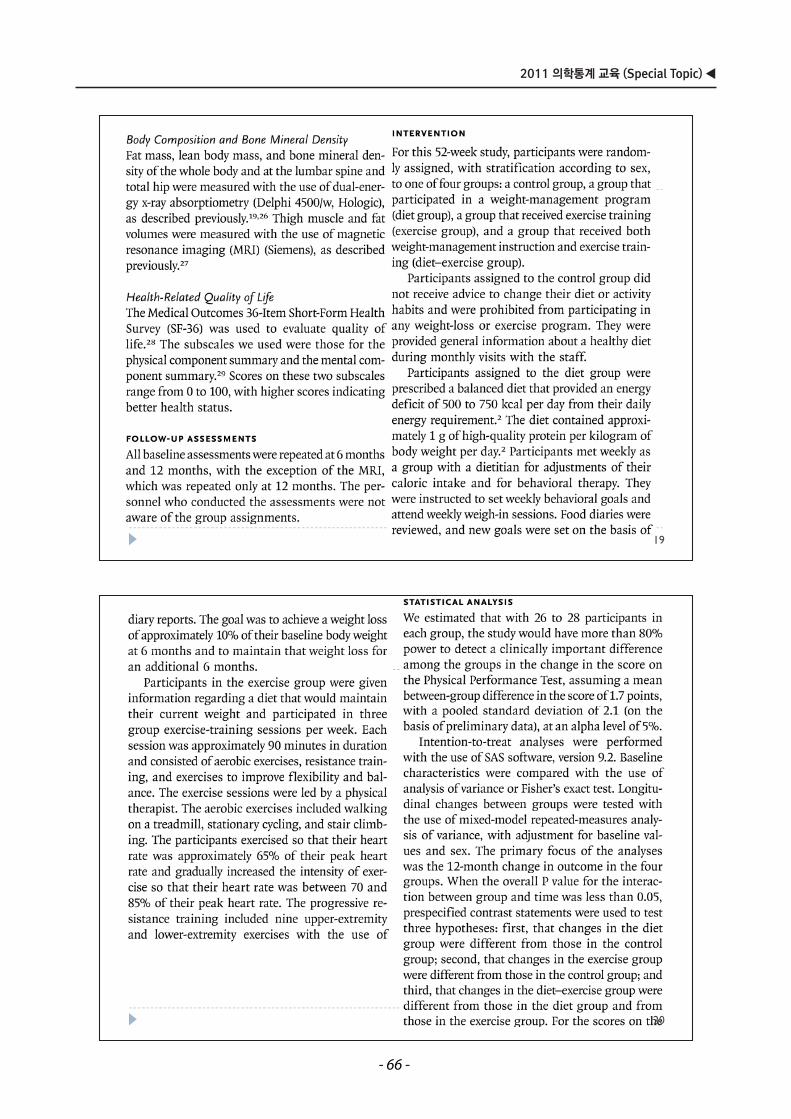
20
19
- 66 -
▶ 삼성서울병원 교육수련부/통계지원팀
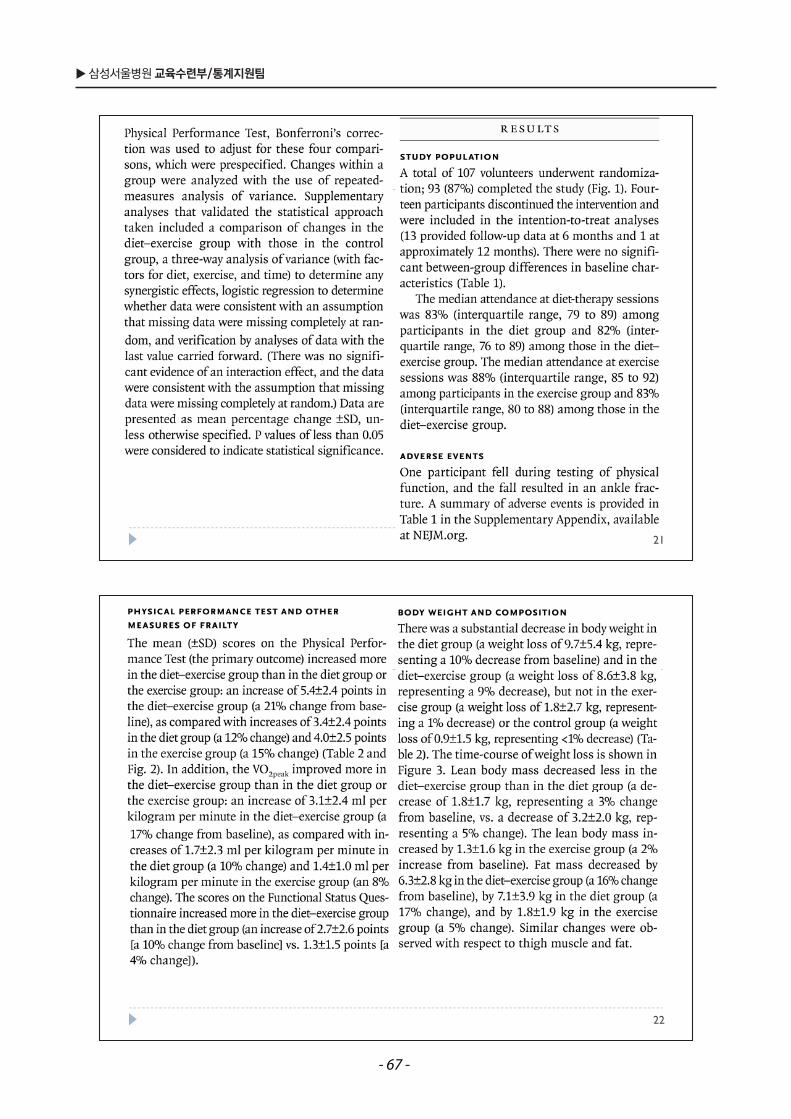
22
21
- 67 -
2011 의학통계 교육 (Special Topic) ◀
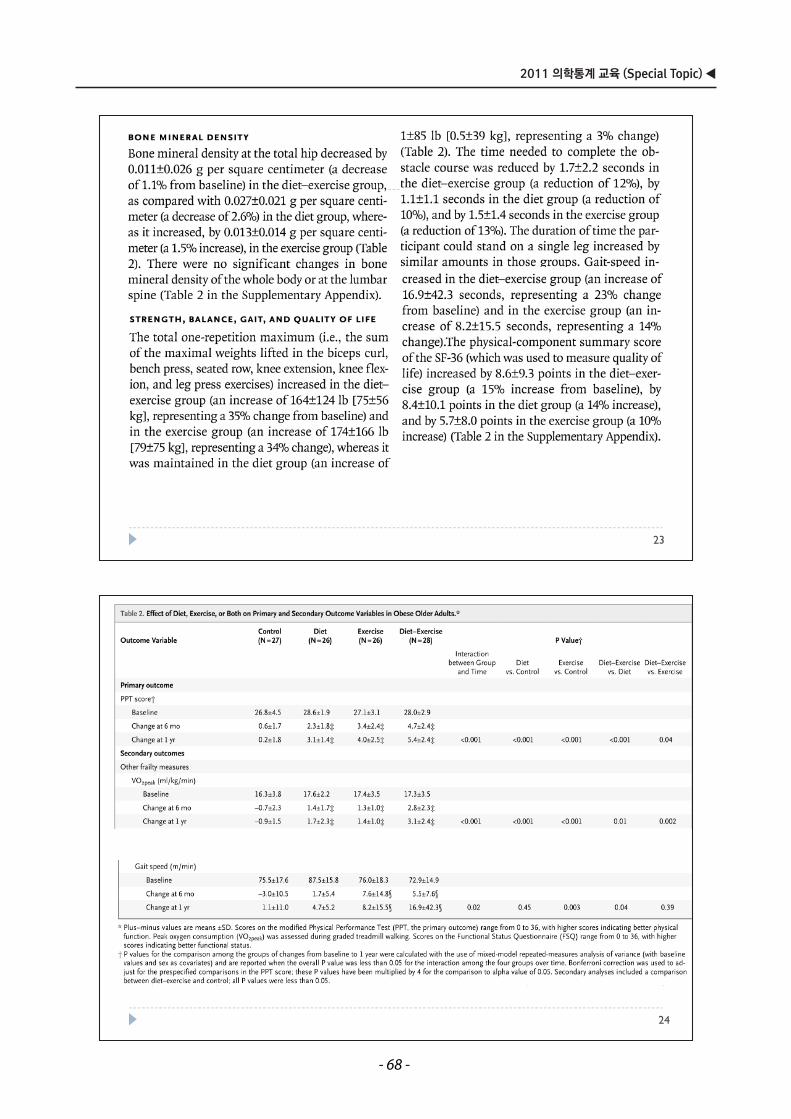
24
23
- 68 -
▶ 삼성서울병원 교육수련부/통계지원팀
Saliva Polymerase-Chain-Reaction Assay for Cytomegalovirus Screening in Newborns (NEJM 2011;364:2111 8)2011;364:2111-8)
26
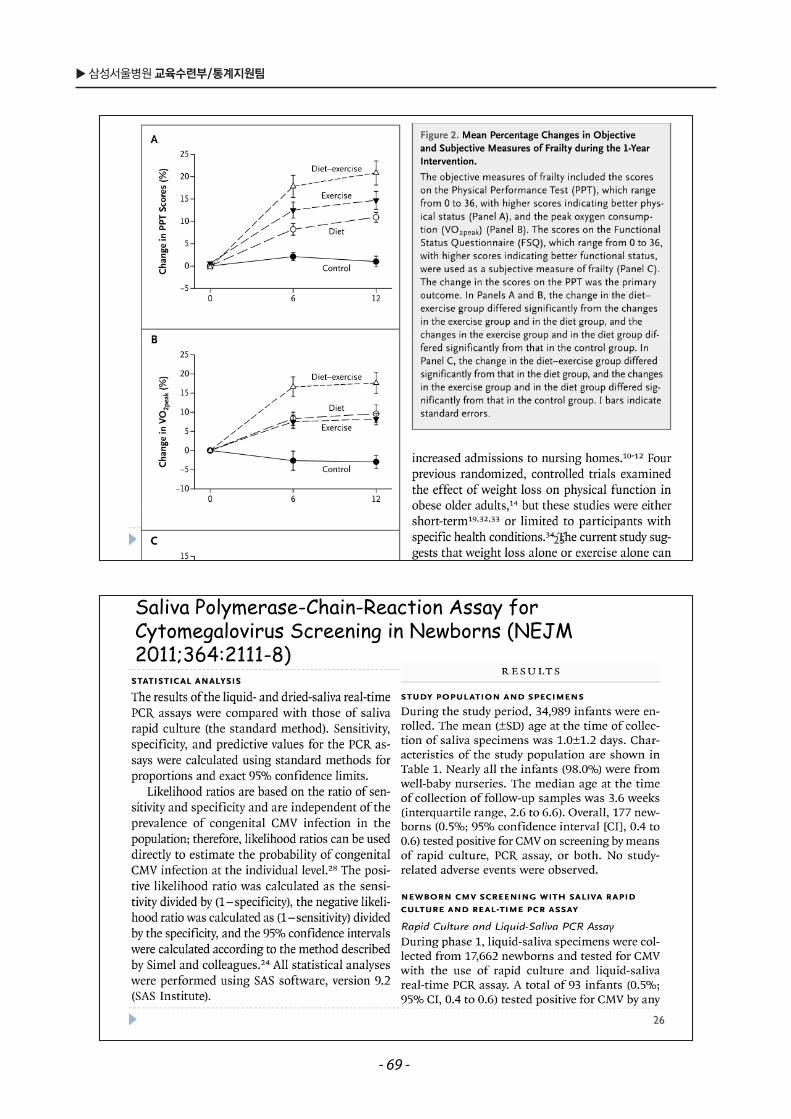
25
- 69 -
2011 의학통계 교육 (Special Topic) ◀
28
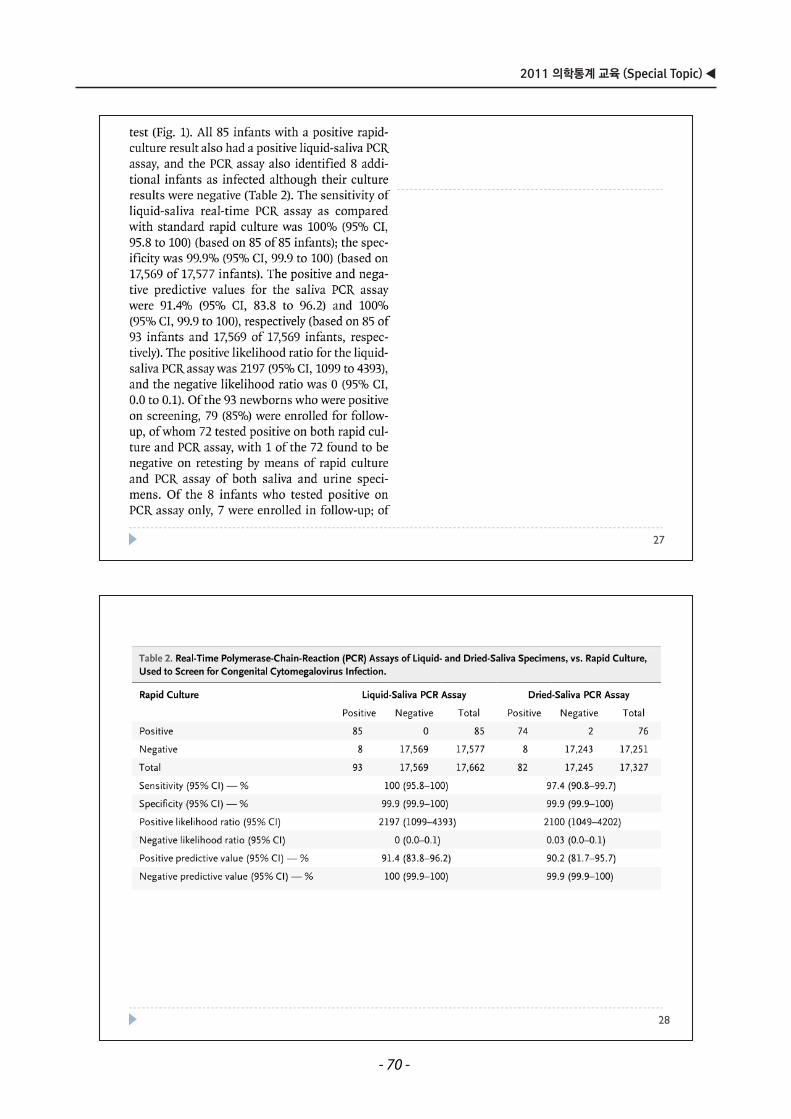
27
- 70 -
▶ 삼성서울병원 교육수련부/통계지원팀
30
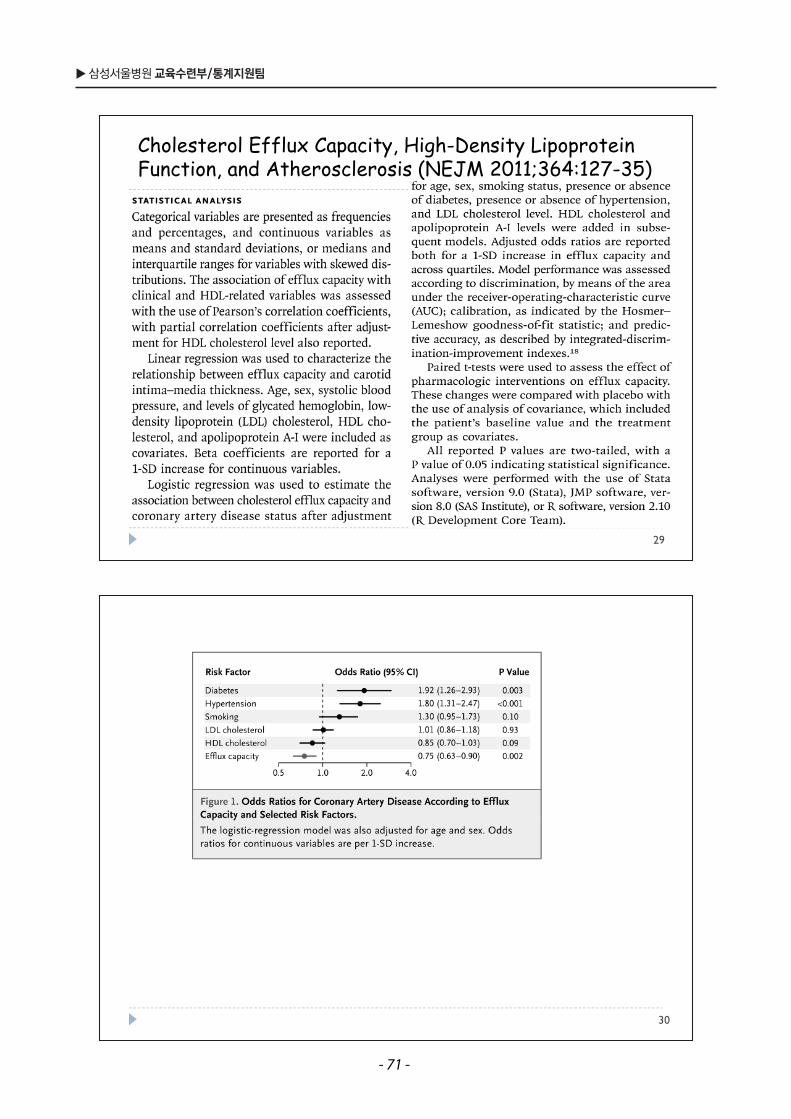
Cholesterol Efflux Capacity, High-Density Lipoprotein Function and Atherosclerosis (NEJM 2011;364:127-35)Function, and Atherosclerosis (NEJM 2011;364:127-35)
29
- 71 -
2011 의학통계 교육 (Special Topic) ◀
32
Myocardial Viability and Survival in Ischemic Left Ventricular Dysfunction (NEJM 2011;364:1617-25)Ventricular Dysfunction (NEJM 2011;364:1617-25)
31
- 72 -
▶ 삼성서울병원 교육수련부/통계지원팀
34
Adolescent BMI Trajectory and Risk of Diabetes versus C Dis s (NEJM 2011;364:1315 25)Coronary Disease (NEJM 2011;364:1315-25)
33
- 73 -
2011 의학통계 교육 (Special Topic) ◀
36
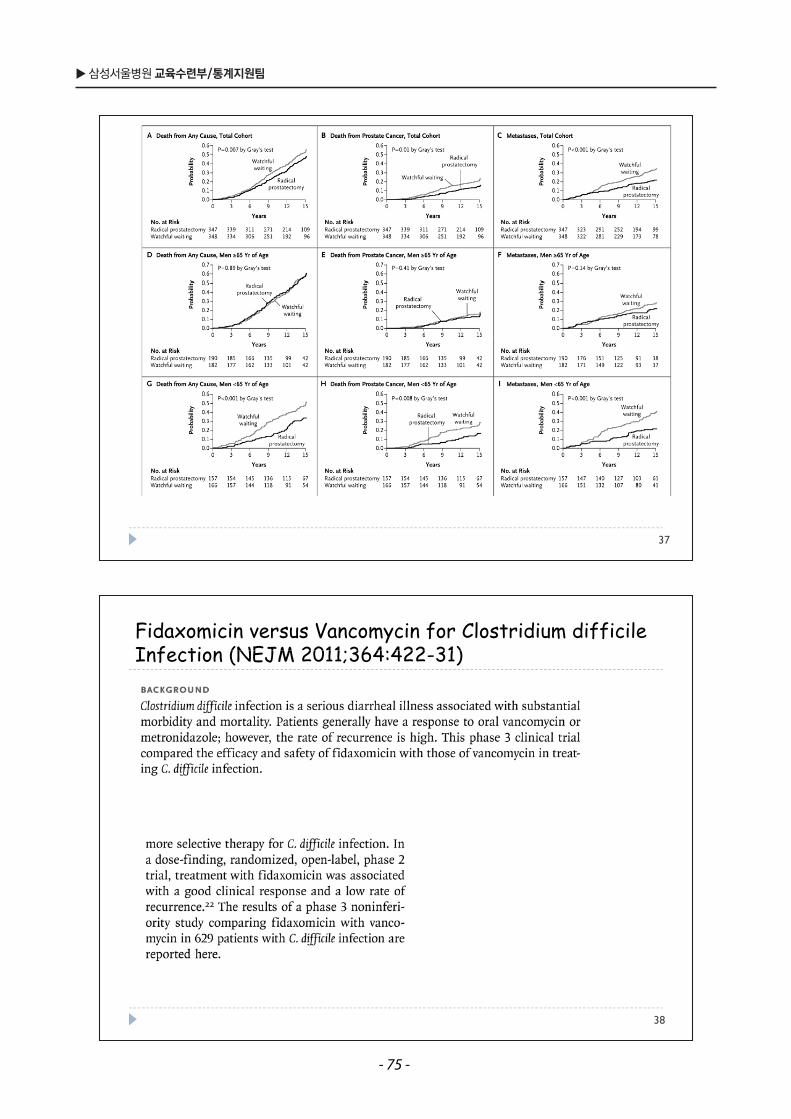
Radical Prostatectomy versus Watchful Waiting in Early P st t C (NEJM 2011;364:1708 17)Prostate Cancer (NEJM 2011;364:1708-17)
35
- 74 -
▶ 삼성서울병원 교육수련부/통계지원팀
Fidaxomicin versus Vancomycin for Clostridium difficile I f ti (NEJM 2011;364:422 31)Infection (NEJM 2011;364:422-31)
38
37
- 75 -
2011 의학통계 교육 (Special Topic) ◀
40
39
- 76 -
▶ 삼성서울병원 교육수련부/통계지원팀
42
Sirolimus- versus Palitaxel-Eluting Stents fro the Treatment of Coronary Bifurcations (JACC 2010;55:1743 50)2010;55:1743-50)
41
- 77 -
2011 의학통계 교육 (Special Topic) ◀
44
HLA-A*3101 and Carbamazepine-Induced Hypersensitivity Reactions in Europeans (NEJM 2011;364:1133 43)2011;364:1133-43)
43
- 78 -


![< 제 목 차 례 > · 2015. 8. 3. · - i - < 제 목 차 례 > [제 1편 시선유도시설 편] 1. 총칙](https://img.pdfslide.tips/doc/110x75/6078edac0fed2d4882369f84/-oe-e-e-2015-8-3-i-oe-e-e-oe-1.jpg)