Embed Size (px)
Citation preview

Review of Measures to Reduce Costs in the Private Health Insurance Market 2014
Independent Report to the Minister for Health and Health Insurance Council
October 2014
1 | P a g e

TABLE OF CONTENTS
Acknowledgements……………………………………………………… page 4
Chapter 1 Introduction…………………………………………………. page 5
Chapter 2 Analysis of Claims Cost Data - Health Insurance Authority page 9
2. 1 Introduction …………………………………………………….. page 9
2.2 Recent Irish Claims Cost Experience……………………………… page 9
2.3 Impact of Ageing………………………………………………….. page 13
2.4 Analysis of Claims Data Submitted by Insurers…………………….. page 19
Chapter 3 Summary of Submissions Received………………………… page 26
Introduction………………………………………………………………. page 26
3.1 Summary of HSE Submission…………………………………….. page 26
3.2 Summary of IHAI Submission (non-psychiatric elements)……….. page 28
3.3 Summary of Insurance Ireland Submission………………………. page 30
3.4 Summary of IHCA Submission ………..………………………… page 35
3.5 Summary of Society of Actuaries in Ireland Submission………… page 37
3.6 Summary of Submissions from Saint John of God Hospital,
St. Patrick’s Mental Health Services and IHAI on Industry
Approach to Private Psychiatry…………………………………….. page 38
Chapter 4 Chairman’s Observations and Recommendations ………… page 41
Introduction………………………………………………………………… page 41
4.1 Key Recommendations Phase 1 Interim Report…………………… page 41
4.2 Data to Analyse Trends in Industry………………………………. page 42
4.3 Private Health Insurance Claims Cost Analysis……………………. page 44
4.4 Care Setting and Resources………………………………………… page 46
4.5 Age Structure……………………………………………………… page 47
4.6 Clinical Audit and Utilisation Management………………………. page 48
2 | P a g e

4.7 Industry Approach to Private Psychiatry…………………………… page 49
4.8 Fraud, Waste & Abuse……………………………………………… page 50
4.9 Chronic Disease Management……………………………………… page 50
4.10 Claims Processing………………………………………………….. page 50
4.11 Admission & Discharge Processes…………………………………. page 51
4.12 Private A&E……………………………………………………….. page 52
Chapter 5 Conclusion.……………………………………………………… page 53
Appendix 1 Status Report on Recommendations made in Phase 1 Report page 55
Appendix 2 HIA Claims Cost Data………………………………………… page 62
3 | P a g e

ACKNOWLEDGEMENTS
I would like to acknowledge the support and co-operation I received from all participants in this review – the health insurers, the Health Insurance Authority, and the Department of Health.
Chair, Review GroupOctober 2014
4 | P a g e

Chapter 1 Introduction
1.1 Introduction
On 27 June 2013, I was appointed by the Minister for Health to Chair a Review Group under the auspices of the Consultative Forum on Health Insurance, to work with the insurance companies and the Department of Health to effect real cost reductions in the private health insurance market. The work of the Group has been conducted in two phases, with the first phase report published on 26 December 2013.
The Phase 1 report sets out the context, establishment, membership and terms of reference for both phases of the Groups’ work. The report also outlines the legislative provisions for private health insurance in Ireland, the objectives of both phases of the review and the approach and methodology followed. (Membership and Terms of Reference for the Group are reproduced at 1.2 below for reference).
On completion of Phase 1 of the review, I reported to the Minister for Health and the Health Insurance Council, and following Ministerial approval, the Group moved to Phase 2 of its review.
Work on Phase 2 has now been completed and I have reported to the Minister and the Health Insurance Council, with the results of this work now presented in this report. In particular, Phase 2 of the process focused on the compilation and analysis by the Health Insurance Authority (HIA) of claims data to assess the cost drivers for health insurance, the effects of medical technology and innovations on costs, and claims processing issues. As with Phase 1, a number of plenary meetings were held, and I also engaged in a series of bi-lateral meetings with health insurers and relevant stakeholders. I also received a number of submissions from relevant stakeholders which were examined and considered under the Phase 2 Review. A summary of these submissions is contained in Chapter 3 of this report. (Full text of the submissions is available to view on the Department of Health’s web-site at .http://www.health.gov.ie.
1.2 Membership and Terms of Reference
Membership of the Review Group is comprised of representatives of the four commercial health insurers – Aviva Health Insurance, GloHealth, Laya Healthcare and VHI Healthcare, the Department of Health and the Health Insurance Authority. The Secretariat is provided by the Department of Health.
The following Terms of Reference were agreed by the Group for Phase 1 and Phase 2 of the review process:
5 | P a g e

The Minister for Health and the four commercial private health insurers have agreed to a process to effect real cost reduction/cost management in the Irish private health insurance market to ensure its long term sustainability.
The Review Group will be chaired by Mr. Pat McLoughlin. The Review Group will also comprise representatives from the Department of Health and the HIA and will be mindful of the need to respect competition law in its deliberations. All parties will be represented by two persons. As appropriate, the Chairman may meet other stakeholders for their input in order to complete the review.
The purpose/objective of the Review Group is to consider/identify effective industry-wide cost reduction/cost management strategies for the private health insurance market (scope to include but not limited to public hospitals, private hospitals and consultants). It is envisaged that this will be a two stage process as follows:
Phase 1 – Review Group/Chair to produce a high-level analysis of measures identified to reduce/manage private health insurance costs to include proposals or recommendations on the following broad themes:
Understanding the drivers of significant increase in claims in recent years Utilisation Management Clinical audit - provision of treatment in an appropriate medical setting to appropriate care
standards, to include clarification or common understanding of day case & side room/care pathways/interaction with HSE National Clinical Programmes
Efficiency improvements in length of stay, admission processes, discharge management and claims processing, including fraud and maladministration
Provider reviews – public and private Clarification on classification of consultants Measures to promote participation of younger members in the PHI market Standard Plan for PHI (will be further progressed through the deliberations of the existing
CFHI Subgroup) Effective commercial management of proprietary drugs/utilisation of generic drugs Agreement to set targets for cost reduction/management.
Phase 1 is to be completed by end October, with the Independent Chair to report simultaneously to the Minister for Health and the Health Insurance Council.
Phase 2 – Following Stage 1, the Review Group will undertake a detailed evaluation to further develop its Stage 1 high level analysis and to include proposals/recommendations on the following:
Audit of the volume of procedures An examination of the base cost of claims - to include agreement on the benchmark costs of
a comprehensive range of procedures Further development of clinical audit and interaction with HSE Clinical Programmes Measures to introduce procedure-based payments in public hospitals and clarity on what is
6 | P a g e

chargeable, including negotiation of rates and rewards for efficiency and outcomes Measures to curb year-on year increases in claims through wider/more targeted use of claims
management tools Consideration of possible ways to lessen the impact of medical technology /innovation on
PHI costs, i.e. through cost effectiveness analysis. This will include the development of initiatives to manage procurement
Legislative measures that might be required to address cost reductions Agreement on measures to promote participation of younger members in the market, e.g.
discounts on premiums for 23-29yr olds ; introduction of LCR (will be further progressed through the deliberations of the existing CFHI Subgroup)
Industry approach to private A&Es Industry approach to private psychiatry Ways to clarify certain processes and structures which influence charges to private health
insurers, e.g. consultant classifications, consultant charges for private patients, determination of public/private patient status at admission, completeness of claims information from public hospitals
Further efficiency improvements in relation to length of stay, admission & discharge procedures and claims processing
Increased utilisation of appropriate Primary Care settings.
Phase 2 is to be completed within six months, with the Chair to report simultaneously to the Minister for Health and the Health Insurance Council.
Secretariat to the Review Group will be provided by the Department of Health.
1.3 Updated Figures
Since publication of the Phase 1 report the HIA has collated data for 2013, based on Information Returns submitted by health insurers for July to December 2013; this data is referenced in the Phase 2 report. The HIA has also collated data for the first quarter of 2014.
At the end of June 2014 there were 2,017,087 people insured with inpatient health insurance plans, or 43.9% of the population. This compares with 2,058,239 at the end of June 2013 and represents a reduction in the number of insured people of almost 41,000 over the previous 12 months. The market peaked in 2008 with 2,297,000 people insured at that time.
In 2013, Irish open membership private health insurers paid claims of €1,783m which represents a 4% decrease compared to 2012 levels of €1,856m. Between 2004 and 2008, there was an increase of 6.7% in the average claim per insured person. Between 2008 and 2012, there was an increase of 12.6% per insured person. The average cost of claims paid (prescribed benefit) per insured person fell by 2% between 2012 and 2013. The HIA notes
7 | P a g e

that while a reduction in the average claims costs per person is positive, it is based on data for claims paid and so is impacted by speed of claims payments. Further data will be required in order to determine whether reduced claims paid in 2013 is part of a change in trend.
8 | P a g e

Chapter 2 Analysis of Claims Cost Data - Health Insurance Authority
2.1 Introduction
Early in my work, we agreed that it would be important to assess the drivers behind the growth in private health insurance costs. As part of this analysis, the Health Insurance Authority submitted a paper on health insurance claims costs to the Department of Health and the Consultative Forum on Health Insurance, in July 2013.
That paper discussed the Irish experience in relation to health insurance claims costs and examined general methods used to control private health insurance claims costs, in principle and in practice, drawing on examples from other jurisdictions.
Subsequently it was agreed under the Consultative Forum that insurers would submit further data on claims costs broken down by procedure to the Health Insurance Authority and that the Authority would analyse that data.
This Chapter updates the analyses included in the July 2013 paper and adds an analysis of the data referred to above.
This data supports the indications in earlier analyses that claims costs increases between 2007 and 2012 arose mainly in relation to increased activity in private hospitals and that this increased activity is not driven primarily by demographic factors.
It is not possible to fully determine the impact that changed casemix has on claims costs from the data available because the data does not provide information on diagnosis. In order to conduct such an analysis, it would be necessary for insurers to collect and submit data on diagnosis in a consistent way. This is not currently happening but the Minister for Health intends to introduce measures that will facilitate the collection of data of this kind.
2.2 Recent Irish Claims Experience
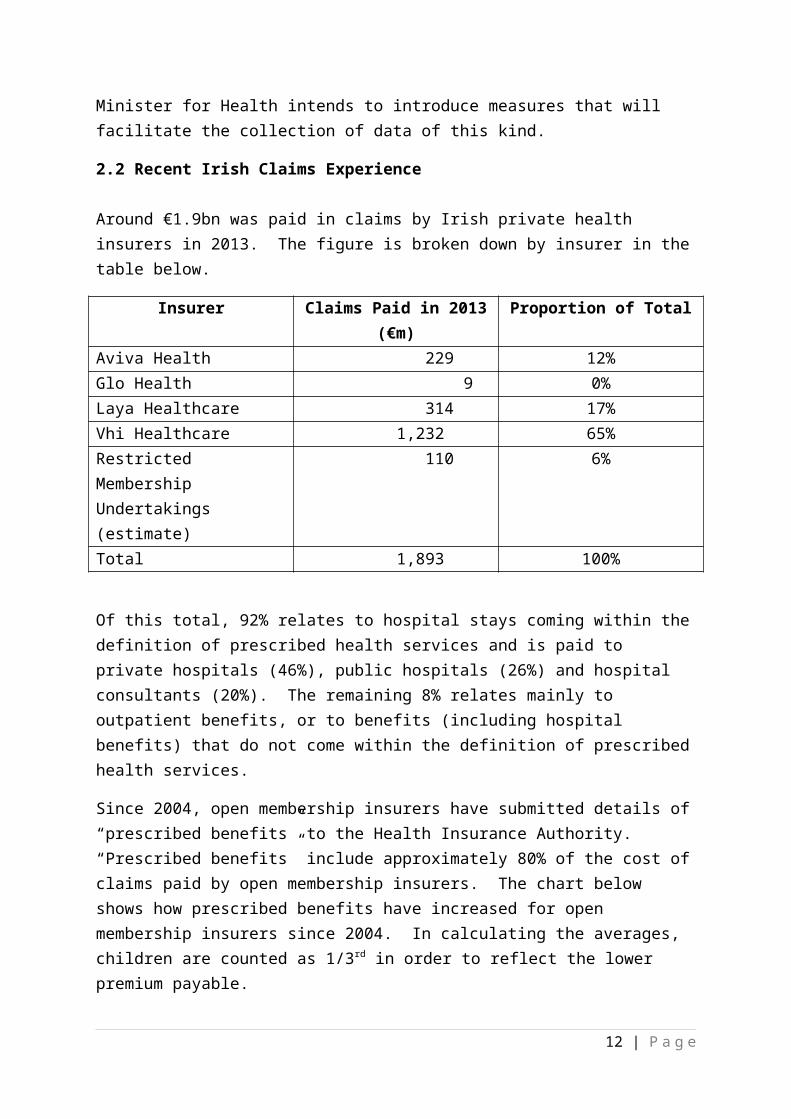
Around €1.9bn was paid in claims by Irish private health insurers in 2013. The figure is broken down by insurer in the table below.
Insurer Claims Paid in 2013 (€m) Proportion of TotalAviva Health 229 12%Glo Health 9 0%Laya Healthcare 314 17%Vhi Healthcare 1,232 65%Restricted Membership Undertakings (estimate)
110 6%
Total 1,893 100%
9 | P a g e

Of this total, 92% relates to hospital stays coming within the definition of prescribed health services and is paid to private hospitals (46%), public hospitals (26%) and hospital consultants (20%). The remaining 8% relates mainly to outpatient benefits, or to benefits (including hospital benefits) that do not come within the definition of prescribed health services.
Since 2004, open membership insurers have submitted details of “prescribed benefits” to the Health Insurance Authority. “Prescribed benefits” include approximately 80% of the cost of claims paid by open membership insurers. The chart below shows how prescribed benefits have increased for open membership insurers since 2004. In calculating the averages, children are counted as 1/3rd in order to reflect the lower premium payable.
In the four years between 2004 and 2008, the average claim per insured person (measured by market prescribed benefit) increased by 6.7% p.a. on average. During this period, the consumer price index grew by an average of 3.9% p.a.
In the four years between 2008 and 2012, the average prescribed benefit per insured person grew by 12.6% p.a. During this period, the consumer price index fell by an average of 0.3% p.a.
In 2013, the average prescribed benefit per insured person fell by 2.2%, the first time this figure decreased since the Authority started receiving this data.
Increased Utilisation
10 | P a g e

The trend in recent years in the average number of treatment days per insured person is shown in the following chart. Again, children are counted as 1/3rd in order to reflect the lower premium payable.
Between 2004 and 2008 the average number of treatment days per insured person fell by 12%. Between 2008 and 2012 the average number of treatment days per insured person increased by 45%. It can be seen, therefore, that the increase in average claim per member between 2008 and 2012 (61%) largely results from increased usage of hospital services, with the utilisation measure increasing by (45%). The remainder of the increase results from increased cost per utilisation (11%).
In 2013, the average number of hospital treatment days per insured person fell by 3%, indicating that the reduction in average claims cost per insured person in 2013 was driven by reduced utilisation.
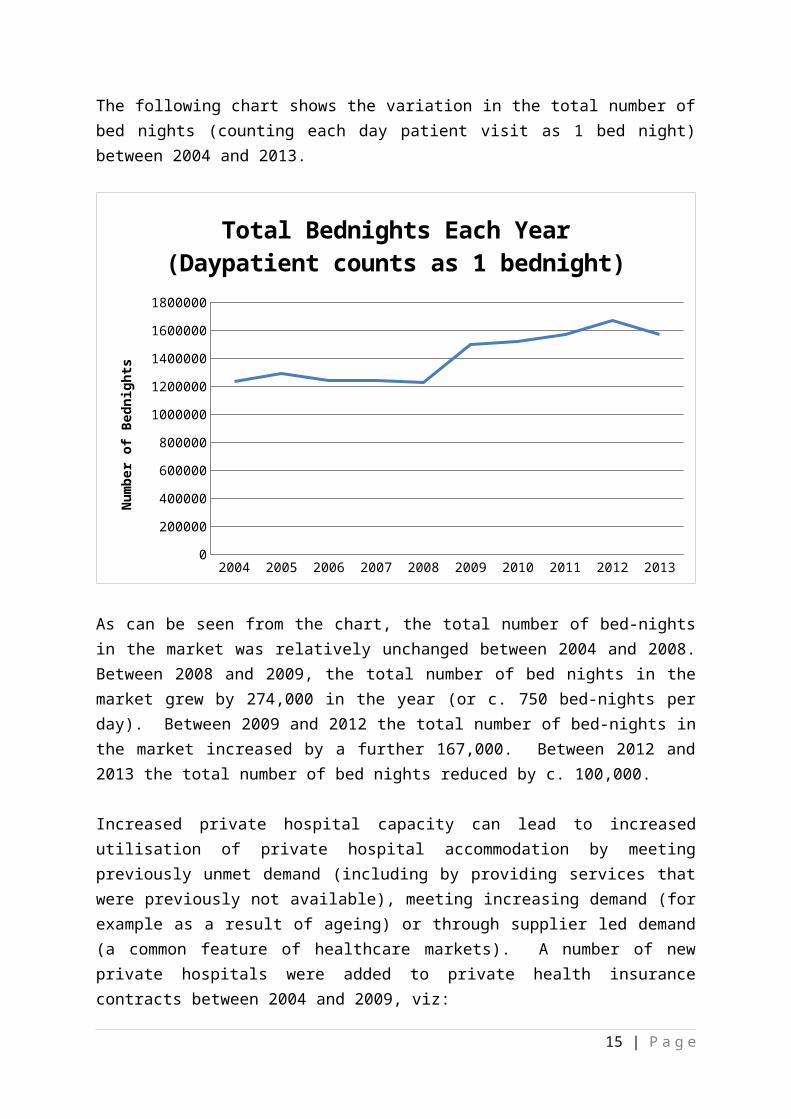
The following chart shows the variation in the total number of bed nights (counting each day patient visit as 1 bed night) between 2004 and 2013.
11 | P a g e
2004 2005 2006 2007 2008 2009 2010 2011 2012 20130
200000
400000
600000
800000
1000000
1200000
1400000
1600000
1800000
Total Bednights Each Year(Daypatient counts as 1 bednight)
Num
ber o
f Bed
nigh
ts
As can be seen from the chart, the total number of bed-nights in the market was relatively unchanged between 2004 and 2008. Between 2008 and 2009, the total number of bed nights in the market grew by 274,000 in the year (or c. 750 bed-nights per day). Between 2009 and 2012 the total number of bed-nights in the market increased by a further 167,000. Between 2012 and 2013 the total number of bed nights reduced by c. 100,000.
Increased private hospital capacity can lead to increased utilisation of private hospital accommodation by meeting previously unmet demand (including by providing services that were previously not available), meeting increasing demand (for example as a result of ageing) or through supplier led demand (a common feature of healthcare markets). A number of new private hospitals were added to private health insurance contracts between 2004 and 2009, viz:
The Galway Clinic, covered by private health insurance since 2004, 146 beds The Hermitage Medical Clinic, covered since 2007, 101 beds The Whitfield Clinic, covered since 2007, 64 beds (inpatient and day patient) The Beacon Clinic, covered since 2008, “capacity for 214 beds” The Santry Sports Clinic, covered since 2008, 62 beds (inpatient and day patient)
(Sources: Insurance policy documents, www.galwayclinic.com, www.hermitageclinic.ie, www.waterfordchamber.com, www.beaconhospital.ie, www.sportssurgeryclinic.com )
From 2010, the total number of private hospital beds continued to increase, viz;
12 | P a g e

The Blackrock Clinic main extension opened in October 2010 increasing by 50 inpatient bed capacity to 170 and providing for an expanded 30 bed day surgery unit, as well as a new A&E department.
St Vincent’s Private Hospital moved to a new building, which opened in November 2010 with 236 inpatient beds (previously 164) and additionally, an expanded day case/day surgery facility with 54 beds (previously 36).
Mater Private Cork opened in January 2013 with 75 beds with business from the old Shanakiel Hospital (44 beds) transferring to it.(Sources: www.svph.ie, www.blackrock-clinic.ie, www.materprivate.ie, www.irishexaminer.com )
The substantial change in the role of the National Treatment Purchase Fund has almost eliminated demand for private hospital stays from publicly funded patients and made additional capacity available for use in private hospitals by insurance funded private patients.
It can be seen that there has been a very substantial increase in private hospital capacity. The Acute Hospital Bed Capacity Review: A Preferred Health System in Ireland to 2020, published by the HSE in 2007, stated that in May 2007, there were 1,654 private hospital in-patient beds and 272 day case bed/places. This was in addition to 2,227 designated inpatient and 229 day case private beds in public hospitals and not counting 200 beds in smaller private clinics. The report also stated that “It is conservatively estimated that there is a surplus of 130 private patient beds in Ireland. This increases to 900 with those currently in plan.”
2.3 Impact of Ageing
The health insurance market has been ageing since the Authority commenced receiving data on the age structure of the market in 2003. The rate of ageing increased substantially when the insured population began to decline.
The ageing of the private health insurance market is a result of the following:
Ageing of the general population. Increased private health insurance penetration amongst older people. Reduced private health insurance uptake amongst younger people.
Ageing of the General Population
The age structure of the Irish population in the last three censuses is set out in the following table, along with the age structure in the 2013 population estimate produced by the Central Statistics Office (CSO).
Age Structure of the Irish Population in the Last Three Censuses and in 2013 Estimate
13 | P a g e

Age Group 2002 2006 2011 2013 (Est)0-19 29.1% 27.2% 27.5% 27.9%20-29 16.4% 16.9% 14.3% 12.6%30-39 15.2% 15.8% 16.5% 16.4%40-49 13.3% 13.6% 13.9% 14.3%50-59 10.9% 11.1% 11.3% 11.6%60-69 7.3% 7.7% 8.6% 9.0%70-79 5.2% 5.0% 5.1% 5.3%80+ 2.6% 2.7% 2.8% 2.9%
It can be seen that the general population aged somewhat between 2002 and 2013, with the proportion of the population aged over 60 increasing from 15.1% to 17.2%. Most of this ageing took place between 2006 and 2013, during which the proportion of the population aged over 60 increased from 15.3% to 17.2%. In particular, the fastest increase in the proportion of the population aged over 60 took place between 2011 and 2013 when the proportion increased from 16.4% to 17.2%. The CSO is projecting that the rate of ageing of the population will continue, with the proportion over the age of 60 exceeding 20% of the population by 2021.
Increased Private Health Insurance Penetration amongst Older People
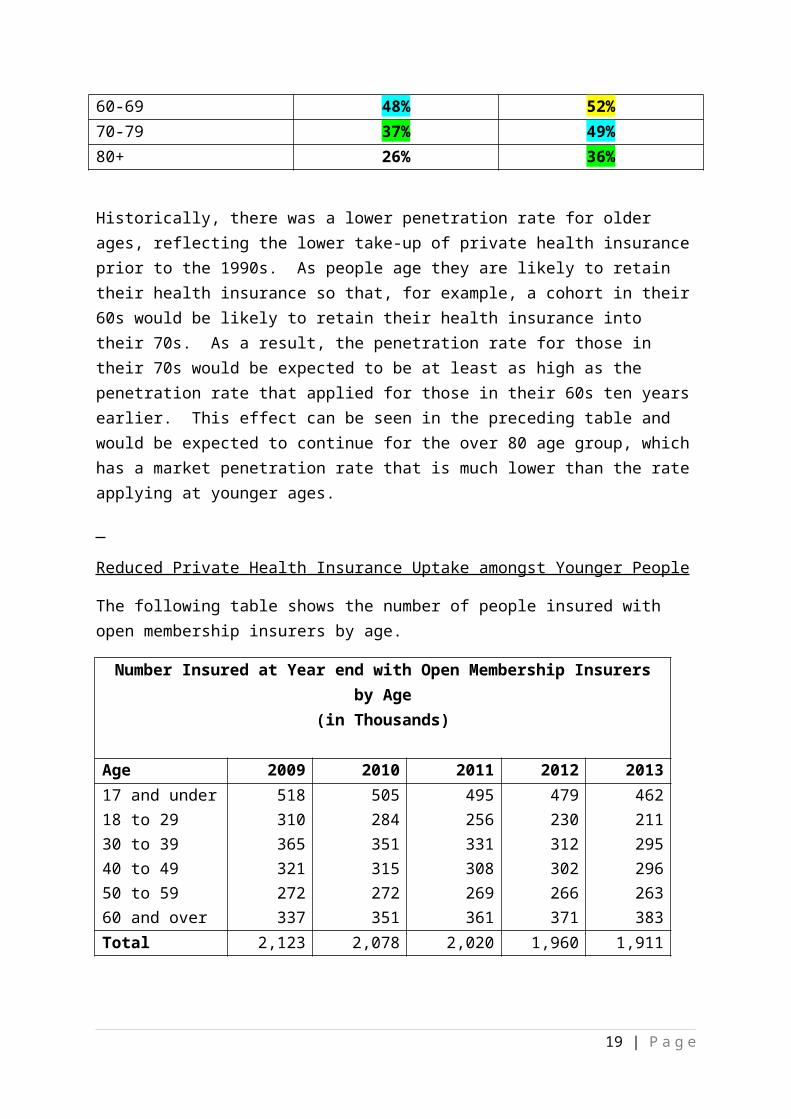
The market penetration rates of open membership insurers (i.e. the proportions of the population insured with an open membership insurer) over the age of 50 in the second half of 2003 and in the second half of 2013 are set out in the following table.
Open Membership Insurer Penetration RatesAge Group 2003 2013
50-59 52% 49%60-69 48% 52%70-79 37% 49%80+ 26% 36%
Historically, there was a lower penetration rate for older ages, reflecting the lower take-up of private health insurance prior to the 1990s. As people age they are likely to retain their health insurance so that, for example, a cohort in their 60s would be likely to retain their health insurance into their 70s. As a result, the penetration rate for those in their 70s would be expected to be at least as high as the penetration rate that applied for those in their 60s ten years earlier. This effect can be seen in the preceding table and would be expected to continue for the over 80 age group, which has a market penetration rate that is much lower than the rate applying at younger ages.
14 | P a g e
Reduced Private Health Insurance Uptake amongst Younger People
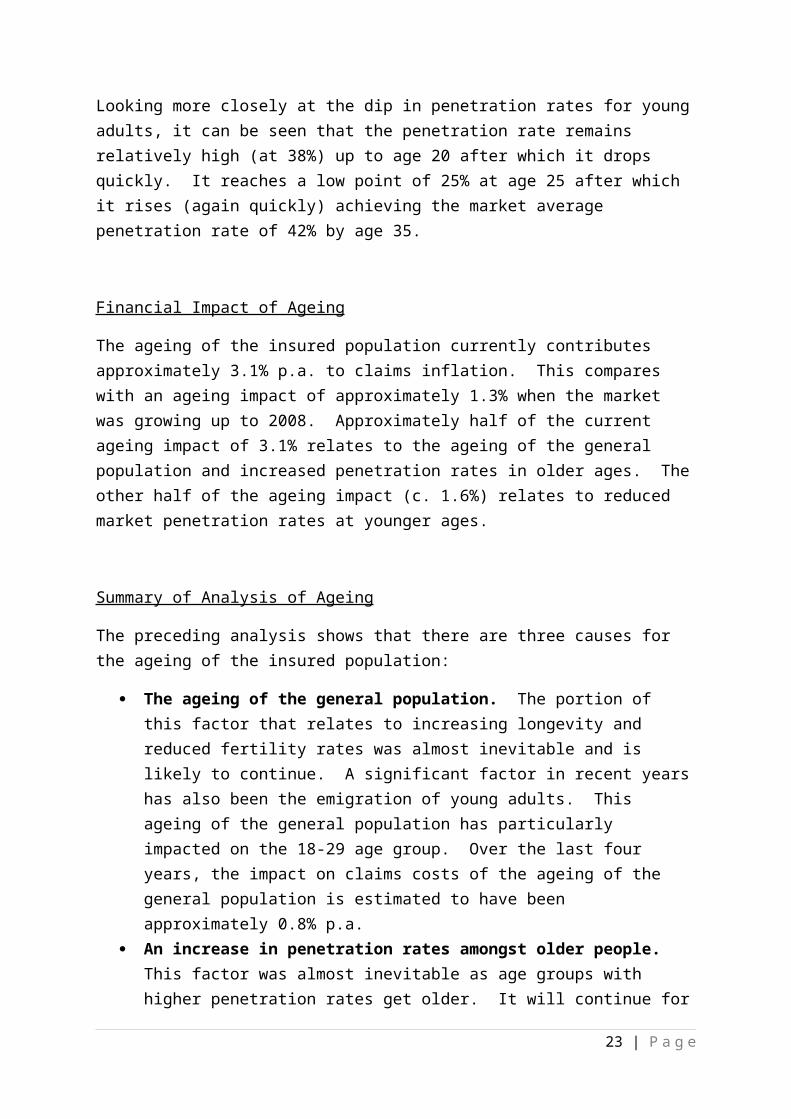
The following table shows the number of people insured with open membership insurers by age.
Number Insured at Year end with Open Membership Insurers by Age(in Thousands)
Age 2009 2010 2011 2012 201317 and under 518 505 495 479 46218 to 29 310 284 256 230 21130 to 39 365 351 331 312 29540 to 49 321 315 308 302 29650 to 59 272 272 269 266 26360 and over 337 351 361 371 383Total 2,123 2,078 2,020 1,960 1,911
It can be seen that the insured population in younger adult age groups is declining at a rapid rate. In particular, the 18-29 age group has declined 32% in four years (or 9% p.a.). The 30-39 age group has also declined rapidly, by 19% in four years or by 5% p.a.
It is noted that one reason for the decline in the number insured in the 20-29 age cohort is that this age cohort has declined significantly in the population in recent years, partly due to emigration but also partly due to the ageing of those born in the “baby boom” of the late seventies / early eighties. The number of people born in Ireland in 1990 (who are now aged 23) was 54,000, almost 30% lower than the 74,000 people born in 1980. While the insured population in the 18 to 29 age group declined by 32% between 2009 and 2013, the general population in the 20 – 29 age group declined by 23%.
On the other hand, the reduction between 2009 and 2013 of the insured populations between the ages of 30 and 39 and between the ages of 40 and 49 have occurred in spite of increases in the general population in these age groups over the same period.
Ireland: population in younger adult age cohorts (Source: CSO)2009 2010 2011 2012 2013
20-29 755 707.9 661.5 618.9 578.830-39 730.8 740.9 756.5 756.6 751.340-49 612.3 622.7 633.4 643.8 654.9All ages 4,533.4 4,554.8 4,574.9 4,585.0 4,593.120-29 -6.2% -6.6% -6.4% -6.5%30-39 1.4% 2.1% 0.0% -0.7%40-49 1.7% 1.7% 1.6% 1.7%
15 | P a g e

Market Penetration by Age
As at the end of 2013, the market penetration rate for open membership insurers is c. 42% (45% when restricted membership undertakings and those serving waiting periods are included). The following chart illustrates how market penetration rates vary by age for open membership insurers and how the rates of penetration have changed in recent years:
0-17 18-29 30-39 40-49 50-59 60-69 70-79 80+0%
10%
20%
30%
40%
50%
60%
Market Penetration Rates by Age Group - 2009 and 2013
End 2009End 2013
It can be seen that between 2009 and 2013, the penetration rate fell for all age groups up to age 70 and increased for older age groups. As discussed earlier, the increase in penetration rates at older age groups is entirely predictable and, while the penetration rate for those in their seventies is now close to the market peak, over the next 10 years the penetration rate for those over age 80 is likely to continue to increase from 36% to much closer to 49% (the penetration rate currently applying in the 70-79 age group).
Amongst the younger age groups, even though the 18-29 age group has experienced the greatest decline in insured persons, the greatest decline in penetration rates has occurred in the 30-39 age group (a decline of 13 percentage points vs a 6 percentage point decline in the 18-29 age group).
In 2011, the Information Returns Regulations were amended to provide that insurers would submit data to the Authority by year of age, enabling analysis of penetration rates by year of age (rather than age group) from 2011 on. The following chart shows how penetration rates vary by year of age at the end of 2013.
16 | P a g e

0 3 6 9 12 15 18 21 24 27 30 33 36 39 42 45 48 51 54 57 60 63 66 69 72 75 78 81 840%
10%
20%
30%
40%
50%
60%
Health Insurance Market Penetration by Age - end 2013
The chart shows that, apart from infants (for whom there is no charge prior to the first renewal date), the market penetration rate is below the market average (42%) for all ages under age 35 and is above average for all ages from 35 up to age 82. It would be expected in a voluntary community rated market for penetration rates at younger ages to be significantly lower than penetration rates at older ages and this is the case here. However, it is only between the ages of 22 and 31 (and above age 83) that the penetration rate drops below 35%. As noted earlier, the lower penetration rate for people in their 20s is not a new feature of the market.
Looking more closely at the dip in penetration rates for young adults, it can be seen that the penetration rate remains relatively high (at 38%) up to age 20 after which it drops quickly. It reaches a low point of 25% at age 25 after which it rises (again quickly) achieving the market average penetration rate of 42% by age 35.
Financial Impact of Ageing
The ageing of the insured population currently contributes approximately 3.1% p.a. to claims inflation. This compares with an ageing impact of approximately 1.3% when the market was growing up to 2008. Approximately half of the current ageing impact of 3.1% relates to the ageing of the general population and increased penetration rates in older ages. The other half of the ageing impact (c. 1.6%) relates to reduced market penetration rates at younger ages.
17 | P a g e

Summary of Analysis of Ageing
The preceding analysis shows that there are three causes for the ageing of the insured population:
The ageing of the general population. The portion of this factor that relates to increasing longevity and reduced fertility rates was almost inevitable and is likely to continue. A significant factor in recent years has also been the emigration of young adults. This ageing of the general population has particularly impacted on the 18-29 age group. Over the last four years, the impact on claims costs of the ageing of the general population is estimated to have been approximately 0.8% p.a.
An increase in penetration rates amongst older people. This factor was almost inevitable as age groups with higher penetration rates get older. It will continue for the next ten years as the penetration rates of those aged over 80 will increase from 36% to c. 50% in line with the penetration rate currently applying in the 70-79 age group. However, the effect of this factor over the next ten years would be expected to be lower than in the last ten years because the penetration rate in the 70-79 age group is already close to the peak. Over the last four years, the impact of this factor is estimated to have been approximately 0.6% p.a.
Reduced penetration rates at younger adult lives. There has been a very large reduction in the penetration rate in the 30-39 age group (of 13 percentage points) and smaller, but still large, reductions in the penetration rates in the 40-49 and 18-29 age groups (of 9 and 6 percentage points respectively). Over the last four years, the impact of this factor is estimated to have been approximately 1.6% p.a.
18 | P a g e
2.4 Analysis of Claims Data broken down by Procedure
Data Received
The four open membership insurers provided the Health Insurance Authority with data on claims paid broken down by year of admission, age, gender and hospital type. VHI Healthcare and Laya Healthcare provided the data for every year from 2007 to 2012 inclusive. Aviva Health provided the data for every year from 2009 to 2012 inclusive. GloHealth commenced operations in 2012 and, accordingly, do not have data for prior years. The insurers also provided the data for their most costly procedures (in terms of total costs).
An important factor to bear in mind when considering the data submitted is that data on casemix was not provided and, accordingly, it is not possible to allow for the impact of changes in casemix. This is especially important when considering changes in total costs but also has an impact when considering costs for individual procedures (e.g. there could be changes in the casemixes in public or private hospitals for those receiving chemotherapy which would not be apparent in this data). In order to allow fully for casemix changes it would be necessary for data to be coded by diagnosis in a consistent way across the market and submitted using a central system, such as the Hospital Inpatient Enquiry (HIPE) system. It is noted that, in the context of both universal health insurance and the enhancement of the risk equalisation system, the Minister for Health intends to introduce measures that will facilitate data collection of this kind. Analysis of Increase in Total Costs
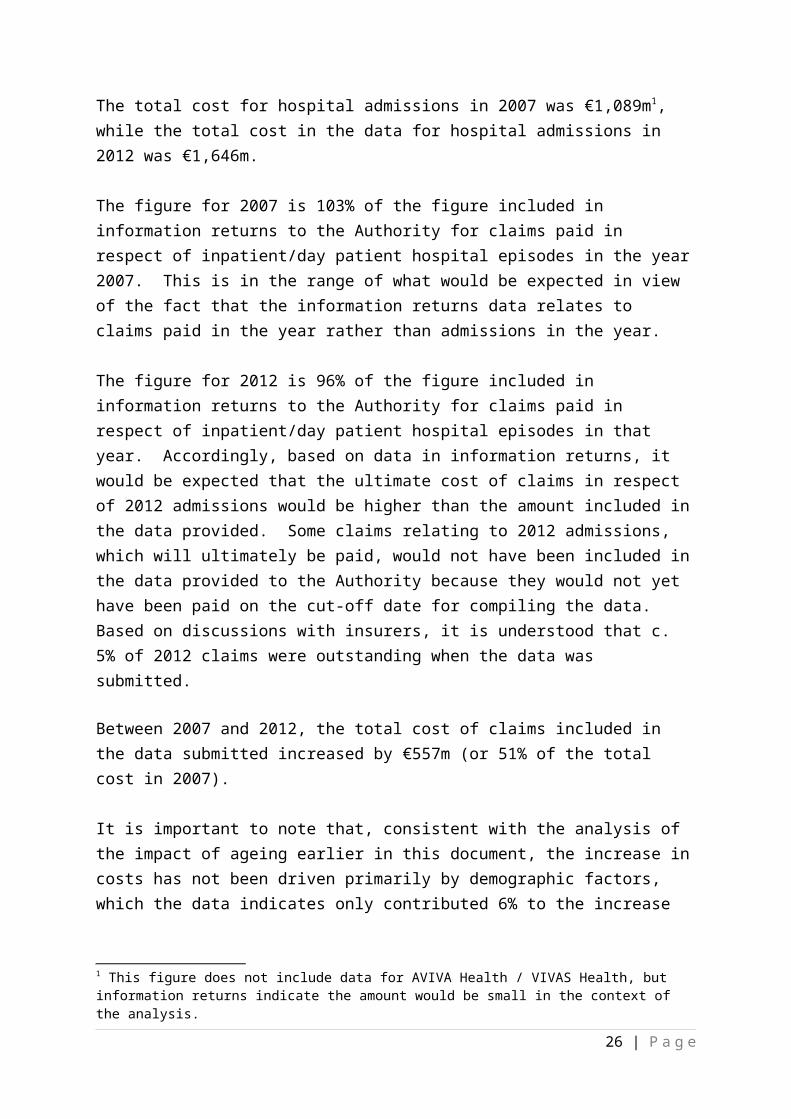
The total cost for hospital admissions in 2007 was €1,089m1, while the total cost in the data for hospital admissions in 2012 was €1,646m.
The figure for 2007 is 103% of the figure included in information returns to the Authority for claims paid in respect of inpatient/day patient hospital episodes in the year 2007. This is in the range of what would be expected in view of the fact that the information returns data relates to claims paid in the year rather than admissions in the year.
The figure for 2012 is 96% of the figure included in information returns to the Authority for claims paid in respect of inpatient/day patient hospital episodes in that year. Accordingly, based on data in information returns, it would be expected that the ultimate cost of claims in respect of 2012 admissions would be higher than the amount included in the data provided. Some claims relating to 2012 admissions, which will ultimately be paid, would not have been included in the data provided to the Authority because they would not yet have been paid on the cut-off date for compiling the data. Based on discussions with insurers, it is understood that c. 5% of 2012 claims were outstanding when the data was submitted.
1 This figure does not include data for AVIVA Health / VIVAS Health, but information returns indicate the amount would be small in the context of the analysis.
19 | P a g e

Between 2007 and 2012, the total cost of claims included in the data submitted increased by €557m (or 51% of the total cost in 2007).
It is important to note that, consistent with the analysis of the impact of ageing earlier in this document, the increase in costs has not been driven primarily by demographic factors, which the data indicates only contributed 6% to the increase in total costs (the combined effect of a 5% reduction in market size and an 11% age related increase).
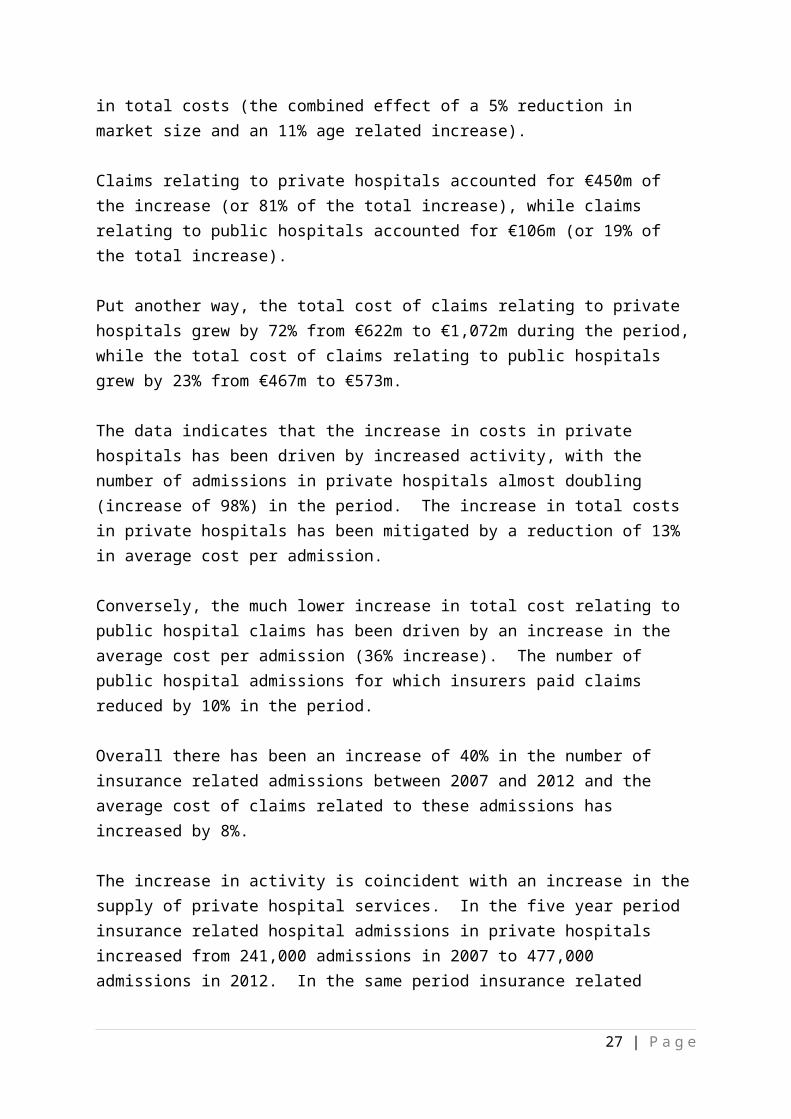
Claims relating to private hospitals accounted for €450m of the increase (or 81% of the total increase), while claims relating to public hospitals accounted for €106m (or 19% of the total increase).
Put another way, the total cost of claims relating to private hospitals grew by 72% from €622m to €1,072m during the period, while the total cost of claims relating to public hospitals grew by 23% from €467m to €573m.
The data indicates that the increase in costs in private hospitals has been driven by increased activity, with the number of admissions in private hospitals almost doubling (increase of 98%) in the period. The increase in total costs in private hospitals has been mitigated by a reduction of 13% in average cost per admission.
Conversely, the much lower increase in total cost relating to public hospital claims has been driven by an increase in the average cost per admission (36% increase). The number of public hospital admissions for which insurers paid claims reduced by 10% in the period.
Overall there has been an increase of 40% in the number of insurance related admissions between 2007 and 2012 and the average cost of claims related to these admissions has increased by 8%.
The increase in activity is coincident with an increase in the supply of private hospital services. In the five year period insurance related hospital admissions in private hospitals increased from 241,000 admissions in 2007 to 477,000 admissions in 2012. In the same period insurance related admissions in public hospitals reduced from 281,000 to 253,000.
The impact on total claims cost of average cost and activity in public and private hospitals is summarised in the table below:
20 | P a g e

Table: Impact on total claims cost of changes in activity levels and average cost per admission in public and private hospitals
Activity Average Cost Total
Public Hospitals -€ 55m € 162m € 106m
Private Hospitals € 571m -€ 121m € 450m
Total € 516m € 41m € 557m
The average cost per 2012 admission is similar in public and private hospitals (c. €2,250), although there are significant differences in casemix (e.g. public hospitals account for 35% of total claims but only 25% of claims for which data by procedure was provided) and the average length of stay in public hospitals is much longer than in private hospitals (3.2 days versus 2.2 days).
Data broken down by Procedure
Insurers were asked to provide data on their top 30 (by total cost) inpatient and day patient procedures. Accordingly the data provided excludes medical cases. The data broken down by procedure includes 37% of the total claims cost for 2012.
Analysis of this data shows similar results to the analysis of the total claims cost.
Specifically:
Total cost of these procedures increased by €194m or 46%. This increase related mainly to private hospitals, where the increase in cost was
€176m or 62%. The increase related mainly to an increase in activity (increase of 32%) rather than to
average cost per admission (increase of 11%). Looking at public and private hospitals separately it can be seen that the number of
related admissions in private hospitals increased by 63%, while the average cost per admission reduced by 13%. With respect to public hospitals, the number of related admissions reduced by 11%, while the average cost of these admissions increased by 28%.
The impact on total claims cost for procedures for which data was provided of average cost and activity in public and private hospitals is summarised in the table below:
21 | P a g e

Table: Impact of changes in activity levels and average cost per admission in public and private hospitals on the total claims cost of procedures for which data was provided
ActivityAverage
Cost Total
Public Hospitals -€ 17m € 36m € 19m
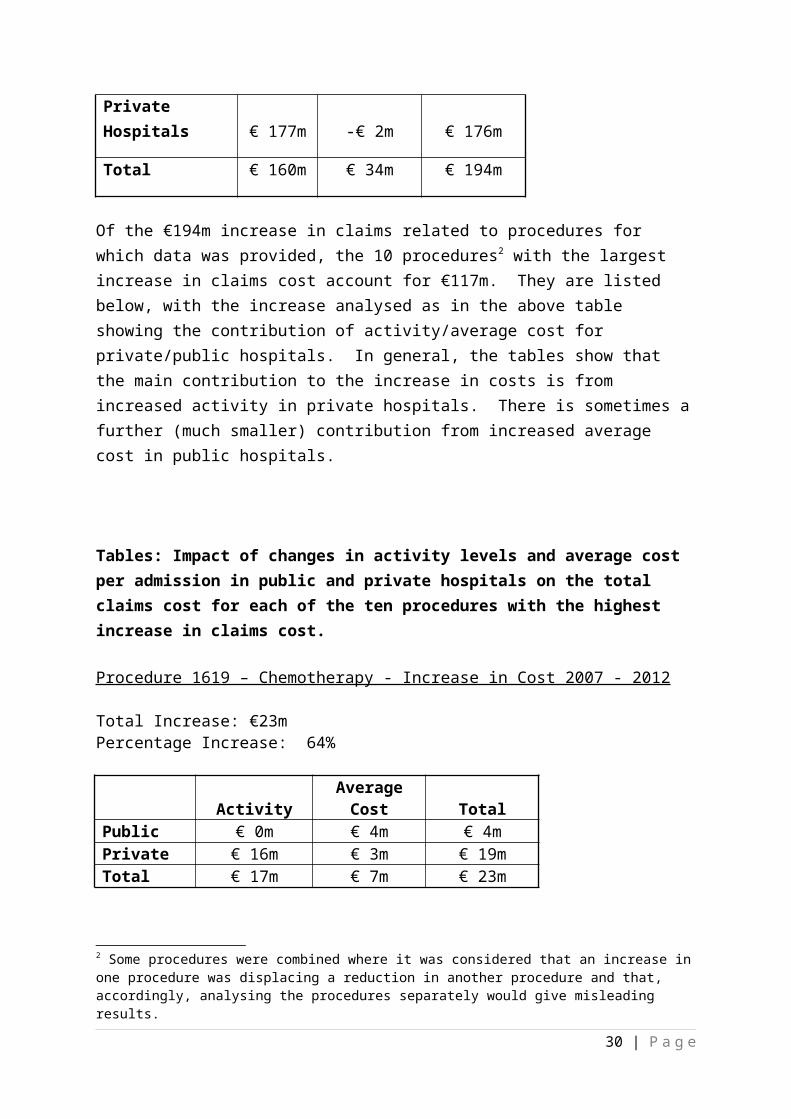
Private Hospitals € 177m -€ 2m € 176m
Total € 160m € 34m € 194m
Of the €194m increase in claims related to procedures for which data was provided, the 10 procedures2 with the largest increase in claims cost account for €117m. They are listed below, with the increase analysed as in the above table showing the contribution of activity/average cost for private/public hospitals. In general, the tables show that the main contribution to the increase in costs is from increased activity in private hospitals. There is sometimes a further (much smaller) contribution from increased average cost in public hospitals.
Tables: Impact of changes in activity levels and average cost per admission in public and private hospitals on the total claims cost for each of the ten procedures with the highest increase in claims cost.
Procedure 1619 – Chemotherapy - Increase in Cost 2007 - 2012
Total Increase: €23mPercentage Increase: 64%
Activity Average Cost TotalPublic € 0m € 4m € 4mPrivate € 16m € 3m € 19mTotal € 17m € 7m € 23m
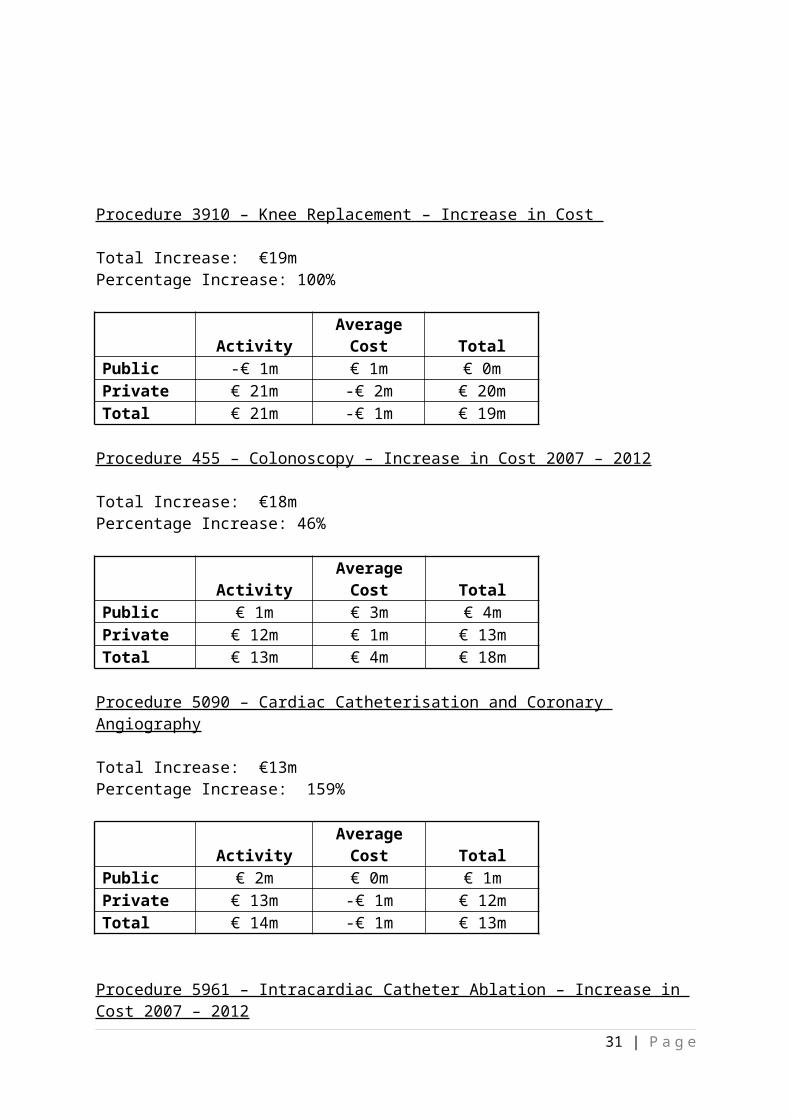
Procedure 3910 – Knee Replacement – Increase in Cost
2 Some procedures were combined where it was considered that an increase in one procedure was displacing a reduction in another procedure and that, accordingly, analysing the procedures separately would give misleading results.
22 | P a g e
Total Increase: €19mPercentage Increase: 100%
Activity Average Cost TotalPublic -€ 1m € 1m € 0mPrivate € 21m -€ 2m € 20mTotal € 21m -€ 1m € 19m
Procedure 455 – Colonoscopy – Increase in Cost 2007 – 2012
Total Increase: €18mPercentage Increase: 46%
Activity Average Cost TotalPublic € 1m € 3m € 4mPrivate € 12m € 1m € 13mTotal € 13m € 4m € 18m
Procedure 5090 – Cardiac Catheterisation and Coronary Angiography
Total Increase: €13mPercentage Increase: 159%
Activity Average Cost TotalPublic € 2m € 0m € 1mPrivate € 13m -€ 1m € 12mTotal € 14m -€ 1m € 13m
Procedure 5961 – Intracardiac Catheter Ablation – Increase in Cost 2007 – 2012
Total Increase: €11mPercentage Increase: 226%
Activity Average Cost TotalPublic € 0m € 0m € 0mPrivate € 10m € 1m € 11mTotal € 10m € 1m € 11m
Procedures 3660 and 3666 – Hip Replacement – Increase in Cost 2007 - 2012
23 | P a g e

Total Increase: €10mPercentage Increase: 31%
Activity Average Cost TotalPublic -€ 3m € 1m -€ 2mPrivate € 14m -€ 2m € 12mTotal € 11m -€ 2m € 10m
Procedure 2802 – Cataracts – Increase in Cost 2007 to 2012
Total Increase: €6mPercentage Increase: 31%
Activity Average Cost TotalPublic -€ 1m € 0m -€ 1mPrivate € 14m -€ 6m € 8mTotal € 12m -€ 6m € 6m
Procedures 3821 and 3822 Knee Cartilage – Increase in Cost 2007 to 2012
Total Increase: €6mPercentage Increase: 65%
Activity Average Cost TotalPublic € 0m € 0m € 0mPrivate € 6m € 0m € 6mTotal € 5m € 0m € 6m
Procedure 194 Upper GI Endoscopy – Increase in Cost 2007 to 2012
Total Increase: €6mPercentage Increase: 38%
Activity Average Cost TotalPublic € 0m € 3m € 2mPrivate € 4m € 0m € 4mTotal € 3m € 3m € 6m
Procedure 2190 – Caesarean Delivery – Increase in Cost 2007 to 2012
24 | P a g e

Total Increase: €5mPercentage Increase: 17%
Activity Average Cost TotalPublic -€ 6m € 12m € 5mPrivate -€ 1m € 1m € 0mTotal -€ 7m € 12m € 5m
Note: References to “activity” in the above tables and throughout this document relate only to activity in respect of which insurance claims were paid and references to cost are references to the cost of claims paid by the insurers.
Chapter 3 Summary of Submissions Received
25 | P a g e
Introduction
As part of Phase 2 of the Review of Measures to Reduce Costs in the Private Health Insurance Market, submissions were invited from interested parties by 14 April 2014. Seven submissions were received from the following parties.
Health Service Executive (HSE) The Independent Hospitals Association of Ireland ( IHAI) Insurance Ireland Irish Hospital Consultants Association (IHCA) Saint John of God Hospital St. Patrick’s Mental Health Services Society of Actuaries in Ireland (SAI)
A summary of all submissions received is provided below. As the submissions from the IHAI, Saint John of God Hospital and St. Patrick’s Mental Health Services focused in particular on responding to Chapter 7 of the Phase 1 report entitled ‘Industry Approach to Private Psychiatry’, a collective summary of those submissions is provided at 3.6 below.
3.1 Summary of HSE Submission
The HSE submission states that the Phase I report contains a number of recommendations that have significant implications for the HSE and it makes the following observations on the report:
The HSE is in broad agreement with the thrust of the report. The private health insurance market generates approximately €500m per annum for the public hospital system.
The HSE is in broad agreement with recommendations 1 to 7 of the report and are willing to work with the private health insurers on these issues.
Regarding the recommendations around claims processing, the HSE are striving to improve internal debt management processes including the continued roll out of the Claimsure electronic claims management system.
The issue around claims outstanding needs to be addressed through negotiations on Terms of Business between the HSE and health insurers.
The recommendation in Chapter 11 that a person confirms details of their treatment upon discharge has been introduced by the private health insurers by way of patient signatures at discharge and is the most problematic issue for the HSE and Voluntary hospitals (further details below).
26 | P a g e
The submission also lists ongoing issues between the HSE hospitals and private health insurers as follows:
Outstanding Claims – The HSE states that claims pended by private health insurers are increasing and that there is a lack of detail provided by insurers on the reasons why claims are pended or not paid.
Terms of Business Agreement – The absence of such an agreement between the HSE and private health insurers is an impediment to both parties.
Insurance Company Procedures – The HSE say there is a lack of clarity regarding what is covered by private health insurance policies and no arbitration method for any claims which are in dispute.
Insurers not paying for certain Day Case Procedures – Private health insurers have taken a strict interpretation of the word ‘bed’ and have refused payment when other treatment facilities, trollies or therapy chairs are used. The HSE position is that it is obliged to bill for inpatient services availed of and the accommodation resource is not relevant. The HSE see a need for clarity on what constitutes a day case versus an outpatient procedure.
New Consultant Appointees – Delays in private health insurers recognising new consultant appointees means that hospital claims cannot be processed.
Requests for More Information – Private health insurers are requesting more medical information on low value claims which delays payment.
Claim Code Indicator – Private health insurers have changed codes for some medical procedures which consultants appear to have been notified of but not hospitals, thereby delaying action on these claims.
Medical report for Orthopaedic Claims – Orthopaedic claims will not be paid unless accompanied by a medical report which is causing huge delays in payments.
Nominated contact person in Private Health Insurers – All hospitals identify the lack of a direct point of contact with private health insurers as a significant problem.
Road Traffic Accidents – One private health insurer is currently requesting an undertaking from patients that if their claim is successful the insurer will recover 100% of what they paid to the hospital, even though most RTA cases settle on a percentage basis.
Decoupling – The HSE propose that the statutory charge for inpatient services be decoupled from the primary and secondary Consultant’s bill.
Seeking Patient Signature on Discharge:
27 | P a g e

The main issue between the HSE and private health insurers is the new request from private health insurers seeking patient signatures on discharge, before a public hospital claim is processed
The same requirement has not been made of private hospitals
The HSE states that public hospitals currently do not have the IT systems or manpower resources available to comply with this new requirement (this is supported in the submission by a description of the impact of this new procedure on Beaumont Hospital).
There was no prior consultation by private health insurers with the HSE on this new requirement.
The HSE is open to finding a rational workable solution and are investigating how that can be achieved through the HSE Claimsure system.
The introduction of the Health (Amendment) Act 2013, which made provision for the charging of all private patients using public hospital beds, has led to some problems in the working relationship between the HSE and private health insurers. Both the HSE and insurers have engaged on these issues facilitated by Pat McLoughlin and Michael Horan of Insurance Ireland. The purpose of the engagement is to improve the working relationship between the parties.
Conclusion:
The HSE fully supports streamlining private income processes to enable faster billing and faster payment and are willing to work with private health insurers to maximise the benefit of any proposed changes to both parties.
Progress has been made to date, apart from the issue of signing on discharge, in engagements between the HSE and private health insurers. The HSE is confident that most issues between the parties can be resolved.
3.2 Summary of IHAI Submission (Non-Psychiatric Elements)
The IHAI submission noted the following points:
The important contribution made by the independent hospital sector in the provision of acute and mental health services nationally, through the 20 hospitals operated by its members, treating in the region of 400,000 patients annually.
The importance of private health insurance to the independent hospital sector, which is the main source of income for the sector. IHAI therefore welcomes measures which will ensure the long-term sustainability of the private health insurance market.
IHAI member hospitals contract on an individual basis with each health insurance provider, with such contracts negotiated annually. This is in contrast to the
28 | P a g e

arrangements between insurers and public hospitals where the rate for the provision of care is set by the Minister for Health.
The impact of recent national initiatives in the private health insurance market, including the State-driven measures affecting affordability for consumers, the charging of private patients occupying a public hospital bed, the increases by the private health insurance companies referencing the Health (Amendment) Act 2013 as a key driver for increases and the knock-on effect of consumers cancelling or downgrading their cover on increasing numbers of patients seeking treatment in public hospitals.
IHAI reiterated its support for initiatives which seek to address the affordability of private health insurance for citizens, providing them with the option of seeking independent hospital care.
The IHAI submission also responded to particular points made in the Phase 1 report including:
Cost of Claims
IHAI argues that while claims costs have increased between 2008 and 2012, it does not follow that this has been driven by an increase in the cost of services provided by its members and that through contract negotiation, prices paid by health insurers to providers have been reduced significantly in recent years.
Increased bed capacity in private hospitals arose as a direct result of State schemes which incentivised provision of additional facilities; there was also demand for these facilities due to the National Treatment Purchase Fund, under which over 20,000 public patients were treated annually.
Care Settings and Use of Resources:
While in the main private hospitals are reimbursed on a per-procedure basis, per diem rates apply in a number of instances, particularly for mental health services.
The tariff to be developed for DRG based charging under Money Follows the Patient (MFTP) should reflect the full economic cost of providing the service.
Age Structure of the Market:
IHAI support the introduction of lifetime community rating to incentivise younger people to join the private health insurance market; it also wants measures to be introduced to discourage people from taking out private health insurance cover for the first time in later life.
29 | P a g e
Clinical Audit and Utilisation Management:
IHAI states that look back audits and utilisation reviews are now a permanent feature of interaction between private hospitals and insurers and are reflected in contracts. The review proposed in the Phase 1 report should include ensuring that those undertaking such reviews are appropriately qualified.
Claims Processing:
IHAI state that the number of days taken by insurers to settle claims is increasing significantly with more claims being pended/queried. The majority of IHAI hospitals are currently using, or moving towards a ‘claims scanning’ system. However, despite engagement with the main private health insurance providers no agreement has been reached on the introduction of an E-Claims system, with the main issue relating to a significant increase in data requirements from insurers (106 data fields in current claim form and insurers want this increased to 164). Only one IHAI member has decided to move forward to pilot an E-Claims system.
3.3 Summary of Insurance Ireland Submission
The Insurance Ireland submission deals with Billing Audit, Fraud, Psychiatric Benefit, the submission from HSE, the submission from IHAI and other issues as follows:
Billing Audit:
Health insurers are carrying out greater claims scrutiny in order to contain costs, verify appropriate care and encourage efficiencies in the healthcare system. Claim enquiries are usually resolved directly with the healthcare provider, but if a satisfactory resolution cannot be reached, a full billing audit process may be invoked. The objective of a billing audit is to verify that a valid claim was submitted, that the treatment provided was necessary, adequate and effective and that the charges are appropriate and accurate. The multi-insurer group have also defined a dataset to facilitate electronic claiming in Ireland.
Fraud:
The term malpractice/fraud is wide ranging including inappropriate charging, i.e. incorrect billing for accommodation type, treatment not performed, up-coding etc. and supplying incorrect medical information, i.e. incorrect onset dates, wrong medical necessity information and questionable medical necessity for extended length of stay.
Under the auspices of Insurance Ireland each of the four health insurers will appoint
members from their organisations to represent them on Insurance Ireland’s Anti -
30 | P a g e
Fraud Forum. This Forum will address fraud, abuse and inefficiencies in the Irish health care system, encompassing public and private hospitals, consultants, GPs and medical accounts service agents. Draft terms of reference have been discussed and are being prepared. Some elements will be implemented straight away such as a whistleblower phone line. Independently each of the four insurers are making their own respective investments in personnel and IT system infrastructure to alert and future proof them from provider fraud into the future.
Psychiatric Benefit:
Insurance Ireland state that private psychiatric treatment in Ireland is currently underdeveloped and under-funded particularly in the areas of a) the provision of private psychiatric institutions outside the Dublin area and b) the provision of private community care at national level. It notes the increasing focus at European and national level on addressing mental health problems including the significant increase in alcohol and drug abuse.
In its submission, Insurance Ireland note that mental health services in the private sector are almost entirely Dublin-based and exclusively inpatient and lengths of stay are significantly longer in the private sector than the public sector. It notes that internationally it is accepted that there should be parity between physical and mental care. There may be an opportunity for insurers and private providers to take the initiative in support of the development of community mental health services while also improving in patient services.
The submission outlines in further detail the current system of mental healthcare in Ireland, governance, government policy (A Vision for Change) and future trends. It also gives an overview of the infrastructure of the public system, inpatient care, and the underlying principles and structure of outpatient/community-based care, and the private providers of mental healthcare in Ireland.
An international comparison by Insurance Ireland of resources available in other countries shows the proportion of the health budget allocated to mental health for Ireland as lower than France, the Netherlands, Germany and Australia.
The submission notes that the development of community-based services varies between the public and private systems, and states that careful consideration must be given when deciding on the insurance approach to community-based care – there are distinct differences between the public and private systems.
An integrated mental health service would require collaboration between private insurers and providers to develop community based mental health teams, day hospitals/day centres, and outpatient clinics.
31 | P a g e

The submission concludes that treating patients in day care/outpatient settings where appropriate usually has a lower unit cost than inpatient care due to lower per diem rates. Outpatient benefit is only paid through outpatient schemes but can be quite limited with significant co-payments applying. While the provision of community services in the private sector would broaden the range of treatment options available and would add to quality of care, it has the potential to increase costs overall given the investment requirement.
The insurers fully concur with the views from St. Patrick’s Hospital that the demand for high quality mental health services is increasing due to demographic and other factors. The submission states that a focus on quality based outcome measures supported by an adequate and properly resourced integrated care model based on best practice, is the only way to increase the cost effectiveness of services as demand continues to rise. The insurers also welcome the position of St. Patrick’s Hospital and St. John of God Hospital to working towards the mutual goal of excellence in Mental Health Care for patients within that system and state it will also be necessary to recognise and make explicit the constraints prescribed by funding challenges for insurers and providers in the development of such a model.
Response to HSE Submission:
Insurance Ireland welcomes the acknowledgement by the HSE that the private health insurance market represents a significant component of income received, however health insurers question the figure for outstanding debt put forward by the HSE. The submission states that all private health insurers receive notifications from public hospitals on outstanding debt which include payments that have already been paid or claims that have been rejected. Insurers consider a rejected claim as on outstanding debt between the hospital and the patient rather than the hospital and the insurer.
Claims Outstanding:
Insurance Ireland maintain there are a number of contributing factors to the HSE contention that outstanding claims have increased, citing a deterioration in the level of information provided by the HSE, failure to submit properly completed claim forms and a heightened level of claims scrutiny and clinical audit by insurers. Insurers also note that public hospitals take significantly longer to submit claims than private hospitals.
Terms of Business Agreement:
32 | P a g e

Private health insurers would welcome the opportunity to negotiate individual contracts with public hospitals similar to the contractual arrangements it enters into with private hospitals.
Insurance Company Procedures:
The HSE contention that there is a lack of clarity with regard to health insurance company procedures is rejected by Insurance Ireland as all insurers publicly publish their tables of cover and policy handbooks and this information is also held by the HIA. This submission also rejects that there is no arbitration provision for claims in dispute, stating the payment or otherwise of a claim is an insurance matter. It notes that the insurer has no liability for rejected claims and that private hospitals and consultants pursue monies owed from patients where a claim is rejected.
Insurers not paying for certain Day Case Procedures:
Insurers disagree with the HSE that the accommodation resource is not relevant in determining whether to charge private patients and state they have never covered services provided on a trolley, chair or other facility.
Seeking Patient Signature on Discharge:
Health insurers insist this requirement is an imperative since the introduction of new charging structures in public hospitals as of 1 January 2014. Agreement has been reached with the HSE on a form to be signed by all patients on admission from 1 June 2014 and it has been agreed that discussions will continue with HSE towards signature on discharge within 6 months.
New Consultant Appointees:
Health insurers are seeking receipt from the HSE of centralised information on all consultant changes and appointments, across all categories, in order to avoid delays in consultant recognition by insurers.
Requests for More Information:
Insurers acknowledge they are carrying out more claims scrutiny which requires further medical information and accept that Patient Accounts Departments should be advised when this information is sought.
33 | P a g e

Claim Code Indicator/Incorrect Codes:
Insurers note that hospitals should be notified in addition to consultants when changes in procedures occur.
Medical Reports for Orthopaedic Claims:
Health insurers are only obliged to pay claims for medically necessary treatments and require medical reports is order to assess claims properly.
Nominated Contact Person for Private Insurers:
Health insurers will ensure that all hospitals are provided with a contact point for queries.
Road Traffic Accidents:
Health insurers are legally entitled to recoup costs incurred by virtue of a third party.
Other Issues:
Insurance Ireland reiterates its position regarding the implementation of charges under the Health (Amendment) Act 2013.
Response to IHAI Submission:
Insurance Ireland agrees with the IHAI on the important role that private hospitals play within the health system and emphasises the interdependence between health insurers and private hospitals. They also support the IHAI view that insurers should be able to negotiate competitively with public hospitals in the same way as with private hospitals.
Cost Drivers in Private Hospitals:
While insurance Ireland accepts that the costs of private hospital beds has reduced over the period 2008 to 2012, it notes that the overall cost of private hospital care has increased due to the effects of changes in technology (costs of drugs and implants, changes in surgical techniques) and increases in utilisation.
Chronic Disease Management:
Insurance Ireland welcome support for measures to deal with chronic disease and its management.
34 | P a g e

Claims Processing:
Insurance Ireland accepts that private hospitals have a lower lead time from discharge to submission in the settlement of claims compared to public hospitals, but do not believe there has been an increase in the number of days taken to settle private claims in recent times. The introduction of an electronic claims process would significantly reduce the time taken to settle claims and a number of private providers are piloting e-claims.
Other Issues for Insurance Ireland:
The submission refers to the decision in Budget 2014 to curtail tax relief on premiums and states this has had a significant negative impact on the health insurance market. It refers to problems with the affordability of private health insurance and that it wishes to work constructively with the Government to ensure the benefits of a vibrant private health insurance sector are delivered to the maximum extent possible and in a way that achieves Universal Health Insurance. It welcomes the recent announcement by the Minister for Health regarding the introduction of lifetime community rating in 2015 and discounting for members up to age 25 in an effort to halt the exodus from the health insurance market.
3.4 Summary of IHCA Submission
The IHCA represents medical and dental hospital consultants in Ireland and is of the view that a number of significant issues need to be taken into account in assessing the sustainable provision of private health care in the future. Its submission sets out IHCA concerns, submissions and comments on the Phase 1 report’s conclusions and recommendations:
Representation on the Review Group:
IHCA highlights that the Review Group does not include representation from the IHCA which represents circa 85% of hospital consultants; IHCA believes the Review Group should have included representatives of all key stakeholders and is concerned that the “sectional and limited representation” on the Review Group will fail to ensure a comprehensive and balanced assessment of the issues.
Low Number of Hospital Consultants:
IHCA is concerned the Phase 1 report has overlooked the relatively low number of hospital consultants per capita in Ireland compared with other developed countries, which it sees as one of the significant challenges impacting on the provision of care to patients.
35 | P a g e

IHCA states Ireland has around two thirds the number of hospital consultants recommended by the Hanly report a decade ago and that demand for care has since grown substantially due to an ageing population. There are also difficulties in attracting and retaining the calibre and number of consultants needed due to significant reductions in income and increases in the cost of practising.
Costs:
IHCA argues that the chapter dealing with costs in the Phase 1 report does not fully assess a number of underlying costs such as the increases in per diem charges for private beds in public hospitals and the significant reductions in private procedure fees paid to consultants.
Cost of Clinical Indemnification: Reductions in procedure fees payable to consultants contrasts sharply with cost increases incurred by consultants for clinical indemnification, which depending on the specialty, has increased by 49% and 67% since 2008, with increases of between 25% and 33% in 2013.
The Medical Protection Society (MPS), the main provider of clinical indemnification in Ireland has confirmed that the costs of medical claims has increased by 42% in the past year which will lead to a corresponding average increase to clinical indemnification charges. IHCA state this represents a serious threat to the sustainability of care for patients in private hospitals, especially as the public system does not have the capacity to absorb additional patients.
Insurance payments to consultants: Reported levels of payments are based on gross revenue and do not reflect practice costs such as clinical indemnification, staff, rooms, general and other insurance, billing and other variable overhead costs. These costs have increased substantially in the past six years while procedure fees have been reduced, leading to a significant decline in private practice income.
Specific Points on Phase 1 Report Include:
The reference to consultant classifications needs to take account of the provisions included in consultant contracts which provide for consultants to treat private patients.
Hospital consultants had designed and implemented new clinical programmes to deliver improved models of care which have reduced lengths of stay and improved admission and discharge procedures.
The scale of the impact on health insurance premium increases of the reduction in income tax relief in the last budget should be quantified and reported.
36 | P a g e

The recommendation in relation to utilisation reviews should be discussed with the IHCA to ensure appropriate care is given to patients.
Private health insurers should have discussions with the IHCA on their proposals to develop an integrated care model for chronic disease management.
IHCA would welcome engagement with public hospitals on the improvement of debtor management performance; lack of support staff and systems in public hospitals are having an adverse impact on consultants submitting claims.
Insurers, hospitals and consultants should discuss development of a claims payment system to reduce payment delays and the administrative burden of dealing with pended, queried and returned claims.
IHCA should be consulted on proposals to develop discharge procedures.
3.5 Summary of Society of Actuaries in Ireland (SAI) Submission:
The SAI is the professional body representing the actuarial profession in Ireland. Its submission provides the SAI’s views on aspects of the Phase 1 report most relevant to actuarial consideration:
Age Structure of the Market:
SAI see the changing age structure of the market as potentially the most significant and most difficult issue to address. In a voluntary community rated market it will be difficult to slow the cycle of price increases which will potentially lead to younger healthier people leaving or not joining the private health insurance market, which in turn could lead to further price increases.
While ageing in the general population is a challenge for health services, ageing in the private health insurance market is significantly exacerbated as younger healthier people choose to exit the market. This contributes to a higher average age within the private health insurance market, making it likely that those leaving the market, across all age bands, are healthier, which in turn would have a further impact in terms of increasing average claims.
SAI notes some parallels between the private health insurance market and the difficulties faced in the pensions sector and suggests that an urgent examination of projections of the private health market in different scenarios will be important in devising policies to protect the sustainability of the private health insurance market.
37 | P a g e

Isolate the Impact of Ageing:
SAI recommend that the Phase 2 report isolates the impact of ageing on claims inflation as this will allow a better understanding of the extent to which non-demographic factors are impacting on claims inflation, and an enhanced understanding of the potential impact on inflation of measures designed to improve the age mix of the market.
SAI supports the Phase 1 recommendation that health insurers provide data to the HIA in relation to the top 30 procedures since 2008 which should enable the HIA to analyse the extent to which utilisation and unit costs for these procedures have varied over time. This will in turn help the review to understand the influence of factors such as cost per procedure and the relative impact of increased private bed capacity, high costs drugs and increased charges by public hospitals.
Measures to Encourage Younger People to Join the Market:
SAI agrees with the introduction of lifetime community rating as a means to incentivise younger people to enter or stay in the PHI market and with the recommendation that the Minister consider measures to encourage younger people to enter the market. In terms of health insurers extending student rates to age 23, SAI comments that student members attract a full adult risk equalisation levy.
3.6 Summary of Submissions from Saint John of God Hospital, St. Patrick’s Mental Health Services and IHAI on Industry Approach to Private Psychiatry
The submissions from IHAI, Saint John of God Hospital and St. Patrick’s Mental Health Services, all made the following points in response to Chapter 7 of the Phase 1 report:
Claims for psychiatric care are a small percentage of the overall claims paid out by health insurers.
All take issue with the comment that private patients are poorly served by a model of care which lacks a comprehensive and integrated approach by insurers and providers.
That international comparisons should be treated with caution, in particular lengths of stay comparisons between Ireland, Germany, Australia and South Africa – such comparisons are seen as not accurate or appropriate as these countries have a more developed model of community-based mental health services.
All disagree that there is a lack of clinical guidelines and point to adherence to the Mental Health Commission’s Code of Practice on Admission, Transfer and Discharge
38 | P a g e

from Approved Centres. Decisions regarding a person’s requirement for inpatient treatment are regulated by that Code and only occur after assessment by a specialist medical practitioner. The private health insurance industry should have no part to play in this process.
All would welcome increased collaboration and negotiation with health insurers to develop mental health services in line with best international practice.
Other points made include the following:
Absence of Community Based Infrastructure in the Mental Health Sector:
St. Patrick’s disagrees that there is such an absence and highlights the network of community based Dean Clinics it has established over the last seven years, with some support from the health insurance sector. It states that St. Patrick’s has moved towards a ‘Bundled Care’ model of service delivery and that if health insurers fully supported this model more services would be established in more regions around the country, resulting in better mental health for the insured and better value for the private health insurance industry.
St. Patrick’s states that it has engaged in ongoing annual negotiations with health insurance providers to move towards a more integrated model of care.
St. John of God Hospital makes that point that the HSE and the Department of Health have a role to play in the provision of community-based services. They also argue that in some cases private health insurers have been slow to, or have refused to cover, outpatient and day services for some specialist programmes such as addiction aftercare and eating disorder recovery.
Increases in Private Health Insurance Costs:
St. John of God Hospital points out that while health insurance premiums have increased steadily, the per diem rates it receives have been subject to price decreases and freezes since 2010. It also points out that private health insurers operate maximum revenue limits thereby controlling their annual spend with the hospital, and that consultant psychiatrists are not remunerated separately to the per diem rate.
Demand for high quality mental health services is increasing and it is only by focusing on quality based outcomes, supported by an adequate and properly resourced
39 | P a g e

integrated care model based on best practice, that any attempt can be made to increase the cost effectiveness of services for which there is increasing demand.
IHAI is concerned regarding the comments that private providers have not met the best international practice of an integrated private mental health service. IHAI responds that all IHAI member hospitals are regulated by the MHC and no comment regarding patients being poorly served has been made by the MHC to any member hospital. Similarly, insurers, which set out the terms annually for reimbursement to independent providers, have not expressed such concerns.
IHAI also refer to the Vision for Change Strategy for mental health services and that despite its members fully engaging with the strategy and bringing forward proposals to enhance implementation of Vision for Change through Public: Private Collaboration, none of the proposals it made were progressed.
40 | P a g e

Chapter 4 Chairman’s Observations and Recommendations
Introduction
In my interim Phase 1 report, issued in December 2013, I identified critical trends that raised serious concerns about the stability of a sustainable community rated private health insurance market. These were as follows:
250,000 persons had dropped out of the private health insurance market in the previous 5 years.
The increases in premiums ranged from 7.3% in 2011 to 12.1% in 2012.
The average cost of claims paid per insured person increased by 12.6 % per annum between 2008 and 2012.
The age structure of the market saw a significant ageing of the insured population. In 2003 13.3% of the insured population was aged over 60 and this had increased to 19% of the insured population by the second half of 2012.
The number of beds in private hospitals increased from 2,695 in 2008 to approximately 3,200 in 2011, an increase of 18.7%.
There was an increase of 33% in public consultants from 2005 to 2012.
4.1 Key Recommendations in the Phase 1 Interim Report
In the Phase 1 interim report, I recommended a series of actions which would:
help understand the dynamics of the market attract younger members into the market introduce a level playing pitch between public and private providers take collective actions as insurers to address key issues, and introduce best business practices in aspects of claims management.
Following the publication of the report, I received requests for meetings from interested parties, all of whom I met. The meetings involved the following:
Irish Hospital Consultants Association Independent Hospitals Association of Ireland Private Mental Health Providers Health Insurance Authority Insurance Ireland Each Health Insurer Senior HSE Management
41 | P a g e

St John of God Hospital, Dublin.
I invited submissions from all the parties I met and advised them in the interest of openness and transparency that I would publish their submissions in this report. These submissions were considered by the Review Group, but I would point out that the recommendations in this report are based on my own conclusions following all the meetings and submissions received. I have also included a table in Appendix 1 outlining the current position on each of the recommendations in the Phase 1 interim report. The following are my conclusions and recommendations in relation to the key issues identified in the interim report and addressed in Phase 2.
4.2 Data to Analyse Trends in the Industry
During Phase 1, the following issues were identified as potential contributors to the growth in claims:
An increase in the ageing of the population Higher use of insurance by membership Increased bed capacity in the private hospitals Increased use of high cost drugs and implants Shift of activity from public hospitals to high tech hospitals Increased claims for depression and mental health conditions Increased public bed charges for private patients.
During Phase 1, good progress was made in designing a template to analyse in detail the drivers behind rising costs in the industry. However, this issue became a difficulty again in Phase 2 and is the main cause of the delay in finalising this review. In particular:
There were difficulties in ensuring that the data requests were being interpreted similarly by each insurer.
Health insurers required a written confirmation from me that the Health Insurance Authority (HIA) would only use the data for the purpose of this review.
The completion of the data return took considerably longer than originally envisaged and agreed with the insurers.
The HIA needed to have a number of bi-lateral discussions with the insurers regarding the data provided.
Due to difficulties in extracting meaningful and comparable data on medical procedures, it was agreed ultimately to focus on surgical procedures.
42 | P a g e

Following a review of the first draft of claims cost data from HIA it was clear that further clarification of data with insurers would be required and this was done.
HIAs final paper ‘Private Health Insurance Claims Cost Analysis’ June 2014 is included in its entirety in Chapter 2 of this report.
Conclusions
In view of the trends in the industry over the past five years and the fact that €2 billion is being reimbursed it was surprising to note that:
Data of the type agreed in the template was not being collected by the HIA on an ongoing basis.
Insurers were not insisting on a common coding system across public and private providers to ensure they could understand the complexity of medical and surgical discharges.
The HIA and insurers held different views on whether the HIA was authorised to compile and analyse certain data.
Phase 2 Recommendations
In view of these conclusions, I recommend a number of steps to improve the availability and usefulness of data for the purpose of analysing and controlling costs:
The HIA should agree with the Department of Health the data set required to give the Minister the necessary analysis of industry trends, and/or additional legislative powers that the HIA may require to collect such information.
The HSE should work closely with the HIA to extract HIPE data on medical cases, so that the HIA can further analyse the causes of growth in medical admission costs.
Health Insurers should work with private hospitals to ensure that all cases are coded to the same DRG format as is used by HIPE for activity in public hospitals. This is in keeping with the Minister for Health’s notification to insurers in April 2014 that payments of the Hospital Bed Utilisation Credit (HBUC) under Risk Equalisation will be conditional on the provision of DRG data by patient from 1 January 2016. This approach will lead to a reimbursement system which acknowledges the cost of the hospital and treating clinician on the basis of complexity of care.
4.3 Private Health Insurance Claims Cost Analysis
43 | P a g e

Chapter 2, which was prepared by the HIA, updates a previous paper prepared by the HIA in July 2013 and adds an analysis based on the data submitted by the health insurers. The following points are worthy of note:
Around €1.9 billion was paid in claims by Irish private health insurers in 2013.
Between 2008 and 2012, the average prescribed benefit per insured person grew by 12.6% per annum (a prescribed benefit’ is a cost incurred during an inpatient stay, which is subject to maximum limits to ensure that risk equalisation payments do not provide compensation for ‘luxury’ benefits).3 During this period, the consumer price index (CPI) fell by an average of 0.3% per annum.
In 2013, the average prescribed benefit fell by 2.2%, the first time this figure decreased since the HIA started collecting this data. This is a welcome development, particularly if it indicates a longer term downward trend.
The increase in average claim per member between 2008 and 2012 (61%) largely results from increased usage of hospital services. Utilisation increased by 14%, while cost per utilisation was up by 11% in the same period.
The ageing of the insured population currently contributes around 3.1% per annum. to claims inflation. The breakdown is as follows:
o the ageing of the general population 0.8% per annum.o an increase in penetration rates amongst older people 0.6% and reduced
penetration rates at younger adult lives 1.6% per annum.
The data analysis by the HIA highlights the impact on activity and costs of the expansion in facilities that has occurred in recent years most notably:
Claims relating to private hospitals accounted for €450 million of the increase (or 81% of the total increase) while claims relating to public hospitals accounted for €106 million (or 19% of the total increase).
The number of admissions in private hospitals almost doubled (increase of 98%) in the period. The increase in total costs in private hospitals has been mitigated by a reduction of 13% in average costs per admission.
Conversely the much lower increase in total cost relating to public hospital claims has been driven by an increase in the average cost per admission (36% increase). The
3 Prescribed Benefits are the total claim payments paid by an insurer in a calendar year excluding claim payments that relate to:1. services provided by other than a hospital or a hospital consultant2. benefits relating to services otherwise excluded from the definition of prescribed health services, such as outpatient benefits3. the amount of benefit exceeding the maximum prescribed benefit levels set out in the Health Insurance Act 1994 (Information Returns) Regulations 2009 (S.I. No 294 of 2009).
44 | P a g e

number of public hospital admissions for which insurers paid claims reduced by 10% in the period.
Overall there has been an increase of 40% in the number of insurance related admissions between 2007 and 2012 and the average costs of claims related to these admissions had increased by 8%.
The data when broken down by procedure shows a broadly similar set of requests and the tables show that the main contribution to the increase in costs is from increased activity in private hospitals. There is sometimes a further (much smaller) contribution from increased average costs in public hospitals.
Finally, the substantially changed role of the National Treatment Purchase Fund (NTPF) has almost eliminated demand for private hospital stays from publicly funded patients and made additional capacity available for use in private hospitals by insurance funded private patients.
Conclusion
The HIA analysis summarised in Chapter 2 above identifies the additional private facilities which were commissioned during the period under review. It also points out that “increased private hospital capacity can lead to increased utilisation of private hospital accommodation by meeting previously unmet demand (including by providing services that were previously not available), meeting increasing demand (for example as a result of ageing) or through supplier led demand (a common feature of healthcare markets)”.
The HIA analysis also draws attention to the Acute Hospital Bed Capacity Review: A preferred health system in Ireland to 2020 which stated “it is conservatively estimated that there is a surplus of 130 private patient beds in Ireland. This increases to 900 with those currently in plan”. It is beyond the scope of expertise of this review to determine the number of public or private beds required to meet current demand or to assess the appropriateness of admissions or lengths of stay. However, the suggested surplus in private beds is clearly a key issue for planning cost effective acute services, and for successful containment of costs in the private health insurance market.
Health insurers and public and private providers have the ability to influence these issues and the implementation of the following recommendations should see the provision of quality services at the most efficient cost.
Phase 2 Recommendations
Health insurers should not be obliged to provide cover for all public hospitals. While it is important that they meet the needs of their customers within a reasonable geographic area, insurers should not be required to cover every public hospital. (This
45 | P a g e

reflects an emerging trend where insurers are opting not to cover all public facilities in some of their plans).
Health insurers should not feel obliged to provide cover for existing or new private facilities and need to negotiate more aggressively for their patients consistent with quality and cost considerations.
Health insurers should publish information on reimbursements to clinicians by consultant category, within speciality, by income ranges.
Note
While it is accepted that reimbursements to clinicians are continuing to reduce and that clinicians have practice costs, additional indemnity cover costs and some increased competition, there is no benchmark to judge the scale and levels of reimbursements and whether reimbursements have sufficiently taken on board the changing nature of clinical practice.
It might be expected that the provision of additional capacity in terms of beds and consultant manpower should have the effect of keeping costs under control in a normal market. However, it would appear the opposite has been the case in private healthcare.
4.4 Care Setting and Resources
The recommendations in the Phase 1 interim report in this area centred around the need for insurers to insist that patients are treated at the lowest possible cost consistent with quality. In particular insurers were urged to query cases claimed as an inpatient which might have been carried out on a day basis. I also recommended a case-based charging system using Diagnosis Related Groups (DRGs) for private patients in public hospitals.
The introduction of such a charging system would have a dual benefit of driving cost efficiency, because fixed payments encourage hospitals to eliminate unnecessary services, and of reducing lengths of stay. There would also be additional advantages as restructuring of care would have an even greater benefit to the State for public patients in public hospitals given the higher proportionate impact on cost in the public system. The Department of Health, health insurers and the IHCA have supported this recommendation.
Phase 2 Recommendation
A timetable for implementation of case-based charging should be agreed as part of the process for implementing Money Follows the Patient.
4.5 Age Structure
46 | P a g e

The interim report outlined the difficulty being experienced in the private health insurance market because of its age structure. As was outlined “the market requires a sizeable cohort of younger members, who are generally healthier, to offset the high cost of members who are in the older age brackets, especially those 70 years or over. Data from insurers indicated that the average cost of claims in the 70+ age group is ten times that of the 30-39 age group. The retention of high numbers and attraction of new members in these age brackets is critical to the sustainability of a community rated system”.
Despite the improving economic situation, the increase in employment and the reduction in unemployment, there has been no impact of any significance to date in the age structure of the market in the percentage of the population covered. A study published since the interim report was issued, Salary scales for new graduates 2004-2012, Thomas Conefrey and Richard Smith highlighted:
“From their peak in 2007, weighted average nominal salaries across all facilities decreased steadily to €23,777 in 2012, a fall of 11.7%. The decline in 2012 brought overall salary levels back to below 2004, highlighting the extent of the adjustment in graduate pay”.
This observation illustrates the difficulty of affordability and the challenges for the market in attracting younger and healthier members.
Conclusion
The more younger people we encourage into the market, the easier it is to provide an affordable community-rated premium for everyone and I acknowledged this in the recommendations I made in the Phase 1 report.
On 7 July the Minister for Health signed into law a new measure, lifetime community rating, to encourage people to take out private health insurance at a younger age and thereby help in controlling premium inflation across the market. Because younger people claim less on average, their continued participation is vital to keep premiums down for everybody.
I also welcome the announcement by the Minister for Health of his plans to introduce a sliding scale of rates for young adults up to age 24 in 2015. While my recommendation in Phase 1 was to introduce discounts up to age 29, this initiative is consistent with my thinking and will go some way to addressing the large price increases faced when student rates no longer apply usually after age 21.
4.6 Clinical Audit and Utilisation Management
In the interim report, I indicated that I had been provided with details of clinical audit and utilisation management by the insurers. I was satisfied that each company was investing in
47 | P a g e

this area but believed overall that this was a recent phenomenon. I had hoped to assess in Phase 2 if the arrangements were in line with the robustness of international practice.
I suggested to insurers that the issue could be addressed by outlining their system to an independent evaluator or by completing a template which would assess their system against best practice.
Insurers, at an individual level, did show me evidence of cost reductions or changed clinical practice arising from such programmes but they remain adamant that such issues are commercially sensitive.
My reasons for dwelling on this issue arise from the following:
Milliman, who are actuarial advisors to the Department of Health, pointed out in a report referenced in the interim report that “In the U.S. and other first world settings, utilisation management can reduce inpatient hospital admissions by 10% and total inpatient hospital bed days by as much as 30%”.
Ireland has poor integrated clinical management programmes for chronic conditions by international standards at present, (although good progress is being made by the HSE in some areas) which usually leads to inappropriate admissions and lengths of stay.
The analysis carried out by the HIA shows how increased capacity has affected increased utilisation and the international literature points out the difficulty in the private health insurance industry of supplier induced demand.
Conclusion
Clinical audit and utilisation management are proven tools to discover how well clinical care is being provided and to learn if there are opportunities for improvements. While it was not possible during the course of this exercise to verify independently the robustness of the systems in Ireland, I would urge health insurers to examine the scope for further improvements and for delivering strategies at industry level to address clinical audit and utilisation management issues.
Phase 2 Recommendation
Insurers should vigorously pursue their individual respective approaches to clinical audit and utilisation management so that the scope for reducing unnecessary treatment is maximised, and that the available resources for healthcare are put to the best possible use for patients.
4.7 Industry Approach to Private Psychiatry
48 | P a g e

In the Phase 1 interim report I pointed out that “private patients are poorly served by the model of care which lacks a comprehensive and integrated approach by insurers and providers”.
Private providers took exception to this statement both in my direct meetings with them and in their submissions attached to this report. I was not blaming providers and pointed out that “Insurers need to demonstrate that they will reimburse providers who re-structure their service offering” and “providers need to benchmark their performance against best national and international practice as regards admission rates and lengths of stay and restructure their offering to include mental health teams, day hospital, day centres and outpatient clinics”.
My comments were based on the following assessment:
All private mental health inpatient facilities in Ireland are currently based in the Eastern Region unlike other medical and surgical services.
Current service offerings by providers for private patients did not provide the comprehensive range of services provided for public patients with mental health needs.
The length of stay internationally (although this data needs to be treated with caution) show considerably lower lengths of stay in other countries.
The Health Research Board statistics support the contention that independent/private and private charitable centres have longer lengths of stay compared to general hospital psychiatric units in Ireland.
Conclusion
There is considerable scope to change the nature of the care model and this has been encouraged by providers and insurers. I am also encouraged by the evidence of discussions already taking place, which will lead to improved access to community and day hospital programmes, appropriately reimbursed, between providers and insurers.
4.8 Fraud, Waste and Abuse
In the interim report, I set out a series of recommendations where the industry could work together to ensure that the issue of fraud, waste and abuse could be highlighted and cooperative action taken by the industry. Since that report, insurers have briefed me on cases that have come to light and refunds made. I believe if these issues were highlighted in the public domain, they would have an impact on the behaviour of public and private providers
49 | P a g e

and clinicians. I also believe the whistleblowers’ initiative, if marketed effectively, will achieve results.
Since the Phase 1 interim report was published, health insurers, working with Insurance Ireland have agreed a range of measures in line with the recommendations, which are due for publication in the near future. I welcome the action taken in this area and would urge insurers to continue their encouraging efforts in this regard.
4.9 Chronic Disease Management
The recommendations in the Phase 1 interim report have been well received and since its publication, both the IHCA and representatives of the pharmaceutical industry have also expressed a willingness to work on such initiatives. There are considerable benefits to patients, clinicians, providers and insurers if such initiatives are well planned.
Phase 2 Recommendation
Further to my recommendation in the Phase 1 report, I now recommend as an immediate priority the establishment of a joint initiative for an integrated model of care for the treatment of chronic disease. The Department of Health, the HSE and health insurers, should devise a project plan to determine what chronic diseases to prioritise and to create supporting pilot programmes on a geographic or disease specific basis.
4.10 Claims Processing
In the Phase 1 interim report, I outlined the benefits of speedy processing of claims for patients, private providers and health insurers. Subsequently difficulties emerged when insurers sought to introduce new forms as part of the reimbursement process without consultation with public hospitals.
In an effort to move the issue on I chaired a joint working group to address the issue of forms, bed designations and categories of consultant contracts. Both the HSE and insurers are now working well on these issues and a series of dates and processes has been put in place to resolve outstanding issues. I am still receiving claim and counter claim between providers and insurers on such issues as:
The ability of public providers to make the initial claim in a timely manner, and
Whether insurers are deliberately making queries to slow down reimbursement to providers.
50 | P a g e

From evidence I have seen, I believe public providers have improved their billing procedures and are issuing bills in a more timely manner but they still lag behind private hospitals in the organisation of this function. It is also clear that more claims from both public and private providers are being challenged by insurers. If such challenges are appropriate then it should help to control costs and reduce inappropriate reimbursement.
I am not in a position to verify the accuracy of the various claims. However, I believe that both sides recognise the value of an efficient system of claims processing. I note that progress is being made in implementing the recommendations in the Phase 1 report in making the process more efficient.
Phase 2 Recommendations
I recommend that the Internal Auditor of the HSE be requested to investigate the organisation of the claims management functions in publicly funded hospitals to determine whether invoices are being prepared promptly and whether query management, liaison with clinicians and dispute resolution practices are being managed optimally. This report should be made available to the Consultative Forum on Health Insurance.
I do not agree with the recommendation from the HSE that the hospital bill be decoupled from the primary and secondary consultants’ bill. All of the recent work on claims processing has been aimed at achieving a more integrated, streamlined system; any element of decoupling would be undesirable in this regard.
4.11 Admission and Discharge Procedures and Processes
In the Phase 1 interim report I identified a range of issues that needed to be addressed between insurers and particularly public hospitals. Many of these issues were not of themselves significant but were causing tension in the relationship between the two parties.I agreed to chair a forum to address these issues and the HSE undertook to represent all the publicly funded hospitals (including voluntary hospitals), which was a welcome step as it allowed a single point of contact between the parties. Insurance Ireland co-ordinated the views of health insurers, which was also of benefit in dealing with such issues. The parties have worked well together and no longer require external facilitation to progress the issues. Agreement on how and when to progress the issues has been reached and it is now important that both groups work together on the residual issues.
Phase 2 Recommendation
The forum established between the HSE and Insurance Ireland should continue to be supported at a senior decision making level to maintain the momentum and build trust
51 | P a g e

between the parties to progress issues of a collaborative nature.
4.12 Private A&E Admissions
During Phase 2, I met with insurers individually and as a group to discuss the issues discussed in this chapter. There was and still is, with some insurers, a concern that the increase in private A&E facilities could lead to further supplier induced demand. There was also a concern that such facilities are not available on a 24 hour basis and that the hospitals may not have the expertise on site for the range of presenting conditions.
During the past year, some of these concerns have not been identified as causing actual difficulties. In addition, health insurers have taken individual decisions to ensure that only appropriate medical admissions are covered by their reimbursements. It is my view that this is a matter for each insurer to deal with in their negotiations with private hospitals and no action is proposed at this stage. Given that the main route of entry to public hospitals for medical admissions is through emergency departments and this may become similar for private hospitals who develop capacity to admit through emergency facilities, the issue of opening hours and clinical competence on site is a matter that should be dealt with as part of the proposed licensing arrangements which are planned by the Minister for Health.
52 | P a g e
Chapter 5 Conclusion
At the commencement of this process twelve months ago, there were legitimate concerns regarding the sustainability of the Irish community rated private health insurance market due to a combination of factors. The issues causing concern included the reduction in numbers holding private health insurance, the age of those holding private health insurance, unsustainable increases in claim costs, unsustainable increases in premiums and the overall economic climate.
Over the past year there have been some signs of a more stable economic environment emerging. The decision of the Minister for Health to introduce lifetime community rating from 1 May 2015 will hopefully lead to an improved age structure in the insured market by encouraging people to take out private health insurance at a younger age and thereby controlling premium inflation across the market. This in turn should help to keep rates of premium competitive and affordable. As the economy continues to improve we should see continued increases in employment and reductions in unemployment. Given the steady increase in health insurance claims between 2008 and 2012, the initial figures for 2013 claims are positive and if they are maintained as all claims for 2013 are settled, we will have seen the first reduction in claims paid for a long number of years.
It is clear that insurers have put more resources and effort into clinical audit, utilisation reviews and challenging of claims, which may already be having an impact. There is a prospect of efficiencies arising from the decision to move towards product pricing in the public hospitals, i.e. to move from the current per diem charge to a price based on the actual cost of treating different types of case. Evidence from private providers would suggest that this leads to incentives for providers to obtain efficiencies in admission on the day of surgery and reductions in lengths of stay for many elective procedures.
While the public hospital system has greatly improved its rate of same day admissions and day surgery, the reforms planned under the Money Follows the Patient initiative will enable insurers and the public hospitals to adopt a similar approach.
This exercise showed weaknesses and gaps in certain types of data necessary to monitor healthcare usage closely, understand the impact of the ageing of the population and presenting of co-morbidities in patients. Patients have legitimate expectations that insurers will seek to get the best care possible at the right price and rely on their insurer to do this by negotiating on their behalf with public and private providers and clinicians. While there is a good deal of data available through HIPE, it needs to be fully utilised for maximum effect. As recommended, the HIA should collect and analyse medical and surgical data from insurers as a matter of routine, as part of its ongoing analysis of the private health insurance market. The scope for increased data sharing and use of HIPE data across the health system should also be examined. This would allow an assessment to take place of whether the market is sufficiently competitive to achieve maximum efficiency in negotiations with providers.
The benefit of the review I have engaged in over the last year has been to bring the key parties together and agree a set of issues that require attention. Some of these have been
53 | P a g e

addressed already but the main benefit of such collaboration should be leveraged by the Department of Health and the HSE in introducing the clinical pathways of care and the necessary chronic disease management processes to enable health care to be delivered at the lowest level of complexity, thereby reducing the need to attend hospitals. The necessary structures at Consultative Forum level and HSE / Insurance Ireland level should allow the agenda to be pursued without the presence of an independent Chairperson.
I am confident that the combined effect of the recommendations I have made will, if implemented, have a positive impact on the private health insurance market to the ultimate benefit of consumers. In order to achieve this, a continued focus on the issue of costs and its drivers is required from all stakeholders. Consumers also have a role to play by continuing to be vigilant in confirming that claims paid on their behalf by insurers are appropriate and also by challenging insurers on the premiums they charge. Only then are we likely to see a stabilisation of, or perhaps a reduction in, health insurance premiums.
I received full cooperation from all parties to this report and appreciate the briefings, submissions and all material provided to me, for which I am grateful. I would like to thank all those involved in the process - health insurers, the Health Insurance Authority and the Department of Health - for their contributions and assistance throughout this process.
54 | P a g e
APPENDIX 1 Status of Recommendations made in Phase 1 Report
Status Report
Implemented
Implementation progressing
Implementation to be commenced
Recommendation Stakeholder Responsible
Description of Progress
Status
1. Controlling Costs
The template agreed at the Forum and issued to insurers by the HIA in respect of surgical cases should be completed within 6 weeks to enable their independent validation. (This is to help identify the true driver of costs in PHI).
Insurers Data returns from insurers submitted to HIA; HIA analysis of data completed and presented in Phase 2 report.
In future, the HIA should collect and analyse data in a similar format to the template now agreed, on a regular basis.
HIA/DoH HIA/DoH considering preparation of Regulations to provide for the collection and analysis of claims data based on the template agreed between HIA and health insurers.
The insurers and the HIA should agree a mechanism for comparing medical cases early in Phase 2 to enable a similar exercise to be carried out.
Insurers/HIA There are difficulties with agreed definitions for medical cases - Insurers and HIA are working to progress this.
The issues identified in the medical and surgical review should form the basis of decisions needed at an individual insurer level and industry level where appropriate for the Phase 2 Report.
Insurers Analysis of data by HIA reflected in Phase 2 Report
55 | P a g e
2. Care Settings and Resources
In order to ensure that patients are treated at the lowest possible cost consistent with quality, insurers should use existing information on the appropriate treatment locations for individual procedures. Insurers should use information of this kind to query cases claimed as an inpatient which might have been carried out on a day basis.
Insurers To be progressed by insurers
The Minister should pursue implementation of a case based charging system using Diagnosis Related Groups (DRGs) for private patients in public hospitals.
DoH Being pursued as part of Money Follows The Patient (MFTP)
The Department and the HSE, with appropriate input from the private health insurers, should develop plans as early as possible in 2014 for the implementation of a case based charging system using DRGs for private patients in public hospitals.
DoH/HSE/
Insurers
Being pursued as part of MFTP
3. Age Structure
The Minister for Health should consider introducing measures to encourage younger members into the market and discourage by means of a financial penalty, people who take out health insurance for the first time after age 30.
DoH The Minister signed Lifetime Community Rating into law on 7 July.LCR provides for late entry loadings on the PHI premiums of those who buy PHI for the first time at age 35 and older.
Health insurers should prove their commitment to retaining and attracting persons in the 18-29 age group by discounting premiums for full time students up to age 23, which is allowed at present under health insurance
Insurers Insurers currently apply discounts up to age 21.
56 | P a g e

legislation
4. Clinical Audit and Utilisation Management
The current clinical audit and utilisation arrangements should be assessed in Phase 2 to determine if they are in line with the robustness of international practice.
Insurers in conjunction with Chair
Insurers to pursue individually rather than collectively due to commercial sensitivities
The extent of clinical audit being carried out by each insurer should be independently evaluated in Phase 2 of this work.
Insurers in conjunction with Chair
Insurers to pursue individually rather than collectively due to commercial sensitivities
The potential for national procurement of drugs, a national drug formulary and adherence to NCPE outcome assessments should be assessed in Phase 2.
DoH and HSE DoH and HSE will pursue.
5. Private Psychiatry
The Minister for Health should use his existing powers under legislation to authorise the Mental Health Commission to establish and maintain a system of accreditation of comprehensive mental health services in line with the principles of a Vision for Change. Such a system should be developed in partnership with the various stakeholders and should be self-funded. Insurers could then fund accredited providers on the basis of an integrated model of care.
DoH/Mental Health Commission
DoH are progressing and will then pursue with MHC
Health insurers and providers should engage in negotiations to put in place a service model with minimum benefits which is in line with international best practice.
Insurers The scope to change the care model has been acknowledged by providers and insurers.
57 | P a g e

While restructuring of the service offering will take time, the Chair plans to report on the progress made by the insurers and providers at the completion of Phase 2 of this exercise.
Chair Chair reports in Phase 2 that there are discussions taking place which will lead to improved access to community and day programmes, appropriately reimbursed, between providers and insurers.
6. Fraud, Waste and Abuse
There is a need for the health insurers to publicly acknowledge that fraud/malpractice exists and to publish data on the extent of monies recovered from hospitals and consultants.
Insurers Under the auspices of Insurance Ireland, Health Insurers will appoint a representative from their respective organisations to Insurance Ireland’s Anti-Fraud Forum, to address fraud, abuse and inefficiencies. Terms of reference are currently being prepared.
Private health insurers should adopt a co-ordinated industry approach to the identification and tackling of fraud, waste and abuse within the healthcare market.
Insurers As above
The industry should engage with the Data Protection Commissioner to ensure all its actions are within their legislative competence.
Insurers/DPC As above
The industry should develop a plan over the next three months which will be reported on in Phase 2, which builds on national experience of other insurance and financial providers who have addressed this issue. This has been achieved through a co-ordinated approach in conjunction with law enforcement. The international experience of other countries which have such a co-ordinated approach should also be evaluated.
Insurers As above
The industry should fund a whistleblower initiative which
Insurers This will be implemented shortly via Insurance
58 | P a g e

has an online anonymous reporting facility, and hotline facilities and actively promote the initiative within the customers of the industry and public and private providers.
Ireland’s existing confidential hotline dedicated to receiving fraud tip offs.
7. Chronic Disease Management
As part of the commitment to develop and update the existing Chronic Disease Management Framework, the Department of Health and the HSE should engage closely with private health insurers to develop an integrated model of care for treatment and management of chronic disease. The updated Framework should in particular consider how best insurers could play a role in incentivising patients towards prevention and management of chronic disease.
DoH, HSE and Insurers
DoH will pursue this with Chief Medical Officer and HSE Head of Clinical Programmes
Insurers who commit to such programmes should be incentivised through the risk equalisation scheme which can recognise the upfront costs of such programmes.
DoH/HIA DoH to examine this in context of Risk Equalisation legislation – in consultation with HIA and stakeholders.
8. Claims Processing
Public hospitals should have as part of the National Service Plan requirements for 2014 debtor management performance at least equivalent to that in operation in the private hospitals.
HSE The HSE and all health insurers have put a process in place to progress implementation of this and other recommendations.
They will continue to work together to deal with a range of claims processing and admission and discharge issues.
A report on performance against this target should be provided by the end of Phase 2 by the HSE.
HSE As above
There should be a roll-out plan agreed between health insurers
Insurers and HSE
Intention is to build on previous work re e-claiming;
59 | P a g e

and public providers to mandate all public hospitals and consultants with admitting rights therein to switch to electronic claiming no later than the end of 2015.
HSE and Insurers will work to progress this.
Health insurers should seek to agree written 'terms of trade' with HSE hospitals and voluntary hospitals regarding how they interact in relation to claims and payment arrangements. There should be a specific agreement on the timescale for submission of completed claims by hospitals and for final processing by insurers (i.e. clarification of queries, payment of claims or rejection).
Insurers/HSE This is being progressed through the HSE/Health Insurer process referred to above.
All hospitals should submit agreed final claims to insurers within the timeframes agreed in the ‘terms of trade’. Failure to respect agreed time frames would mean that the insurer would pay a specified proportion (e.g. 90% or 95%) of the value of the claim. Conversely, should insurers fail to settle claims within an agreed time frame, they could be required to pay the provider, public or private, an additional specified percentage (e.g. 5% or 10%) of the value of the claim. This situation should be monitored by the HIA to ensure it is working effectively and fairly. The implications of implementing this recommendation at an operational level will be considered under Phase 2 of this process.
DoH DoH to consider.
While the issue arises only in a relatively small number of cases, it should be open to the HSE to
HSE DoH and HSE to consider.
60 | P a g e

suspend the admitting rights of consultants who repeatedly fail to complete and sign claim forms for private insurance within a reasonable period of time.9. Admission and Discharge Procedures and ProcessesThe HSE should introduce standard procedures for public hospitals, following consultation with the industry, which ensures that it is clear that a patient has exercised their choice as to whether they wish to be treated as a public or private patient.
HSE The HSE and all health insurers have put a process in place to progress implementation of this and other recommendations.
They will continue to work together to deal with a range of claims processing and admission and discharge issues.
Public hospitals should take responsibility for ensuring that consultants are adhering to their contract type.
HSE and relevant hospitals
Being progressed through HSE/Health insurer process.
Health insurers should have access to the contract type of each consultant and where it is claimed that there is a separate side agreement in place, this information should be brought to the attention of the office of the Director of Acute Services in the HSE who can determine the issue.
HSE/Insurers Being progressed through HSE/Health Insurer process.
Patients on discharge should be provided with the opportunity to confirm the details of the treatment received and the names of the treating consultants. This would provide clarity to the hospitals, consultants, insurers, and patients on issues that subsequently can delay claims.
Insurers Being progressed through HSE/Health Insurer process.
61 | P a g e

Appendix 2
FURTHER ANALYSIS OF HIA CLAIMS DATA
62 | P a g e
Increase in Total Cost 51% €556,518,600
Cost 2007 2012Percentage Increase
Nominal Increase
Public Hospitals € 467,031,330 € 573,398,014 23% € 106,366,684
Private (Newer) € 71,920,010 € 266,755,875 271% € 194,835,865Private (Extended) € 211,536,326 € 322,304,138 52% € 110,767,812Private (Other) € 338,512,889 € 483,061,127 43% € 144,548,239
Total Private €621,969,224 €1,072,121,141 72% € 450,151,916
Total €1,089,000,555 €1,645,519,155 51% € 556,518,600
Frequency 2007 2012Percentage Increase
Nominal Increase
Public 280,907 252,850 -10% -28,057
Private (newer) 29,732 126,847 327% 97,115Private (extended) 71,269 134,660 89% 63,391
Private (Other) 140,023 216,055 54% 76,032
Total Private 241,024 477,562 98% 236,538
Total 521,931 730,412 40% 208,481
Market size related Inc in Freq -5%Age Related Inc in Freq 8%Other Inc in Freq 36%Total Inc in Freq 40%
Average Cost per Procedure 2007 2012Percentage Increase
Nominal Increase
Public €1,663 €2,268 36% €605
Private (newer) €2,419 €2,103 -13% -€316Private (extended) €2,968 €2,393 -19% -€575Private (Other) €2,418 €2,236 -8% -€182
Total Private €2,581 €2,245 -13% -€336
Total €2,086 €2,253 8% €166
Average public cost as a % of average private (2012) 101%
Average Length of Stay 2007 2012Percentage Increase
Nominal Increase
Public 3.9 3.2 -18% -0.7
Private (newer) 1.8 1.7 -3% -0.1 Private (extended) 2.2 1.9 -11% -0.2 Private (Other) 3.2 2.7 -18% -0.6
Total Private 2.7 2.2 -19% -0.5
Total 3.4 2.6 -24% -0.8
Summary Sheet - Total Claims 2007 - 2012
63 | P a g e

Increase in Total Cost 46% €194,351,202
Cost 2007 2012Percentage Increase
Nominal Increase
Public Hospitals € 135,241,959 € 154,003,706 14% € 18,761,747
Private (Newer) € 40,249,274 € 134,817,470 235% € 94,568,196Private (Extended) € 101,929,786 € 138,851,302 36% € 36,921,516Private (Other) € 140,670,683 € 184,770,425 31% € 44,099,742
Total Private €282,849,742 €458,439,197 62% € 175,589,454
Total €418,091,701 €612,442,903 46% € 194,351,202
Frequency 2007 2012Percentage Increase
Nominal Increase
Public 98,348 87,315 -11% -11,033
Private (newer) 17,774 61,166 244% 43,392Private (extended) 42,764 61,236 43% 18,472
Private (Other) 78,277 103,633 32% 25,356
Total Private 138,815 226,035 63% 87,220
Total 237,163 313,350 32% 76,187
Market size related Inc in Freq -5%Age Related Inc in Freq 8%Other Inc in Freq 28%Total Inc in Freq 32%
Average Cost per Procedure 2007 2012Percentage Increase
Nominal Increase
Public €1,375 €1,764 28% €389
Private (newer) €2,265 €2,204 -3% -€60Private (extended) €2,384 €2,267 -5% -€116Private (Other) €1,797 €1,783 -1% -€14
Total Private €2,038 €2,028 0% -€9
Total €1,763 €1,955 11% €192
Average public cost as a % of average private (2012) 87%
Average Length of Stay 2007 2012Percentage Increase
Nominal Increase
Public 2.2 1.9 -15% -0.3
Private (newer) 1.4 1.4 -1% -0.0 Private (extended) 1.5 1.3 -10% -0.2 Private (Other) 1.5 1.3 -16% -0.2
Total Private 1.5 1.3 -11% -0.2
Total 1.8 1.5 -18% -0.3
Summary Sheet - Total Claims for which Breakdown Received 2007 - 2012
64 | P a g e
Increase in Total Cost 64% €23,111,083
Cost 2007 2012Percentage Increase
Nominal Increase
Public Hospitals € 7,231,703 € 11,375,182 57% € 4,143,480
Private (Newer) € 4,280,836 € 14,367,961 236% € 10,087,125Private (Extended) € 20,204,855 € 25,467,506 26% € 5,262,651Private (Other) € 4,170,250 € 7,788,077 87% € 3,617,827
Total Private €28,655,941 €47,623,544 66% € 18,967,603
Total €35,887,643 €58,998,726 64% € 23,111,083
Frequency 2007 2012Percentage Increase
Nominal Increase
Public 19,109 19,731 3% 622
Private (newer) 2,347 6,530 178% 4,183Private (extended) 7,882 9,747 24% 1,865
Private (Other) 2,324 3,131 35% 807
Total Private 12,553 19,408 55% 6,855
Total 31,662 39,139 24% 7,477
Market size related Inc in Freq -5%Age Related Inc in Freq 13%Other Inc in Freq 15%Total Inc in Freq 24%
Average Cost per Procedure 2007 2012Percentage Increase
Nominal Increase
Public €378 €577 52% €198
Private (newer) €1,824 €2,200 21% €376Private (extended) €2,563 €2,613 2% €49Private (Other) €1,794 €2,487 39% €693
Total Private €2,283 €2,454 7% €171
Total €1,133 €1,507 33% €374
Average public cost as a % of average private (2012) 23%
Average Length of Stay 2007 2012Percentage Increase
Nominal Increase
Public 1.0 1.0 -1% -0.0
Private (newer) 1.0 1.0 0% 0.0Private (extended) 1.0 1.0 -5% -0.0 Private (Other) 1.0 1.0 -4% -0.0
Total Private 1.0 1.0 -4% -0.0
Total 1.0 1.0 -2% -0.0
Summary Sheet - 1619 Chemotherapy 2007-2012
65 | P a g e

Increase in Total Cost 101% €19,431,104
Cost 2007 2012Percentage Increase
Nominal Increase
Public Hospitals € 3,654,450 € 3,390,303 -7% -€ 264,147
Private (New) € 2,999,002 € 17,718,298 491% € 14,719,296Private (Extended) € 4,662,850 € 5,711,398 22% € 1,048,548Private (Other) € 7,948,907 € 11,876,313 49% € 3,927,407
Total Private €15,610,759 €35,306,010 126% € 19,695,251
Total €19,265,209 €38,696,313 101% € 19,431,104
Frequency 2007 2012Percentage Increase
Nominal Increase
Public 601 466 -22% -135
Private (new) 175 1,086 521% 911Private (extended) 248 313 26% 65
Private (Other) 486 803 65% 317
Total Private 909 2,202 142% 1,293
Total 1,510 2,668 77% 1,158
Market size related Inc in Freq -5%Age Related Inc in Freq 21%Other Inc in Freq 54%Total Inc in Freq 77%
Average Cost per Procedure 2007 2012Percentage Increase
Nominal Increase
Public €6,081 €7,275 20% €1,195
Private (new) €17,137 €16,315 -5% -€822Private (extended) €18,802 €18,247 -3% -€555Private (Other) €16,356 €14,790 -10% -€1,566
Total Private €17,174 €16,034 -7% -€1,140
Total €12,758 €14,504 14% €1,745
Average public cost as a % of average private (2012) 45%
Average Length of Stay 2007 2012Percentage Increase
Nominal Increase
Public 10.3 6.5 -37% -3.8
Private (new) 7.5 6.2 -18% -1.3 Private (extended) 8.9 7.7 -13% -1.2 Private (Other) 10.8 7.5 -31% -3.3
Total Private 9.7 6.9 -29% -2.8
Total 9.9 6.8 -31% -3.1
Summary Sheet - 3910 Knee Replacement 2007 - 2012
66 | P a g e

Increase in Total Cost 47% €17,543,313
Cost 2007 2012Percentage Increase
Nominal Increase
Public Hospitals € 8,757,712 € 13,257,164 51% € 4,499,452
Private (Newer) € 4,149,372 € 7,951,627 92% € 3,802,255Private (Extended) € 5,053,149 € 6,659,849 32% € 1,606,700Private (Other) € 19,725,145 € 27,360,051 39% € 7,634,906
Total Private €28,927,666 €41,971,527 45% € 13,043,861
Total €37,685,378 €55,228,691 47% € 17,543,313
Frequency 2007 2012Percentage Increase
Nominal Increase
Public 9,431 10,782 14% 1,351
Private (newer) 3,055 5,741 88% 2,686Private (extended) 3,891 5,072 30% 1,181
Private (Other) 14,664 19,632 34% 4,968
Total Private 21,610 30,445 41% 8,835
Total 31,041 41,227 33% 10,186
Market size related Inc in Freq -5%Age Related Inc in Freq 8%Other Inc in Freq 30%Total Inc in Freq 33%
Average Cost per Procedure 2007 2012Percentage Increase
Nominal Increase
Public €929 €1,230 32% €301
Private (newer) €1,358 €1,385 2% €27Private (extended) €1,299 €1,313 1% €14Private (Other) €1,345 €1,394 4% €49
Total Private €1,339 €1,379 3% €40
Total €1,214 €1,340 10% €126
Average public cost as a % of average private (2012) 89%
Average Length of Stay 2007 2012Percentage Increase
Nominal Increase
Public 1.1 1.1 7% 0.1
Private (newer) 1.0 1.1 3% 0.0Private (extended) 1.0 1.0 1% 0.0Private (Other) 1.0 1.0 0% 0.0
Total Private 1.0 1.0 1% 0.0
Total 1.0 1.1 3% 0.0
Summary Sheet - 455 Colonoscopy 2007-2012
67 | P a g e

Increase in Total Cost 159% €13,170,537
Cost 2007 2012Percentage Increase
Nominal Increase
Public Hospitals € 939,172 € 2,437,622 160% € 1,498,450
Private (Newer) € 1,367,506 € 6,338,940 364% € 4,971,434Private (Extended) € 3,113,137 € 7,397,600 138% € 4,284,464Private (Other) € 2,840,111 € 5,256,300 85% € 2,416,189
Total Private €7,320,754 €18,992,840 159% € 11,672,087
Total €8,259,925 €21,430,463 159% € 13,170,537
Frequency 2007 2012Percentage Increase
Nominal Increase
Public 687 1,880 174% 1,193
Private (newer) 498 2,624 427% 2,126Private (extended) 1,198 3,088 158% 1,890
Private (Other) 1,036 1,978 91% 942
Total Private 2,732 7,690 181% 4,958
Total 3,419 9,570 180% 6,151
Market size related Inc in Freq -5%Age Related Inc in Freq 15%Other Inc in Freq 157%Total Inc in Freq 180%
Average Cost per Procedure 2007 2012Percentage Increase
Nominal Increase
Public €1,367 €1,297 -5% -€70
Private (newer) €2,746 €2,416 -12% -€330Private (extended) €2,599 €2,396 -8% -€203Private (Other) €2,741 €2,657 -3% -€84
Total Private €2,680 €2,470 -8% -€210
Total €2,416 €2,239 -7% -€177
Average public cost as a % of average private (2012) 52%
Average Length of Stay 2007 2012Percentage Increase
Nominal Increase
Public 2.0 1.3 -33% -0.7
Private (newer) 1.1 1.1 -2% -0.0 Private (extended) 1.0 1.0 1% 0.0Private (Other) 1.2 1.4 9% 0.1
Total Private 1.1 1.1 1% 0.0
Total 1.3 1.2 -9% -0.1
Summary Sheet - 5090 Cardiac Catheterisation & Coronary Angiography 2007-2012
68 | P a g e
Increase in Total Cost 226% €10,751,045
Cost 2007 2012Percentage Increase
Nominal Increase
Public Hospitals € 277,659 € 207,498 -25% -€ 70,161
Private (Newer) € 655,230 € 2,316,781 254% € 1,661,550Private (Extended) € 3,578,472 € 9,331,172 161% € 5,752,700Private (Other) € 245,646 € 3,652,601 1387% € 3,406,956
Total Private €4,479,348 €15,300,554 242% € 10,821,206
Total €4,757,007 €15,508,052 226% € 10,751,045
Frequency 2007 2012Percentage Increase
Nominal Increase
Public 76 68 -11% -8
Private (newer) 38 124 226% 86Private (extended) 210 489 133% 279
Private (Other) 14 211 1407% 197
Total Private 262 824 215% 562
Total 338 892 164% 554
Market size related Inc in Freq -5%Age Related Inc in Freq 6%Other Inc in Freq 161%Total Inc in Freq 164%
Average Cost per Procedure 2007 2012Percentage Increase
Nominal Increase
Public €3,653 €3,051 -16% -€602
Private (newer) €17,243 €18,684 8% €1,441Private (extended) €17,040 €19,082 12% €2,042Private (Other) €17,546 €17,311 -1% -€235
Total Private €17,097 €18,569 9% €1,472
Total €14,074 €17,386 24% €3,312
Average public cost as a % of average private (2012) 16%
Average Length of Stay 2007 2012Percentage Increase
Nominal Increase
Public 4.1 2.8 -33% -1.4
Private (newer) 10.3 2.8 -73% -7.5 Private (extended) 2.5 2.3 -9% -0.2 Private (Other) 1.9 1.8 -4% -0.1
Total Private 3.6 2.2 -38% -1.4
Total 3.7 2.3 -39% -1.4
Summary Sheet - 5961 Intracardiac Catheter Ablation 2007 - 2012
69 | P a g e

Increase in Total Cost 31% €9,812,526
Cost 2007 2012Percentage Increase
Nominal Increase
Public Hospitals € 7,628,731 € 5,933,508 -22% -€ 1,695,224
Private (Newer) € 4,652,096 € 15,554,440 234% € 10,902,343Private (Extended) € 5,938,188 € 6,433,867 8% € 495,679Private (Other) € 13,357,087 € 13,466,815 1% € 109,728
Total Private €23,947,371 €35,455,121 48% € 11,507,750
Total €31,576,102 €41,388,629 31% € 9,812,526
Frequency 2007 2012Percentage Increase
Nominal Increase
Public 1,210 825 -32% -385
Private (newer) 345 1,236 258% 891Private (extended) 417 483 16% 66
Private (Other) 981 1,086 11% 105
Total Private 1,743 2,805 61% 1,062
Total 2,953 3,630 23% 677
Market size related Inc in Freq -5%Age Related Inc in Freq 19%Other Inc in Freq 9%Total Inc in Freq 23%
Average Cost per Procedure 2007 2012Percentage Increase
Nominal Increase
Public €6,305 €7,192 14% €887
Private (newer) €13,484 €12,584 -7% -€900Private (extended) €14,240 €13,321 -6% -€920Private (Other) €13,616 €12,400 -9% -€1,215
Total Private €13,739 €12,640 -8% -€1,099
Total €10,693 €11,402 7% €709
Average public cost as a % of average private (2012) 57%
Average Length of Stay 2007 2012Percentage Increase
Nominal Increase
Public 10.1 6.8 -32% -3.2
Private (newer) 7.6 6.2 -18% -1.4 Private (extended) 9.0 7.8 -13% -1.2 Private (Other) 10.1 7.4 -27% -2.7
Total Private 9.3 6.9 -26% -2.4
Total 9.6 6.9 -28% -2.7
Summary Sheet - 3660 & 3666 Hip Replacement 2007-2012
70 | P a g e

Increase in Total Cost 31% €6,468,726
Cost 2007 2012Percentage Increase
Nominal Increase
Public Hospitals € 3,886,835 € 2,483,669 -36% -€ 1,403,166
Private (Newer) € 2,492,221 € 6,268,700 152% € 3,776,478Private (Extended) € 2,995,684 € 4,743,848 58% € 1,748,164Private (Other) € 11,278,679 € 13,625,929 21% € 2,347,250
Total Private €16,766,584 €24,638,476 47% € 7,871,892
Total €20,653,420 €27,122,146 31% € 6,468,726
Frequency 2007 2012Percentage Increase
Nominal Increase
Public 2,142 1,384 -35% -758
Private (newer) 945 2,775 194% 1,830Private (extended) 1,057 2,131 102% 1,074
Private (Other) 3,578 5,890 65% 2,312
Total Private 5,580 10,796 93% 5,216
Total 7,722 12,180 58% 4,458
Market size related Inc in Freq -5%Age Related Inc in Freq 25%Other Inc in Freq 33%Total Inc in Freq 58%
Average Cost per Procedure 2007 2012Percentage Increase
Nominal Increase
Public €1,815 €1,795 -1% -€20
Private (newer) €2,637 €2,259 -14% -€378Private (extended) €2,834 €2,226 -21% -€608Private (Other) €3,152 €2,313 -27% -€839
Total Private €3,005 €2,282 -24% -€723
Total €2,675 €2,227 -17% -€448
Average public cost as a % of average private (2012) 79%
Average Length of Stay 2007 2012Percentage Increase
Nominal Increase
Public 1.3 1.0 -25% -0.3
Private (newer) 1.0 1.0 -3% -0.0 Private (extended) 1.4 1.0 -27% -0.4 Private (Other) 1.3 1.0 -23% -0.3
Total Private 1.3 1.0 -21% -0.3
Total 1.3 1.0 -22% -0.3
Summary Sheet - 2802 Cataracts 2007-2012
71 | P a g e

Increase in Total Cost 65% €5,671,328
Cost 2007 2012Percentage Increase
Nominal Increase
Public Hospitals € 1,416,491 € 1,248,284 -12% -€ 168,208
Private (Newer) € 2,389,454 € 7,444,674 212% € 5,055,219Private (Extended) € 813,948 € 314,904 -61% -€ 499,044Private (Other) € 4,084,607 € 5,367,967 31% € 1,283,360
Total Private €7,288,009 €13,127,544 80% € 5,839,535
Total €8,704,501 €14,375,828 65% € 5,671,328
Frequency 2007 2012Percentage Increase
Nominal Increase
Public 1,013 767 -24% -246
Private (newer) 1,210 3,720 207% 2,510Private (extended) 444 166 -63% -278
Private (Other) 1,928 2,515 30% 587
Total Private 3,582 6,401 79% 2,819
Total 4,595 7,168 56% 2,573
Market size related Inc in Freq -5%Age Related Inc in Freq 1%Other Inc in Freq 62%Total Inc in Freq 56%
Average Cost per Procedure 2007 2012Percentage Increase
Nominal Increase
Public €1,398 €1,627 16% €229
Private (newer) €1,975 €2,001 1% €27Private (extended) €1,833 €1,897 3% €64Private (Other) €2,119 €2,134 1% €16
Total Private €2,035 €2,051 1% €16
Total €1,894 €2,006 6% €111
Average public cost as a % of average private (2012) 79%
Average Length of Stay 2007 2012Percentage Increase
Nominal Increase
Public 1.0 1.0 0% 0.0
Private (newer) 1.0 1.0 0% 0.0Private (extended) 1.0 1.0 0% 0.0Private (Other) 1.0 1.0 0% -0.0
Total Private 1.0 1.0 0% -0.0
Total 1.0 1.0 0% -0.0
Summary Sheet - 3821 & 3822 Knee Cartilage 2007-2012
72 | P a g e

Increase in Total Cost 39% €5,619,602
Cost 2007 2012Percentage Increase
Nominal Increase
Public Hospitals € 5,301,700 € 7,386,245 39% € 2,084,545
Private (Newer) € 962,285 € 2,368,147 146% € 1,405,863Private (Extended) € 1,507,959 € 2,079,536 38% € 571,577Private (Other) € 6,791,706 € 8,349,322 23% € 1,557,616
Total Private €9,261,949 €12,797,006 38% € 3,535,057
Total €14,563,649 €20,183,251 39% € 5,619,602
Frequency 2007 2012Percentage Increase
Nominal Increase
Public 7,966 7,368 -8% -598
Private (newer) 1,084 2,670 146% 1,586Private (extended) 1,801 2,481 38% 680
Private (Other) 7,275 8,892 22% 1,617
Total Private 10,160 14,043 38% 3,883
Total 18,126 21,411 18% 3,285
Market size related Inc in Freq -5%Age Related Inc in Freq 6%Other Inc in Freq 18%Total Inc in Freq 18%
Average Cost per Procedure 2007 2012Percentage Increase
Nominal Increase
Public €666 €1,002 51% €337
Private (newer) €888 €887 0% -€1Private (extended) €837 €838 0% €1Private (Other) €934 €939 1% €5
Total Private €912 €911 0% -€0
Total €803 €943 17% €139
Average public cost as a % of average private (2012) 110%
Average Length of Stay 2007 2012Percentage Increase
Nominal Increase
Public 1.1 1.1 4% 0.0
Private (newer) 1.1 1.1 2% 0.0Private (extended) 1.0 1.0 2% 0.0Private (Other) 1.1 1.0 -2% -0.0
Total Private 1.1 1.1 0% -0.0
Total 1.1 1.1 1% 0.0
Summary Sheet - 194 Upper GI Endoscopy 2007-2012
73 | P a g e

Increase in Total Cost 17% €4,857,690
Cost 2007 2012Percentage Increase
Nominal Increase
Public Hospitals € 24,807,016 € 30,092,242 21% € 5,285,227
Private (Newer) € 898 € 0 -100% -€ 898Private (Extended) € 431 € 0 -100% -€ 431Private (Other) € 3,762,458 € 3,336,249 -11% -€ 426,208
Total Private €3,763,786 €3,336,249 -11% -€ 427,537
Total €28,570,802 €33,428,491 17% € 4,857,690
Frequency 2007 2012Percentage Increase
Nominal Increase
Public 6,504 5,158 -21% -1,346
Private (newer) 2 - -100% -2
Private (extended) 1 - -100% -1
Private (Other) 715 543 -24% -172
Total Private 718 543 -24% -175
Total 7,222 5,701 -21% -1,521
Market size related Inc in Freq -5%Age Related Inc in Freq -4%Other Inc in Freq -13%Total Inc in Freq -21%
Average Cost per Procedure 2007 2012Percentage Increase
Nominal Increase
Public €3,814 €5,834 53% €2,020
Private (newer) €449 - - -Private (extended) €431 - - -Private (Other) €5,262 €6,144 17% €882
Total Private €5,242 €6,144 17% €902
Total €3,956 €5,864 48% €1,908
Average public cost as a % of average private (2012) 95%
Average Length of Stay 2007 2012Percentage Increase
Nominal Increase
Public 5.6 5.3 -5% -0.3
Private (newer) 4.5 - - -Private (extended) 4.0 - - -Private (Other) 5.7 5.4 -5% -0.3
Total Private 5.7 5.4 -5% -0.3
Total 5.6 5.3 -5% -0.3
Summary Sheet - 2190 Caesarean Delivery 2007 - 2012
74 | P a g e

75 | P a g e
![Vocabulary for IELTS - kuzina.mekuzina.me/pdf/Vocabulary for IELTS.pdf · maintain [meɪn'teɪn] to maintain one's health to maintain roads to maintain a family to maintain security](https://img.pdfslide.tips/doc/110x75/5a9efd107f8b9a84178c2fb0/vocabulary-for-ielts-for-ieltspdfmaintain-menten-to-maintain-ones-health.jpg)