Embed Size (px)
Citation preview
00
1Aid EffEctivEnEss 2011: ProgrEss in imPlEmEnting thE PAris dEclArAtion – volumE ii country chAPtErs
Kenya
introduction
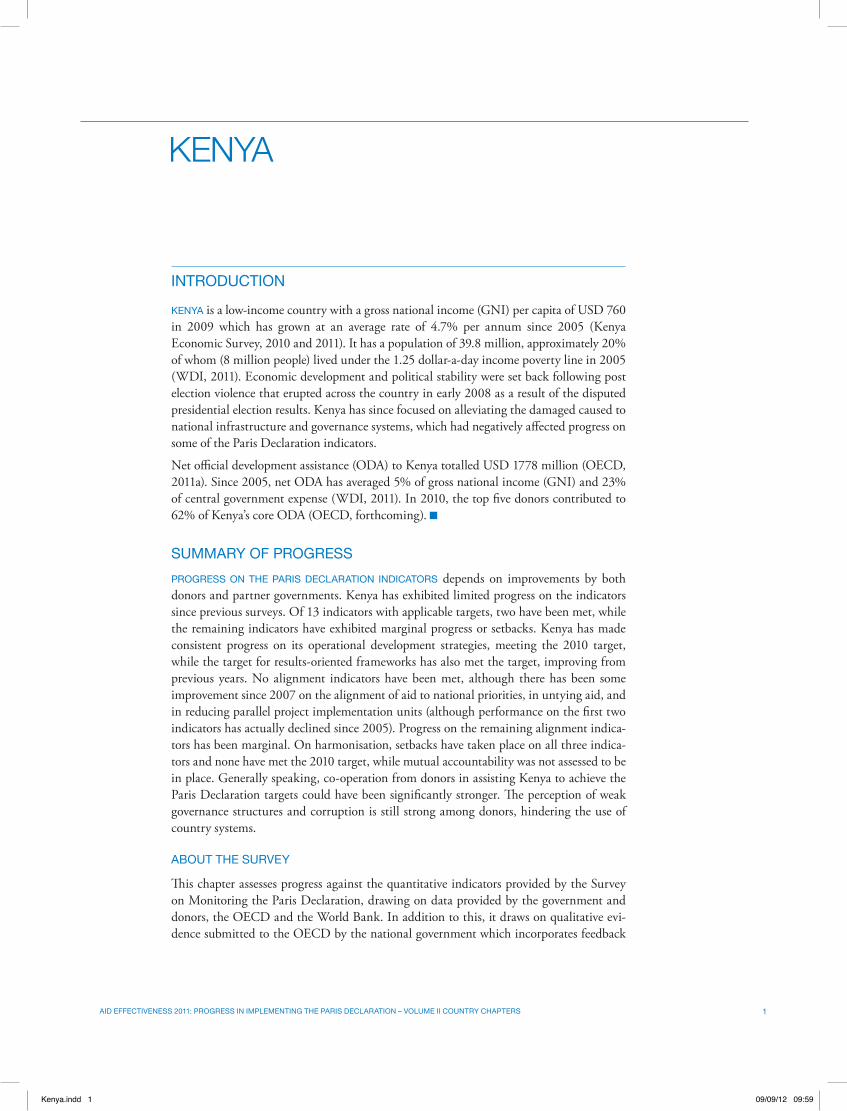
KEnyA is a low-income country with a gross national income (GNI) per capita of USD 760 in 2009 which has grown at an average rate of 4.7% per annum since 2005 (Kenya Economic Survey, 2010 and 2011). It has a population of 39.8 million, approximately 20% of whom (8 million people) lived under the 1.25 dollar-a-day income poverty line in 2005 (WDI, 2011). Economic development and political stability were set back following post election violence that erupted across the country in early 2008 as a result of the disputed presidential election results. Kenya has since focused on alleviating the damaged caused to national infrastructure and governance systems, which had negatively affected progress on some of the Paris Declaration indicators.
Net official development assistance (ODA) to Kenya totalled USD 1778 million (OECD, 2011a). Since 2005, net ODA has averaged 5% of gross national income (GNI) and 23% of central government expense (WDI, 2011). In 2010, the top five donors contributed to 62% of Kenya’s core ODA (OECD, forthcoming). n
summAry of ProgrEssProgrEss on thE PAris dEclArAtion indicAtors depends on improvements by both donors and partner governments. Kenya has exhibited limited progress on the indicators since previous surveys. Of 13 indicators with applicable targets, two have been met, while the remaining indicators have exhibited marginal progress or setbacks. Kenya has made consistent progress on its operational development strategies, meeting the 2010 target, while the target for results-oriented frameworks has also met the target, improving from previous years. No alignment indicators have been met, although there has been some improvement since 2007 on the alignment of aid to national priorities, in untying aid, and in reducing parallel project implementation units (although performance on the first two indicators has actually declined since 2005). Progress on the remaining alignment indica-tors has been marginal. On harmonisation, setbacks have taken place on all three indica-tors and none have met the 2010 target, while mutual accountability was not assessed to be in place. Generally speaking, co-operation from donors in assisting Kenya to achieve the Paris Declaration targets could have been significantly stronger. The perception of weak governance structures and corruption is still strong among donors, hindering the use of country systems.
About thE survEy
This chapter assesses progress against the quantitative indicators provided by the Survey on Monitoring the Paris Declaration, drawing on data provided by the government and donors, the OECD and the World Bank. In addition to this, it draws on qualitative evi-dence submitted to the OECD by the national government which incorporates feedback
Kenya.indd 1 09/09/12 09:59
2 Aid EffEctivEnEss 2011: ProgrEss in imPlEmEnting thE PAris dEclArAtion – volumE ii country chAPtErs
KEnyA
from donors and other stakeholders. Stakeholders note that it is possible that in places definitions and con-cepts were interpreted differently by survey respondents in 2011 compared with previous years. A degree of caution should be taken when analysing the trends shown by some of the indicators.
The 2011 survey process was participatory and consultative. A validation workshop was held in which to discuss and incorporate the viewpoints of various stakeholders. The 2011 survey responses cover 20 donors which provide 90% of Kenya’s core ODA. However, it is important to note that emerging donors like China and the Middle Eastern countries that provide a large proportion of ODA did not complete the donor ques-tionnaire. Kenya completed optional modules on gender equality and inclusive ownership as part of the survey process. n
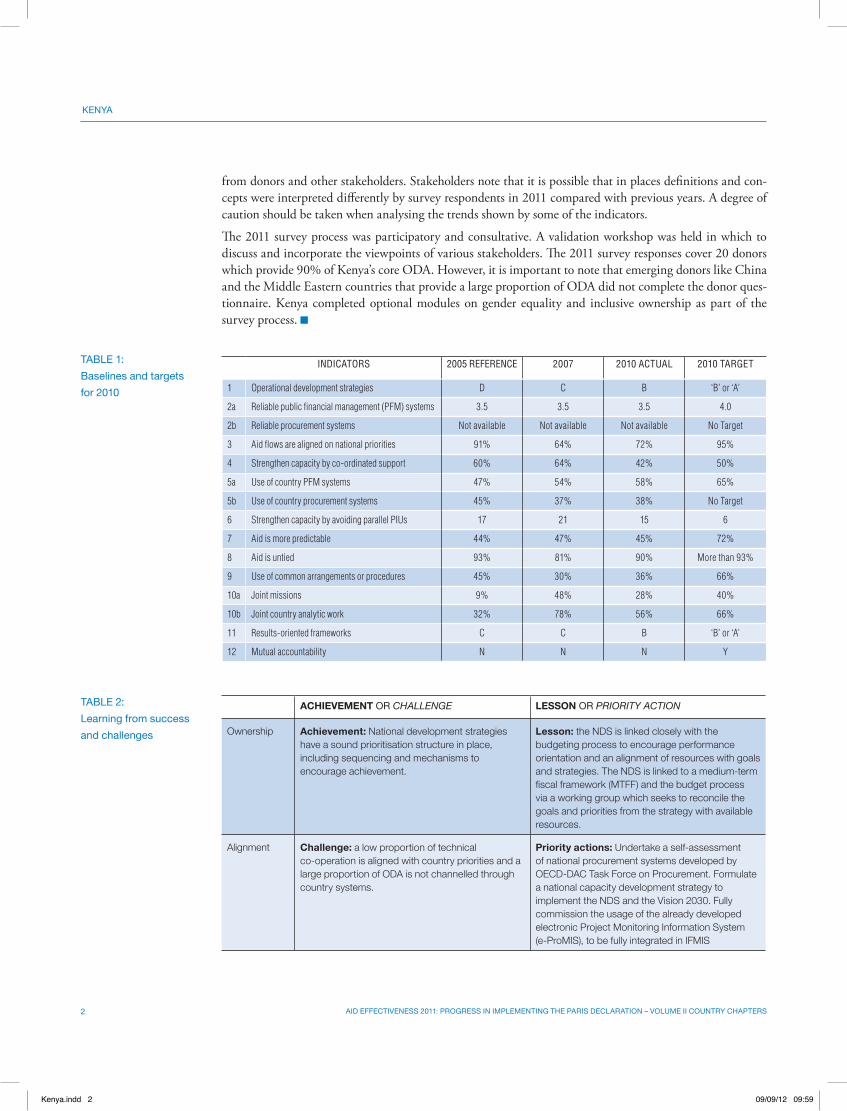
tAblE 1: baselines and targets for 2010
INDICATORS 2005 REFERENCE 2007 2010 ACTUAL 2010 TARGET
1 Operational development strategies D C B ‘B’ or ‘A’
2a Reliable public financial management (PFM) systems 3.5 3.5 3.5 4.0
2b Reliable procurement systems Not available Not available Not available No Target
3 Aid flows are aligned on national priorities 91% 64% 72% 95%
4 Strengthen capacity by co-ordinated support 60% 64% 42% 50%
5a Use of country PFM systems 47% 54% 58% 65%
5b Use of country procurement systems 45% 37% 38% No Target
6 Strengthen capacity by avoiding parallel PIUs 17 21 15 6
7 Aid is more predictable 44% 47% 45% 72%
8 Aid is untied 93% 81% 90% More than 93%
9 Use of common arrangements or procedures 45% 30% 36% 66%
10a Joint missions 9% 48% 28% 40%
10b Joint country analytic work 32% 78% 56% 66%
11 Results-oriented frameworks C C B ‘B’ or ‘A’
12 Mutual accountability N N N Y
tAblE 2: learning from success and challenges
ACHIEVEMENT or CHALLENGE LESSON or PRIORITY ACTION
Ownership Achievement: national development strategies have a sound prioritisation structure in place, including sequencing and mechanisms to encourage achievement.
Lesson: the nDS is linked closely with the budgeting process to encourage performance orientation and an alignment of resources with goals and strategies. The nDS is linked to a medium-term fiscal framework (MTFF) and the budget process via a working group which seeks to reconcile the goals and priorities from the strategy with available resources.
alignment Challenge: a low proportion of technical co-operation is aligned with country priorities and a large proportion of ODa is not channelled through country systems.
Priority actions: Undertake a self-assessment of national procurement systems developed by OECD-DAC Task Force on Procurement. Formulate a national capacity development strategy to implement the NDS and the Vision 2030. Fully commission the usage of the already developed electronic Project Monitoring Information System (e-ProMIS), to be fully integrated in IFMIS
Kenya.indd 2 09/09/12 09:59
3Aid EffEctivEnEss 2011: ProgrEss in imPlEmEnting thE PAris dEclArAtion – volumE ii country chAPtErs
KEnyA
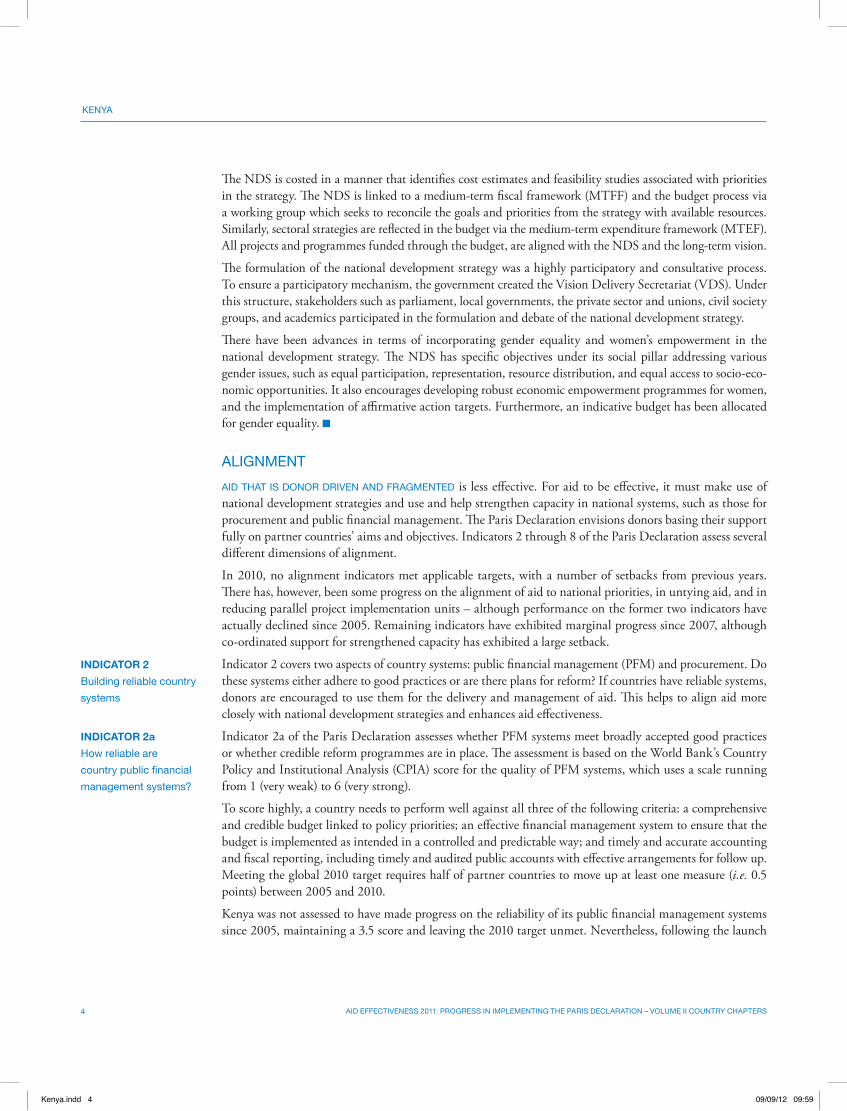
oWnErshiPAid is most EffEctivE when it supports a country-owned approach to development. It is less effective when aid policies and approaches are driven by donors. In the context of the Paris Declaration, ownership concerns a country’s ability to carry out two, inter-linked activities: exercise effective leadership over its development policies and strategies; and co-ordinate the efforts of various development actors working in the country.
Indicator 1 assesses the operational value of a country’s development strategy. In particular, it looks at the existence of an authoritative country-wide development policy (i.e. a unified strategic framework), the extent to which priorities are established, and whether these policies are costed and linked with the budget. All of these features are important to harness domestic resources for development, and to provide a basis for the alignment of aid to development priorities. Each country has provided evidence against these criteria, and this has been translated into a score by the World Bank using the same methodology as in the 2006 and 2008 surveys. A five-point scale runs from A (highest score) to E (lowest score). The Paris Declaration targets 75% of partner countries achieving a score of A or B by 2010.
Kenya has consistently improved its operational development strategies since 2005, meeting the 2010 target of a B score. The improvement is evidence of a strong and integrated long-term vision (The Kenya Vision 2030), and medium-term national development strategy (NDS), the First Medium Term Plan 2008-2012. Both strategies serve as guiding documents and reference points for sub-national and sectoral policies. A sound prioritisation structure which includes sequencing and mechanisms to encourage achievement is in place. The NDS is linked closely with the budgeting process through various means which aim to encourage performance orientation and the alignment of resources with goals and strategies.
The strong inter-linkage between the national, sub-national, ministerial, and sectoral strategies are indicators of an integrated and coherent development planning approach. The NDS has prioritised targets which are achieved through various mechanisms such as performance contracts and the alignment of external resources to the national development strategy. The objectives of both the long-term vision and the NDS are closely linked with the Millennium Development Goals (MDGs), and all of the MDG targets are internalised and contextualised by Kenya through a mainstreaming and co-ordination process as well as implementation monitoring reports. Cross-cutting issues such as governance, gender, and environment have also been main-streamed in national development strategies.
ACHIEVEMENT or CHALLENGE LESSON or PRIORITY ACTION
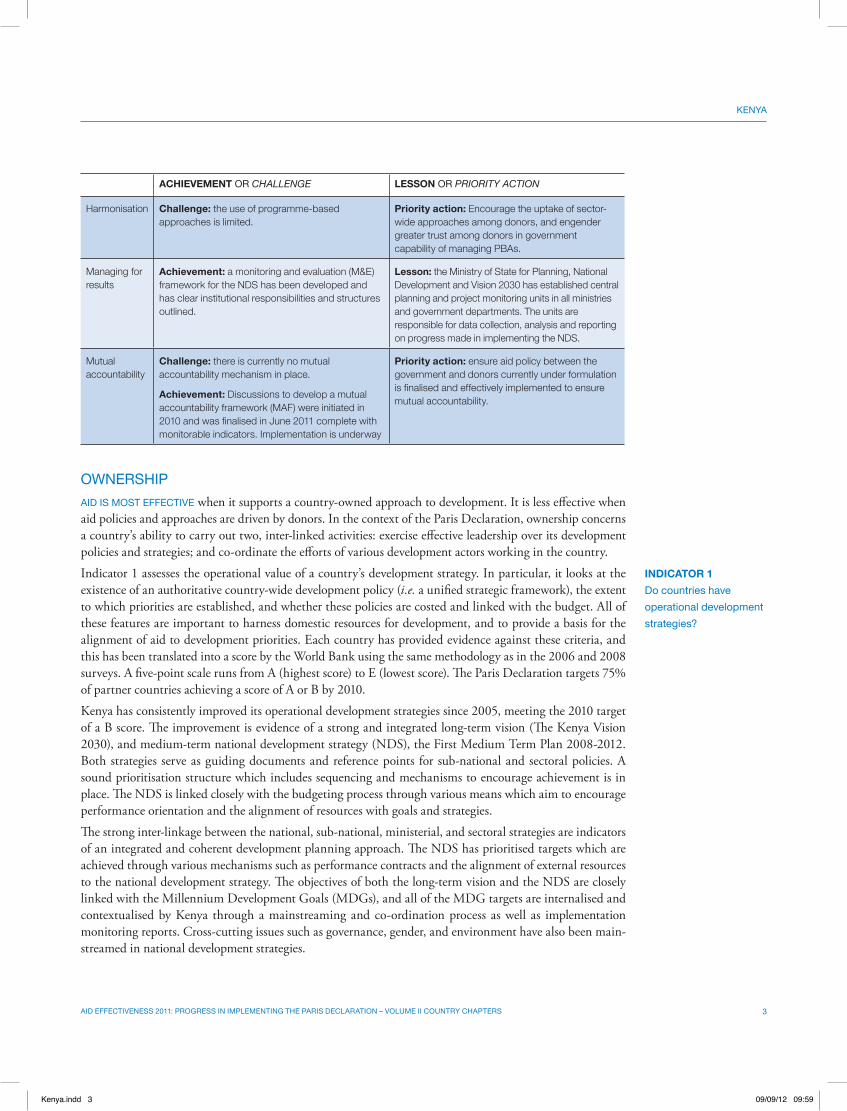
Harmonisation Challenge: the use of programme-based approaches is limited.
Priority action: encourage the uptake of sector-wide approaches among donors, and engender greater trust among donors in government capability of managing PBAs.
Managing for results
Achievement: a monitoring and evaluation (M&E) framework for the nDS has been developed and has clear institutional responsibilities and structures outlined.
Lesson: the Ministry of State for Planning, National Development and Vision 2030 has established central planning and project monitoring units in all ministries and government departments. The units are responsible for data collection, analysis and reporting on progress made in implementing the nDS.
Mutual accountability
Challenge: there is currently no mutual accountability mechanism in place.
Achievement: Discussions to develop a mutual accountability framework (MAF) were initiated in 2010 and was finalised in June 2011 complete with monitorable indicators. Implementation is underway
Priority action: ensure aid policy between the government and donors currently under formulation is finalised and effectively implemented to ensure mutual accountability.
INDICATOR 1 do countries have operational development strategies?
Kenya.indd 3 09/09/12 09:59
4 Aid EffEctivEnEss 2011: ProgrEss in imPlEmEnting thE PAris dEclArAtion – volumE ii country chAPtErs
KEnyA
The NDS is costed in a manner that identifies cost estimates and feasibility studies associated with priorities in the strategy. The NDS is linked to a medium-term fiscal framework (MTFF) and the budget process via a working group which seeks to reconcile the goals and priorities from the strategy with available resources. Similarly, sectoral strategies are reflected in the budget via the medium-term expenditure framework (MTEF). All projects and programmes funded through the budget, are aligned with the NDS and the long-term vision.
The formulation of the national development strategy was a highly participatory and consultative process. To ensure a participatory mechanism, the government created the Vision Delivery Secretariat (VDS). Under this structure, stakeholders such as parliament, local governments, the private sector and unions, civil society groups, and academics participated in the formulation and debate of the national development strategy.
There have been advances in terms of incorporating gender equality and women’s empowerment in the national development strategy. The NDS has specific objectives under its social pillar addressing various gender issues, such as equal participation, representation, resource distribution, and equal access to socio-eco-nomic opportunities. It also encourages developing robust economic empowerment programmes for women, and the implementation of affirmative action targets. Furthermore, an indicative budget has been allocated for gender equality. n
AlignmEntAid thAt is donor drivEn And frAgmEntEd is less effective. For aid to be effective, it must make use of national development strategies and use and help strengthen capacity in national systems, such as those for procurement and public financial management. The Paris Declaration envisions donors basing their support fully on partner countries’ aims and objectives. Indicators 2 through 8 of the Paris Declaration assess several different dimensions of alignment.
In 2010, no alignment indicators met applicable targets, with a number of setbacks from previous years. There has, however, been some progress on the alignment of aid to national priorities, in untying aid, and in reducing parallel project implementation units – although performance on the former two indicators have actually declined since 2005. Remaining indicators have exhibited marginal progress since 2007, although co-ordinated support for strengthened capacity has exhibited a large setback.
Indicator 2 covers two aspects of country systems: public financial management (PFM) and procurement. Do these systems either adhere to good practices or are there plans for reform? If countries have reliable systems, donors are encouraged to use them for the delivery and management of aid. This helps to align aid more closely with national development strategies and enhances aid effectiveness.
Indicator 2a of the Paris Declaration assesses whether PFM systems meet broadly accepted good practices or whether credible reform programmes are in place. The assessment is based on the World Bank’s Country Policy and Institutional Analysis (CPIA) score for the quality of PFM systems, which uses a scale running from 1 (very weak) to 6 (very strong).
To score highly, a country needs to perform well against all three of the following criteria: a comprehensive and credible budget linked to policy priorities; an effective financial management system to ensure that the budget is implemented as intended in a controlled and predictable way; and timely and accurate accounting and fiscal reporting, including timely and audited public accounts with effective arrangements for follow up. Meeting the global 2010 target requires half of partner countries to move up at least one measure (i.e. 0.5 points) between 2005 and 2010.
Kenya was not assessed to have made progress on the reliability of its public financial management systems since 2005, maintaining a 3.5 score and leaving the 2010 target unmet. Nevertheless, following the launch
INDICATOR 2 building reliable country systems
INDICATOR 2a how reliable are country public financial management systems?
Kenya.indd 4 09/09/12 09:59
5Aid EffEctivEnEss 2011: ProgrEss in imPlEmEnting thE PAris dEclArAtion – volumE ii country chAPtErs
KEnyA
of the Public Financial Management Reform Programme in 2006, a number of reforms have been imple-mented in areas such as budget formulation and execution, internal and external audit, revenue collection, and parliamentary oversight. Country stakeholders acknowledge, however, that there is room for improve-ment in cash management, and administration of public debt to reduce costs. A second PFM strategy is cur-rently being formulated.
Indicator 2b was first measured in 2008 by 17 countries. The process is one of self-assessment, using the Methodology for the Assessment of National Procurement Systems developed by the OECD-DAC Task Force on Procurement. The methodology includes baseline indicators to compare a country’s systems to internation-ally-accepted good practice, as well as a new set of indicators. These indicators assess overall performance of the system, compliance with national legislation and standards and whether there is a reform programme in place to promote improved practices. The results are expressed as grades on a four-point scale running from A (the highest) to D (the lowest). The 2010 target is for a third of partner countries to move up at least one measure (i.e. from D to C, C to B or B to A) although not all countries will perform an assessment.
Kenya was not assessed on the reliability of its procurement systems in 2010. Notable procurement reforms since 2005 include the Public Procurement and Disposal Act, 2005 which, among other reforms, established an autonomous oversight body, the Public Procurement Oversight Authority (PPOA), Public Procurement Oversight Advisory Board and the Public Procurement Administrative Review Board.
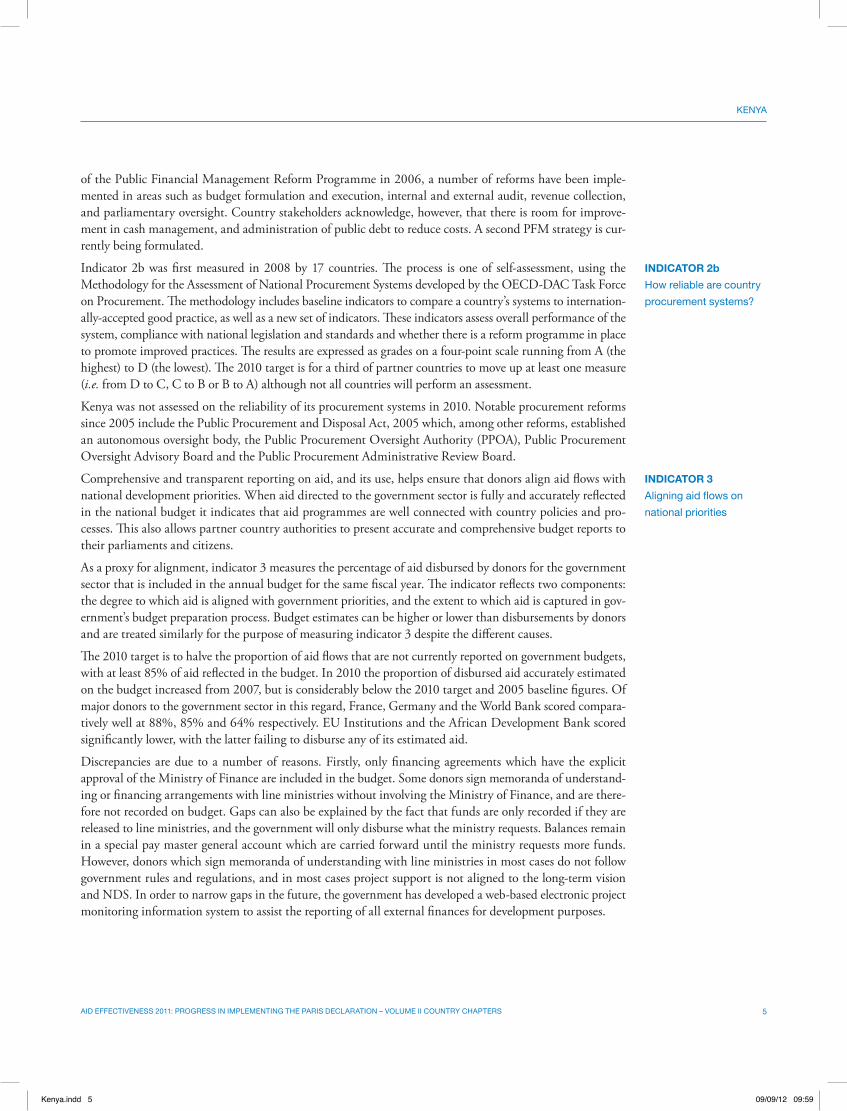
Comprehensive and transparent reporting on aid, and its use, helps ensure that donors align aid flows with national development priorities. When aid directed to the government sector is fully and accurately reflected in the national budget it indicates that aid programmes are well connected with country policies and pro-cesses. This also allows partner country authorities to present accurate and comprehensive budget reports to their parliaments and citizens.
As a proxy for alignment, indicator 3 measures the percentage of aid disbursed by donors for the government sector that is included in the annual budget for the same fiscal year. The indicator reflects two components: the degree to which aid is aligned with government priorities, and the extent to which aid is captured in gov-ernment’s budget preparation process. Budget estimates can be higher or lower than disbursements by donors and are treated similarly for the purpose of measuring indicator 3 despite the different causes.
The 2010 target is to halve the proportion of aid flows that are not currently reported on government budgets, with at least 85% of aid reflected in the budget. In 2010 the proportion of disbursed aid accurately estimated on the budget increased from 2007, but is considerably below the 2010 target and 2005 baseline figures. Of major donors to the government sector in this regard, France, Germany and the World Bank scored compara-tively well at 88%, 85% and 64% respectively. EU Institutions and the African Development Bank scored significantly lower, with the latter failing to disburse any of its estimated aid.
Discrepancies are due to a number of reasons. Firstly, only financing agreements which have the explicit approval of the Ministry of Finance are included in the budget. Some donors sign memoranda of understand-ing or financing arrangements with line ministries without involving the Ministry of Finance, and are there-fore not recorded on budget. Gaps can also be explained by the fact that funds are only recorded if they are released to line ministries, and the government will only disburse what the ministry requests. Balances remain in a special pay master general account which are carried forward until the ministry requests more funds. However, donors which sign memoranda of understanding with line ministries in most cases do not follow government rules and regulations, and in most cases project support is not aligned to the long-term vision and NDS. In order to narrow gaps in the future, the government has developed a web-based electronic project monitoring information system to assist the reporting of all external finances for development purposes.
INDICATOR 2b how reliable are country procurement systems?
INDICATOR 3 Aligning aid flows on national priorities
Kenya.indd 5 09/09/12 09:59
6 Aid EffEctivEnEss 2011: ProgrEss in imPlEmEnting thE PAris dEclArAtion – volumE ii country chAPtErs
KEnyA
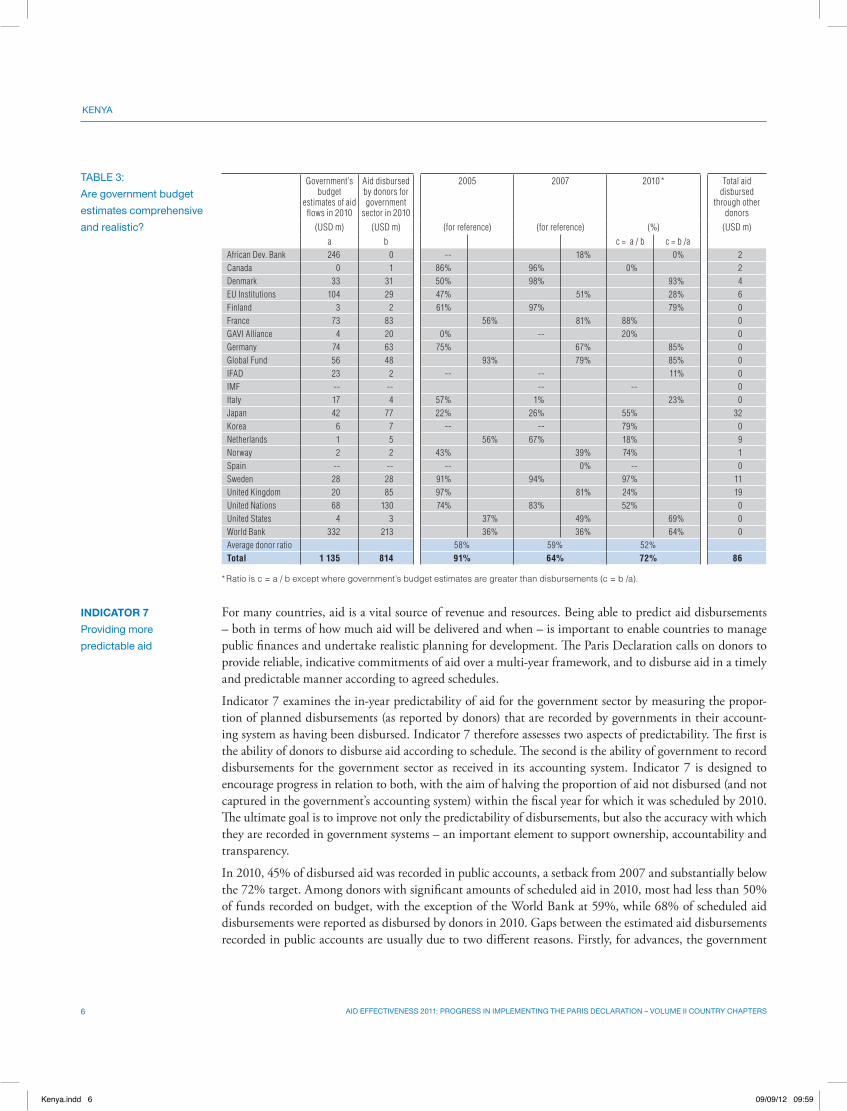
For many countries, aid is a vital source of revenue and resources. Being able to predict aid disbursements – both in terms of how much aid will be delivered and when – is important to enable countries to manage public finances and undertake realistic planning for development. The Paris Declaration calls on donors to provide reliable, indicative commitments of aid over a multi-year framework, and to disburse aid in a timely and predictable manner according to agreed schedules.
Indicator 7 examines the in-year predictability of aid for the government sector by measuring the propor-tion of planned disbursements (as reported by donors) that are recorded by governments in their account-ing system as having been disbursed. Indicator 7 therefore assesses two aspects of predictability. The first is the ability of donors to disburse aid according to schedule. The second is the ability of government to record disbursements for the government sector as received in its accounting system. Indicator 7 is designed to encourage progress in relation to both, with the aim of halving the proportion of aid not disbursed (and not captured in the government’s accounting system) within the fiscal year for which it was scheduled by 2010. The ultimate goal is to improve not only the predictability of disbursements, but also the accuracy with which they are recorded in government systems – an important element to support ownership, accountability and transparency.
In 2010, 45% of disbursed aid was recorded in public accounts, a setback from 2007 and substantially below the 72% target. Among donors with significant amounts of scheduled aid in 2010, most had less than 50% of funds recorded on budget, with the exception of the World Bank at 59%, while 68% of scheduled aid disbursements were reported as disbursed by donors in 2010. Gaps between the estimated aid disbursements recorded in public accounts are usually due to two different reasons. Firstly, for advances, the government
Government’s budget
estimates of aid flows in 2010
Aid disbursed by donors for government
sector in 2010
2005 2007 2010 * Total aid disbursed
through other donors
(USD m) (USD m) (for reference) (for reference) (%) (USD m)a b c = a / b c = b /a
African Dev. Bank 246 0 -- 18% 0% 2Canada 0 1 86% 96% 0% 2Denmark 33 31 50% 98% 93% 4EU Institutions 104 29 47% 51% 28% 6Finland 3 2 61% 97% 79% 0France 73 83 56% 81% 88% 0GAVI Alliance 4 20 0% -- 20% 0Germany 74 63 75% 67% 85% 0Global Fund 56 48 93% 79% 85% 0IFAD 23 2 -- -- 11% 0IMF -- -- -- -- 0Italy 17 4 57% 1% 23% 0Japan 42 77 22% 26% 55% 32Korea 6 7 -- -- 79% 0Netherlands 1 5 56% 67% 18% 9Norway 2 2 43% 39% 74% 1Spain -- -- -- 0% -- 0Sweden 28 28 91% 94% 97% 11United Kingdom 20 85 97% 81% 24% 19United Nations 68 130 74% 83% 52% 0United States 4 3 37% 49% 69% 0World Bank 332 213 36% 36% 64% 0Average donor ratio 58% 59% 52%Total 1 135 814 91% 64% 72% 86
* Ratio is c = a / b except where government’s budget estimates are greater than disbursements (c = b /a).
tAblE 3: Are government budget estimates comprehensive and realistic?
INDICATOR 7 Providing more predictable aid
Kenya.indd 6 09/09/12 09:59
7Aid EffEctivEnEss 2011: ProgrEss in imPlEmEnting thE PAris dEclArAtion – volumE ii country chAPtErs
KEnyA
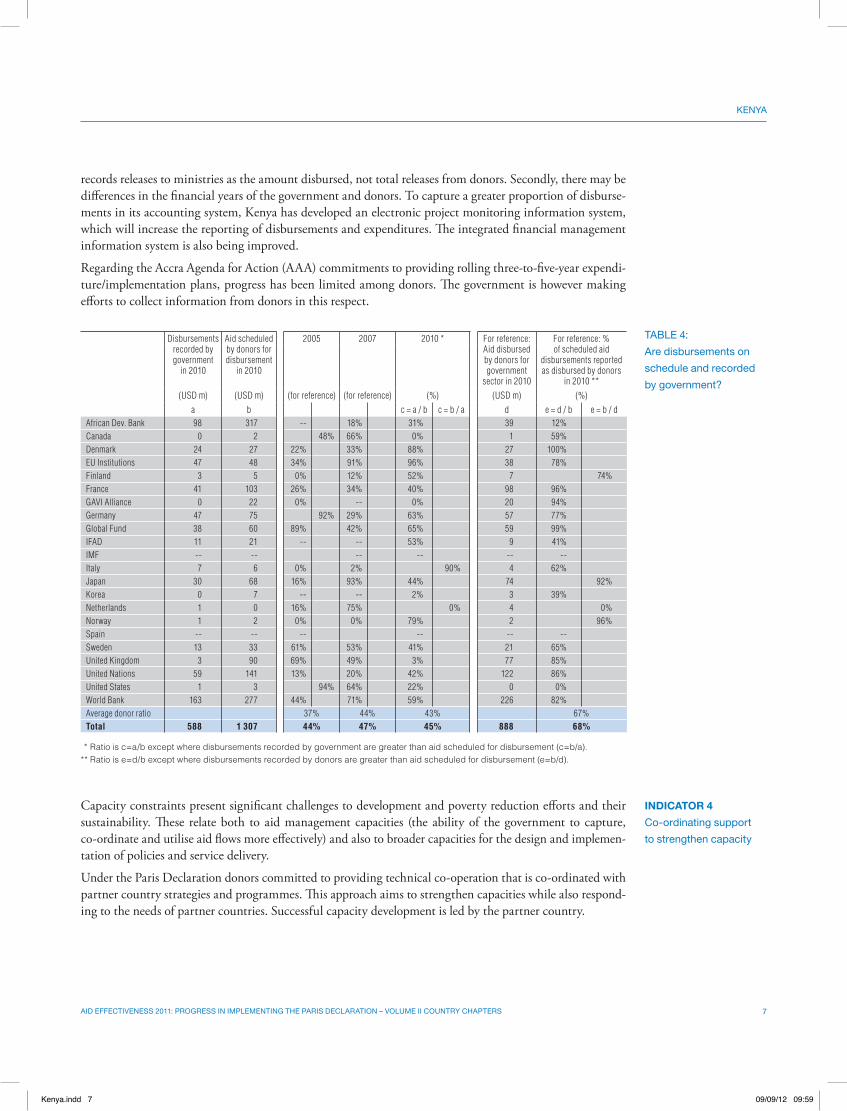
records releases to ministries as the amount disbursed, not total releases from donors. Secondly, there may be differences in the financial years of the government and donors. To capture a greater proportion of disburse-ments in its accounting system, Kenya has developed an electronic project monitoring information system, which will increase the reporting of disbursements and expenditures. The integrated financial management information system is also being improved.
Regarding the Accra Agenda for Action (AAA) commitments to providing rolling three-to-five-year expendi-ture/implementation plans, progress has been limited among donors. The government is however making efforts to collect information from donors in this respect.
Capacity constraints present significant challenges to development and poverty reduction efforts and their sustainability. These relate both to aid management capacities (the ability of the government to capture, co-ordinate and utilise aid flows more effectively) and also to broader capacities for the design and implemen-tation of policies and service delivery.
Under the Paris Declaration donors committed to providing technical co-operation that is co-ordinated with partner country strategies and programmes. This approach aims to strengthen capacities while also respond-ing to the needs of partner countries. Successful capacity development is led by the partner country.
Disbursements recorded by government
in 2010
Aid scheduled by donors for disbursement
in 2010
2005 2007 2010 * For reference: Aid disbursed by donors for government
sector in 2010
For reference: % of scheduled aid
disbursements reported as disbursed by donors
in 2010 **(USD m) (USD m) (for reference) (for reference) (%) (USD m) (%)
a b c = a / b c = b / a d e = d / b e = b / dAfrican Dev. Bank 98 317 -- 18% 31% 39 12%Canada 0 2 48% 66% 0% 1 59%Denmark 24 27 22% 33% 88% 27 100%EU Institutions 47 48 34% 91% 96% 38 78%Finland 3 5 0% 12% 52% 7 74%France 41 103 26% 34% 40% 98 96%GAVI Alliance 0 22 0% -- 0% 20 94%Germany 47 75 92% 29% 63% 57 77%Global Fund 38 60 89% 42% 65% 59 99%IFAD 11 21 -- -- 53% 9 41%IMF -- -- -- -- -- --Italy 7 6 0% 2% 90% 4 62%Japan 30 68 16% 93% 44% 74 92%Korea 0 7 -- -- 2% 3 39%Netherlands 1 0 16% 75% 0% 4 0%Norway 1 2 0% 0% 79% 2 96%Spain -- -- -- -- -- --Sweden 13 33 61% 53% 41% 21 65%United Kingdom 3 90 69% 49% 3% 77 85%United Nations 59 141 13% 20% 42% 122 86%United States 1 3 94% 64% 22% 0 0%World Bank 163 277 44% 71% 59% 226 82%Average donor ratio 37% 44% 43% 67%Total 588 1 307 44% 47% 45% 888 68%
* Ratio is c=a/b except where disbursements recorded by government are greater than aid scheduled for disbursement (c=b/a). ** Ratio is e=d/b except where disbursements recorded by donors are greater than aid scheduled for disbursement (e=b/d).
tAblE 4: Are disbursements on schedule and recorded by government?
INDICATOR 4 co-ordinating support to strengthen capacity
Kenya.indd 7 09/09/12 09:59
8 Aid EffEctivEnEss 2011: ProgrEss in imPlEmEnting thE PAris dEclArAtion – volumE ii country chAPtErs
KEnyA
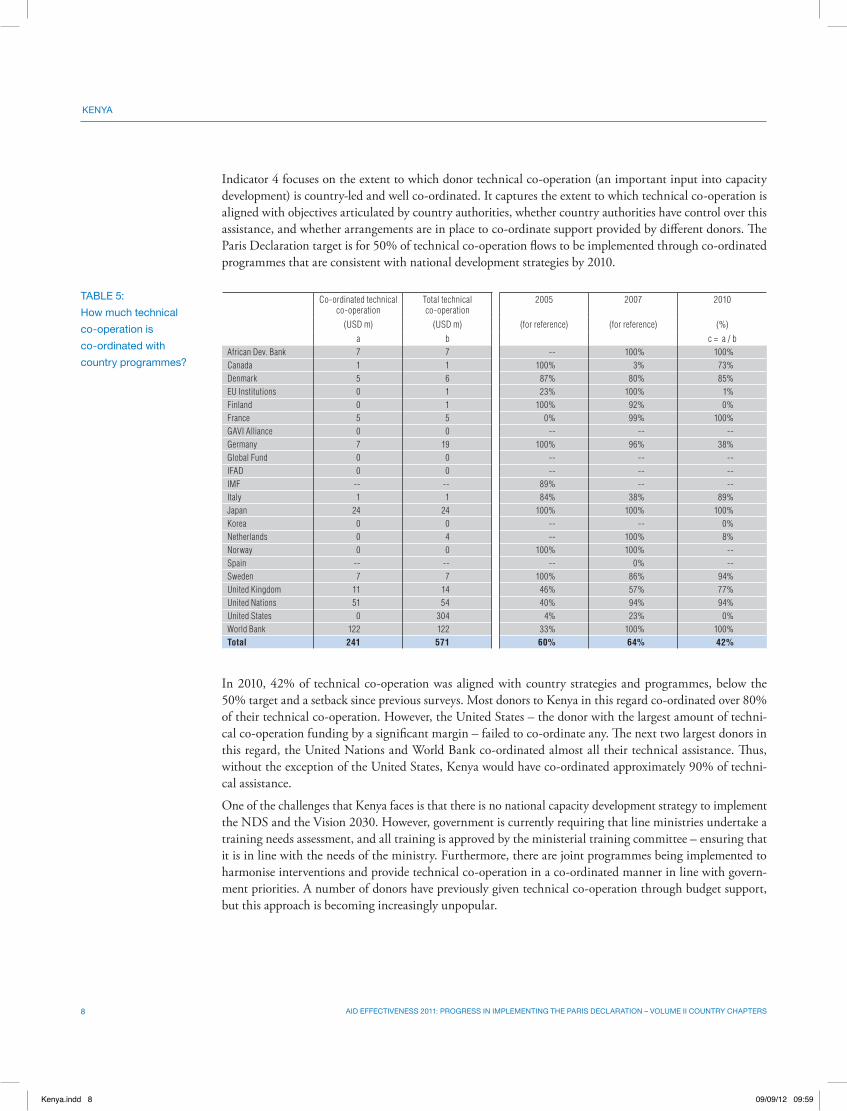
Indicator 4 focuses on the extent to which donor technical co-operation (an important input into capacity development) is country-led and well co-ordinated. It captures the extent to which technical co-operation is aligned with objectives articulated by country authorities, whether country authorities have control over this assistance, and whether arrangements are in place to co-ordinate support provided by different donors. The Paris Declaration target is for 50% of technical co-operation flows to be implemented through co-ordinated programmes that are consistent with national development strategies by 2010.
In 2010, 42% of technical co-operation was aligned with country strategies and programmes, below the 50% target and a setback since previous surveys. Most donors to Kenya in this regard co-ordinated over 80% of their technical co-operation. However, the United States – the donor with the largest amount of techni-cal co-operation funding by a significant margin – failed to co-ordinate any. The next two largest donors in this regard, the United Nations and World Bank co-ordinated almost all their technical assistance. Thus, without the exception of the United States, Kenya would have co-ordinated approximately 90% of techni-cal assistance.
One of the challenges that Kenya faces is that there is no national capacity development strategy to implement the NDS and the Vision 2030. However, government is currently requiring that line ministries undertake a training needs assessment, and all training is approved by the ministerial training committee – ensuring that it is in line with the needs of the ministry. Furthermore, there are joint programmes being implemented to harmonise interventions and provide technical co-operation in a co-ordinated manner in line with govern-ment priorities. A number of donors have previously given technical co-operation through budget support, but this approach is becoming increasingly unpopular.
Co-ordinated technical co-operation
Total technical co-operation
2005 2007 2010
(USD m) (USD m) (for reference) (for reference) (%)a b c = a / b
African Dev. Bank 7 7 -- 100% 100%Canada 1 1 100% 3% 73%Denmark 5 6 87% 80% 85%EU Institutions 0 1 23% 100% 1%Finland 0 1 100% 92% 0%France 5 5 0% 99% 100%GAVI Alliance 0 0 -- -- --Germany 7 19 100% 96% 38%Global Fund 0 0 -- -- --IFAD 0 0 -- -- --IMF -- -- 89% -- --Italy 1 1 84% 38% 89%Japan 24 24 100% 100% 100%Korea 0 0 -- -- 0%Netherlands 0 4 -- 100% 8%Norway 0 0 100% 100% --Spain -- -- -- 0% --Sweden 7 7 100% 86% 94%United Kingdom 11 14 46% 57% 77%United Nations 51 54 40% 94% 94%United States 0 304 4% 23% 0%World Bank 122 122 33% 100% 100%Total 241 571 60% 64% 42%
tAblE 5: how much technical co-operation is co-ordinated with country programmes?
Kenya.indd 8 09/09/12 09:59
9Aid EffEctivEnEss 2011: ProgrEss in imPlEmEnting thE PAris dEclArAtion – volumE ii country chAPtErs
KEnyA
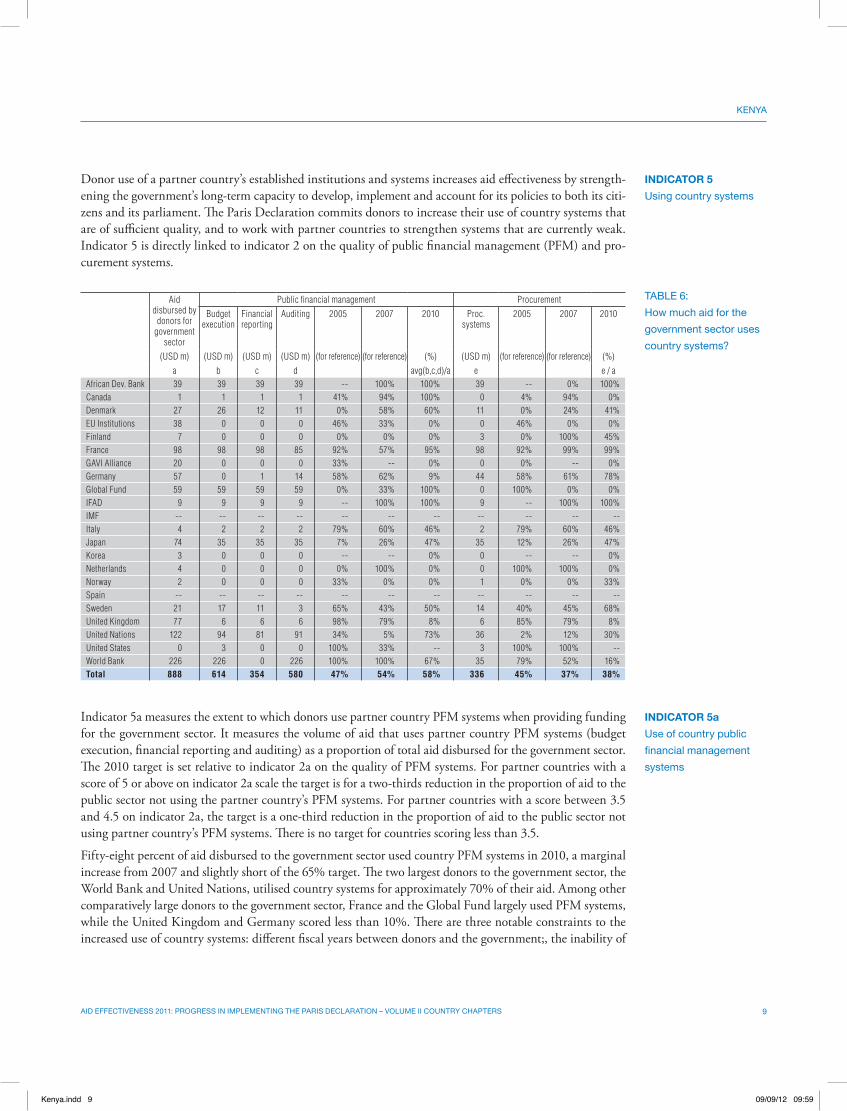
Donor use of a partner country’s established institutions and systems increases aid effectiveness by strength-ening the government’s long-term capacity to develop, implement and account for its policies to both its citi-zens and its parliament. The Paris Declaration commits donors to increase their use of country systems that are of sufficient quality, and to work with partner countries to strengthen systems that are currently weak. Indicator 5 is directly linked to indicator 2 on the quality of public financial management (PFM) and pro-curement systems.
Indicator 5a measures the extent to which donors use partner country PFM systems when providing funding for the government sector. It measures the volume of aid that uses partner country PFM systems (budget execution, financial reporting and auditing) as a proportion of total aid disbursed for the government sector. The 2010 target is set relative to indicator 2a on the quality of PFM systems. For partner countries with a score of 5 or above on indicator 2a scale the target is for a two-thirds reduction in the proportion of aid to the public sector not using the partner country’s PFM systems. For partner countries with a score between 3.5 and 4.5 on indicator 2a, the target is a one-third reduction in the proportion of aid to the public sector not using partner country’s PFM systems. There is no target for countries scoring less than 3.5.
Fifty-eight percent of aid disbursed to the government sector used country PFM systems in 2010, a marginal increase from 2007 and slightly short of the 65% target. The two largest donors to the government sector, the World Bank and United Nations, utilised country systems for approximately 70% of their aid. Among other comparatively large donors to the government sector, France and the Global Fund largely used PFM systems, while the United Kingdom and Germany scored less than 10%. There are three notable constraints to the increased use of country systems: different fiscal years between donors and the government;, the inability of
INDICATOR 5 using country systems
Aid disbursed by
donors for government
sector
Public financial management ProcurementBudget
executionFinancial reporting
Auditing 2005 2007 2010 Proc. systems
2005 2007 2010
(USD m) (USD m) (USD m) (USD m) (for reference) (for reference) (%) (USD m) (for reference) (for reference) (%)a b c d avg(b,c,d)/a e e / a
African Dev. Bank 39 39 39 39 -- 100% 100% 39 -- 0% 100%Canada 1 1 1 1 41% 94% 100% 0 4% 94% 0%Denmark 27 26 12 11 0% 58% 60% 11 0% 24% 41%EU Institutions 38 0 0 0 46% 33% 0% 0 46% 0% 0%Finland 7 0 0 0 0% 0% 0% 3 0% 100% 45%France 98 98 98 85 92% 57% 95% 98 92% 99% 99%GAVI Alliance 20 0 0 0 33% -- 0% 0 0% -- 0%Germany 57 0 1 14 58% 62% 9% 44 58% 61% 78%Global Fund 59 59 59 59 0% 33% 100% 0 100% 0% 0%IFAD 9 9 9 9 -- 100% 100% 9 -- 100% 100%IMF -- -- -- -- -- -- -- -- -- -- --Italy 4 2 2 2 79% 60% 46% 2 79% 60% 46%Japan 74 35 35 35 7% 26% 47% 35 12% 26% 47%Korea 3 0 0 0 -- -- 0% 0 -- -- 0%Netherlands 4 0 0 0 0% 100% 0% 0 100% 100% 0%Norway 2 0 0 0 33% 0% 0% 1 0% 0% 33%Spain -- -- -- -- -- -- -- -- -- -- --Sweden 21 17 11 3 65% 43% 50% 14 40% 45% 68%United Kingdom 77 6 6 6 98% 79% 8% 6 85% 79% 8%United Nations 122 94 81 91 34% 5% 73% 36 2% 12% 30%United States 0 3 0 0 100% 33% -- 3 100% 100% --World Bank 226 226 0 226 100% 100% 67% 35 79% 52% 16%Total 888 614 354 580 47% 54% 58% 336 45% 37% 38%
tAblE 6: how much aid for the government sector uses country systems?
INDICATOR 5a use of country public financial management systems
Kenya.indd 9 09/09/12 09:59
10 Aid EffEctivEnEss 2011: ProgrEss in imPlEmEnting thE PAris dEclArAtion – volumE ii country chAPtErs
KEnyA
the government to meet donor reporting requirements; and the need for the timely audit of funds. There is generally little effort among donors at the country level to implement commitments to use country systems as a first option, although dialogue has improved a great deal between donors and the government in recent years, following the Third High Level Forum in Accra.
Indicator 5b follows a similar graduated target to indicator 5a which is set relative to indicator 2b on the quality of procurement systems. For partner countries with a procurement score of “A”, a two-thirds reduc-tion in the proportion of aid for the public sector not using the country’s procurement systems and for partner countries with a procurement score of “B” to reduce the gap by one-third.
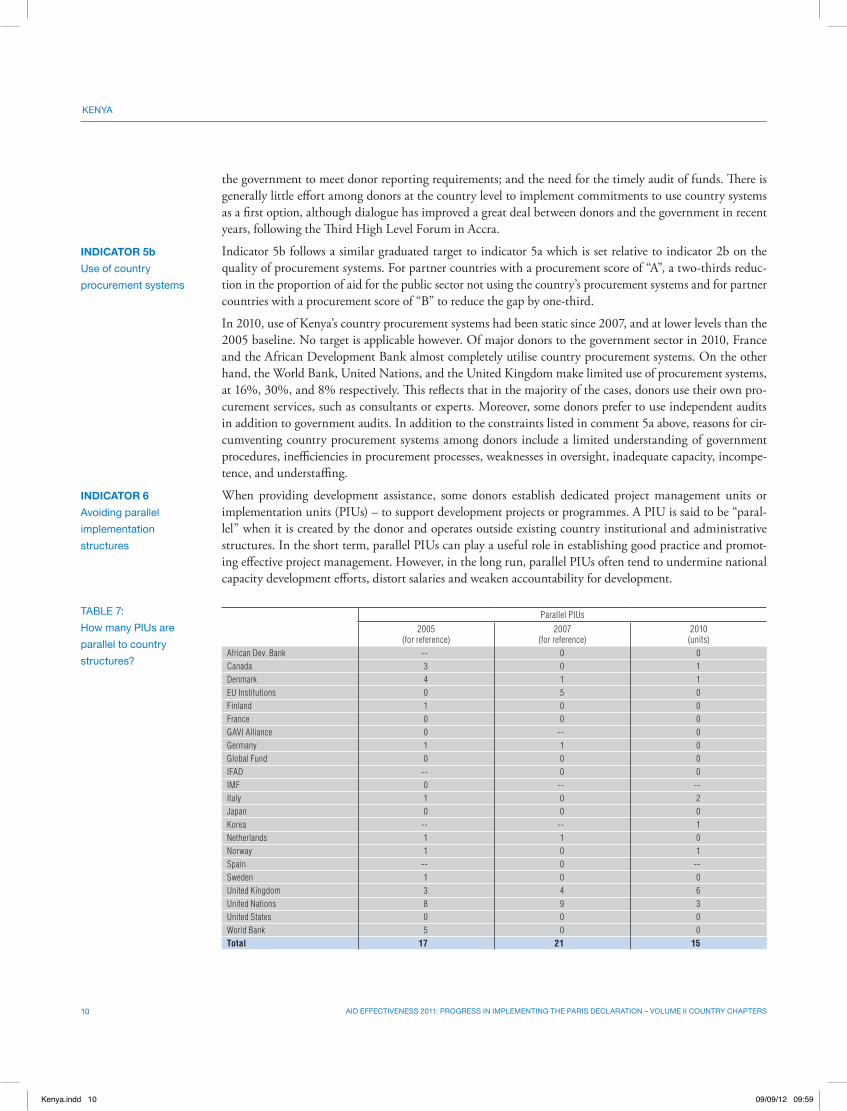
In 2010, use of Kenya’s country procurement systems had been static since 2007, and at lower levels than the 2005 baseline. No target is applicable however. Of major donors to the government sector in 2010, France and the African Development Bank almost completely utilise country procurement systems. On the other hand, the World Bank, United Nations, and the United Kingdom make limited use of procurement systems, at 16%, 30%, and 8% respectively. This reflects that in the majority of the cases, donors use their own pro-curement services, such as consultants or experts. Moreover, some donors prefer to use independent audits in addition to government audits. In addition to the constraints listed in comment 5a above, reasons for cir-cumventing country procurement systems among donors include a limited understanding of government procedures, inefficiencies in procurement processes, weaknesses in oversight, inadequate capacity, incompe-tence, and understaffing.
When providing development assistance, some donors establish dedicated project management units or imple mentation units (PIUs) – to support develop ment projects or programmes. A PIU is said to be “paral-lel” when it is created by the donor and operates outside existing country institutional and administrative structures. In the short term, parallel PIUs can play a useful role in establishing good prac tice and promot-ing effective project management. However, in the long run, parallel PIUs often tend to undermine na tional capacity development efforts, distort salaries and weaken accountability for development.
INDICATOR 5b use of country procurement systems
INDICATOR 6 Avoiding parallel implementation structures
Parallel PIUs2005
(for reference)2007
(for reference)2010
(units)African Dev. Bank -- 0 0Canada 3 0 1Denmark 4 1 1EU Institutions 0 5 0Finland 1 0 0France 0 0 0GAVI Alliance 0 -- 0Germany 1 1 0Global Fund 0 0 0IFAD -- 0 0IMF 0 -- --Italy 1 0 2Japan 0 0 0Korea -- -- 1Netherlands 1 1 0Norway 1 0 1Spain -- 0 --Sweden 1 0 0United Kingdom 3 4 6United Nations 8 9 3United States 0 0 0World Bank 5 0 0Total 17 21 15
tAblE 7: how many Pius are parallel to country structures?
Kenya.indd 10 09/09/12 09:59
11Aid EffEctivEnEss 2011: ProgrEss in imPlEmEnting thE PAris dEclArAtion – volumE ii country chAPtErs
KEnyA
To make aid more effective, the Paris Declaration encourages donors to “avoid, to the maximum extent pos-sible, creating dedicated structures for day-to-day management and imple mentation of aid-financed projects and programmes.” Indicator 6 counts the number of parallel PIUs being used in partner countries. The target is to reduce by two-thirds the number of parallel PIUs in each partner country between 2005 and 2010.
The number of parallel PIUs in operation has declined since previous surveys, although it is still short of the 2010 target. Of the seven donors who operated any parallel PIUs in 2010, only three registered more than one parallel PIU – the United Kingdom (six), United Nations (three) and Italy (two). Donors and government are taking steps to reduce the number of parallel PIUs, such as appointing project managers/co-ordinators from the civil service, using existing structures to implement projects, and rebalancing salary structures to avoid the draining of capacity. The government, together with donors, is focusing on capacity building within government agencies to discourage top-up allowances for civil servants implementing projects/programmes.
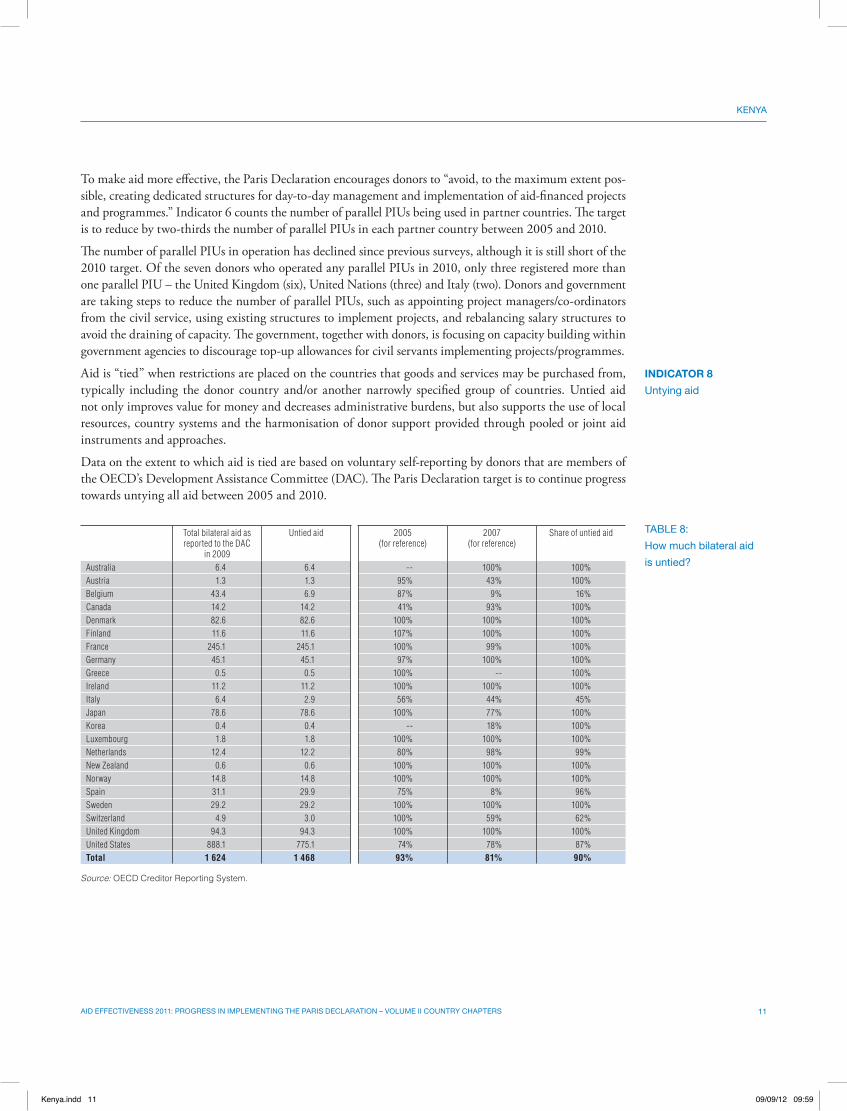
Aid is “tied” when restrictions are placed on the countries that goods and services may be purchased from, typically including the donor country and/or another narrowly specified group of countries. Untied aid not only improves value for money and decreases administrative burdens, but also supports the use of local resources, country systems and the harmonisation of donor support provided through pooled or joint aid instruments and approaches.
Data on the extent to which aid is tied are based on voluntary self-reporting by donors that are members of the OECD’s Development Assistance Committee (DAC). The Paris Declaration target is to continue progress towards untying all aid between 2005 and 2010.
INDICATOR 8 untying aid
Total bilateral aid as reported to the DAC
in 2009
Untied aid 2005 (for reference)
2007 (for reference)
Share of untied aid
Australia 6.4 6.4 -- 100% 100%Austria 1.3 1.3 95% 43% 100%Belgium 43.4 6.9 87% 9% 16%Canada 14.2 14.2 41% 93% 100%Denmark 82.6 82.6 100% 100% 100%Finland 11.6 11.6 107% 100% 100%France 245.1 245.1 100% 99% 100%Germany 45.1 45.1 97% 100% 100%Greece 0.5 0.5 100% -- 100%Ireland 11.2 11.2 100% 100% 100%Italy 6.4 2.9 56% 44% 45%Japan 78.6 78.6 100% 77% 100%Korea 0.4 0.4 -- 18% 100%Luxembourg 1.8 1.8 100% 100% 100%Netherlands 12.4 12.2 80% 98% 99%New Zealand 0.6 0.6 100% 100% 100%Norway 14.8 14.8 100% 100% 100%Spain 31.1 29.9 75% 8% 96%Sweden 29.2 29.2 100% 100% 100%Switzerland 4.9 3.0 100% 59% 62%United Kingdom 94.3 94.3 100% 100% 100%United States 888.1 775.1 74% 78% 87%Total 1 624 1 468 93% 81% 90%
Source: OECD Creditor Reporting System.
tAblE 8: how much bilateral aid is untied?
Kenya.indd 11 09/09/12 09:59
12 Aid EffEctivEnEss 2011: ProgrEss in imPlEmEnting thE PAris dEclArAtion – volumE ii country chAPtErs
KEnyA
The proportion of untied aid to Kenya in 2010 was approximately the same as in 2005 (despite increasing since 2007), falling below the 2010 target. The majority of donors to Kenya untied all their aid, with the notable exception of the United States at 87% (the largest bilateral donor by a significant margin), Switzerland (62%), Italy (45%) and Belgium (16%).
Currently, the government is developing an operation guide which will spell out all the conditions and pro-cedures linked to disbursements in order to make public all conditions set by donors. n
hArmonisAtionPoor co-ordinAtion of Aid increases the cost to both donors and partner countries and significantly reduces the real value of aid. Harmonisation of aid delivery procedures and the adoption of common arrangements help reduce duplication of effort and lower the transaction costs associated with aid management. The Paris Declaration focuses on two dimensions of aid as a proxy for assessing overall harmonisation: the use of common arrangements within programme-based approaches (PBAs) and the extent to which donors and partner countries conduct joint missions and co-ordinate analytic work.
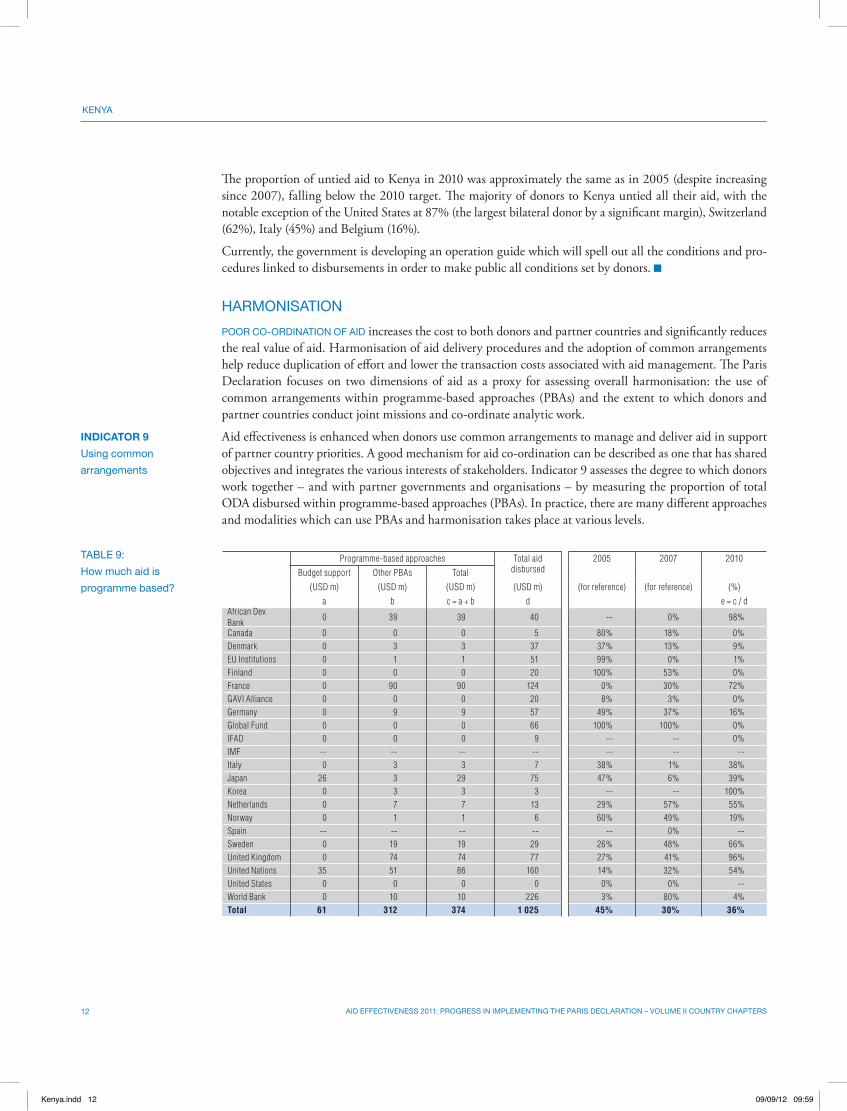
Aid effectiveness is enhanced when donors use common arrangements to manage and deliver aid in support of partner country priorities. A good mechanism for aid co-ordination can be described as one that has shared objectives and integrates the various interests of stakeholders. Indicator 9 assesses the degree to which donors work together – and with partner governments and organisations – by measuring the proportion of total ODA disbursed within programme-based approaches (PBAs). In practice, there are many different approaches and modalities which can use PBAs and harmonisation takes place at various levels.
INDICATOR 9 using common arrangements
Programme-based approaches Total aid disbursed
2005 2007 2010Budget support Other PBAs Total
(USD m) (USD m) (USD m) (USD m) (for reference) (for reference) (%)a b c = a + b d e = c / d
African Dev. Bank
0 39 39 40 -- 0% 98%
Canada 0 0 0 5 80% 18% 0%Denmark 0 3 3 37 37% 13% 9%EU Institutions 0 1 1 51 99% 0% 1%Finland 0 0 0 20 100% 53% 0%France 0 90 90 124 0% 30% 72%GAVI Alliance 0 0 0 20 8% 3% 0%Germany 0 9 9 57 49% 37% 16%Global Fund 0 0 0 66 100% 100% 0%IFAD 0 0 0 9 -- -- 0%IMF -- -- -- -- -- -- --Italy 0 3 3 7 38% 1% 38%Japan 26 3 29 75 47% 6% 39%Korea 0 3 3 3 -- -- 100%Netherlands 0 7 7 13 29% 57% 55%Norway 0 1 1 6 60% 49% 19%Spain -- -- -- -- -- 0% --Sweden 0 19 19 29 26% 48% 66%United Kingdom 0 74 74 77 27% 41% 96%United Nations 35 51 86 160 14% 32% 54%United States 0 0 0 0 0% 0% --World Bank 0 10 10 226 3% 80% 4%Total 61 312 374 1 025 45% 30% 36%
tAblE 9: how much aid is programme based?
Kenya.indd 12 09/09/12 09:59
13Aid EffEctivEnEss 2011: ProgrEss in imPlEmEnting thE PAris dEclArAtion – volumE ii country chAPtErs
KEnyA
At one level, the partner country is responsible for defining clear, country-owned programmes (e.g. a sector programme or strategy) and establishing a single budgetary framework that captures all resources (both domestic and external). At another level, donors are responsible for taking steps to use local systems for pro-gramme design and implementation, financial management, monitoring and evaluation. Finally, partner countries and donors are jointly responsible for donor co-ordination and harmonisation of donor procedures. The 2010 target is that two-thirds of aid flows are provided in the context of PBAs.
The proportion of aid using programme-based approaches declined between 2005 and 2007 but improved in the 2011 Survey. However, the 2010 figure of 36% remains short of the 56% target. Of major donors to Kenya in this regard, the United Kingdom scored highest at 96%, followed by France (72%), while the United States and World Bank – the two largest donors by a considerable margin – almost completely avoided programme-based approaches. Overall, budget support constitutes a small proportion of PBAs. Challenges in channelling a greater proportion of aid through programme-based approaches include donors preferring to avoid the financial management and reporting procedures of the fund administrator, and the risk of mis-management of funds by government. However, Kenya is taking a lead in promoting the development of PBAs. The government encour-ages the use of PBAs and sector-wide approaches (SWAps), which are being continuously developed to reduce transaction costs to the government. Even though these approaches are encouraged by the government, donors are sceptical, due to lack of confidence and mistrust in governance capabilities.
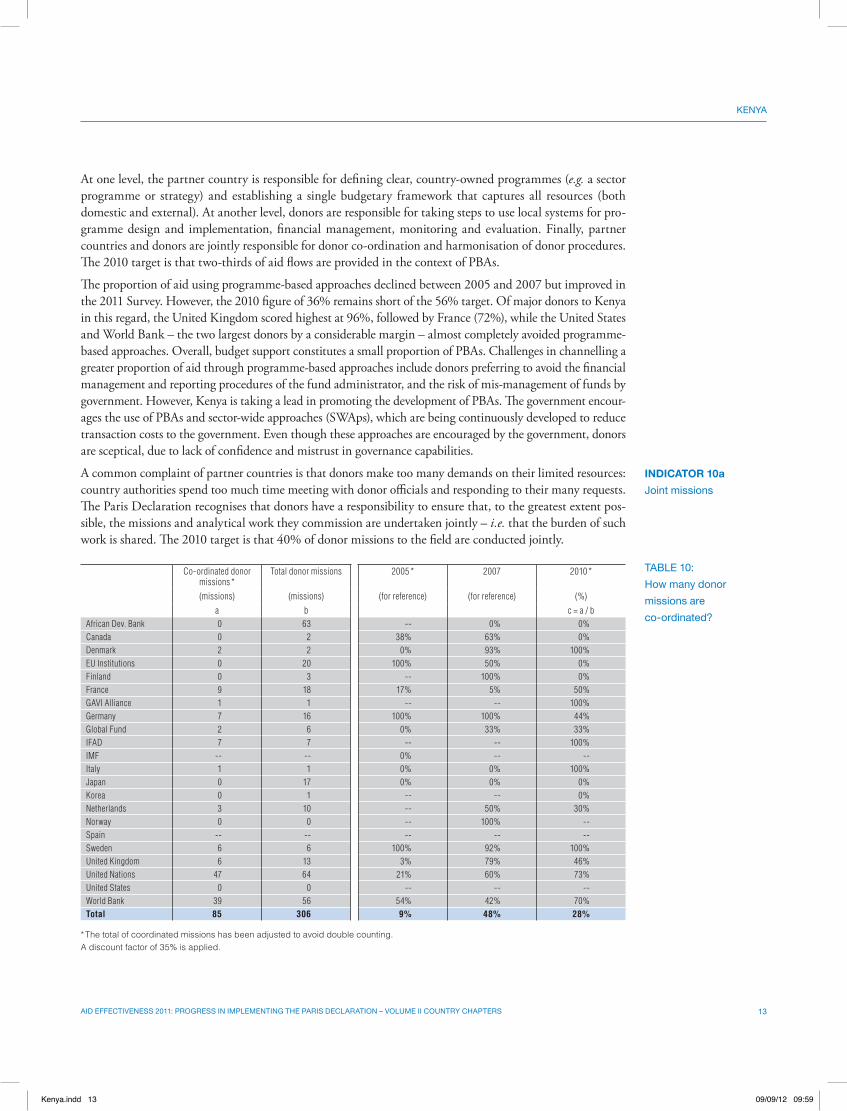
A common complaint of partner countries is that donors make too many demands on their limited resources: country authorities spend too much time meeting with donor officials and responding to their many requests. The Paris Declaration recognises that donors have a responsibility to ensure that, to the greatest extent pos-sible, the missions and analytical work they commission are undertaken jointly – i.e. that the burden of such work is shared. The 2010 target is that 40% of donor missions to the field are conducted jointly.
INDICATOR 10a Joint missions
Co-ordinated donor missions *
Total donor missions 2005 * 2007 2010 *
(missions) (missions) (for reference) (for reference) (%)a b c = a / b
African Dev. Bank 0 63 -- 0% 0%Canada 0 2 38% 63% 0%Denmark 2 2 0% 93% 100%EU Institutions 0 20 100% 50% 0%Finland 0 3 -- 100% 0%France 9 18 17% 5% 50%GAVI Alliance 1 1 -- -- 100%Germany 7 16 100% 100% 44%Global Fund 2 6 0% 33% 33%IFAD 7 7 -- -- 100%IMF -- -- 0% -- --Italy 1 1 0% 0% 100%Japan 0 17 0% 0% 0%Korea 0 1 -- -- 0%Netherlands 3 10 -- 50% 30%Norway 0 0 -- 100% --Spain -- -- -- -- --Sweden 6 6 100% 92% 100%United Kingdom 6 13 3% 79% 46%United Nations 47 64 21% 60% 73%United States 0 0 -- -- --World Bank 39 56 54% 42% 70%Total 85 306 9% 48% 28%
* The total of coordinated missions has been adjusted to avoid double counting.A discount factor of 35% is applied.
tAblE 10: how many donor missions are co-ordinated?
Kenya.indd 13 09/09/12 09:59
14 Aid EffEctivEnEss 2011: ProgrEss in imPlEmEnting thE PAris dEclArAtion – volumE ii country chAPtErs
KEnyA
Only 28% of donor missions to Kenya were co-ordinated in 2010, falling below the target. Of donors who ran a significant number of missions in 2010, The World Bank and United Nations conducted approximately 70% jointly. On the other hand the African Development Bank and EU Institutions failed to jointly conduct any of their missions. For its part, the Government of Kenya encourages joint missions, but calls for more organi-sation on the side of donors in order to create positive progress on this indicator. The government, however, is proposing a “quiet period” in which no missions will be accepted. Notably, the UN Resident Co-ordinator’s office, together with government, plans to conduct a study to detail how donor and government time is spent hosting single missions.
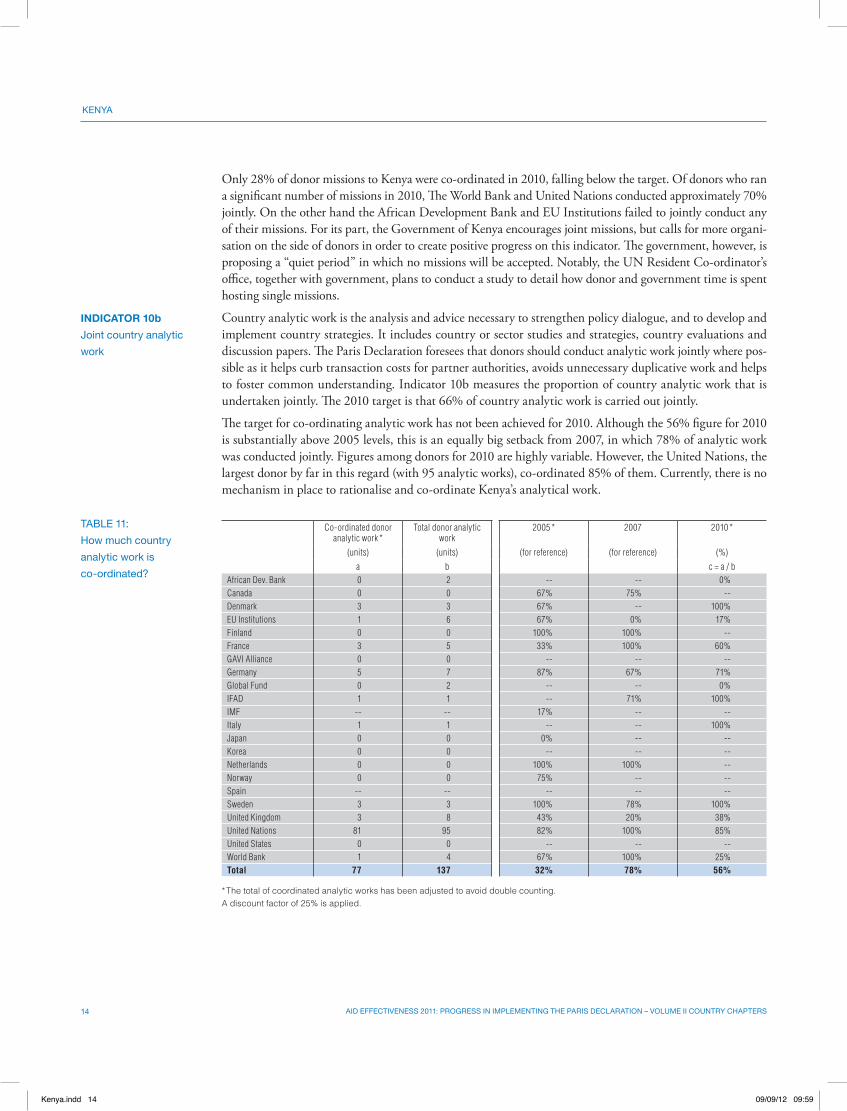
Country analytic work is the analysis and advice necessary to strengthen policy dialogue, and to develop and implement country strategies. It includes country or sector studies and strategies, country evaluations and discussion papers. The Paris Declaration foresees that donors should conduct analytic work jointly where pos-sible as it helps curb transaction costs for partner authorities, avoids unnecessary duplicative work and helps to foster common understanding. Indicator 10b measures the proportion of country analytic work that is undertaken jointly. The 2010 target is that 66% of country analytic work is carried out jointly.
The target for co-ordinating analytic work has not been achieved for 2010. Although the 56% figure for 2010 is substantially above 2005 levels, this is an equally big setback from 2007, in which 78% of analytic work was conducted jointly. Figures among donors for 2010 are highly variable. However, the United Nations, the largest donor by far in this regard (with 95 analytic works), co-ordinated 85% of them. Currently, there is no mechanism in place to rationalise and co-ordinate Kenya’s analytical work.
INDICATOR 10b Joint country analytic work
Co-ordinated donor analytic work *
Total donor analytic work
2005 * 2007 2010 *
(units) (units) (for reference) (for reference) (%)a b c = a / b
African Dev. Bank 0 2 -- -- 0%Canada 0 0 67% 75% --Denmark 3 3 67% -- 100%EU Institutions 1 6 67% 0% 17%Finland 0 0 100% 100% --France 3 5 33% 100% 60%GAVI Alliance 0 0 -- -- --Germany 5 7 87% 67% 71%Global Fund 0 2 -- -- 0%IFAD 1 1 -- 71% 100%IMF -- -- 17% -- --Italy 1 1 -- -- 100%Japan 0 0 0% -- --Korea 0 0 -- -- --Netherlands 0 0 100% 100% --Norway 0 0 75% -- --Spain -- -- -- -- --Sweden 3 3 100% 78% 100%United Kingdom 3 8 43% 20% 38%United Nations 81 95 82% 100% 85%United States 0 0 -- -- --World Bank 1 4 67% 100% 25%Total 77 137 32% 78% 56%
* The total of coordinated analytic works has been adjusted to avoid double counting.A discount factor of 25% is applied.
tAblE 11: how much country analytic work is co-ordinated?
Kenya.indd 14 09/09/12 09:59
15Aid EffEctivEnEss 2011: ProgrEss in imPlEmEnting thE PAris dEclArAtion – volumE ii country chAPtErs
KEnyA
Aid frAgmEntAtion
Fragmented aid – aid that comes in many small slices from a large number of donors – creates high trans-action costs and makes it difficult for partner countries effectively to manage their own development. Aid fragmentation also increases the risk of duplication and inefficient aid allocation among donors. According to a pilot study undertaken by the OECD and GIZ between 2005-09, aid fragmentation within sectors in Kenya is increasing. In general terms, fragmentation increased from 13.9 donors per sector (2005) to 19.0 (2009). In 2009, 23 donors provided altogether less than 10% of all aid to Kenya and an average donor pro-vided USD 41 million (OECD, 2011b). Fragmentation increased in every sector, with the exception of general budget support and the multi sector, where fragmentation remained stable. n
mAnAging for rEsultsboth donors And PArtnEr countriEs should manage resources according to well-defined, desired results, measuring progress toward them and using information on results to improve decision making and perfor-mance. Achieving this implies strengthening capacity to undertake such management and emphasising a focus on results. Countries are expected to develop cost-effective and results-oriented reporting and performance assessment frameworks, while donors commit to use them and refrain from requiring separate reporting.
Indicator 11 assesses the quality of a country’s results-oriented frameworks. In particular, it considers the quality of the information generated, stakeholder access to information, and the extent to which the informa-tion is utilised within a country level monitoring and evaluation system. The government provides evidence against these criteria through the survey, and this is translated by the World Bank into a score running from A (highest score) to E (lowest score).
The Paris Declaration 2010 global target is to reduce the proportion of countries without transparent and monitorable performance assessment frameworks by one-third.
In 2010 Kenya was assessed a B score regarding the quality of its results-oriented framework meeting the 2010 target, and an improvement from 2007. A monitoring and evaluation (M&E) framework for the NDS has been developed and clear institutional responsibilities and structures outlined. The plan contains a listing of the overall goals, objectives, expected outcomes, and implementing agencies, as well as the indicative budget. The “National Reporting Framework of Indicators: The Vision 2030 First Medium-Term Plan”, aims to enhance managerial productivity by providing an easy reference to the key national socioeconomic and governance per-formance indicators, projects, and sub-national performance indicators for district constituencies.
The Ministry of State for Planning, National Development and Vision 2030 has established Central Planning and Project Monitoring Units in all ministries and government departments. The units are responsible for data collection, analysis and reporting on progress made in implementing the NDS. They also report on the pro-gress of implementation of the overall Kenya Vision 2030 flagship projects and other programmes on a quar-terly and annual basis. However, access to stakeholder information needs improvement, specifically regarding access to public expenditure data. Currently, little data is being disaggregated by sex and systematically ana-lysed. Moreover, only limited data is made available to the public, and only a few donors are supporting the development of national capacities for the collection, analysis, and dissemination of sex-disaggregated data.
Monitoring and evaluation reports are generated on a quarterly and annual basis and are accessible online and in hardcopy. The M&E framework traces progress of 48 national monitoring indicators from the longterm vision and NDS. M&E reports are then used to design and redesign programmes and projects. They are also used in the budgeting process to guide resource allocation. The office of the Prime Minister has overall super-visory role over line ministries in terms project implementation. There is also an M&E Directorate in the Ministry of Planning, National Development and Vision 2030 with a mandate to oversee M&E activities in
INDICATOR 11 do countries have results-oriented frameworks?
Kenya.indd 15 09/09/12 09:59
16 Aid EffEctivEnEss 2011: ProgrEss in imPlEmEnting thE PAris dEclArAtion – volumE ii country chAPtErs
KEnyA
the implementation of the NDS as well as Vision 2030. Monitoring and evaluation is undertaken compre-hensively in all sectors and with a national coverage. n
mutuAl AccountAbilitystrong And bAlAncEd mEchAnisms that support accountability are required at all levels for aid to be most effective. Donors and partner country governments should be accountable to their respective publics and to each other for implementing their commitments on aid, its effectiveness, and the results to which it contributes.
Indicator 12 examines whether there is a country-level mechanism for mutual assessment of progress on partnership commitments, including on aid effectiveness. There are three criteria that must all be met: the existence of an aid policy or strategy agreed between the partner country government and donors; specific country-level aid effectiveness targets for both the partner country government and donors; an assessment towards these targets undertaken by both partner and donors in the last two years, and discussed in a forum for broad-based dialogue.
The 2010 target is for all partner countries to have mutual assessment reviews meeting these criteria in place. However, there is currently no framework for mutual accountability between Kenya and donors. An aid policy between the government and donors is nevertheless being formulated, with broad agreement on priorities.
In 2010, the government and donors initiated the process of developing a mutual accountability framework (MAF) and practical indicators in the short term were agreed upon; additional indicators will be included as donors review their own policies. This was completed in June 2011 and implementation is underway. In terms of mutual accountability for gender equality and women’s empowerment, there has been partial pro-gress. This is partly due to the focus on indicators included in the performance assessment f framework. There is no separate mechanism for a more comprehensive assessment in relation to the National Plan for the Advancement of Women. Moreover, the mechanism for involvement of gender focal points is not yet clearly defined, particularly at sector level. n
notEsThe quantitative information presented in this chapter is taken from data provided by national co-ordinators up to 31 July 2011, following the data validation process with stakeholders at the country level. It was not possible to modify or correct any data received after this date.
This document and any map included herein are without prejudice to the status of or sovereignty over any terri-tory, to the delimitation of international frontiers and boundaries and to the name of any territory, city or area.
INDICATOR 12mutual accountability
Kenya.indd 16 09/09/12 09:59
17Aid EffEctivEnEss 2011: ProgrEss in imPlEmEnting thE PAris dEclArAtion – volumE ii country chAPtErs
KEnyA
rEfErEncEsKenya National Bureau of Statistics (2011). Available at www.knbs.or.ke, accessed 23 May 2011
OECD (2011a), DAC Statistics, http://stats.oecd.org/Index.aspx.
OECD (2011b), Country aid fragmentation tables. Pilot analysis of aid fragmentation at the partner country level drawing on evidence sourced from the OECD-DAC Creditor Reporting System. WP-EFF Task Team on Division of Labour and Complementarity, OECD, Paris.
OECD (forthcoming), OECD Report on Division of Labour: Addressing Cross-country Fragmentation of Aid www.oecd.org/document/46/0,3746,en_2649_33721_46022446_1_1_1_1,00.html
World Development Indicators, The World Bank Group, 2011. Available at http://data.worldbank.org/indicator, accessed 23 May 2011
Kenya.indd 17 09/09/12 09:59

Kenya.indd 18 09/09/12 09:59