Embed Size (px)
Citation preview
1
Part IC. Descriptive Statistics
Multivariate Statistics ( 多變量統計 )
Focus: Multiple Regression ( 多元迴歸、複迴歸 )
Spring 2007
2
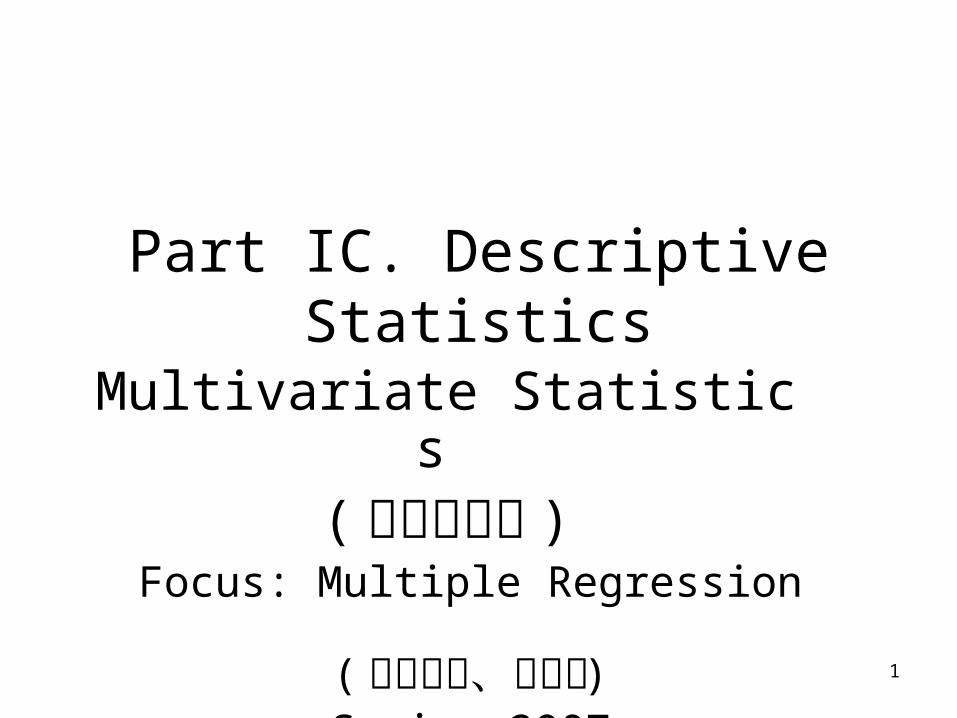
Multiple Regression
• Multiple regression: contains two or more independent variables ( 研究兩個或兩個以上自變數對依變數的影響 )– Why? Remember that human behavior or social phen
omena are complicated and multivariate.– Explanation and prediction done by multiple regressio
n: more “accurate”
• In terms of analysis, multiple regression can be seen as the extension of simple regression ( 複迴歸分析方法基本上是簡單迴歸分析的延伸 )
3
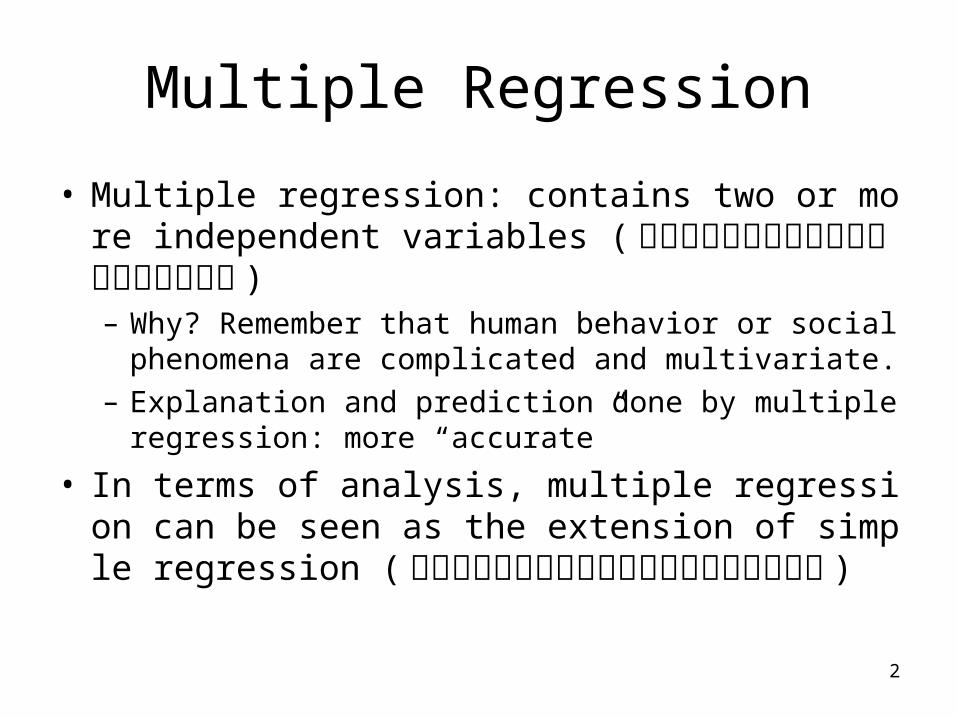
Multiple Regression Model: start from two independent variables
• Equation: yi = a+ b1x1 + b2x2 + εi
4
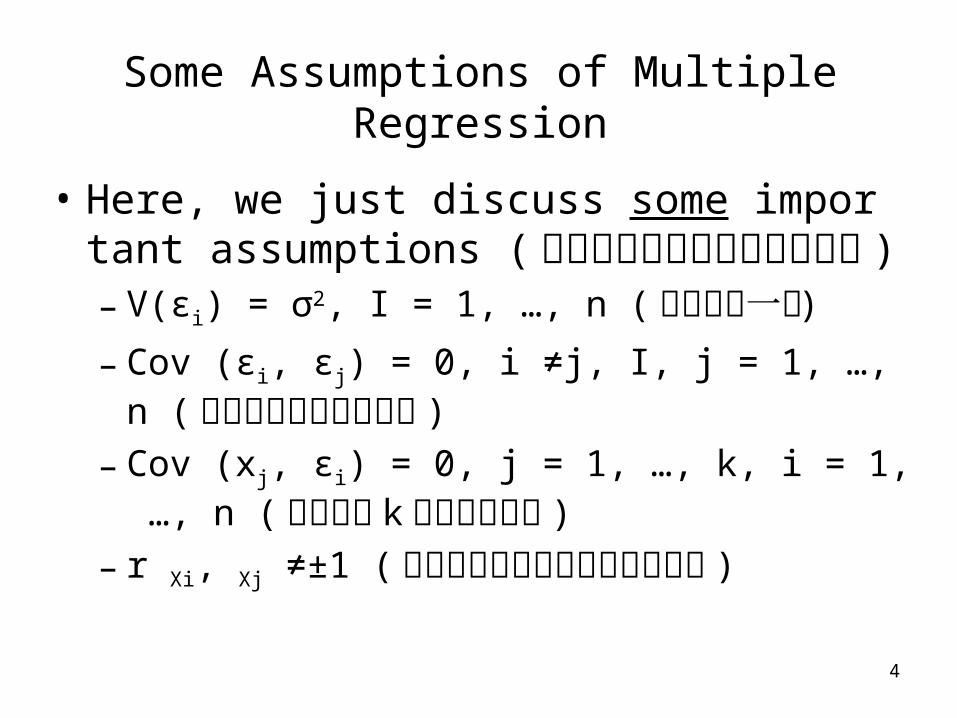
Some Assumptions of Multiple Regression
• Here, we just discuss some important assumptions ( 只討論部分複迴歸模型的假設 )– V(εi) = σ2, I = 1, …, n ( 變異數齊一性 )
– Cov (εi, εj) = 0, i ≠j, I, j = 1, …, n ( 任何兩組誤差項不相關 )
– Cov (xj, εi) = 0, j = 1, …, k, i = 1, …, n ( 誤差項與 k 個自變數無關 )
– r Xi, Xj ≠±1 ( 自變數彼此間無完全的線性關係 )
5
Multiple regression estimation
• Follow the same idea of simple regression: minimize SSE ( 估計值與觀察值差的平方和要最小 )
• But here, we don’t usually use ordinary least squares (OLS) method.
• Instead, we use Maximum Likelihood Estimator ( 通常不用 OLS ,用最大概似估計式 )
• MLE: widely used in regression estimation, difficult to compute by hand, often get MLE by computer
6
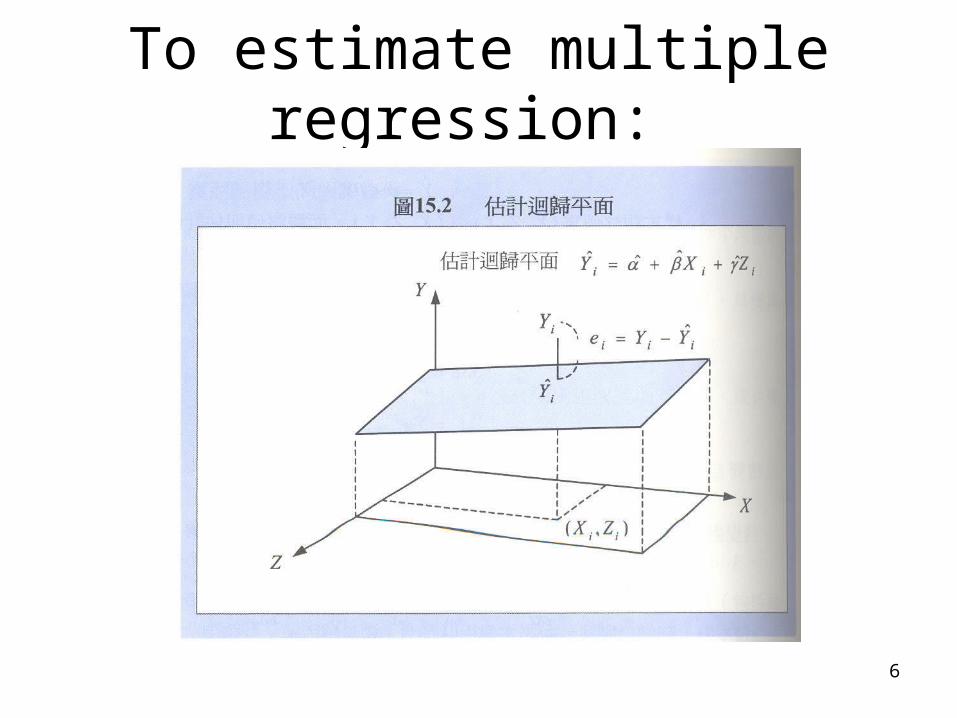
To estimate multiple regression:
7
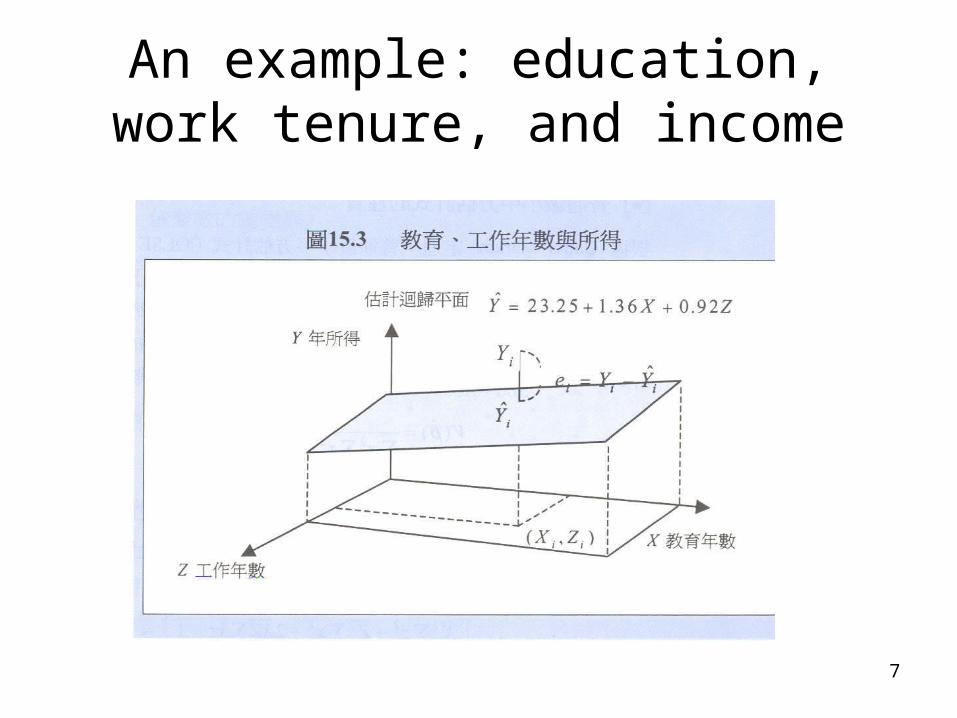
An example: education, work tenure, and income
8
Inference for multiple regression
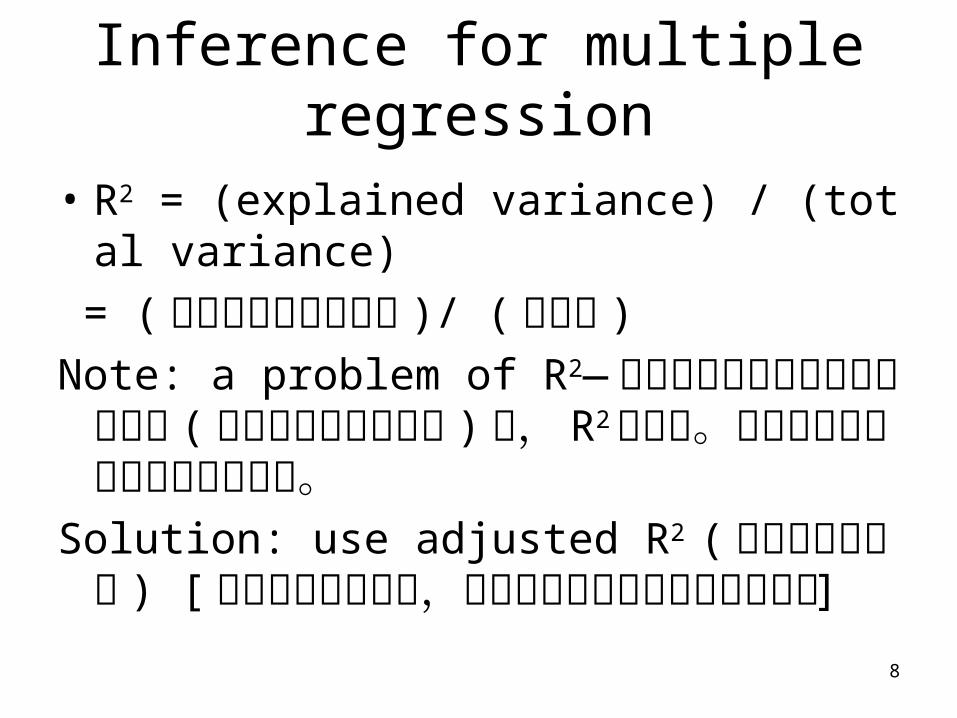
• R2 = (explained variance) / (total variance)
= ( 可被迴歸解釋的變異 )/ ( 總變異 )
Note: a problem of R2— 若在複迴歸公式不斷加入自變數 ( 有些可能與模型無關 ) 時, R2
會提高。如此會誤導迴歸公式的解釋能力。Solution: use adjusted R2 ( 調整的判定係數 )
[ 經過自由度的調整,即調整任意增加不相關的自變數 ]
9
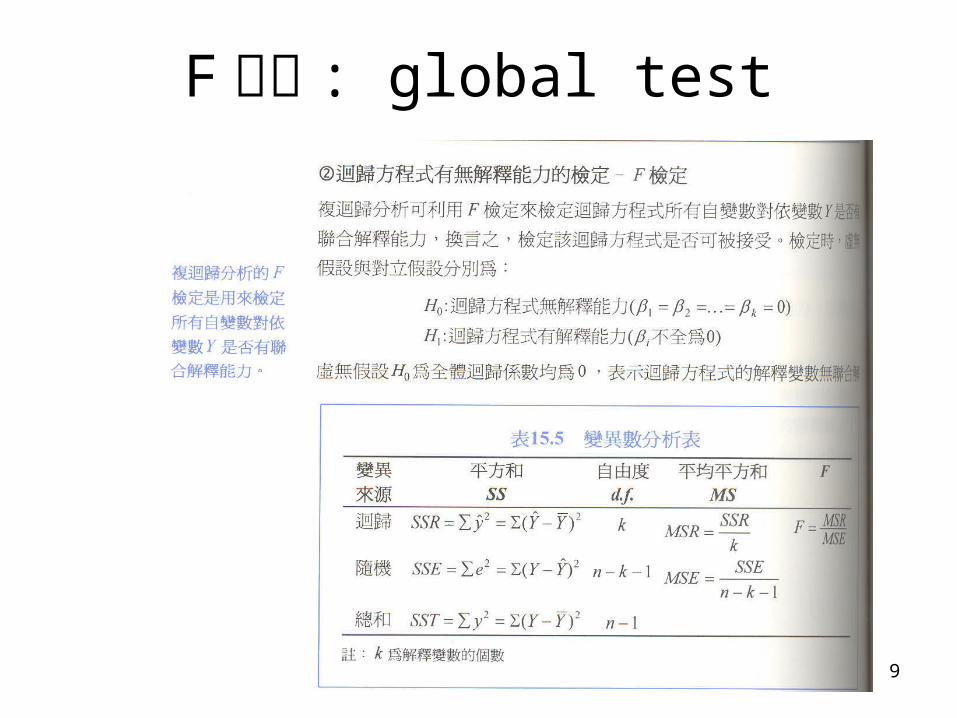
F 檢定 : global test
10
Individual regression coefficients: variance, confidence interval ( 個別
迴歸參數的檢定與信賴區間 )
• Follow the same idea of simple regression
• We usually rely on computer computation, ex: look at SPSS output.
• Interpretation of regression coefficients:
記得 : 現在有二個以上的變數,解釋時要加上:當某變數固定時,另一變數…
11
Question: Which variable in the multiple regression model can
explain more?
如何比較各自變數對依變數解釋上的相對重要性?
12
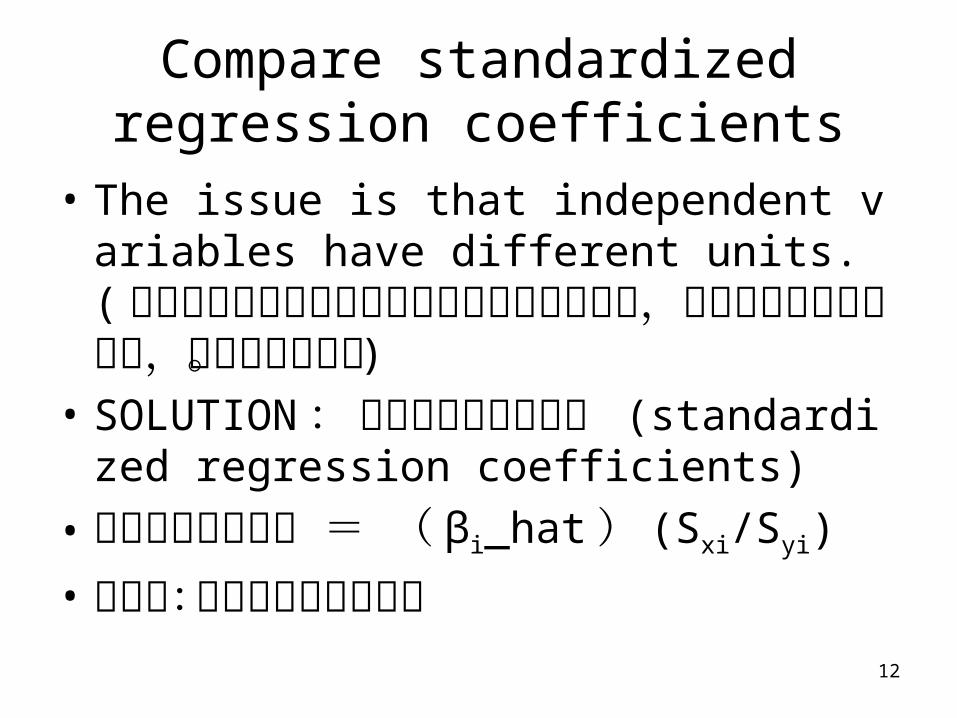
Compare standardized regression coefficients
• The issue is that independent variables have different units. ( 比較各自變數對依變數解釋上的相對重要性時,因各自變數的單位不同,不能直接比較。 )
• SOLUTION : 用標準化的迴歸係數 (standardized regression coefficients)
• 標準化的迴歸係數 = ( βi_hat ) (Sxi/Syi)
• 標準化:去除單位不同的影響
13
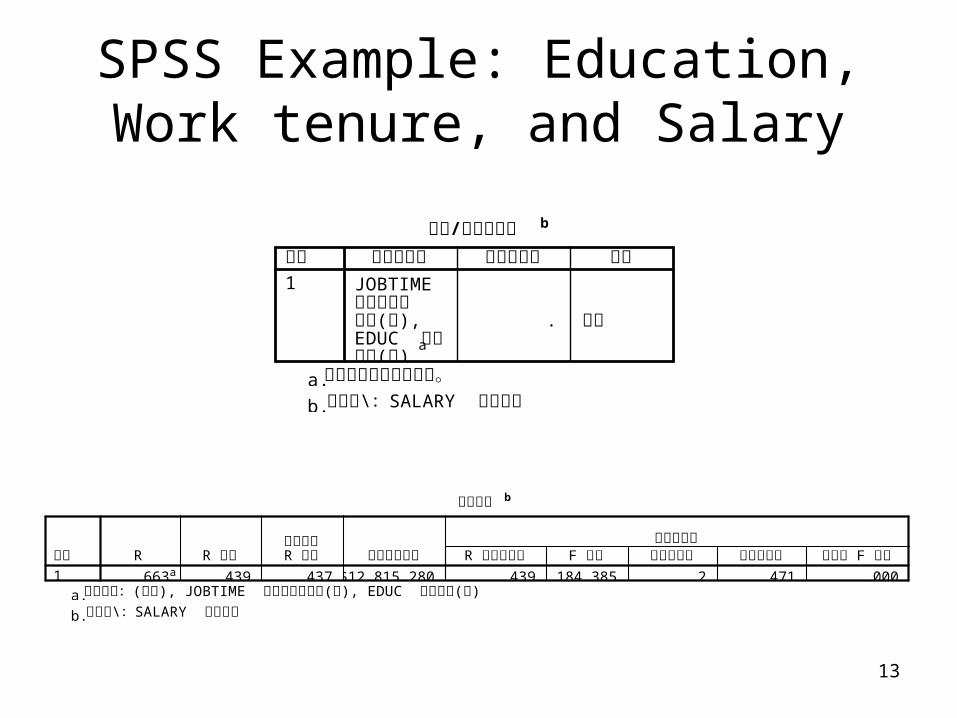
SPSS Example: Education, Work tenure, and Salary
/選入 刪除的變數b
JOBTIME 在本公司的
( ),年資 月EDUC 教育
( )程度 年a
. 選入
模式1
選入的變數 刪除的變數 方法
所有要求的變數已輸入。a. \ SALARY 依變數 : 目前薪資b.
模式摘要b
.663a .439 .437 $12,815.280 .439 184.385 2 471 .000模式1
R R 平方調過後的R 平方 估計的標準誤 R 平方改變量 F 改變 分子自由度 分母自由度 F 顯著性 改變
變更統計量
( ), JOBTIME ( ), EDUC ( )預測變數: 常數 在本公司的年資 月 教育程度 年a. \ SALARY 依變數 : 目前薪資b.
14
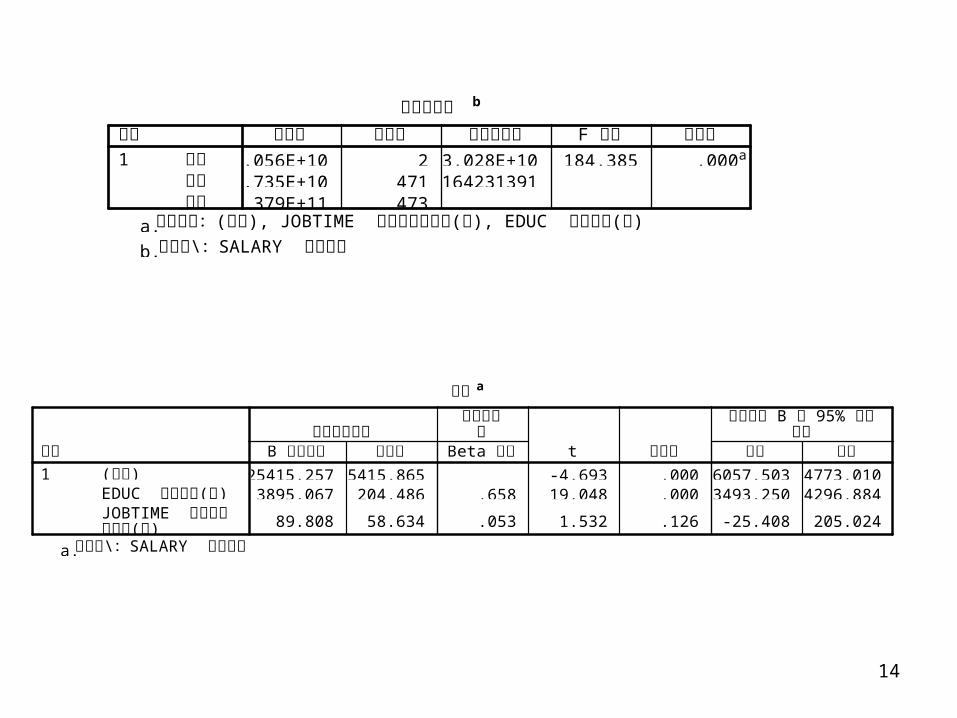
變異數分析b
6.056E+10 2 3.028E+10 184.385 .000a
7.735E+10 471 1642313911.379E+11 473
迴歸殘差總和
模式1
平方和 自由度 平均平方和 F 檢定 顯著性
( ), JOBTIME ( ), EDUC ( )預測變數: 常數 在本公司的年資 月 教育程度 年a. \ SALARY 依變數 : 目前薪資b.
係數a
-25415.257 5415.865 -4.693 .000-36057.503-14773.0103895.067 204.486 .658 19.048 .000 3493.250 4296.884
89.808 58.634 .053 1.532 .126 -25.408 205.024
( )常數EDUC ( )教育程度 年JOBTIME 在本公司
( )的年資 月
模式1
B 之估計值 標準誤未標準化係數
Beta 分配
標準化係數
t 顯著性 下限 上限
B 95% 迴歸係數 的 信賴區間
\ SALARY 依變數 : 目前薪資a.
15
Dummy Variables ( 虛擬變數 )
• Question: Can I include qualitative (or categorical) variables in the regression model? 〔能將質的變數(或類別變數)放在迴歸模型裏嗎?〕
• Answer: Yes, you can include qualitative variables in the regression model, but you have to transform those variables into dummy variables. ( 質的變數可以放在迴歸模型內,但需轉成虛擬變數的形式。 )
16
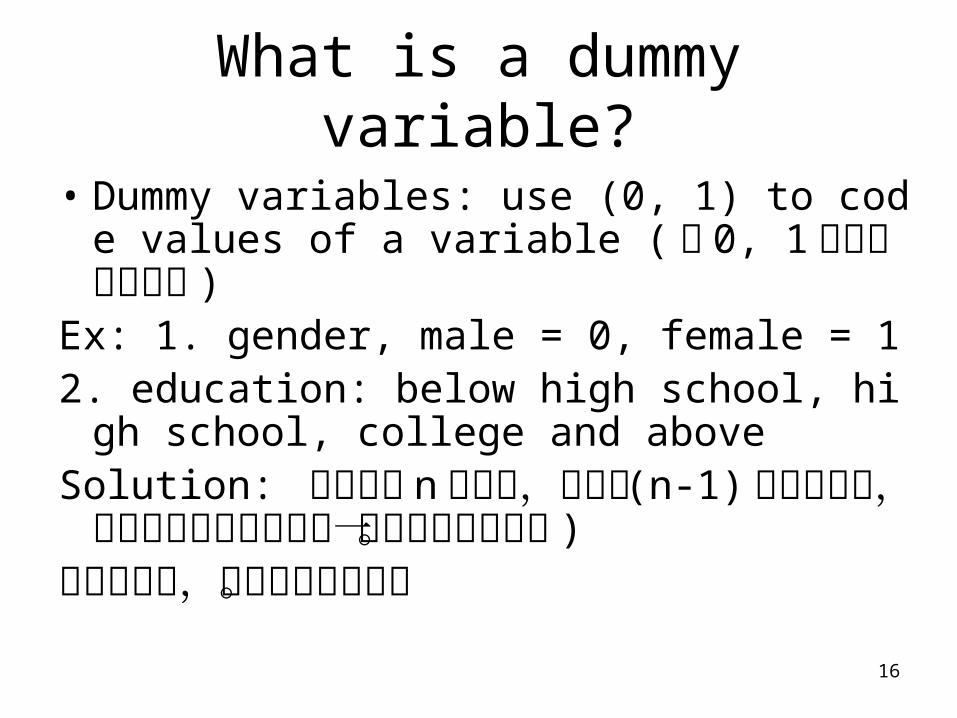
What is a dummy variable?
• Dummy variables: use (0, 1) to code values of a variable ( 用 0, 1 來區分類別資料 )
Ex: 1. gender, male = 0, female = 12. education: below high school, high school,
college and aboveSolution: 自變數有 n 個類別,就需要 (n-1) 個
虛擬變數,且所有的虛擬變數都要一起進入迴歸模型。 )
以此題為例,需兩個虛擬變數。
17
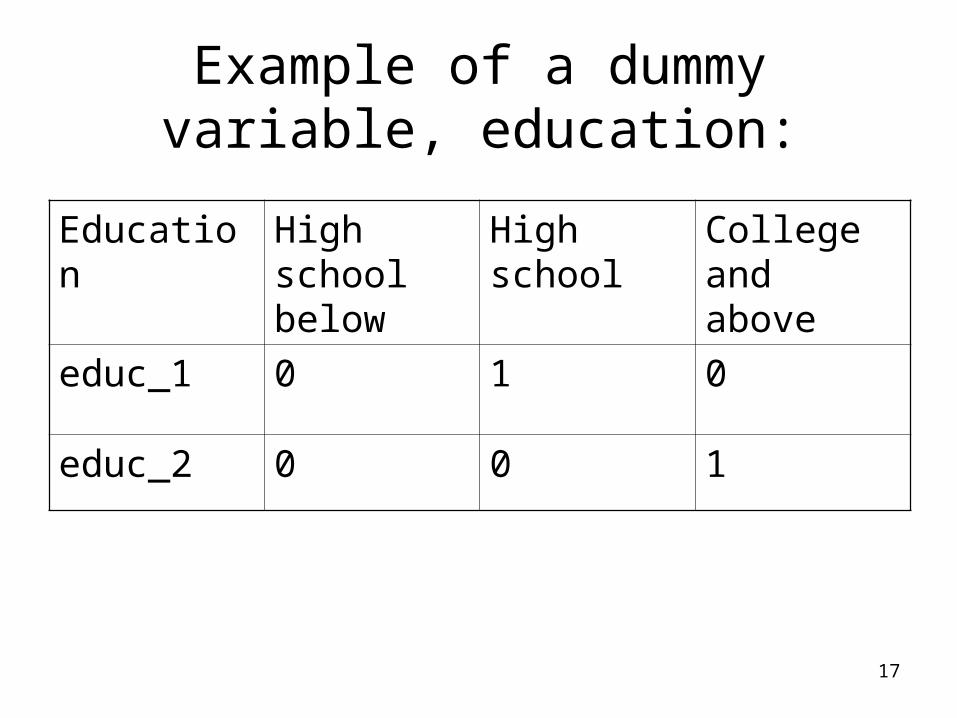
Example of a dummy variable, education:
Education High school below
High school College and above
educ_1 0 1 0
educ_2 0 0 1
18
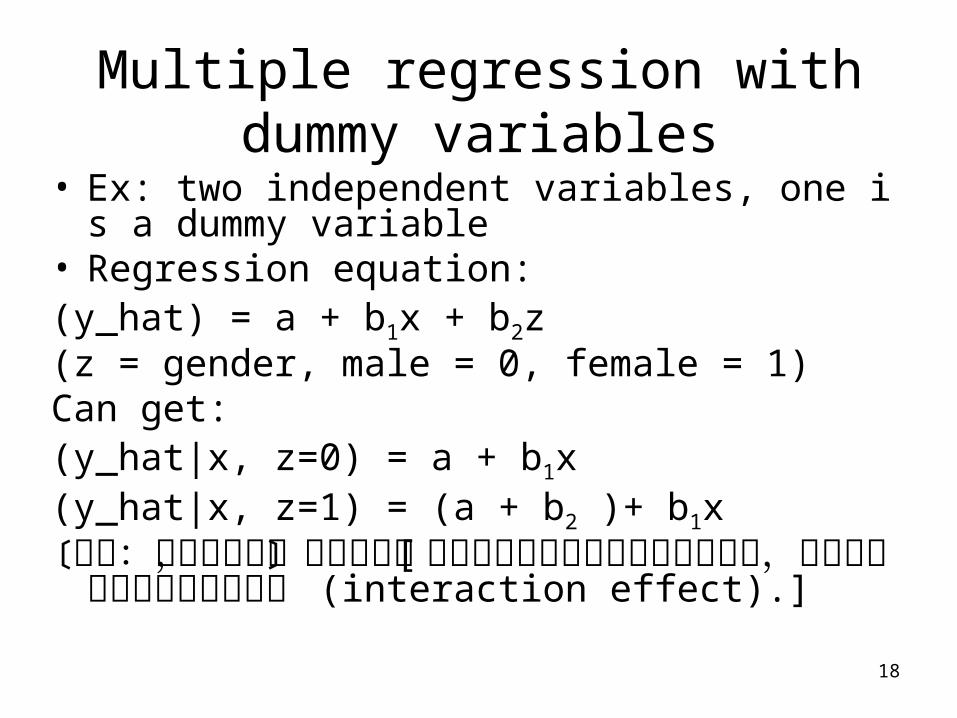
Multiple regression with dummy variables
• Ex: two independent variables, one is a dummy variable
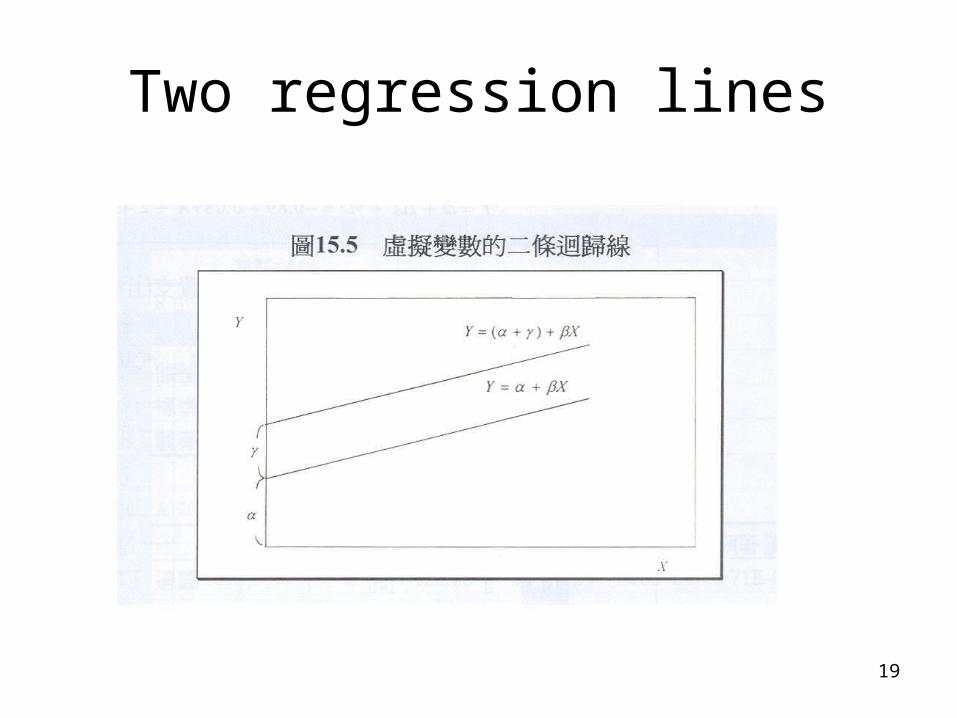
• Regression equation:(y_hat) = a + b1x + b2z (z = gender, male = 0, female = 1)Can get: (y_hat|x, z=0) = a + b1x(y_hat|x, z=1) = (a + b2 )+ b1x〔注意:二個迴歸線,截距不同〕 [ 有時會得到斜率
不同的二個迴歸線,即代表二個自變數有交叉影響 (interaction effect).]
19
Two regression lines
20
The estimation and inference of regression models with dummy
variables:
Follow the same analyses we discussed before.
21
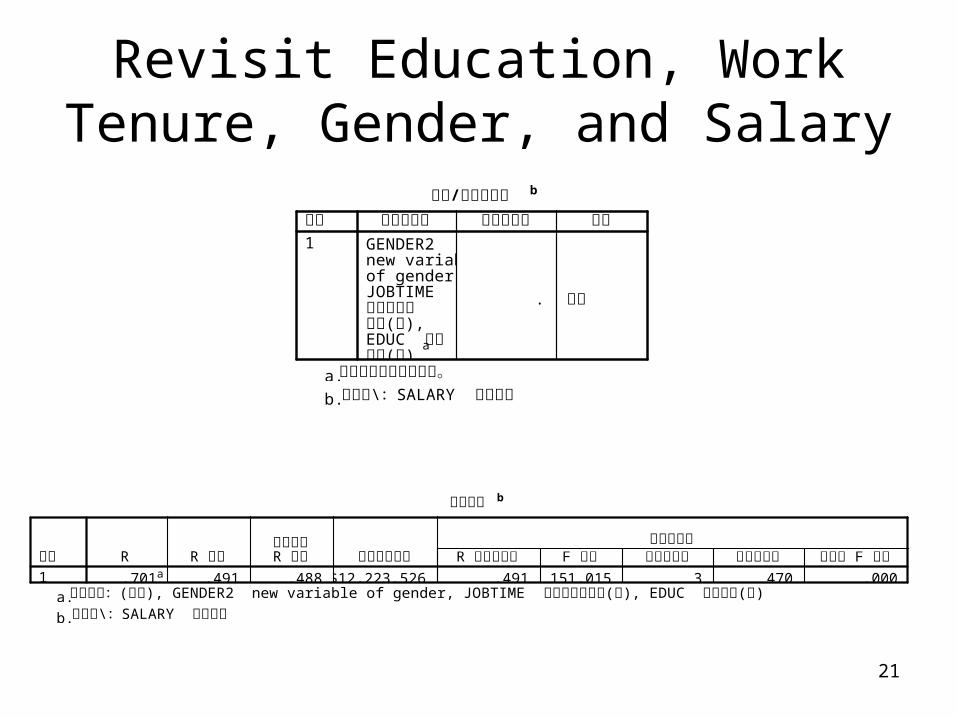
Revisit Education, Work Tenure, Gender, and Salary
/選入 刪除的變數b
GENDER2 new variableof gender,JOBTIME 在本公司的
( ),年資 月EDUC 教育
( )程度 年a
. 選入
模式1
選入的變數 刪除的變數 方法
所有要求的變數已輸入。a. \ SALARY 依變數 : 目前薪資b.
模式摘要b
.701a .491 .488 $12,223.526 .491 151.015 3 470 .000模式1
R R 平方調過後的R 平方 估計的標準誤 R 平方改變量 F 改變 分子自由度 分母自由度 F 顯著性 改變
變更統計量
( ), GENDER2 new variable of gender, JOBTIME ( ), EDUC ( )預測變數: 常數 在本公司的年資 月 教育程度 年a. \ SALARY 依變數 : 目前薪資b.
22
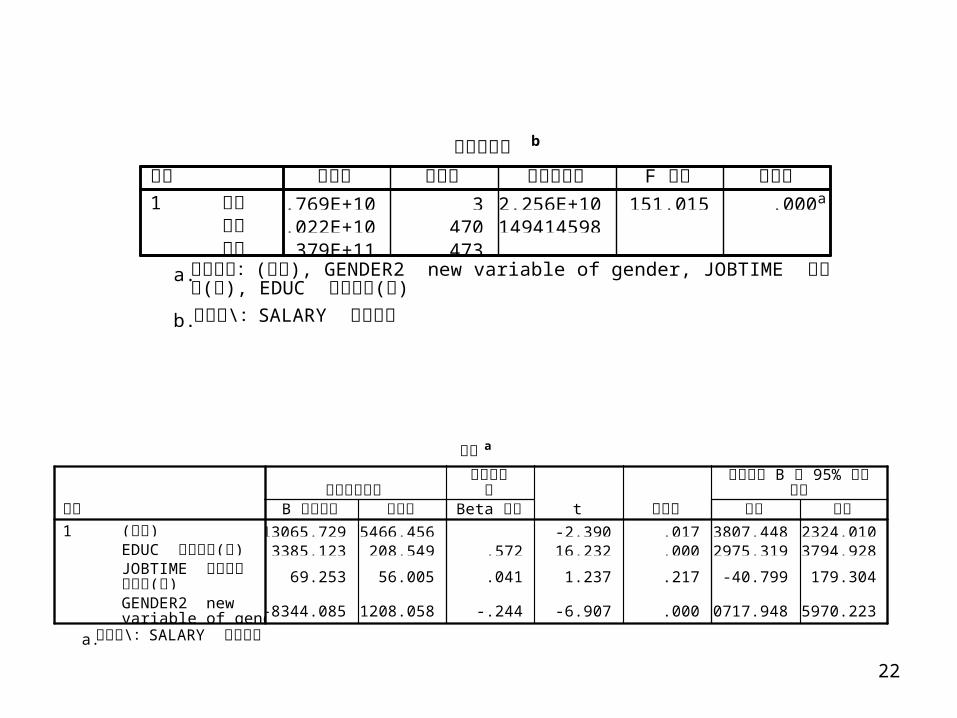
變異數分析b
6.769E+10 3 2.256E+10 151.015 .000a
7.022E+10 470 1494145981.379E+11 473
迴歸殘差總和
模式1
平方和 自由度 平均平方和 F 檢定 顯著性
( ), GENDER2 new variable of gender, JOBTIME 預測變數: 常數 在本公司的年( ), EDUC ( )資 月 教育程度 年
a.
\ SALARY 依變數 : 目前薪資b.
係數a
-13065.729 5466.456 -2.390 .017-23807.448 -2324.0103385.123 208.549 .572 16.232 .000 2975.319 3794.928
69.253 56.005 .041 1.237 .217 -40.799 179.304
-8344.085 1208.058 -.244 -6.907 .000-10717.948 -5970.223
( )常數EDUC ( )教育程度 年JOBTIME 在本公司
( )的年資 月GENDER2 newvariable of gender
模式1
B 之估計值 標準誤未標準化係數
Beta 分配
標準化係數
t 顯著性 下限 上限
B 95% 迴歸係數 的 信賴區間
\ SALARY 依變數 : 目前薪資a.