Embed Size (px)
Citation preview
2015/2016
HKSE : 303
INTERIM REPORT 中期報告書for the six months ended 30 September 2015
截至二零一五年九月三十日止六個月
Chairman’s Statement
VTech Holdings Limited 2015/2016 Interim Report 1
In the first six months of the financial year 2016, VTech
continued to make progress in its core businesses, despite
strong foreign exchange headwinds. In electronic learning
products (ELPs), the business in North America returned
to growth while sales in the Asia Pacific region rose
sharply. Telecommunication (TEL) products continued
to achieve expansion in commercial phones and other
telecommunication products. Contract manufacturing
services (CMS) turned in a good performance, with
growth that continues to outpace the global electronic
manufacturing services industry1.
Results and Dividend
Group revenue for the six months ended 30 September
2015 rose by 3.0% over the same period of the previous
financial year to US$928.1 million. This was primarily due to
higher revenue in North America, Europe and Other Regions,
offsetting lower revenue in Asia Pacific. Despite the increase,
the strong US dollar depressed the Group’s reported revenue
during the period.
Profit attributable to shareholders of the Company decreased
by 2.5% to US$100.1 million. The fall in profit was mainly
attributable to the decline in gross margin, which resulted
from unfavourable currency movements and a change
in product mix. Basic earnings per share decreased by
2.4% to US39.9 cents, compared to US40.9 cents in the
corresponding period last year.
The Board has declared an interim dividend of US17.0 cents
per ordinary share, which is the same as the dividend paid in
the corresponding period last year.
Costs and Operations
Although material prices decreased slightly over the same
period last year, cost of materials rose owing to a change
in product mix. Manufacturing overhead also increased,
as wages in mainland China continued to rise and the
Group added manufacturing capacity. Despite the strong
headwinds from foreign exchange movements and wage
inflation, VTech was able to reduce the workforce through
automation and process improvement, resulting in a stable
direct labour cost. Gross margin declined over the same
period last year. This was mainly due to the depreciation of
currencies against the US dollar, the change in product mix
and the higher manufacturing overhead.
Segment Results
North America
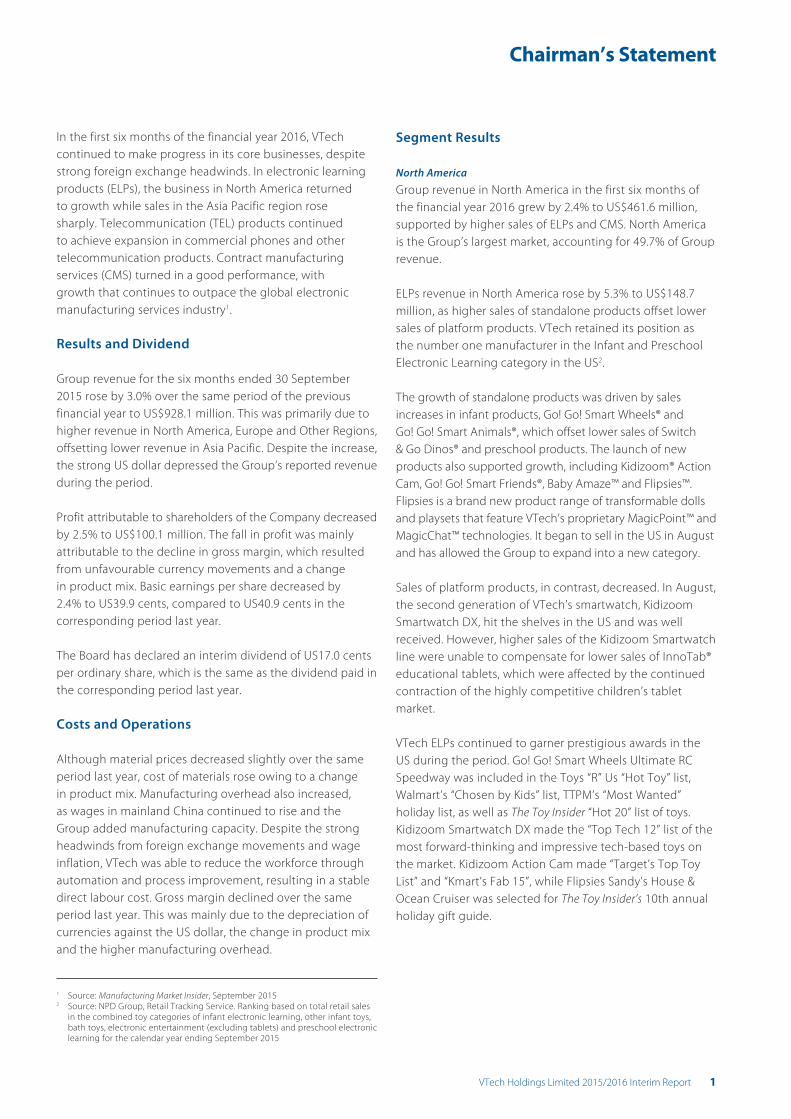
Group revenue in North America in the first six months of
the financial year 2016 grew by 2.4% to US$461.6 million,
supported by higher sales of ELPs and CMS. North America
is the Group’s largest market, accounting for 49.7% of Group
revenue.
ELPs revenue in North America rose by 5.3% to US$148.7
million, as higher sales of standalone products offset lower
sales of platform products. VTech retained its position as
the number one manufacturer in the Infant and Preschool
Electronic Learning category in the US2.
The growth of standalone products was driven by sales
increases in infant products, Go! Go! Smart Wheels® and
Go! Go! Smart Animals®, which offset lower sales of Switch
& Go Dinos® and preschool products. The launch of new
products also supported growth, including Kidizoom® Action
Cam, Go! Go! Smart Friends®, Baby Amaze™ and Flipsies™.
Flipsies is a brand new product range of transformable dolls
and playsets that feature VTech’s proprietary MagicPoint™ and
MagicChat™ technologies. It began to sell in the US in August
and has allowed the Group to expand into a new category.
Sales of platform products, in contrast, decreased. In August,
the second generation of VTech’s smartwatch, Kidizoom
Smartwatch DX, hit the shelves in the US and was well
received. However, higher sales of the Kidizoom Smartwatch
line were unable to compensate for lower sales of InnoTab®
educational tablets, which were affected by the continued
contraction of the highly competitive children’s tablet
market.
VTech ELPs continued to garner prestigious awards in the
US during the period. Go! Go! Smart Wheels Ultimate RC
Speedway was included in the Toys “R” Us “Hot Toy” list,
Walmart’s “Chosen by Kids” list, TTPM’s “Most Wanted”
holiday list, as well as The Toy Insider “Hot 20” list of toys.
Kidizoom Smartwatch DX made the “Top Tech 12” list of the
most forward-thinking and impressive tech-based toys on
the market. Kidizoom Action Cam made “Target’s Top Toy
List” and “Kmart’s Fab 15”, while Flipsies Sandy’s House &
Ocean Cruiser was selected for The Toy Insider’s 10th annual
holiday gift guide.
1 Source: Manufacturing Market Insider, September 20152 Source: NPD Group, Retail Tracking Service. Ranking based on total retail sales
in the combined toy categories of infant electronic learning, other infant toys,
bath toys, electronic entertainment (excluding tablets) and preschool electronic
learning for the calendar year ending September 2015
Chairman’s Statement
2 VTech Holdings Limited 2015/2016 Interim Report
Revenue from TEL products in North America decreased by
7.0% to US$200.2 million. Sales of residential phones were
lower, as the fixed-line telephone market has continued to
contract. Nonetheless, VTech strengthened its number one
position in the US residential phone market3.
Sales of commercial phones and other telecommunication
products, in contrast, continued to rise. Baby monitors led
the growth on a strong sell-through and additional product
placements. Sales of VTech’s four-line small business phone
system also increased, as the new series was well received
by the market. The VTech branded ErisStation™, a conference
phone with wireless microphones, and ErisTerminal™, a SIP
(Session Initiation Protocol) based business phone system,
saw steady growth in sales, as the product ranges were
completed with the addition of new models.
CMS revenue in North America rose by 19.8% to US$112.7
million. The growth was driven by higher sales of
professional audio equipment and industrial products, which
offset lower sales of solid-state lighting. Professional audio
equipment posted good growth as a major client increased
orders after resolving excess inventory issues, while several
other customers saw higher demand for their products.
Growth in this category also benefited from the addition of
new customers. Industrial products recorded higher sales
as VTech gained more business following a customer’s
decision to consolidate suppliers. Sales of solid-state lighting,
however, trended lower as the demand for the customers’
products decreased.
Revenue in North America by Product Line
Total: US$461.6 million
for the six months ended 30 September 2015
Telecommunication
Products
43.4%US$200.2 million
Electronic Learning
Products
32.2%US$148.7 million
Contract Manufacturing
Services
24.4%US$112.7 million
3 Source: MarketWise Consumer Insights, LLC4 Source: NPD Group, Retail Tracking Service. Ranking based on total retail sales of
infant toys for the calendar year ending September 2015
Europe
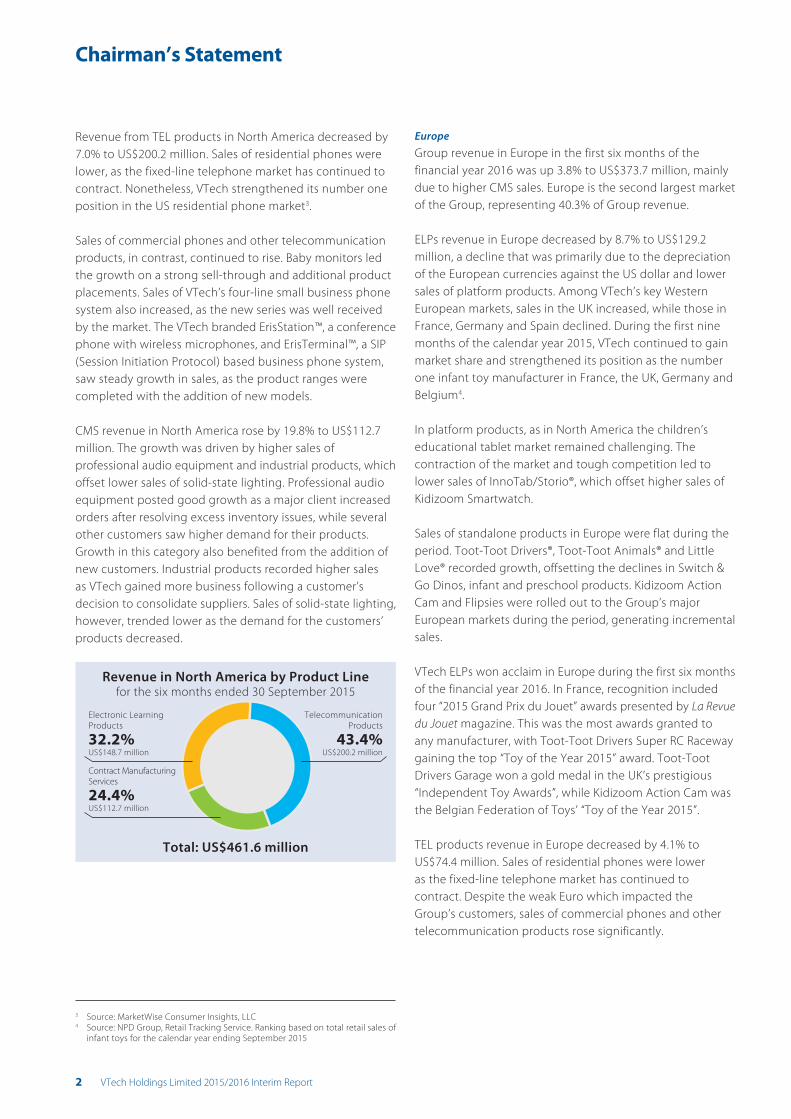
Group revenue in Europe in the first six months of the
financial year 2016 was up 3.8% to US$373.7 million, mainly
due to higher CMS sales. Europe is the second largest market
of the Group, representing 40.3% of Group revenue.
ELPs revenue in Europe decreased by 8.7% to US$129.2
million, a decline that was primarily due to the depreciation
of the European currencies against the US dollar and lower
sales of platform products. Among VTech’s key Western
European markets, sales in the UK increased, while those in
France, Germany and Spain declined. During the first nine
months of the calendar year 2015, VTech continued to gain
market share and strengthened its position as the number
one infant toy manufacturer in France, the UK, Germany and
Belgium4.
In platform products, as in North America the children’s
educational tablet market remained challenging. The
contraction of the market and tough competition led to
lower sales of InnoTab/Storio®, which offset higher sales of
Kidizoom Smartwatch.
Sales of standalone products in Europe were flat during the
period. Toot-Toot Drivers®, Toot-Toot Animals® and Little
Love® recorded growth, offsetting the declines in Switch &
Go Dinos, infant and preschool products. Kidizoom Action
Cam and Flipsies were rolled out to the Group’s major
European markets during the period, generating incremental
sales.
VTech ELPs won acclaim in Europe during the first six months
of the financial year 2016. In France, recognition included
four “2015 Grand Prix du Jouet” awards presented by La Revue
du Jouet magazine. This was the most awards granted to
any manufacturer, with Toot-Toot Drivers Super RC Raceway
gaining the top “Toy of the Year 2015” award. Toot-Toot
Drivers Garage won a gold medal in the UK’s prestigious
“Independent Toy Awards”, while Kidizoom Action Cam was
the Belgian Federation of Toys’ “Toy of the Year 2015”.
TEL products revenue in Europe decreased by 4.1% to
US$74.4 million. Sales of residential phones were lower
as the fixed-line telephone market has continued to
contract. Despite the weak Euro which impacted the
Group’s customers, sales of commercial phones and other
telecommunication products rose significantly.
Chairman’s Statement
VTech Holdings Limited 2015/2016 Interim Report 3
In commercial phones, sales of CAT-iq (Cordless Advanced
Technology — internet and quality) handsets saw robust
growth, as network operators continued to encourage the
replacement of traditional PSTN (Public Switched Telephone
Network) services with VoIP (Voice over Internet Protocol)
services. Sales of ErisStation and ErisTerminal also increased
and in September, the Group launched the VTech branded
ErisTerminal in the UK market. In other telecommunication
products, baby monitors registered respectable growth as
VTech increased sales to existing customers and boosted
market share. The Group also started selling VTech branded
baby monitors in the UK, with the Full Colour Video and
Audio model winning a “Silver” award from Right Start
magazine. Growth in IADs (Integrated Access Devices) was
also strong, as the Group began shipping a high-end device
that supports VDSL and dual band 802.11ac to several
customers.
CMS revenue in Europe was up 20.8% to US$170.1 million.
Sales of hearables, professional audio equipment and
home appliances grew, while those of power supplies were
stable. Hearables recorded higher sales as VTech increased
its revenue share with a major customer, alongside strong
market demand for the customer’s products. In professional
audio, the Group secured more projects from existing
customers and there was a sales contribution from new
customers. In home appliances, sales to existing customers
also recorded an increase.
Revenue in Europe by Product Line
Total: US$373.7 million
for the six months ended 30 September 2015
Telecommunication
Products
19.9%US$74.4 million
Electronic Learning
Products
34.6%US$129.2 million
Contract Manufacturing
Services
45.5%US$170.1 million
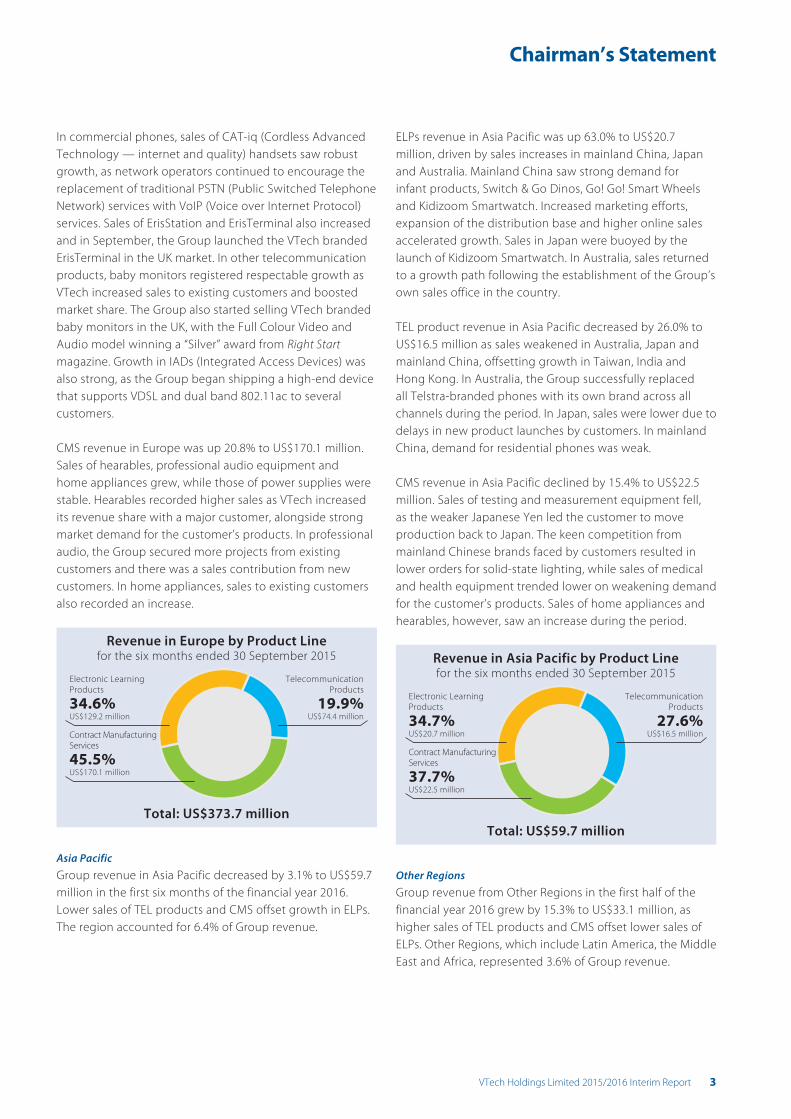
Asia Pacific
Group revenue in Asia Pacific decreased by 3.1% to US$59.7
million in the first six months of the financial year 2016.
Lower sales of TEL products and CMS offset growth in ELPs.
The region accounted for 6.4% of Group revenue.
ELPs revenue in Asia Pacific was up 63.0% to US$20.7
million, driven by sales increases in mainland China, Japan
and Australia. Mainland China saw strong demand for
infant products, Switch & Go Dinos, Go! Go! Smart Wheels
and Kidizoom Smartwatch. Increased marketing efforts,
expansion of the distribution base and higher online sales
accelerated growth. Sales in Japan were buoyed by the
launch of Kidizoom Smartwatch. In Australia, sales returned
to a growth path following the establishment of the Group’s
own sales office in the country.
TEL product revenue in Asia Pacific decreased by 26.0% to
US$16.5 million as sales weakened in Australia, Japan and
mainland China, offsetting growth in Taiwan, India and
Hong Kong. In Australia, the Group successfully replaced
all Telstra-branded phones with its own brand across all
channels during the period. In Japan, sales were lower due to
delays in new product launches by customers. In mainland
China, demand for residential phones was weak.
CMS revenue in Asia Pacific declined by 15.4% to US$22.5
million. Sales of testing and measurement equipment fell,
as the weaker Japanese Yen led the customer to move
production back to Japan. The keen competition from
mainland Chinese brands faced by customers resulted in
lower orders for solid-state lighting, while sales of medical
and health equipment trended lower on weakening demand
for the customer’s products. Sales of home appliances and
hearables, however, saw an increase during the period.
Revenue in Asia Pacific by Product Line
Total: US$59.7 million
for the six months ended 30 September 2015
Telecommunication
Products
27.6%US$16.5 million
Electronic Learning
Products
34.7%US$20.7 million
Contract Manufacturing
Services
37.7%US$22.5 million
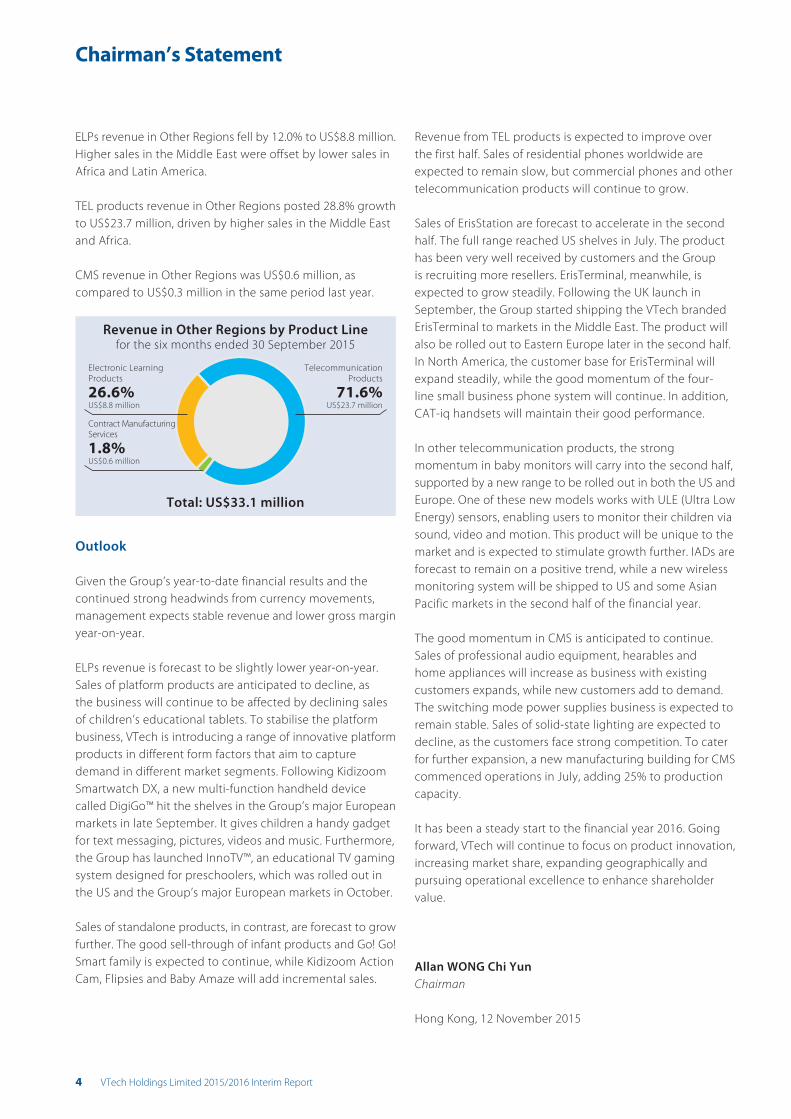
Other Regions
Group revenue from Other Regions in the first half of the
financial year 2016 grew by 15.3% to US$33.1 million, as
higher sales of TEL products and CMS offset lower sales of
ELPs. Other Regions, which include Latin America, the Middle
East and Africa, represented 3.6% of Group revenue.
Chairman’s Statement
4 VTech Holdings Limited 2015/2016 Interim Report
ELPs revenue in Other Regions fell by 12.0% to US$8.8 million.
Higher sales in the Middle East were offset by lower sales in
Africa and Latin America.
TEL products revenue in Other Regions posted 28.8% growth
to US$23.7 million, driven by higher sales in the Middle East
and Africa.
CMS revenue in Other Regions was US$0.6 million, as
compared to US$0.3 million in the same period last year.
Revenue in Other Regions by Product Line
Total: US$33.1 million
for the six months ended 30 September 2015
Telecommunication
Products
71.6%US$23.7 million
Electronic Learning
Products
26.6%US$8.8 million
Contract Manufacturing
Services
1.8%US$0.6 million
Outlook
Given the Group’s year-to-date financial results and the
continued strong headwinds from currency movements,
management expects stable revenue and lower gross margin
year-on-year.
ELPs revenue is forecast to be slightly lower year-on-year.
Sales of platform products are anticipated to decline, as
the business will continue to be affected by declining sales
of children’s educational tablets. To stabilise the platform
business, VTech is introducing a range of innovative platform
products in different form factors that aim to capture
demand in different market segments. Following Kidizoom
Smartwatch DX, a new multi-function handheld device
called DigiGo™ hit the shelves in the Group’s major European
markets in late September. It gives children a handy gadget
for text messaging, pictures, videos and music. Furthermore,
the Group has launched InnoTV™, an educational TV gaming
system designed for preschoolers, which was rolled out in
the US and the Group’s major European markets in October.
Sales of standalone products, in contrast, are forecast to grow
further. The good sell-through of infant products and Go! Go!
Smart family is expected to continue, while Kidizoom Action
Cam, Flipsies and Baby Amaze will add incremental sales.
Revenue from TEL products is expected to improve over
the first half. Sales of residential phones worldwide are
expected to remain slow, but commercial phones and other
telecommunication products will continue to grow.
Sales of ErisStation are forecast to accelerate in the second
half. The full range reached US shelves in July. The product
has been very well received by customers and the Group
is recruiting more resellers. ErisTerminal, meanwhile, is
expected to grow steadily. Following the UK launch in
September, the Group started shipping the VTech branded
ErisTerminal to markets in the Middle East. The product will
also be rolled out to Eastern Europe later in the second half.
In North America, the customer base for ErisTerminal will
expand steadily, while the good momentum of the four-
line small business phone system will continue. In addition,
CAT-iq handsets will maintain their good performance.
In other telecommunication products, the strong
momentum in baby monitors will carry into the second half,
supported by a new range to be rolled out in both the US and
Europe. One of these new models works with ULE (Ultra Low
Energy) sensors, enabling users to monitor their children via
sound, video and motion. This product will be unique to the
market and is expected to stimulate growth further. IADs are
forecast to remain on a positive trend, while a new wireless
monitoring system will be shipped to US and some Asian
Pacific markets in the second half of the financial year.
The good momentum in CMS is anticipated to continue.
Sales of professional audio equipment, hearables and
home appliances will increase as business with existing
customers expands, while new customers add to demand.
The switching mode power supplies business is expected to
remain stable. Sales of solid-state lighting are expected to
decline, as the customers face strong competition. To cater
for further expansion, a new manufacturing building for CMS
commenced operations in July, adding 25% to production
capacity.
It has been a steady start to the financial year 2016. Going
forward, VTech will continue to focus on product innovation,
increasing market share, expanding geographically and
pursuing operational excellence to enhance shareholder
value.
Allan WONG Chi Yun
Chairman
Hong Kong, 12 November 2015
Management Discussion and Analysis
VTech Holdings Limited 2015/2016 Interim Report 5
Financial Overview
Six months ended 30 September2015 2014 Change
For the six months ended 30 September 2015 US$ million US$ million US$ million
Revenue 928.1 900.8 27.3 Gross profit 286.0 290.2 (4.2)Gross profit margin 30.8% 32.2%
Total operating expenses (175.0) (177.0) 2.0Total operating expenses as a percentage of revenue 18.8% 19.6% Operating profit 111.0 113.2 (2.2)Operating profit margin 12.0% 12.6%
Net finance income 0.5 1.2 (0.7) Profit before taxation 111.5 114.4 (2.9)
Taxation (11.4) (11.7) 0.3Effective tax rate 10.2% 10.2% Profit for the period and attributable to shareholders
of the Company 100.1 102.7 (2.6)
Revenue
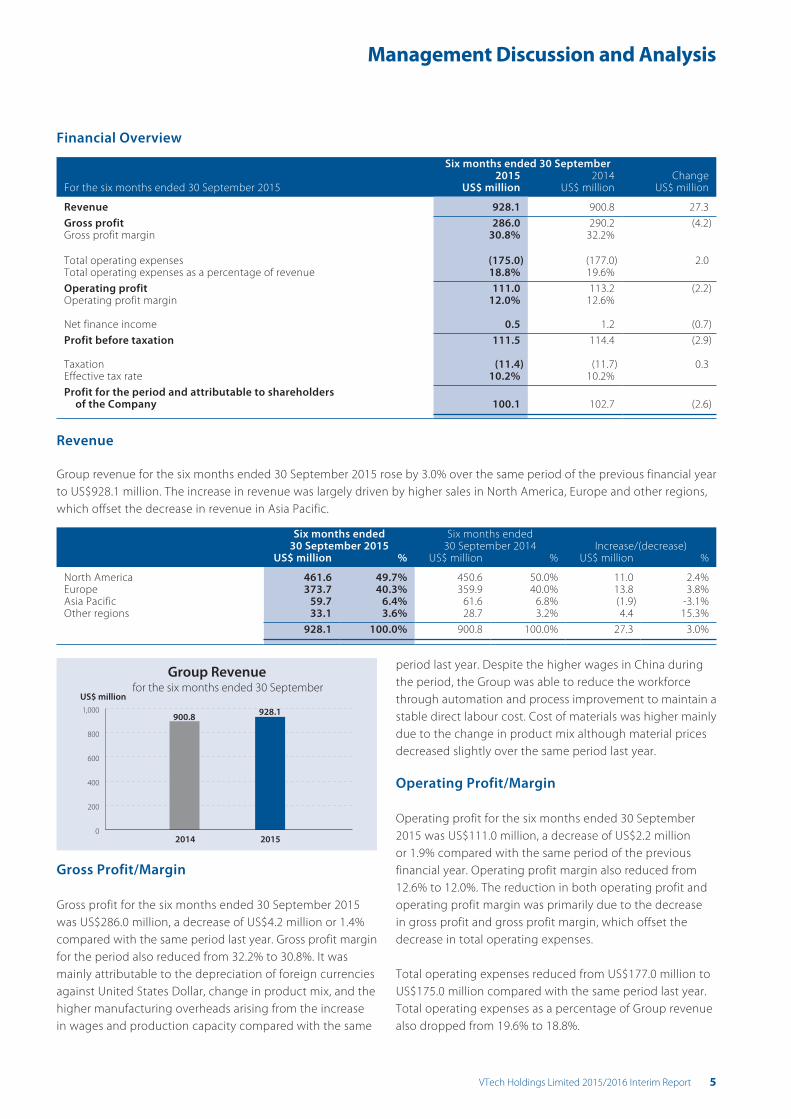
Group revenue for the six months ended 30 September 2015 rose by 3.0% over the same period of the previous financial year
to US$928.1 million. The increase in revenue was largely driven by higher sales in North America, Europe and other regions,
which offset the decrease in revenue in Asia Pacific.
Six months ended 30 September 2015
Six months ended 30 September 2014 Increase/(decrease)
US$ million % US$ million % US$ million %
North America 461.6 49.7% 450.6 50.0% 11.0 2.4%Europe 373.7 40.3% 359.9 40.0% 13.8 3.8%Asia Pacific 59.7 6.4% 61.6 6.8% (1.9) -3.1%Other regions 33.1 3.6% 28.7 3.2% 4.4 15.3%
928.1 100.0% 900.8 100.0% 27.3 3.0%
Group Revenuefor the six months ended 30 September
US$ million
2014 2015
1,000
800
600
400
200
0
900.8928.1
Gross Profit/Margin
Gross profit for the six months ended 30 September 2015
was US$286.0 million, a decrease of US$4.2 million or 1.4%
compared with the same period last year. Gross profit margin
for the period also reduced from 32.2% to 30.8%. It was
mainly attributable to the depreciation of foreign currencies
against United States Dollar, change in product mix, and the
higher manufacturing overheads arising from the increase
in wages and production capacity compared with the same
period last year. Despite the higher wages in China during
the period, the Group was able to reduce the workforce
through automation and process improvement to maintain a
stable direct labour cost. Cost of materials was higher mainly
due to the change in product mix although material prices
decreased slightly over the same period last year.
Operating Profit/Margin
Operating profit for the six months ended 30 September
2015 was US$111.0 million, a decrease of US$2.2 million
or 1.9% compared with the same period of the previous
financial year. Operating profit margin also reduced from
12.6% to 12.0%. The reduction in both operating profit and
operating profit margin was primarily due to the decrease
in gross profit and gross profit margin, which offset the
decrease in total operating expenses.
Total operating expenses reduced from US$177.0 million to
US$175.0 million compared with the same period last year.
Total operating expenses as a percentage of Group revenue
also dropped from 19.6% to 18.8%.

Management Discussion and Analysis
6 VTech Holdings Limited 2015/2016 Interim Report
Selling and distribution costs declined from US$115.0 million
to US$114.1 million, a decrease of 0.8% compared with
the same period last year. It was mainly attributable to the
reduced spending on advertising and promotional activities
and the lower royalty payments for the licensed products
during the first half of the financial year. As a percentage of
Group revenue, selling and distribution costs also decreased
from 12.8% to 12.3%.
Administrative and other operating expenses reduced
from US$33.6 million to US$32.2 million compared with the
same period last year. It was mainly due to the decrease in
employee related costs and the lower legal and professional
fees. The net exchange loss arising from the Group’s
global operations in the ordinary course of business was
US$0.2 million, same as the corresponding period of last
year. Administrative and other operating expenses as a
percentage of Group revenue also decreased from 3.7%
to 3.5%.
During the first half of the financial year 2016, the research
and development expenses were US$28.7 million, an
increase of 1.1% compared with the same period last year.
Research and development expenses as a percentage of
Group revenue reduced from 3.2% to 3.1%.
Profit Attributable to Shareholders and Earnings per Share
Profit attributable to shareholders of the Company for the six
months ended 30 September 2015 was US$100.1 million, a
decrease of US$2.6 million or 2.5% compared with the same
period last year. Net profit margin also decreased from 11.4%
to 10.8%.
Basic earnings per share for the six months ended
30 September 2015 were US39.9 cents as compared to
US40.9 cents in the first half of the previous financial year.
Profit Attributable to Shareholders of the Companyfor the six months ended 30 September
US$ million
2014 2015
120
100
80
60
40
20
0
102.7 100.1
Dividends
Since the end of the relevant financial period, the directors
of the Company (the “Directors”) have declared an interim
dividend of US17.0 cents per share, which is estimated to be
US$42.7 million.
Liquidity and Financial Resources
The Group’s financial resources remain strong. As of
30 September 2015, the Group had deposits and cash of
US$104.9 million and was debt-free. The Group also has
adequate liquidity to meet its current and future working
capital requirements.
Working Capital
Stocks as of 30 September 2015 were US$367.9 million,
increased from US$290.2 million as of 31 March 2015. The
higher stock level was primarily to cater for the higher
demand of the Group’s products in the second half of the
financial year and the seasonality of most of the Group’s
businesses. Furthermore, we had arranged early production
of the Group’s products in order to better utilise the Group’s
production capacities. As compared to the corresponding
period of last financial year, stocks increased by US$10.5
million or 2.9%, and turnover days also increased from
114 days to 115 days.
Trade debtors as of 30 September 2015 were US$395.5
million, increased from US$221.9 million as of 31 March 2015.
This was mainly due to the growth in revenue in the first
half of the financial year and the seasonal nature of most of
the Group’s businesses. As compared to the corresponding
period of last financial year, trade debtors increased by
US$8.1 million or 2.1%, and turnover days also increased from
59 days to 61 days.
Trade creditors as of 30 September 2015 were US$260.5
million, increased from US$186.1 million as of 31 March 2015.
As compared to the corresponding period of last financial
year, trade creditors increased by US$25.4 million or 10.8%,
and turnover days also increased from 70 days to 83 days.
Treasury Policies
The Group’s treasury policies are designed to mitigate the
impact of fluctuations in foreign currency exchange rates
arising from the Group’s global operations. We principally
use forward foreign exchange contracts as appropriate to
hedge the foreign exchange risks in the ordinary course of
business. It is the Group’s policy not to enter into derivative
transactions for speculative purposes.
Capital Expenditure and Contingencies
For the six months ended 30 September 2015, the
Group invested US$22.2 million in the purchase of
tangible assets including machinery and equipment,
leasehold improvements, office equipment, as well as the
improvement of manufacturing working environment. All
of these capital expenditures were financed from internal
resources.
As of 30 September 2015, the Group had no material
contingencies.
Interim Financial Report
VTech Holdings Limited 2015/2016 Interim Report 7
Consolidated Statement of Profit or LossFor the six months ended 30 September 2015
Six months ended 30 September
Year ended31 March
2015 2014 2015(Unaudited) (Unaudited) (Audited)
Note US$ million US$ million US$ million
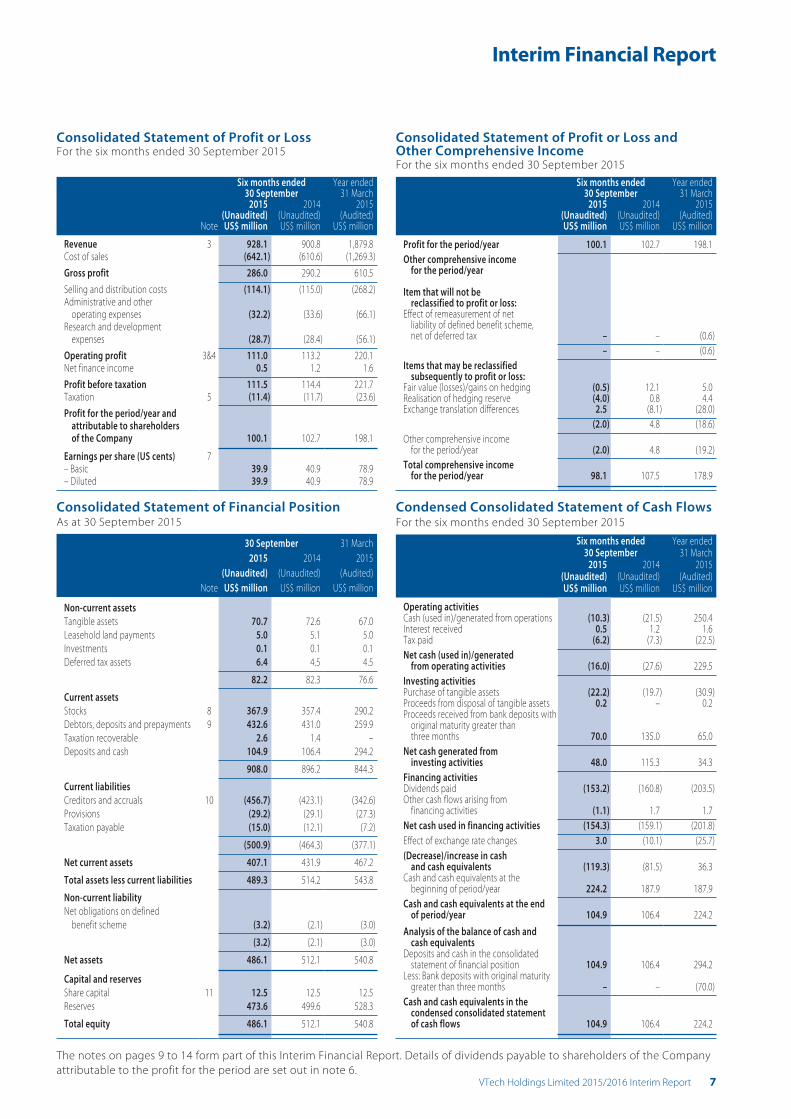
Revenue 3 928.1 900.8 1,879.8Cost of sales (642.1) (610.6) (1,269.3) Gross profit 286.0 290.2 610.5 Selling and distribution costs (114.1) (115.0) (268.2)Administrative and other
operating expenses (32.2) (33.6) (66.1)Research and development
expenses (28.7) (28.4) (56.1) Operating profit 3&4 111.0 113.2 220.1Net finance income 0.5 1.2 1.6 Profit before taxation 111.5 114.4 221.7Taxation 5 (11.4) (11.7) (23.6) Profit for the period/year and
attributable to shareholders of the Company 100.1 102.7 198.1
Earnings per share (US cents) 7– Basic 39.9 40.9 78.9– Diluted 39.9 40.9 78.9
The notes on pages 9 to 14 form part of this Interim Financial Report. Details of dividends payable to shareholders of the Company
attributable to the profit for the period are set out in note 6.
Consolidated Statement of Profit or Loss and Other Comprehensive IncomeFor the six months ended 30 September 2015
Six months ended 30 September
Year ended 31 March
2015 2014 2015(Unaudited) (Unaudited) (Audited)US$ million US$ million US$ million
Profit for the period/year 100.1 102.7 198.1 Other comprehensive income
for the period/year
Item that will not be reclassified to profit or loss:
Effect of remeasurement of net liability of defined benefit scheme, net of deferred tax – – (0.6)
– – (0.6) Items that may be reclassified
subsequently to profit or loss:Fair value (losses)/gains on hedging (0.5) 12.1 5.0Realisation of hedging reserve (4.0) 0.8 4.4Exchange translation differences 2.5 (8.1) (28.0)
(2.0) 4.8 (18.6) Other comprehensive income
for the period/year (2.0) 4.8 (19.2) Total comprehensive income
for the period/year 98.1 107.5 178.9
Consolidated Statement of Financial PositionAs at 30 September 2015
30 September 31 March
2015 2014 2015
(Unaudited) (Unaudited) (Audited)
Note US$ million US$ million US$ million
Non-current assets
Tangible assets 70.7 72.6 67.0
Leasehold land payments 5.0 5.1 5.0
Investments 0.1 0.1 0.1
Deferred tax assets 6.4 4.5 4.5
82.2 82.3 76.6
Current assets
Stocks 8 367.9 357.4 290.2
Debtors, deposits and prepayments 9 432.6 431.0 259.9
Taxation recoverable 2.6 1.4 –
Deposits and cash 104.9 106.4 294.2
908.0 896.2 844.3
Current liabilities
Creditors and accruals 10 (456.7) (423.1) (342.6)
Provisions (29.2) (29.1) (27.3)
Taxation payable (15.0) (12.1) (7.2)
(500.9) (464.3) (377.1)
Net current assets 407.1 431.9 467.2
Total assets less current liabilities 489.3 514.2 543.8
Non-current liability
Net obligations on defined
benefit scheme (3.2) (2.1) (3.0)
(3.2) (2.1) (3.0)
Net assets 486.1 512.1 540.8
Capital and reserves
Share capital 11 12.5 12.5 12.5
Reserves 473.6 499.6 528.3
Total equity 486.1 512.1 540.8
Condensed Consolidated Statement of Cash FlowsFor the six months ended 30 September 2015
Six months ended Year ended30 September 31 March
2015 2014 2015(Unaudited) (Unaudited) (Audited)US$ million US$ million US$ million
Operating activitiesCash (used in)/generated from operations (10.3) (21.5) 250.4Interest received 0.5 1.2 1.6Tax paid (6.2) (7.3) (22.5) Net cash (used in)/generated
from operating activities (16.0) (27.6) 229.5 Investing activitiesPurchase of tangible assets (22.2) (19.7) (30.9)Proceeds from disposal of tangible assets 0.2 – 0.2Proceeds received from bank deposits with
original maturity greater than three months 70.0 135.0 65.0
Net cash generated from investing activities 48.0 115.3 34.3
Financing activitiesDividends paid (153.2) (160.8) (203.5)Other cash flows arising from
financing activities (1.1) 1.7 1.7 Net cash used in financing activities (154.3) (159.1) (201.8) Effect of exchange rate changes 3.0 (10.1) (25.7) (Decrease)/increase in cash
and cash equivalents (119.3) (81.5) 36.3Cash and cash equivalents at the
beginning of period/year 224.2 187.9 187.9 Cash and cash equivalents at the end
of period/year 104.9 106.4 224.2
Analysis of the balance of cash and cash equivalents
Deposits and cash in the consolidated statement of financial position 104.9 106.4 294.2
Less: Bank deposits with original maturity greater than three months – – (70.0)
Cash and cash equivalents in the condensed consolidated statement of cash flows 104.9 106.4 224.2

Interim Financial Report
8 VTech Holdings Limited 2015/2016 Interim Report
Consolidated Statement of Changes in EquityFor the six months ended 30 September 2015 – unaudited
Attributable to shareholders of the Company
Share capital
Share premium
Shares held for
Share Purchase
SchemeExchange
reserveHedging
reserveRevenue
reserveTotal
equityNote US$ million US$ million US$ million US$ million US$ million US$ million US$ million
At 1 April 2015 12.5 148.8 (0.9) (16.8) 5.2 392.0 540.8Changes in equity for the six months
ended 30 September 2015Comprehensive incomeProfit for the period – – – – – 100.1 100.1 Other comprehensive incomeFair value losses on hedging – – – – (0.5) – (0.5)Realisation of hedging reserve – – – – (4.0) – (4.0)Exchange translation differences – – – 2.5 – – 2.5 Other comprehensive income
for the period – – – 2.5 (4.5) – (2.0) Total comprehensive income
for the period – – – 2.5 (4.5) 100.1 98.1 Dividends approved and paid
during the period 6 – – – – – (153.2) (153.2)Shares purchased for Share Purchase Scheme 11(c) – – (1.0) – – – (1.0)Vesting of shares of Share Purchase Scheme 11(c) – – 1.4 – – – 1.4 At 30 September 2015 12.5 148.8 (0.5) (14.3) 0.7 338.9 486.1
Attributable to shareholders of the Company
Sharecapital
Sharepremium
Sharesheld for
SharePurchase
SchemeExchange
reserveCapitalreserve
Hedgingreserve
Revenuereserve
Totalequity
Note US$ million US$ million US$ million US$ million US$ million US$ million US$ million US$ million
At 1 April 2014 12.5 144.5 (0.5) 11.2 1.0 (4.2) 397.9 562.4Changes in equity for the six months
ended 30 September 2014Comprehensive incomeProfit for the period – – – – – – 102.7 102.7 Other comprehensive incomeFair value gains on hedging – – – – – 12.1 – 12.1Realisation of hedging reserve – – – – – 0.8 – 0.8Exchange translation differences – – – (8.1) – – – (8.1) Other comprehensive income
for the period – – – (8.1) – 12.9 – 4.8 Total comprehensive income
for the period – – – (8.1) – 12.9 102.7 107.5 Dividends approved and paid
during the period 6 – – – – – – (160.8) (160.8)Shares issued under share option scheme 11(a) – 3.4 – – – – – 3.4Equity-settled share based payments – 0.9 – – (0.9) – – –Share option lapsed during the period – – – – (0.1) – 0.1 –Shares purchased for Share Purchase Scheme 11(c) – – (1.7) – – – – (1.7)Vesting of shares of Share Purchase Scheme 11(c) – – 1.3 – – – – 1.3 At 30 September 2014 12.5 148.8 (0.9) 3.1 – 8.7 339.9 512.1
The notes on pages 9 to 14 form part of this Interim Financial Report.

Notes to the Unaudited Interim Financial Report
VTech Holdings Limited 2015/2016 Interim Report 9
1 Basis of Preparation
The Directors are responsible for preparing the Interim Financial Report in accordance with applicable law and regulations. This unaudited Interim Financial Report has been prepared in accordance with the requirements of the Rules Governing the Listing of Securities (the “Listing Rules”) on The Stock Exchange of Hong Kong Limited (the “Stock Exchange”) including compliance with International Accounting Standard 34 (“IAS 34”), Interim Financial Reporting, issued by the International Accounting Standards Board (the “IASB”).
The Interim Financial Report has been prepared in accordance with the same accounting policies adopted in the 2015 annual financial statements, except for the accounting policy changes as set out in note 2.
The preparation of an Interim Financial Report in conformity with IAS 34 requires management to make judgements, estimates and assumptions that affect the application of policies and reported amounts of assets and liabilities, income and expenses on a year to date basis. Actual results may differ from these estimates.
The Interim Financial Report contains condensed consolidated financial statements and selected explanatory notes. The notes include an explanation of events and transactions that are significant to an understanding of the changes in financial position and performance of the Group since the 2015 annual financial statements. The condensed consolidated interim financial statements and notes thereto do not include all of the information required for full set of financial statements prepared in accordance with International Financial Reporting Standards (“IFRSs”).
The Interim Financial Report has not been audited or reviewed by the auditors pursuant to International Standards on Auditing or International Standards on Review Engagements.
The financial information relating to the financial year ended 31 March 2015 included in the Interim Financial Report does not constitute the Company’s annual financial statements for that financial year but is derived from those financial statements. The annual financial statements for the year ended 31 March 2015 are available from the Company’s registered office. The auditors have expressed an unqualified opinion on those financial statements in their report dated 19 May 2015.
2 Changes in Accounting Policies
The IASB has issued the following amendments to IFRSs that are first effective for the current accounting period of the Group.
• Amendments to IAS 19, Employee benefits – Defined benefit plans: Employee contributions
• Annual improvements to IFRSs 2010-2012 cycle• Annual improvements to IFRSs 2011-2013 cycle
None of these developments have had a material effect on how the Group’s results and financial position for the current or prior periods have been prepared or presented. The Group has not applied any new standard or interpretation that is not yet effective for the current accounting period.
3 Segment Information
The Group manages its businesses by divisions, which are organised by geography. In accordance with IFRS 8, Operating segments and in a manner consistent with the way in which information is reported internally to the Group’s most senior executive management for the purposes of resource allocation and performance assessment, the Group has presented the following reportable segments.
• North America (including the United States and Canada)• Europe• Asia Pacific• Others, which covers sales of electronic products to the
rest of the world
The Company is domiciled in Bermuda. The results of its revenue from external customers located in North America, Europe, Asia Pacific and elsewhere are set out in the table below.
Each of the above reportable segments primarily derives its revenue from the sale of telecommunication products, electronic learning products and products from contract manufacturing services to customers in the relevant geographical region.
All of these products are manufactured in the Group’s manufacturing facilities located primarily in the People’s Republic of China under the Asia Pacific segment.
For the purposes of assessing segment performance and allocating resources between segments, the Group’s senior executive management monitors the results and assets attributable to each reportable segment on the following bases:
(a) Segment revenues and results
Revenue is allocated to the reportable segments based on the location of external customers. Expenses are allocated to the reportable segments with reference to sales generated by those segments and the expenses incurred by those geographical locations or which otherwise arise from the depreciation or amortisation of assets attributable to those segments.
The measure used for reporting segment profit is operating profit.
In addition to receiving segment information concerning operating profit, management is provided with segment information concerning revenue, depreciation and amortisation and impairment of assets.
(b) Segment assets and liabilities
Segment assets include all tangible and intangible assets and current assets with the exception of deferred tax assets and other corporate assets including taxation recoverable and investments.
Segment liabilities include trade creditors and accruals, provisions and net obligations on defined benefit scheme with the exception of taxation payable.
Notes to the Unaudited Interim Financial Report
10 VTech Holdings Limited 2015/2016 Interim Report
3 Segment Information (continued)
(b) Segment assets and liabilities (continued)
Segment information regarding the Group’s revenue, results, assets and liabilities by geographical market is presented below:
Reportable segment revenueSix months ended 30 September
2015 2014(Unaudited) (Unaudited)US$ million US$ million
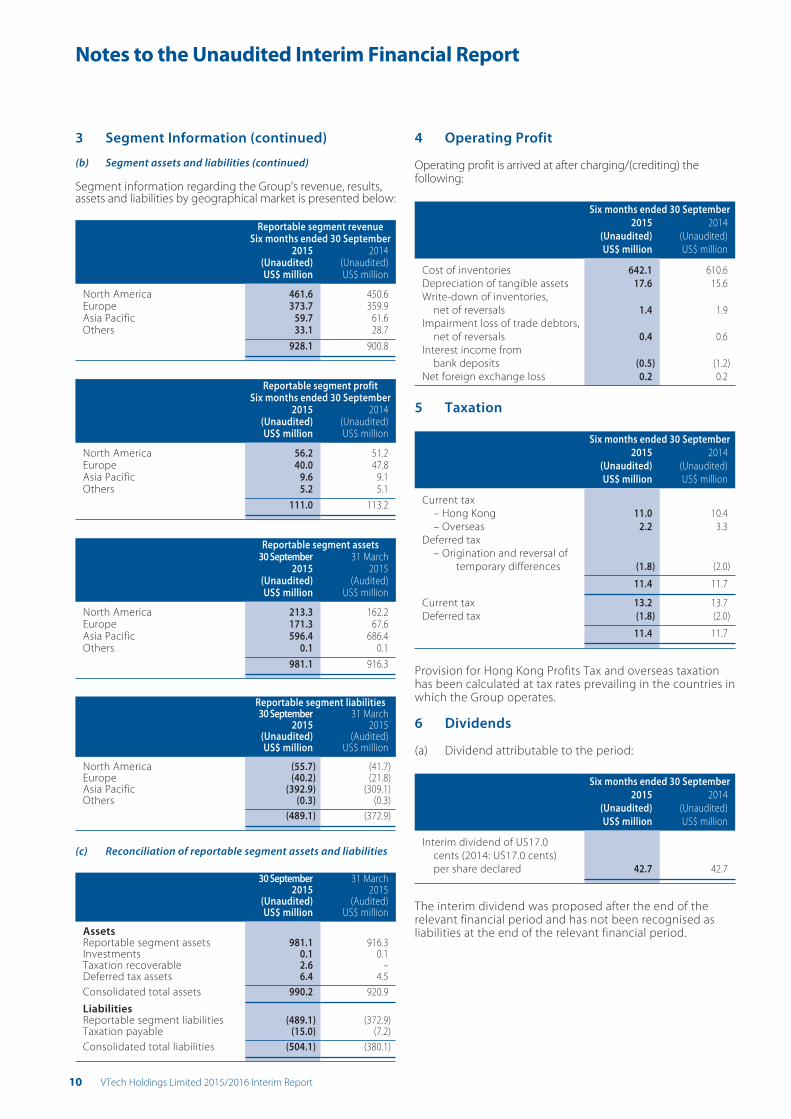
North America 461.6 450.6Europe 373.7 359.9Asia Pacific 59.7 61.6Others 33.1 28.7
928.1 900.8
Reportable segment profitSix months ended 30 September
2015 2014(Unaudited) (Unaudited)US$ million US$ million
North America 56.2 51.2Europe 40.0 47.8Asia Pacific 9.6 9.1Others 5.2 5.1
111.0 113.2
Reportable segment assets30 September 31 March
2015 2015(Unaudited) (Audited)US$ million US$ million
North America 213.3 162.2Europe 171.3 67.6Asia Pacific 596.4 686.4Others 0.1 0.1
981.1 916.3
Reportable segment liabilities30 September 31 March
2015 2015(Unaudited) (Audited)US$ million US$ million
North America (55.7) (41.7)Europe (40.2) (21.8)Asia Pacific (392.9) (309.1)Others (0.3) (0.3)
(489.1) (372.9)
(c) Reconciliation of reportable segment assets and liabilities
30 September 31 March2015 2015
(Unaudited) (Audited)US$ million US$ million
AssetsReportable segment assets 981.1 916.3Investments 0.1 0.1Taxation recoverable 2.6 –Deferred tax assets 6.4 4.5 Consolidated total assets 990.2 920.9
LiabilitiesReportable segment liabilities (489.1) (372.9)Taxation payable (15.0) (7.2) Consolidated total liabilities (504.1) (380.1)
4 Operating Profit
Operating profit is arrived at after charging/(crediting) the following:
Six months ended 30 September
2015 2014
(Unaudited) (Unaudited)
US$ million US$ million
Cost of inventories 642.1 610.6
Depreciation of tangible assets 17.6 15.6
Write-down of inventories,
net of reversals 1.4 1.9
Impairment loss of trade debtors,
net of reversals 0.4 0.6
Interest income from
bank deposits (0.5) (1.2)
Net foreign exchange loss 0.2 0.2
5 Taxation
Six months ended 30 September
2015 2014
(Unaudited) (Unaudited)
US$ million US$ million
Current tax
– Hong Kong 11.0 10.4
– Overseas 2.2 3.3
Deferred tax
– Origination and reversal of
temporary differences (1.8) (2.0)
11.4 11.7
Current tax 13.2 13.7
Deferred tax (1.8) (2.0)
11.4 11.7
Provision for Hong Kong Profits Tax and overseas taxation has been calculated at tax rates prevailing in the countries in which the Group operates.
6 Dividends
(a) Dividend attributable to the period:
Six months ended 30 September
2015 2014
(Unaudited) (Unaudited)
US$ million US$ million
Interim dividend of US17.0
cents (2014: US17.0 cents)
per share declared 42.7 42.7
The interim dividend was proposed after the end of the relevant financial period and has not been recognised as liabilities at the end of the relevant financial period.
Notes to the Unaudited Interim Financial Report
VTech Holdings Limited 2015/2016 Interim Report 11
6 Dividends (continued)
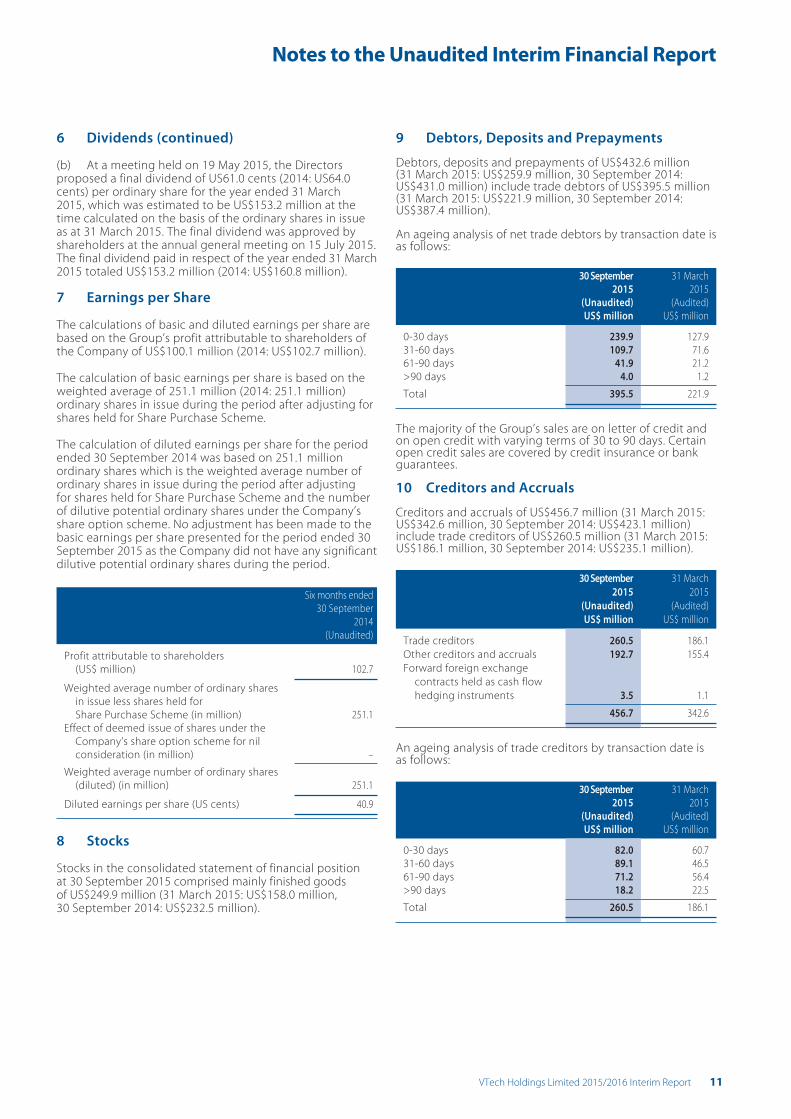
(b) At a meeting held on 19 May 2015, the Directors proposed a final dividend of US61.0 cents (2014: US64.0 cents) per ordinary share for the year ended 31 March 2015, which was estimated to be US$153.2 million at the time calculated on the basis of the ordinary shares in issue as at 31 March 2015. The final dividend was approved by shareholders at the annual general meeting on 15 July 2015. The final dividend paid in respect of the year ended 31 March 2015 totaled US$153.2 million (2014: US$160.8 million).
7 Earnings per Share
The calculations of basic and diluted earnings per share are based on the Group’s profit attributable to shareholders of the Company of US$100.1 million (2014: US$102.7 million).
The calculation of basic earnings per share is based on the weighted average of 251.1 million (2014: 251.1 million) ordinary shares in issue during the period after adjusting for shares held for Share Purchase Scheme.
The calculation of diluted earnings per share for the period ended 30 September 2014 was based on 251.1 million ordinary shares which is the weighted average number of ordinary shares in issue during the period after adjusting for shares held for Share Purchase Scheme and the number of dilutive potential ordinary shares under the Company’s share option scheme. No adjustment has been made to the basic earnings per share presented for the period ended 30 September 2015 as the Company did not have any significant dilutive potential ordinary shares during the period.
Six months ended
30 September
2014
(Unaudited)
Profit attributable to shareholders
(US$ million) 102.7 Weighted average number of ordinary shares
in issue less shares held for
Share Purchase Scheme (in million) 251.1
Effect of deemed issue of shares under the
Company’s share option scheme for nil
consideration (in million) –
Weighted average number of ordinary shares
(diluted) (in million) 251.1 Diluted earnings per share (US cents) 40.9
8 Stocks
Stocks in the consolidated statement of financial position at 30 September 2015 comprised mainly finished goods of US$249.9 million (31 March 2015: US$158.0 million, 30 September 2014: US$232.5 million).
9 Debtors, Deposits and Prepayments
Debtors, deposits and prepayments of US$432.6 million (31 March 2015: US$259.9 million, 30 September 2014: US$431.0 million) include trade debtors of US$395.5 million (31 March 2015: US$221.9 million, 30 September 2014: US$387.4 million).
An ageing analysis of net trade debtors by transaction date is as follows:
30 September
2015
31 March
2015
(Unaudited) (Audited)
US$ million US$ million
0-30 days 239.9 127.9
31-60 days 109.7 71.6
61-90 days 41.9 21.2
>90 days 4.0 1.2
Total 395.5 221.9
The majority of the Group’s sales are on letter of credit and on open credit with varying terms of 30 to 90 days. Certain open credit sales are covered by credit insurance or bank guarantees.
10 Creditors and Accruals
Creditors and accruals of US$456.7 million (31 March 2015: US$342.6 million, 30 September 2014: US$423.1 million) include trade creditors of US$260.5 million (31 March 2015: US$186.1 million, 30 September 2014: US$235.1 million).
30 September
2015
31 March
2015
(Unaudited) (Audited)
US$ million US$ million
Trade creditors 260.5 186.1
Other creditors and accruals 192.7 155.4
Forward foreign exchange
contracts held as cash flow
hedging instruments 3.5 1.1
456.7 342.6
An ageing analysis of trade creditors by transaction date is as follows:
30 September
2015
31 March
2015
(Unaudited) (Audited)
US$ million US$ million
0-30 days 82.0 60.7
31-60 days 89.1 46.5
61-90 days 71.2 56.4
>90 days 18.2 22.5
Total 260.5 186.1

Notes to the Unaudited Interim Financial Report
12 VTech Holdings Limited 2015/2016 Interim Report
11 Share Capital, Share Options and Share Purchase Scheme
(a) Share Capital
30 September
2015
31 March
2015
(Unaudited) (Audited)
US$ million US$ million
Authorised
Ordinary shares: 400,000,000 (31 March 2015: 400,000,000) of US$0.05 each 20.0 20.0
30 September 2015
(Unaudited)
31 March 2015
(Audited)
No. of shares US$ million No. of shares US$ million
Issued and fully paid
Ordinary shares of US$0.05 each:
At the beginning of period/year 251,182,133 12.5 250,872,133 12.5
Shares issued upon exercise of share options – – 310,000 –
At the end of period/year 251,182,133 12.5 251,182,133 12.5
The Company’s issued and fully paid shares as at 30 September 2015 included 42,600 shares (31 March 2015: 74,600 shares) held in trust by the trustee under a share purchase scheme (the “Share Purchase Scheme”) and 9,100 shares (31 March 2015: 17,200 shares) held in trust by the trustee under an Addendum to the Share Purchase Scheme for the eligible French employees of the Group (the “French Subplan”) which were granted to the eligible French employees and remain unvested, details of which are set out in note 11(c).
(b) Share Options
The Company operates a share option scheme (the “Scheme”) approved on 22 July 2011 for the purpose of providing incentives and rewards to eligible participants who contribute to the success of the Group’s operations. Eligible participants of the Scheme include employees and officers of any member of the Group. The maximum number of shares which may be issued upon exercise of all options to be granted under the Scheme adopted by the Company is 24,938,913 shares. Under the Scheme, the Directors may, at their discretion, at any time during 10 years from the date of adoption of the Scheme, invite employees and officers of any member of the Group to subscribe for shares of the Company in accordance with the terms of the Scheme. During the financial period and since the adoption of the Scheme, no options were granted, exercised, cancelled or lapsed under the Scheme.
(c) Share Purchase Scheme
On 30 March 2011 (the “Adoption Date”), the Company adopted the Share Purchase Scheme, which is a share incentive award scheme for the purpose of incentivising employees and attracting suitable personnel for the continuous development of the Group. Eligible participants of the Share Purchase Scheme include Directors, officers and employees of any member of the Group as the Remuneration Committee may determine or approve. The shares to be awarded pursuant to the Share Purchase Scheme (the “Awarded Shares”) will be the existing shares, which will be purchased on the Stock Exchange by the independent trustee with funds provided by the Company, and will be awarded in such manner as the Remuneration Committee may determine or approve. The maximum number of shares that can be held by the trustee under the Share Purchase Scheme is limited to 3% of the issued share capital of the
Company from time to time (excluding shares which have already been transferred to employees on vesting). The Share Purchase Scheme shall be valid and effective for a term of 20 years from the Adoption Date. The Awarded Shares will be granted to the eligible participants subject to the applicable conditions and vesting period as determined by the Remuneration Committee.
On 26 March 2013, the Company further adopted the French Subplan. The Awarded Shares will be granted to the eligible French employees pursuant to the Share Purchase Scheme and the French Subplan. The vesting period applicable under the French Subplan shall not be less than 2 years following the date of the award and a further 2 years sales restriction period as calculated from the date of the Awarded Shares being transferred to the eligible French employees.
On 19 May 2015, the Company further amended and extended the Share Purchase Scheme such that the Company may furnish the trustee of the Share Purchase Scheme with cash to subscribe for new shares under the general mandate of the Company (as approved by the annual general meeting of the Company from time to time) and hold such new shares in trust for the selected participants (not being connected persons of the Company) under the Share Purchase Scheme. During the financial period, no new shares were issued under the general mandate of the Company pursuant to the Share Purchase Scheme.
During the six months ended 30 September 2015, 77,000 shares (30 September 2014: 130,200 shares) were acquired on the Stock Exchange pursuant to the Share Purchase Scheme. The total amount paid to acquire the shares during the financial period was US$1.0 million (30 September 2014: US$1.7 million).
Notes to the Unaudited Interim Financial Report
VTech Holdings Limited 2015/2016 Interim Report 13
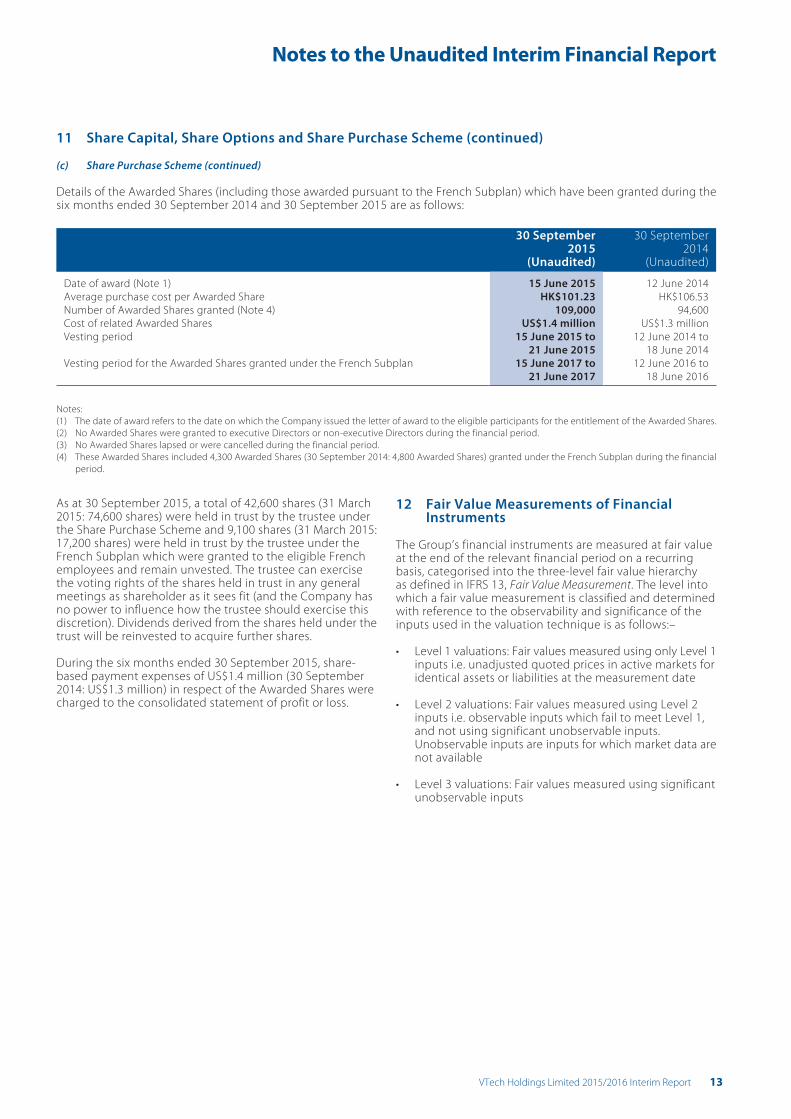
As at 30 September 2015, a total of 42,600 shares (31 March 2015: 74,600 shares) were held in trust by the trustee under the Share Purchase Scheme and 9,100 shares (31 March 2015: 17,200 shares) were held in trust by the trustee under the French Subplan which were granted to the eligible French employees and remain unvested. The trustee can exercise the voting rights of the shares held in trust in any general meetings as shareholder as it sees fit (and the Company has no power to influence how the trustee should exercise this discretion). Dividends derived from the shares held under the trust will be reinvested to acquire further shares.
During the six months ended 30 September 2015, share-based payment expenses of US$1.4 million (30 September 2014: US$1.3 million) in respect of the Awarded Shares were charged to the consolidated statement of profit or loss.
12 Fair Value Measurements of Financial Instruments
The Group’s financial instruments are measured at fair value at the end of the relevant financial period on a recurring basis, categorised into the three-level fair value hierarchy as defined in IFRS 13, Fair Value Measurement. The level into which a fair value measurement is classified and determined with reference to the observability and significance of the inputs used in the valuation technique is as follows:–
• Level 1 valuations: Fair values measured using only Level 1 inputs i.e. unadjusted quoted prices in active markets for identical assets or liabilities at the measurement date
• Level 2 valuations: Fair values measured using Level 2 inputs i.e. observable inputs which fail to meet Level 1, and not using significant unobservable inputs. Unobservable inputs are inputs for which market data are not available
• Level 3 valuations: Fair values measured using significant unobservable inputs
11 Share Capital, Share Options and Share Purchase Scheme (continued)
(c) Share Purchase Scheme (continued)
Details of the Awarded Shares (including those awarded pursuant to the French Subplan) which have been granted during the six months ended 30 September 2014 and 30 September 2015 are as follows:
30 September 2015
30 September 2014
(Unaudited) (Unaudited)
Date of award (Note 1) 15 June 2015 12 June 2014
Average purchase cost per Awarded Share HK$101.23 HK$106.53
Number of Awarded Shares granted (Note 4) 109,000 94,600
Cost of related Awarded Shares US$1.4 million US$1.3 million
Vesting period 15 June 2015 to
21 June 2015
12 June 2014 to
18 June 2014
Vesting period for the Awarded Shares granted under the French Subplan 15 June 2017 to
21 June 2017
12 June 2016 to
18 June 2016
Notes:
(1) The date of award refers to the date on which the Company issued the letter of award to the eligible participants for the entitlement of the Awarded Shares.
(2) No Awarded Shares were granted to executive Directors or non-executive Directors during the financial period.
(3) No Awarded Shares lapsed or were cancelled during the financial period.
(4) These Awarded Shares included 4,300 Awarded Shares (30 September 2014: 4,800 Awarded Shares) granted under the French Subplan during the financial
period.

Notes to the Unaudited Interim Financial Report
14 VTech Holdings Limited 2015/2016 Interim Report
12 Fair Value Measurements of Financial Instruments (continued)
At 30 September 2015, the fair values of the forward foreign exchange contracts included in financial assets and liabilities were US$4.2 million (31 March 2015: US$6.6 million) and US$3.5 million (31 March 2015: US$1.1 million) respectively. At 30 September 2015 and 31 March 2015, the fair values of all forward foreign exchange contracts were categorised as Level 2.
During the six months ended 30 September 2015, there were no transfers between Level 1 and Level 2, or transfers into or out of Level 3 fair value hierarchy classifications.
The fair value of forward foreign exchange contracts in Level 2 is determined by using the forward exchange rates at the end of the relevant financial period and comparing them to the contractual rates.
13 Capital Commitments
30 September
2015
31 March
2015
(Unaudited) (Audited)
US$ million US$ million
Capital commitments for
property, plant and equipment:
Authorised but not
contracted for 5.5 26.3
Contracted but not
provided for 7.2 8.6
12.7 34.9
14 Contingent Liabilities
The Directors have been advised that certain accusations of infringements of patents, trademarks and tradenames have been lodged against the Company and its subsidiaries. In the opinion of the legal counsel, it is too early to evaluate the outcome of these claims and provisions have been made only to the extent that the amounts can be reliably estimated.
Certain subsidiaries of the Group are involved in litigation arising in the ordinary course of their respective business. Having reviewed outstanding claims and taking into account of legal advice received, the Directors are of the opinion that even if the claims are found to be valid, there will be no material adverse effect on the financial position of the Group.
15 Possible Impact of Amendments, New Standards and Interpretations Issued but not yet effective for the Annual Accounting period ending 31 March 2016
Up to the date of the Interim Financial Report, the IASB
has issued a number of amendments, new standards and
interpretations which are not yet effective for the year
ending 31 March 2016 and which have not been adopted in
the Interim Financial Report.
Of these developments, the following relate to matters that
may be relevant to the Group’s operations and financial
statements:
Effective for
accounting
period
beginning on
or after
Annual improvements to IFRSs 2012-2014 cycle 1 January 2016
Amendments to IAS 16, Property, plant and
equipment, and IAS 38, Intangible assets,
Clarification of acceptable methods of
depreciation and amortisation 1 January 2016
IFRS 15, Revenue from contracts
with customers 1 January 2018
IFRS 9, Financial instruments (2014) 1 January 2018
The Group is in the process of making an assessment of the
expected impact of these amendments, new standards and
new interpretations in the period of initial application. So
far, it has concluded that these new and revised IFRSs are
unlikely to have a significant impact on the Group’s results of
operations and financial position.
16 Approval of Interim Financial Report
The Interim Financial Report was approved by the Board on
12 November 2015.

Disclosure of Interests
VTech Holdings Limited 2015/2016 Interim Report 15
Directors’ Interests and Short Positions in Shares, Underlying Shares and Debentures
As at 30 September 2015, the interests and short positions of the Directors and chief executives of the Company in the shares,
underlying shares and debentures of the Company or any of its associated corporations (within the meaning of Part XV of
the Securities and Futures Ordinance (the “SFO”)) as recorded in the register required to be kept by the Company pursuant
to Section 352 of the SFO or otherwise notified to the Company and the Stock Exchange pursuant to the Model Code for
Securities Transactions by Directors of Listed Issuers (the “Model Code”) set out in Appendix 10 to the Listing Rules as adopted
by the Company, were as follows:
Number of ordinary shares Approximate
Name of Director
Personal
interest
Family
interest
Other
interest
Equity
derivatives Total
percentage of
shareholding
Allan WONG Chi Yun 9,654,393 3,968,683 74,101,153
(Note 1)
– 87,724,229 34.92%
PANG King Fai 91,500 – – – 91,500 0.04%
Andy LEUNG Hon Kwong 128,000 – – – 128,000 0.05%
William FUNG Kwok Lun 449,430 – 592,200
(Note 2)
– 1,041,630 0.41%
Michael TIEN Puk Sun – 211,500
(Note 3)
211,500
(Note 3)
– 423,000 0.17%
Patrick WANG Shui Chung 162,000 – – – 162,000 0.06%
Notes:
(1) The shares were beneficially owned as to 1,416,325 shares by Honorex Limited (“Honorex”), as to 65,496,225 shares by Conquer Rex Limited (“Conquer Rex”)
and as to 7,188,603 shares by Twin Success Pacific Limited (“Twin Success”). Conquer Rex was wholly owned by Honorex. Each of Conquer Rex, Honorex and
Twin Success was wholly owned by Surplus Assets Limited (“Surplus Assets”). Surplus Assets was wholly owned by Credit Suisse Trust Limited as the trustee
of The Allan Wong 2011 Trust, a discretionary trust of which Dr. Allan WONG Chi Yun, a Director, was the founder. Surplus Assets was therefore deemed to
have an aggregate indirect interest in 74,101,153 shares and Honorex was also deemed to have an indirect interest in the 65,496,225 shares. Surplus Assets
was wholly owned by Credit Suisse Trust Limited which was deemed to be interested in such shares by virtue of the SFO.
(2) The shares were held by Golden Step Limited which was beneficially owned by Dr. William FUNG Kwok Lun.
(3) The shares were held by Romsley International Limited which was jointly owned by Mr. Michael TIEN Puk Sun and his spouse.
(4) All the interests stated above represented long positions.
(5) The approximate percentage of shareholding is calculated based on 251,182,133 shares of the Company in issue as at 30 September 2015.
Disclosure of Interests
16 VTech Holdings Limited 2015/2016 Interim Report
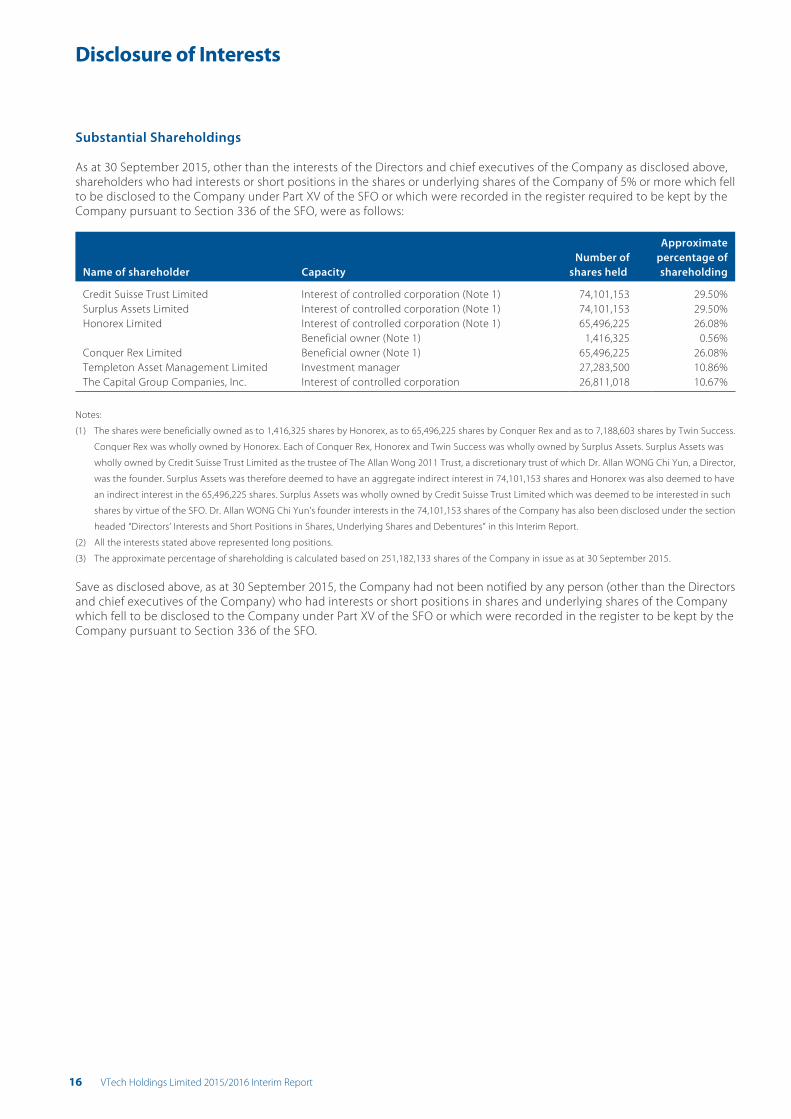
Substantial Shareholdings
As at 30 September 2015, other than the interests of the Directors and chief executives of the Company as disclosed above,
shareholders who had interests or short positions in the shares or underlying shares of the Company of 5% or more which fell
to be disclosed to the Company under Part XV of the SFO or which were recorded in the register required to be kept by the
Company pursuant to Section 336 of the SFO, were as follows:
Name of shareholder Capacity
Number of
shares held
Approximate
percentage of
shareholding
Credit Suisse Trust Limited Interest of controlled corporation (Note 1) 74,101,153 29.50%
Surplus Assets Limited Interest of controlled corporation (Note 1) 74,101,153 29.50%
Honorex Limited Interest of controlled corporation (Note 1) 65,496,225 26.08%
Beneficial owner (Note 1) 1,416,325 0.56%
Conquer Rex Limited Beneficial owner (Note 1) 65,496,225 26.08%
Templeton Asset Management Limited Investment manager 27,283,500 10.86%
The Capital Group Companies, Inc. Interest of controlled corporation 26,811,018 10.67%
Notes:
(1) The shares were beneficially owned as to 1,416,325 shares by Honorex, as to 65,496,225 shares by Conquer Rex and as to 7,188,603 shares by Twin Success.
Conquer Rex was wholly owned by Honorex. Each of Conquer Rex, Honorex and Twin Success was wholly owned by Surplus Assets. Surplus Assets was
wholly owned by Credit Suisse Trust Limited as the trustee of The Allan Wong 2011 Trust, a discretionary trust of which Dr. Allan WONG Chi Yun, a Director,
was the founder. Surplus Assets was therefore deemed to have an aggregate indirect interest in 74,101,153 shares and Honorex was also deemed to have
an indirect interest in the 65,496,225 shares. Surplus Assets was wholly owned by Credit Suisse Trust Limited which was deemed to be interested in such
shares by virtue of the SFO. Dr. Allan WONG Chi Yun’s founder interests in the 74,101,153 shares of the Company has also been disclosed under the section
headed “Directors’ Interests and Short Positions in Shares, Underlying Shares and Debentures” in this Interim Report.
(2) All the interests stated above represented long positions.
(3) The approximate percentage of shareholding is calculated based on 251,182,133 shares of the Company in issue as at 30 September 2015.
Save as disclosed above, as at 30 September 2015, the Company had not been notified by any person (other than the Directors
and chief executives of the Company) who had interests or short positions in shares and underlying shares of the Company
which fell to be disclosed to the Company under Part XV of the SFO or which were recorded in the register to be kept by the
Company pursuant to Section 336 of the SFO.
Corporate Governance
VTech Holdings Limited 2015/2016 Interim Report 17
Corporate Governance Practices
VTech Holdings Limited is incorporated in Bermuda and has its shares listed on the Stock Exchange. The corporate governance rules applicable to the Company are the Corporate Governance Code (the “Code”) set out in Appendix 14 to the Listing Rules. Throughout the six months ended 30 September 2015, the Company has complied with all the code provisions of the Code and to a large extent the recommended best practices in the Code, except for the deviation from code provisions A.2.1 and A.6.7 of the Code as described below.
Under code provision A.2.1 of the Code, the roles of chairman and chief executive should be separate and should not be performed by the same individual. Dr. Allan WONG Chi Yun has the combined role of Chairman and Group Chief Executive Officer. The Board considers that this structure will not impair the balance of power and authority between the Board and the management of the Company and its subsidiaries (the “Group”) as independent non-executive Directors form the majority of the Board, with four out of seven of the Directors being independent non-executive Directors. The Board believes the appointment of Dr. Allan WONG Chi Yun to the combined role of Chairman and Group Chief Executive Officer is beneficial to the Group as he has considerable industry experience.
Under code provision A.6.7 of the Code, independent non-executive directors should attend general meetings and develop a balanced understanding of the views of shareholders. Dr. Patrick WANG Shui Chung was unable to attend the annual general meeting of the Company held on 15 July 2015 due to his other prior business engagement. However, the Board believes that the presence of other independent non-executive Directors at such general meetings has allowed the Board to develop a balanced understanding of the views of shareholders.
The Board has established an Audit Committee, a Nomination Committee, a Remuneration Committee, and a Risk Management and Sustainability Committee with defined terms of reference which are no less exacting than those set out in the Code. Corporate governance practices adopted by the Company during the six months ended 30 September 2015 are in line and consistent with those practices set out in the Company’s 2015 Annual Report.
Model Code of Securities Transactions
The Company has adopted the Model Code set out in Appendix 10 to the Listing Rules regarding securities transactions by Directors and senior management. After specific enquiry, all Directors confirmed that they have complied with the required standard of dealings set out in the Model Code throughout the six months ended 30 September 2015.
Audit Committee
The Audit Committee is chaired by Mr. WONG Kai Man with Dr. William FUNG Kwok Lun and Mr. Michael TIEN Puk Sun as members. All of the members are independent non-executive Directors. It has been established to assist the Board in fulfilling its overseeing responsibilities for financial reporting, risk management, corporate governance functions and evaluation of internal controls and auditing processes. It also ensures that the Group complies with all applicable laws and regulations.
Mr. WONG Kai Man, as the chairman of the Audit Committee, has the appropriate financial management expertise as required under the Listing Rules. The Audit Committee has held two meetings during the financial period and up to the date of this Interim Report. In addition to the Audit Committee members, the meetings were attended by the Group Chief Executive Officer, the Chief Compliance Officer, the Chief Financial Officer and the external auditor. The work performed by the Audit Committee during the financial period and up to the date of this Interim Report included, but not limited to, reviewing the following:
– audited Group’s consolidated financial statements and reports for the year ended 31 March 2015;
– report from the external auditor for the year ended 31 March 2015;
– unaudited Group Interim Financial Report for the six months ended 30 September 2015;
– report from the external auditor based on limited agreed-upon procedures on the unaudited Group Interim Financial Report for the six months ended 30 September 2015;
– accounting principles and practices adopted by the Group;– appointment of the external auditor and its remuneration;– significant findings by the Internal Audit Department and
recommendations for corrective actions;– reports made under the Whistleblowing Policy;– respective audit plans of the internal and external auditors;– revised Audit Committee Charter; and– training and continuous professional development of
Directors and senior management.
In addition to the above, the Audit Committee assists the Board in meeting its responsibilities for maintaining an effective system of internal control during the financial period. It reviews the process by which the Group evaluates its control environment and risk assessment procedures, and the way in which business and control risks are managed. Based on the information received from the management, the external auditor and the Internal Audit Department, the Audit Committee is satisfied that the overall financial and operational controls for the Group continue to be effective and adequate.
The Audit Committee has also been given the responsibility to oversee the effectiveness of formal procedures for employees to raise any matters of serious concerns and is required to review any reports made by the Internal Audit Department regarding this.
Risk Management and Sustainability Committee
The Risk Management and Sustainability Committee is chaired by Dr. Allan WONG Chi Yun with Dr. PANG King Fai, Mr. Andy LEUNG Hon Kwong, Mr. WONG Kai Man, Ms. Shereen TONG Ka Hung (appointed on 12 May 2015) and Mr. CHANG Yu Wai (appointed on 12 May 2015) as members. It is responsible for monitoring and reviewing the risk management and sustainability strategies of the Group.
The Risk Management and Sustainability Committee has held two meetings during the financial period and up to the date of this Interim Report to review the Group’s risk management, internal control systems, and sustainability strategies, policies and improvement activities.
The Risk Management and Sustainability Committee has developed a framework for the management and control of risks in the Group. Risks are being more formally identified and recorded in a Risk Register for key operations. This Risk Register is updated regularly and the major risks are being reviewed from time to time by the Risk Management and Sustainability Committee.
The Risk Management and Sustainability Committee ensures that any new and emerging risks are promptly identified, evaluated and appropriate actions are taken by the management. This requires the active and frequent participation by the process owner of each function in identifying risks affecting its business and implementing measures to reduce such risks, as well as the active monitoring on the progress of the improvement in internal control procedures.
The Risk Management and Sustainability Committee also provides vision and strategic direction for our sustainability activities, reviews our sustainability strategies and improvement activities, assesses how the policies are implemented in achieving the sustainability goals and targets, and monitors the performance progress on a biannual basis. During the financial period and up to the date of this Interim Report, it has determined the scope of the Company’s annual Sustainability Report and reviewed the Company’s 2015 Sustainability Report, which informs our stakeholders of our sustainability strategies and activities, and the performance progress against our sustainability targets.
Other Information
18 VTech Holdings Limited 2015/2016 Interim Report
Interim Dividend
The Board has declared an interim dividend (the “Interim
Dividend”) of US17.0 cents per ordinary share in respect
of the six months ended 30 September 2015, payable on
21 December 2015 to shareholders whose names appear
on the register of members of the Company as at the close
of business on 9 December 2015.
The Interim Dividend will be payable in United States dollars
save that those shareholders with a registered address in
Hong Kong will receive an equivalent amount in Hong Kong
dollars which will be calculated at the rate of exchange as
quoted to the Company by The Hongkong and Shanghai
Banking Corporation Limited at its middle rate of exchange
prevailing on 9 December 2015.
Closure of Register of Members
The register of members of the Company will be closed
on 9 December 2015, during which no transfer of shares
will be effected.
In order to qualify for the Interim Dividend, all transfer
documents, accompanied by the relevant share certificates,
must be lodged with the share registrars of the Company
for registration no later than 4:30 p.m. (the local time of the
relevant share registrar) on Tuesday, 8 December 2015.
The principal registrar is MUFG Fund Services (Bermuda)
Limited, The Belvedere Building, 69 Pitts Bay Road, Pembroke
HM08, Bermuda and the branch registrar in Hong Kong is
Computershare Hong Kong Investor Services Limited, Shops
1712-16, 17th Floor, Hopewell Centre, 183 Queen’s Road East,
Wan Chai, Hong Kong.
Review of Interim Financial Report
The Group’s Interim Financial Report for the six months
ended 30 September 2015 has been reviewed by the
Audit Committee.
Purchase, Sale or Redemption of Listed Shares
The Company and its subsidiaries have not redeemed any
of its shares during the six months ended 30 September
2015. Neither the Company nor any of its subsidiaries has
purchased or sold any of the Company’s shares during
the financial period, except that the trustee of the Share
Purchase Scheme, pursuant to the rules and trust deed of the
Share Purchase Scheme, purchased on the Stock Exchange a
total of 77,000 Company’s shares at a consideration of
US$1.0 million.
Changes to Information in respect of Directors
In accordance with Rule 13.51B(1) of the Listing Rules, the
changes to information required to be disclosed by Directors
pursuant to paragraphs (a) to (e) and (g) of Rule 13.51(2) of
the Listing Rules are set out below:
– Dr. William FUNG Kwok Lun resigned as a director of
Fung Global Institute with effect from 1 July 2015.
– Mr. WONG Kai Man has been appointed as a member
of the Advisory Board of the Asian Global Institute
established by The University of Hong Kong for a term
of three years commencing 1 July 2015.

Corporate Information
VTech Holdings Limited 2015/2016 Interim Report 19
Board of Directors
Executive Directors
Allan WONG Chi Yun
(Chairman and Group Chief Executive Officer)
PANG King Fai
Andy LEUNG Hon Kwong
Independent Non-executive Directors
William FUNG Kwok Lun
Michael TIEN Puk Sun
Patrick WANG Shui Chung
WONG Kai Man
Audit Committee
WONG Kai Man (Chairman)
William FUNG Kwok Lun
Michael TIEN Puk Sun
Nomination Committee
William FUNG Kwok Lun (Chairman)
Michael TIEN Puk Sun
Patrick WANG Shui Chung
WONG Kai Man
Allan WONG Chi Yun
Remuneration Committee
Michael TIEN Puk Sun (Chairman)
William FUNG Kwok Lun
WONG Kai Man
Risk Management and Sustainability Committee
Allan WONG Chi Yun (Chairman)
PANG King Fai
Andy LEUNG Hon Kwong
WONG Kai Man
Shereen TONG Ka Hung (appointed on 12 May 2015)
CHANG Yu Wai (appointed on 12 May 2015)
Company Secretary
CHANG Yu Wai
Registered Office
Clarendon House
2 Church Street
Hamilton HM 11
Bermuda
Principal Office
23rd Floor, Tai Ping Industrial Centre, Block 1
57 Ting Kok Road
Tai Po, New Territories
Hong Kong
Principal Bankers
The Hongkong and Shanghai Banking Corporation Limited
Standard Chartered Bank (Hong Kong) Limited
The Bank of East Asia, Limited
Auditor
KPMG
Certified Public Accountants
Information for Shareholders
20 VTech Holdings Limited 2015/2016 Interim Report
Listing
Shares of VTech Holdings Limited are listed on The Stock
Exchange of Hong Kong Limited. It is a constituent of the
Hang Seng High Dividend Yield Index.
Stock Code
The Stock Exchange of Hong Kong Limited: 303
Financial Calendar
Closure of Register of Members: 9 December 2015
Payment of Interim Dividend: 21 December 2015
FY2016 Annual Results Announcement: May 2016
Share Information
Board lot: 100 shares
Issued shares as at 30 September 2015: 251,182,133 shares
Dividend
Dividend per ordinary share for the six months ended
30 September 2015: US17.0 cents per share
Share Registrars
PrincipalMUFG Fund Services (Bermuda) Limited
The Belvedere Building
69 Pitts Bay Road
Pembroke HM08
Bermuda
Hong Kong BranchComputershare Hong Kong Investor Services Limited
Shops 1712-16, 17th Floor, Hopewell Centre
183 Queen’s Road East, Wan Chai
Hong Kong
Tel: (852) 2862 8628
Fax: (852) 2865 0990
Email: [email protected]
Investor Relations Contact
Corporate Marketing Department
23rd Floor, Tai Ping Industrial Centre, Block 1
57 Ting Kok Road
Tai Po, New Territories
Hong Kong
Tel: (852) 2680 1000
Fax: (852) 2680 1788
Email: [email protected]
Website
www.vtech.com/en/investors
香港新界大埔汀角路 57號太平工業中心第 1期 23樓電話:(852) 2680 1000 傳真:(852) 2680 1300電郵:[email protected]
(於百慕達註冊成立之有限公司)
23rd Floor, Tai Ping Industrial Centre, Block 157 Ting Kok Road, Tai Po, New Territories, Hong KongTel: (852) 2680 1000 Fax: (852) 2680 1300Email: [email protected]
(Incorporated in Bermuda with limited liability)