Embed Size (px)
Citation preview
© Z/Yen Group 2017
The Z/Yen Group 41 Lothbury London EC2R 7HG United Kingdom tel: +44 (20) 7562 9562 www.longfinance.net
GFCI 22 Global Launch – Chengdu 11 September 2017
Professor Michael Mainelli
The Global
Financial Centres
Index 22

© Z/Yen Group 2017
Z/Yen Research Financial Centres

© Z/Yen Group 2017
ةيمالعال ةيالمال زكارمال رشؤم
Índice de Centros Financieros Globales
Indice dei Centri Financieri Globali
Indice Globale Centri Finanziari
Indice des Centres Financiers Globaux
世界的な金融
センターインデックス
Σφαιρικός οικονομικός κεντρικός δείκτης
Глобальный индекс финансовых центров
Wskaźnik Globalnych Finansowych Centrów
Индекс на Световните Финансови Центрове
Goelydh Nírnaeth Arnoediad Blebithar
Globaler Finanzzentrenindex
全球金融中心指数
全(quán) 球(qiú) 金(jīn) 融(róng) 中(zhōng) 心(xīn) 指(zhǐ) 数(shù)
A Global Phenomenon

© Z/Yen Group 2017
GFCI To Date
3,159 Respondents
23,812 Assessments
Edition Date Respondents Assessments
GFCI 1 Mar 2007 491 3,992
GFCI 2 Sep 2007 825 11,685
GFCI 3 Mar 2008 1,236 18,878
GFCI 4 Sep 2008 1,406 24,014
GFCI 5 Mar 2009 1,455 26,629
GFCI 6 Sep 2009 1,805 31,497
GFCI 7 Mar 2010 1,690 30,170
GFCI 8 Sep 2010 1,876 29,044
GFCI 9 Mar 2011 1,970 27,995
GFCI 10 Sep 2011 1,887 26,604
GFCI 11 Mar 2012 1,778 26,853
GFCI 12 Sep 2012 1,890 24,780
GFCI 13 Mar 2013 2,307 23,043
GFCI 14 Sep 2013 2,786 25,749
GFCI 15 Mar 2014 3,246 25,441
GFCI 16 Sep 2014 3,633 29,226
GFCI 17 Mar 2015 3,527 28,494
GFCI 18 Sep 2015 3,194 28,676
GFCI 19 Mar 2016 2,765 28,734
GFCI 20 Sep 2016 2,493 23,006
GFCI 21 Mar 2017 3,008 23,406
GFCI 22 Sep 2017 3,159 23,812

© Z/Yen Group 2017
The GFCI Process
GFCI 22 uses 23,812 assessments from 3,159
respondents
GFCI 22 uses 102 Instrumental
Factors
Factor of CompetitivenessInstrumental Factor
Instrumental Factor
Instrumental Factor
Instrumental Factor
Instrumental Factor
Factor of Competitiveness
Factor of Competitiveness
Factor of Competitiveness
Factor of Competitiveness
Financial Centre Assessments from
Online Questionnaire
Instrumental Factor Updates
Change in Financial Centre Assessments
Instrumental Factor Prediction Engine (SVM)
UpdatedGFCI

© Z/Yen Group 2017
Respondents
Industry SectorNumber of
Respondents
Banking 637
Finance 87
Government & Regulatory 84
Insurance 157
Investment 293
Professional Services 378
Trade Association 66
Trading 123
Other 233
Total 2,058
Size of OrganisationNumber of
Respondents
Fewer than 100 413
100 to 500 260
500 to 1,000 204
1,000 to 2,000 170
2,000 to 5,000 173
More than 5,000 823
Other 15
Total 2,058
RegionNumber of
Respondents
Western Europe 491
Asia/Pacific 987
North America 225
Middle East & Africa 93
Eastern Europe & Central Asia 82
Latin America & the Caribbean 50
Other 130
Total 2,058

© Z/Yen Group 2017
Headlines – Top 25 Change in Change in
Rank Rating Rank Rating Rank Rating
London 1 780 1 782 0 ▼2
New York 2 756 2 780 0 ▼24
Hong Kong 3 744 4 755 ▲1 ▼11
Singapore 4 742 3 760 ▼1 ▼18
Tokyo 5 725 5 740 0 ▼15
Shanghai 6 711 13 715 ▲7 ▼4
Toronto 7 710 10 719 ▲3 ▼9
Sydney 8 707 8 721 0 ▼14
Zurich 9 704 11 718 ▲2 ▼14
Beijing 10 703 16 710 ▲6 ▼7
Frankfurt 11 701 23 698 ▲12 ▲3
Montreal 12 697 14 713 ▲2 ▼16
Melbourne 13 696 21 702 ▲7 ▼6
Luxembourg 14 695 18 708 ▲4 ▼13
Geneva 15 694 20 704 ▲5 ▼10
San Francisco 16 693 6 724 ▼10 ▼31
Vancouver 17 692 17 709 0 ▼17
Dubai 18 691 25 696 ▲7 ▼5
Boston 19 690 9 720 ▼10 ▼30
Shenzhen 20 689 22 701 ▲2 ▼12
Osaka 21 688 15 712 ▼6 ▼24
Seoul 22 686 24 697 ▲2 ▼11
Los Angeles 23 683 19 705 ▼4 ▼22
Chicago 24 683 7 723 ▼17 ▼40
Abu Dhabi 25 682 28 680 ▲3 ▲2
CentreGFCI 21GFCI 22

© Z/Yen Group 2017
Headlines - Regions
The mean of the top five centres by region. North America and Western Europe are now behind Asia/Pacific.
375
425
475
525
575
625
675
725
775
Asia/Pacific
Western Europe
North America
Middle East & Africa
Latin America & the Caribbean
Eastern Europe and Central Asia

© Z/Yen Group 2017
600
650
700
750
800
850
London
New York
Hong Kong
Singapore
Tokyo
New York, London, Hong Kong, and Singapore remain the five leading global financial centres despite falling in the ratings.
Headlines – Top Five
New York / London Trend
Hong Kong / Singapore Trend

© Z/Yen Group 2017
Headlines – Asia Pacific
Change in Change in
Rank Rating Rank Rating Rank Rating
Hong Kong 3 744 4 755 ▲1 ▼11
Singapore 4 742 3 760 ▼1 ▼18
Tokyo 5 725 5 740 0 ▼15
Shanghai 6 711 13 715 ▲7 ▼4
Sydney 8 707 8 721 0 ▼14
Beijing 10 703 16 710 ▲6 ▼7
Melbourne 14 696 21 702 ▲7 ▼6
Shenzhen 20 689 22 701 ▲2 ▼12
Osaka 21 688 15 712 ▼6 ▼24
Seoul 22 686 24 697 ▲2 ▼11
Taipei 27 677 26 689 ▼1 ▼12
Guangzhou 32 668 37 650 ▲5 ▲18
Wellington 38 661 New New New New
Qingdao 47 649 38 649 ▼9 0
Kuala Lumpur 55 640 35 659 ▼20 ▼19
Mumbai 60 635 63 612 ▲3 ▲23
Bangkok 61 634 36 656 ▼25 ▼22
Jakarta 62 633 67 608 ▲5 ▲25
Manila 66 629 65 610 ▼1 ▲19
Busan 70 625 50 626 ▼20 ▼1
Chengdu 86 604 New New New New
Dalian 92 595 75 597 ▼17 ▼2
GFCI 21Centre
GFCI 22

© Z/Yen Group 2017
Headline Findings – Asia Pacific
450
500
550
600
650
700
750
800
Hong Kong
Singapore
Tokyo
Shanghai
Sydney

© Z/Yen Group 2017
Western Europe

© Z/Yen Group 2017
North America
520
570
620
670
720
770
820
New York
Toronto
Montreal
San Francisco
Vancouver
Change in Change in
Rank Rating Rank Rating Rank Rating
New York 2 756 2 780 0 ▼24
Toronto 7 710 10 719 ▲3 ▼9
Montreal 12 697 14 713 ▲2 ▼16
San Francisco 16 693 6 724 ▼10 ▼31
Vancouver 17 692 17 709 0 ▼17
Boston 19 690 9 720 ▼10 ▼30
Los Angeles 23 683 19 705 ▼4 ▼22
Chicago 24 683 7 723 ▼17 ▼40
Washington DC 28 676 12 716 ▼16 ▼40
Calgary 71 624 49 627 ▼22 ▼3
GFCI 21Centre
GFCI 22

© Z/Yen Group 2017
Eastern Europe & Central Asia
Change in Change in
Rank Rating Rank Rating Rank Rating
Warsaw 36 664 41 645 ▲5 ▲19
Tallinn 44 653 42 640 ▼2 ▲13
Riga 53 642 45 631 ▼8 ▲11
Prague 58 637 69 606 ▲11 ▲31
Budapest 72 623 70 604 ▼2 ▲19
Cyprus 76 619 79 590 ▲3 ▲29
Istanbul 78 617 66 609 ▼12 ▲8
Almaty 80 615 80 589 0 ▲26
Athens 84 611 88 522 ▲4 ▲89
St Petersburg 87 603 86 565 ▼1 ▲38
Moscow 89 601 85 566 ▼4 ▲35
GFCI 21Centre
GFCI 22
300
350
400
450
500
550
600
650
700
Warsaw
Tallinn
Riga
Prague
Budapest

© Z/Yen Group 2017
Middle East & Africa
400
450
500
550
600
650
700
750
Dubai
Abu Dhabi
Tel Aviv
Casablanca
Doha
Change in Change in
Rank Rating Rank Rating Rank Rating
Dubai 18 691 25 696 ▲7 ▼5
Abu Dhabi 25 682 28 680 ▲3 ▲2
Tel Aviv 34 666 32 666 ▼2 0
Casablanca 35 665 30 674 ▼5 ▼9
Doha 45 651 39 648 ▼6 ▲3
Johannesburg 48 648 59 616 ▲11 ▲32
Bahrain 51 645 57 618 ▲6 ▲27
Mauritius 69 626 71 603 ▲2 ▲23
Riyadh 77 618 76 596 ▼1 ▲22
GFCI 21Centre
GFCI 22

© Z/Yen Group 2017
Latin America & The Caribbean Change in Change in
Rank Rating Rank Rating Rank Rating
Bermuda 29 673 34 660 ▲5 ▲13
Cayman Islands 31 671 31 670 0 ▲1
British Virgin Islands 37 663 51 625 ▲14 ▲38
Sao Paulo 63 632 62 613 ▼1 ▲19
Trinidad and Tobago 65 630 60 615 ▼5 ▲15
Mexico City 73 622 61 614 ▼12 ▲8
Bahamas 81 614 83 582 ▲2 ▲32
Rio de Janeiro 82 613 73 599 ▼9 ▲14
Panama 88 602 84 580 ▼4 ▲22
Buenos Aires 90 600 New New New New
GFCI 21Centre
GFCI 22
400
450
500
550
600
650
700
Bermuda
Cayman Islands
British Virgin Islands
Sao Paulo
Trinidad and Tobago

© Z/Yen Group 2017
A Recognised Taxonomy
Business Environment
Human Capital InfrastructureFinancial Sector Development
Reputation
Areas of Competitiveness
Political Stability
and Rule of Law
Institutional and Regulatory
Environment
Macroeconomic Environment
Tax and Cost Competitiveness
Availability of Skilled Personnel
Flexible Labour Market
Education and Development
Quality of Life
Built Infrastructure
ICT Infrastructure
Transport Infrastructure
Sustainable Development
Depth and Breadth of
Industry Clusters
Availability of Capital
Market Liquidity
Economic Output
City Brand and Appeal
Level of Innovation
Attractiveness and Cultural
Diversity
Comparative Positioning with Other Centres

© Z/Yen Group 2017
Profiles – Global Centres
Global Leaders Global Diversified Global Specialists Global Contenders
Abu Dhabi Amsterdam Luxembourg Qingdao
Bei jing Dubl in Shenzhen
Dubai Moscow
Frankfurt Washington DC
Geneva
Hong Kong
London
New York
Paris
Shanghai
Singapore
Sydney
Tokyo
Toronto
Zurich

© Z/Yen Group 2017
Profiles – International Centres
Established International International Diversified International Specialists International Contenders
Boston Bangkok Bri tish Virgin Is lands Almaty
Chicago Brussels Casablanca Bahamas
Johannesburg Busan Cayman Is lands Doha
Los Angeles Copenhagen Dal ian Gibra l tar
Melbourne Edinburgh Guangzhou Is le of Man
Montreal Is tanbul Jersey
San Francisco Kuala Lumpur
Seoul Madrid
Stockholm Milan
Vancouver Munich
Rome

© Z/Yen Group 2017
Profiles – Local Centres
Established Players Local Diversified Local Specialists Evolving Centres
Hamburg Athens Bermuda Bahrain
Osaka Budapest Chengdu Buenos Aires
Prague Calgary Guernsey Cyprus
Tal l inn Glasgow Liechtenstein Jakarta
Tel Aviv Hels inki Riga Malta
Vienna Lisbon Taipei Mani la
Warsaw Mexico Ci ty Trinidad and Tobago Mauritius
Wel l ington Os lo Monaco
Rio de Janeiro Mumbai
Sao Paulo Panama
Reykjavik
Riyadh
St Petersburg
• ‘Local’ – connectivity with other centres based on the number and origin of assessments (205 valid
assessments received)
• ‘Not ‘Diverse’ – insufficiently diverse (Shannon, Simpson, and Gini indices) in different sectors
• ‘Not ‘Specialist’ – insufficient ratings by any one sector to be a ‘specialist’

© Z/Yen Group 2017
What’s On People’s Minds
© Z/Yen Group 2017
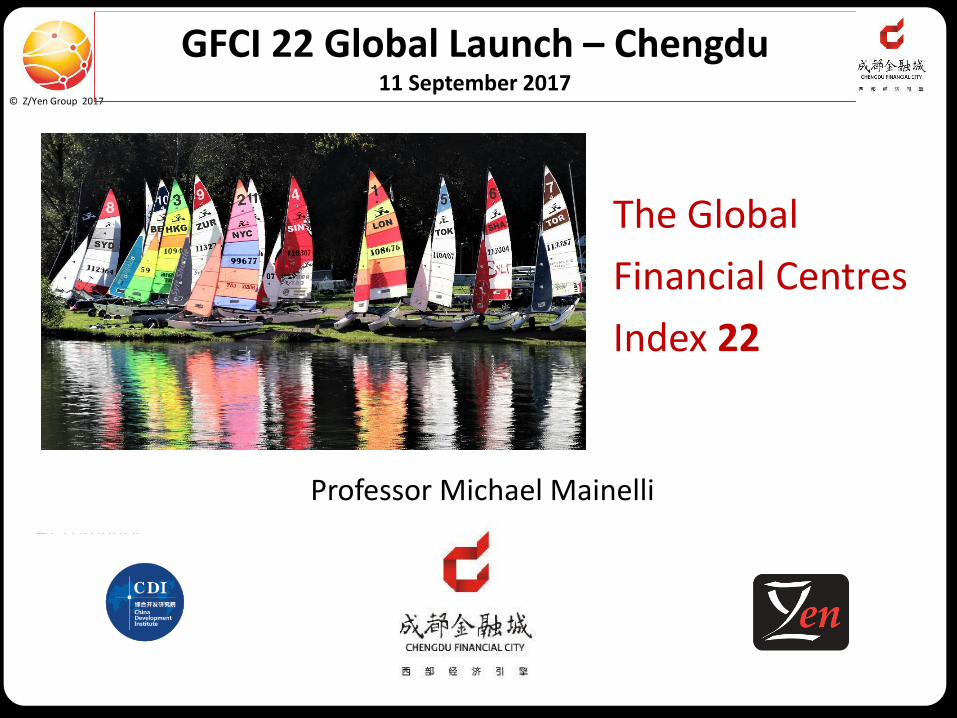
-150 -100 -50 0 50 100 150
Regional Balance
Chengdu
-150 -100 -50 0 50 100 150
-
London
Western Europe (-)
North America (10%)
Latin America and the Caribbean (5%)
Asia / Pacific (65%)
Multi-Regional (-)
Middle East and Africa (10%)
Eastern Europe and Central Asia (10%)
2/3 of respondents from home region

© Z/Yen Group 2017
Greater Significance
Six of the top Ten are Asian
Centre Mentions in last 24 months
Shanghai 97
Qingdao 95
Singapore 45
Dublin 32
Casablanca 26
Shenzhen 26
Frankfurt 24
Hong Kong 23
Chengdu 21
GIFT 20
New York 14
Seoul 14
Beijing 13
Luxembourg 12
Toronto 12
(Gugerat)

© Z/Yen Group 2017
Reputational ‘Advantage’
CentreWeighted Average
Assessment
GFCI 22
Rating
GFCI 22 Reputational
Advantage
Qingdao 795 649 146
New York 867 756 111
Singapore 851 742 109
Hong Kong 830 744 86
Tokyo 809 725 84
Washington DC 753 676 77
Chengdu 680 604 76
Sydney 782 707 75
London 852 780 72
Boston 762 690 72
Shenzhen 759 689 70
Shanghai 779 711 68
San Francisco 758 693 65
Chicago 745 683 62
Zurich 758 704 54

© Z/Yen Group 2017
Stability
London
New York
Hong Kong
Singapore
Tokyo
Shanghai
Toronto
Sydney
Zurich
Beijing
Frankfurt
MontrealMelbourne
Luxembourg
Geneva
San Francisco
Vancouver
Dubai
Boston
Shenzhen
Osaka
Seoul
Los Angeles
Chicago
Abu Dhabi
Paris
Taipei
Washington DC
Bermuda
Dublin
Cayman Islands
Guangzhou
Amsterdam
Casablanca
Warsaw
British Virgin Islands
Wellington
Stockholm
Jersey
Increasing Sensitivity to Instrumental Factors
Incr
easi
ng
Var
ian
ce o
f A
sses
smen
ts
Chengdu

© Z/Yen Group 2017
Factors of Competitiveness
620
630
640
650
660
670
680
690
700
710
720
1
22
43
64
85
10
6
12
7
14
8
16
9
19
0
21
1
23
2
25
3
27
4
29
5
31
6
33
7
35
8
37
9
40
0
42
1
44
2
46
3
48
4
50
5
52
6
54
7
56
8
58
9
61
0
63
1
65
2
67
3
69
4
71
5
73
6
75
7
77
8
79
9
82
0
84
1
86
2
88
3
90
4
92
5
94
6
96
7
98
8
GFC
I R
atin
g
1,000 Step Changes in Instrumental Factors
Business Environment
Reputation
Infrastructure
Financial Sector Development
Human Capital
All Factors
Chengdu

© Z/Yen Group 2017
Busan – building on specialist strengths, e.g. maritime
Caribbean – tax, citizenship
Casablanca - old airfield in the city centre
Dubai - a separate delineated zone, a different jurisdiction
Dublin – International Financial Centre, IFS2020, diaspora
Jersey – active reputation management
Luxembourg - FLAG
Malta – leading on EU regulations, citizenship
Milan – finance zone, repeal of FTT, common law, tax holiday for people
Seoul - a programme of internationalisation
Toronto, Montreal, Monaco – university and institute leadership, several – financial training institutes
Zurich/Geneva - women are a great strength in the labour force
Offshore centres - cross-recognition, e.g. legal, can bring business; moving from taxation simplicity to deal facilitation
Tourism-led – yachts, safaris, air travel
Financial Centre Initiatives

© Z/Yen Group 2017
Five Truths
♦ You can’t be an international centre
without international people
♦ Successful people want to live in
successful places
♦ Successful places are cosmopolitan
♦ Reputation is vital: “20 years to build a
reputation and five minutes to ruin it.”
♦ Trust is “the glue that holds all
relationships together”

© Z/Yen Group 2017
One True Strategy For Success
“Treat All Comers Fairly”

© Z/Yen Group 2017
GFCI 23 – March 2018
Participate yourself at:
www.globalfinancialcentres.net