Embed Size (px)
Citation preview
449
2. Case Study II
22..11 CCeelllluullaarr PPhhoonnee WWaassttee CCoolllleeccttiioonn
22..11..11 EExxeeccuuttiivvee SSuummmmaarryy
The Cellular Phone Waste Collection Case Study has two main objectives, namely to increase public awareness on proper disposal of cell phone waste and to assess the feasibility of collection in shops or drop-off points. This study sought to establish baseline data on collection volumes and rates as an estimation of public response to such collection efforts.
The case study had a six-month implementation period, spanning from June to December 2007, which eventually extended to mid-January of 2008. This six-month period was inclusive of planning, development stages and program execution. It involved the participation of six institutions and government agencies, all three network service providers, six major mobile phone manufacturers, three commercial establishments and an accredited treatment-storage-disposal facility for electronic waste. Actual collection and monitoring under this case study was done for a four-month period, which started with a formal launching on Sept. 14, 2007 at the Dusit Hotel, and ended on Jan. 9, 2008. As of now however, bins for cell phone waste collection are still deployed at the malls for continuity of collection even after the case study.
Collection was primarily implemented in three Metro Manila cities, particularly only within identified areas of the following three malls: Glorietta and Greenbelt under the Ayala Malls (Makati City); SM Megamall (Mandaluyong City); and Greenhills Shopping Center (San Juan City). Six collection bins were positioned within each of the three malls, with four of these deployed to shops of network service providers -- Smart and Sun Cellular. This totals to eighteen bins deployed in commercial establishments. Collection was also implemented within two government offices, namely the Department of Trade and Industry - Board of Investments building located along Sen. Gil Puyat Ave., Makati City, and the Department of Environment and Natural Resources compound along Visayas Ave., Quezon City. These two offices had one bin each, generally located in the lobby or first floor of the building.
Over the 4-month collection period, a total of 9,514 pieces of cell phone waste amounting to 280.75 kilograms were collected in the 20 bins. The total potential value of collected waste from the case study would amount to more than PhP 1,900. While dismantling and treatment costs under current systems in the Philippines would amount to around PhP 2,500 for the collected waste during the past four months, the difference is manageable and can be greatly reduced with expanded geographical coverage. Furthermore, ecological and potential health benefits of proper disposal and waste diversion greatly outweigh the incurred cost.
This Case Study led to several milestones in addressing the problem of increasing cell phone waste. It established baseline public participation and collection rates given minimal interventions and developed IEC materials and a blueprint for bins that entice participation without sacrificing
450
functionality. A monitoring and collection protocol was devised and tested and preliminary values and costs with respect to program sustainability were established. Most significantly, it showed that a joint collection program by the government and the private sector, composed of stakeholders within the highly competitive communications industry, is possible.
22..22 FFrraammeewwoorrkk aanndd CCoonntteexxtt
22..22..11 BBaacckkggrroouunndd aanndd RRaattiioonnaallee
(1) Electronic Waste Situation in the Philippines
1) The Growth of the Mobile Phone Industry
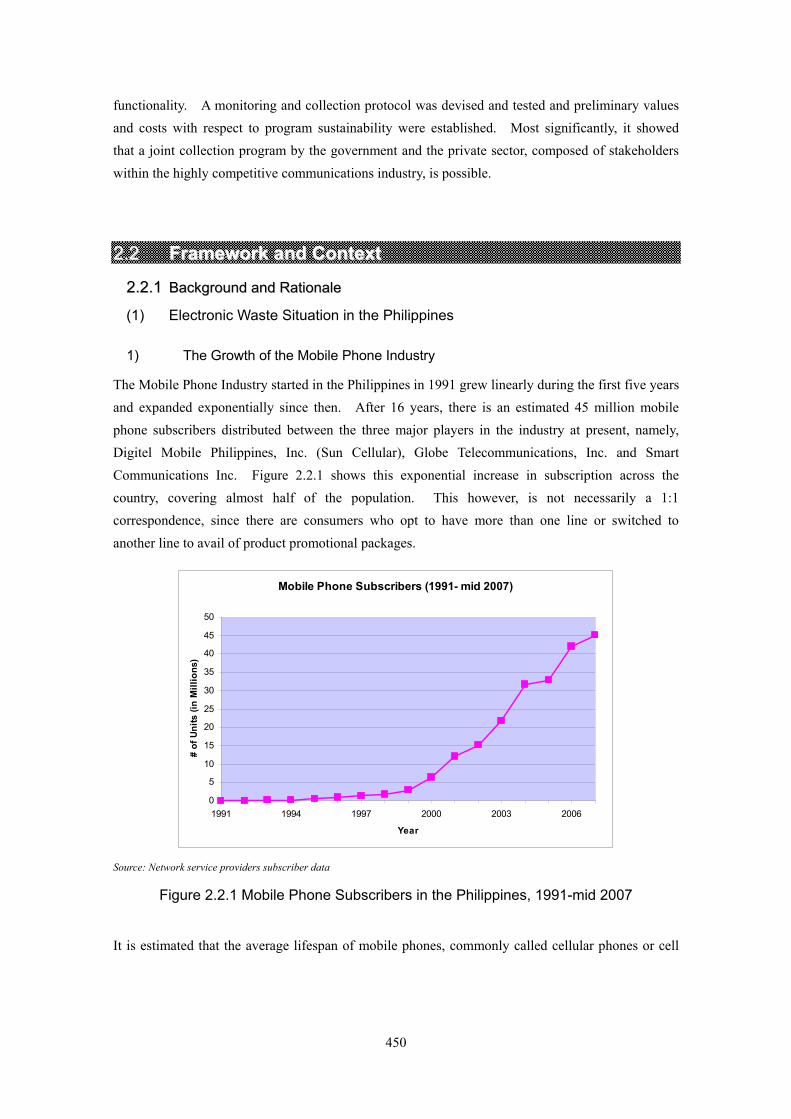
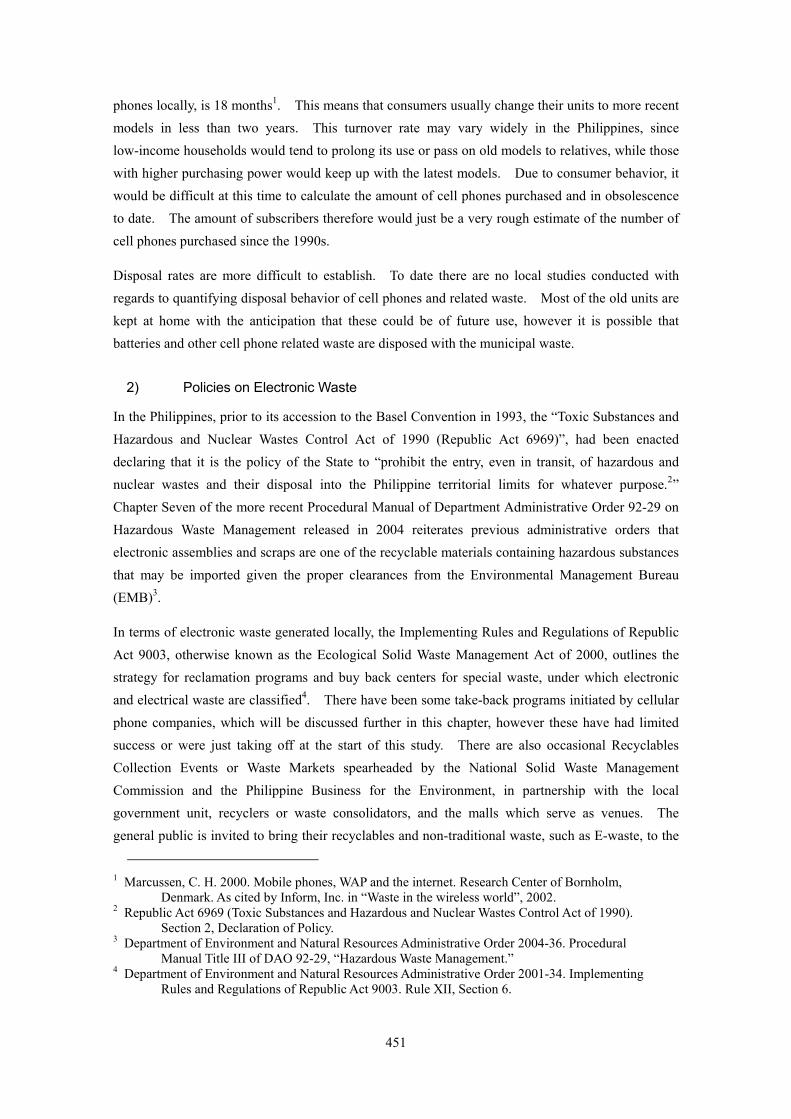
The Mobile Phone Industry started in the Philippines in 1991 grew linearly during the first five years and expanded exponentially since then. After 16 years, there is an estimated 45 million mobile phone subscribers distributed between the three major players in the industry at present, namely, Digitel Mobile Philippines, Inc. (Sun Cellular), Globe Telecommunications, Inc. and Smart Communications Inc. Figure 2.2.1 shows this exponential increase in subscription across the country, covering almost half of the population. This however, is not necessarily a 1:1 correspondence, since there are consumers who opt to have more than one line or switched to another line to avail of product promotional packages.
Mobile Phone Subscribers (1991- mid 2007)
0
5
10
15
20
25
30
35
40
45
50
1991 1994 1997 2000 2003 2006
Year
# of
Uni
ts (i
n M
illio
ns)
Source: Network service providers subscriber data
Figure 2.2.1 Mobile Phone Subscribers in the Philippines, 1991-mid 2007
It is estimated that the average lifespan of mobile phones, commonly called cellular phones or cell
451
phones locally, is 18 months1. This means that consumers usually change their units to more recent models in less than two years. This turnover rate may vary widely in the Philippines, since low-income households would tend to prolong its use or pass on old models to relatives, while those with higher purchasing power would keep up with the latest models. Due to consumer behavior, it would be difficult at this time to calculate the amount of cell phones purchased and in obsolescence to date. The amount of subscribers therefore would just be a very rough estimate of the number of cell phones purchased since the 1990s.
Disposal rates are more difficult to establish. To date there are no local studies conducted with regards to quantifying disposal behavior of cell phones and related waste. Most of the old units are kept at home with the anticipation that these could be of future use, however it is possible that batteries and other cell phone related waste are disposed with the municipal waste.
2) Policies on Electronic Waste
In the Philippines, prior to its accession to the Basel Convention in 1993, the “Toxic Substances and Hazardous and Nuclear Wastes Control Act of 1990 (Republic Act 6969)”, had been enacted declaring that it is the policy of the State to “prohibit the entry, even in transit, of hazardous and nuclear wastes and their disposal into the Philippine territorial limits for whatever purpose.2” Chapter Seven of the more recent Procedural Manual of Department Administrative Order 92-29 on Hazardous Waste Management released in 2004 reiterates previous administrative orders that electronic assemblies and scraps are one of the recyclable materials containing hazardous substances that may be imported given the proper clearances from the Environmental Management Bureau (EMB)3.
In terms of electronic waste generated locally, the Implementing Rules and Regulations of Republic Act 9003, otherwise known as the Ecological Solid Waste Management Act of 2000, outlines the strategy for reclamation programs and buy back centers for special waste, under which electronic and electrical waste are classified4. There have been some take-back programs initiated by cellular phone companies, which will be discussed further in this chapter, however these have had limited success or were just taking off at the start of this study. There are also occasional Recyclables Collection Events or Waste Markets spearheaded by the National Solid Waste Management Commission and the Philippine Business for the Environment, in partnership with the local government unit, recyclers or waste consolidators, and the malls which serve as venues. The general public is invited to bring their recyclables and non-traditional waste, such as E-waste, to the
1 Marcussen, C. H. 2000. Mobile phones, WAP and the internet. Research Center of Bornholm,
Denmark. As cited by Inform, Inc. in “Waste in the wireless world”, 2002. 2 Republic Act 6969 (Toxic Substances and Hazardous and Nuclear Wastes Control Act of 1990).
Section 2, Declaration of Policy. 3 Department of Environment and Natural Resources Administrative Order 2004-36. Procedural
Manual Title III of DAO 92-29, “Hazardous Waste Management.” 4 Department of Environment and Natural Resources Administrative Order 2001-34. Implementing
Rules and Regulations of Republic Act 9003. Rule XII, Section 6.
452
venue for direct trade or disposal with the consolidator or recycler of these materials.
22..33 CCaassee SSttuuddyy GGooaallss aanndd OObbjjeeccttiivveess The Case Study on Cellular Phone Waste Collection in the Philippines was conducted to:
• increase public awareness on proper disposal of cell phone waste especially among cell phone users; and
• assess the feasibility of developing cell phone waste collection in shops or drop-off points
This Case Study aimed to explore the impact of raising awareness on proper disposal of cell phone units, batteries, chargers and accessories in three areas in Metro Manila by monitoring the volume and corresponding value of collected waste. Furthermore, it sought to establish baseline data on collection rates given the spatial and temporal parameters of the study, and to determine the net value of the collected cell phone waste.
22..33..11 SSttaakkeehhoollddeerrss IInnvvoollvveedd
(1) Composition of the Steering Committee
The Steering Committee was composed of the Department of Industry - Board of Investments (BOI), the National Solid Waste Management Commission (NSWMC), the NSWMC Secretariat through the Department of Environment and Natural Resources – Environmental Management Bureau (EMB), and the JICA Study Team. The Steering Committee met regularly to discuss direction and strategy of the Case Study.
(2) Composition of the Technical Working Group
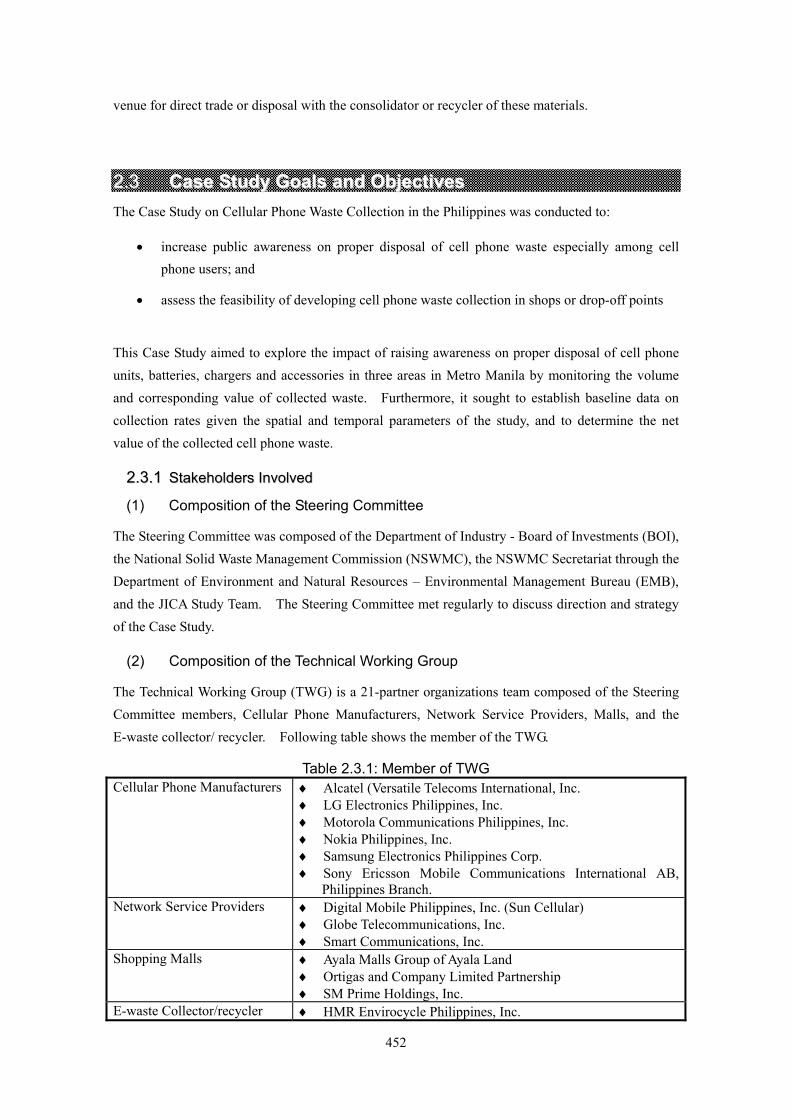
The Technical Working Group (TWG) is a 21-partner organizations team composed of the Steering Committee members, Cellular Phone Manufacturers, Network Service Providers, Malls, and the E-waste collector/ recycler. Following table shows the member of the TWG.
Table 2.3.1: Member of TWG Cellular Phone Manufacturers ♦ Alcatel (Versatile Telecoms International, Inc.
♦ LG Electronics Philippines, Inc. ♦ Motorola Communications Philippines, Inc. ♦ Nokia Philippines, Inc. ♦ Samsung Electronics Philippines Corp. ♦ Sony Ericsson Mobile Communications International AB,
Philippines Branch. Network Service Providers ♦ Digital Mobile Philippines, Inc. (Sun Cellular)
♦ Globe Telecommunications, Inc. ♦ Smart Communications, Inc.
Shopping Malls ♦ Ayala Malls Group of Ayala Land ♦ Ortigas and Company Limited Partnership ♦ SM Prime Holdings, Inc.
E-waste Collector/recycler ♦ HMR Envirocycle Philippines, Inc.
453
This is the first time in the Philippines that the different stakeholders within the highly competitive Cellular Phone Industry have come together to work on a common undertaking.
The Technical Working Group met four times prior to the launching of the pilot project and once after the end of the case study period to ensure a smooth implementation of the project.
(3) Composition of the Case Study Team
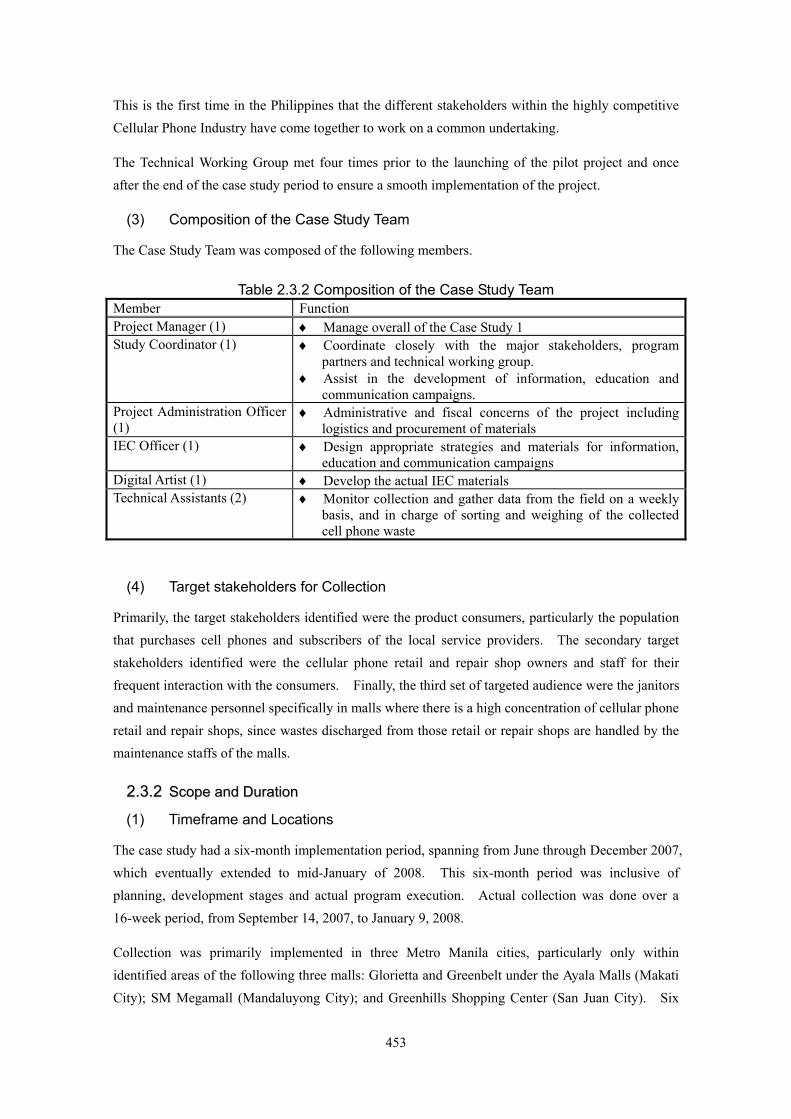
The Case Study Team was composed of the following members.
Table 2.3.2 Composition of the Case Study Team Member Function Project Manager (1) ♦ Manage overall of the Case Study 1 Study Coordinator (1) ♦ Coordinate closely with the major stakeholders, program
partners and technical working group. ♦ Assist in the development of information, education and
communication campaigns. Project Administration Officer (1)
♦ Administrative and fiscal concerns of the project including logistics and procurement of materials
IEC Officer (1) ♦ Design appropriate strategies and materials for information, education and communication campaigns
Digital Artist (1) ♦ Develop the actual IEC materials Technical Assistants (2) ♦ Monitor collection and gather data from the field on a weekly
basis, and in charge of sorting and weighing of the collected cell phone waste
(4) Target stakeholders for Collection
Primarily, the target stakeholders identified were the product consumers, particularly the population that purchases cell phones and subscribers of the local service providers. The secondary target stakeholders identified were the cellular phone retail and repair shop owners and staff for their frequent interaction with the consumers. Finally, the third set of targeted audience were the janitors and maintenance personnel specifically in malls where there is a high concentration of cellular phone retail and repair shops, since wastes discharged from those retail or repair shops are handled by the maintenance staffs of the malls.
22..33..22 SSccooppee aanndd DDuurraattiioonn
(1) Timeframe and Locations
The case study had a six-month implementation period, spanning from June through December 2007, which eventually extended to mid-January of 2008. This six-month period was inclusive of planning, development stages and actual program execution. Actual collection was done over a 16-week period, from September 14, 2007, to January 9, 2008.
Collection was primarily implemented in three Metro Manila cities, particularly only within identified areas of the following three malls: Glorietta and Greenbelt under the Ayala Malls (Makati City); SM Megamall (Mandaluyong City); and Greenhills Shopping Center (San Juan City). Six
454
collection bins were positioned within each of the three malls, totaling eighteen bins deployed in commercial establishments.
Collection was also implemented within two government offices, namely the DTI-BOI and DENR. These two offices had one bin each, generally located in the lobby or first floor of the building.
(2) Cellular Phone Waste Types
Initially, the cellular phone waste to be collected was confined to cellular phone batteries, which were perceived to be the most hazardous and problematic in terms of disposal. However, after a series of discussions with the stakeholders and meetings at the TWG, it was decided that the cellular phone waste types to be collected were to be expanded to include the cellular phone unit, batteries, charges and other accessories such as, but not limited to, housing / casings and headsets.
(3) IEC Tools
Campaign materials were limited to posters which were distributed to the partners for deployment and display in their respective shops, offices or malls. Three informative installations or mini-exhibits were produced to give customers an idea of the advantages of recycling cell phone waste. The Case Study was featured in a few news articles in major dailies which covered the launching of the pilot projects in September.
Initially, the number of collection bins was limited to around 3 bins per mall. Fortunately, additional funds from a previous DTI-BOI project with the United Nations Development Programme (UNDP) allowed construction of ten more bins. A total of twenty bins were produced.
There was no incentive program implemented in the case study. The consumers dropped their cellular phone waste on a purely voluntary basis.
(4) Logistics
Prior to collection by HMR Envirocycle, the cell phone waste deposited in the bins have to be retrieved and stored temporarily until such time that a sufficient amount has been accumulated that would warrant transportation from Metro Manila to the facility in Laguna. The collected cell phone wastes were temporary stored at either malls or SAGIP-Environment office after retrieval from the bins, which usually occurred every four weeks.
22..44 MMeetthhooddss aanndd SSttrraatteeggiieess The case study generally could be divided into four phases:
1. Project planning which included research and data gathering, and consultation with the Steering Committee and Technical Working Group;
2. Design and production of the cell phone waste bins and the appropriate information, education and communication (IEC) materials;
455
3. Signing of the Memorandum of Agreement during the launching of the pilot projects and deployment of bins and IEC materials; and
4. Collection proper, monitoring and data analyses.
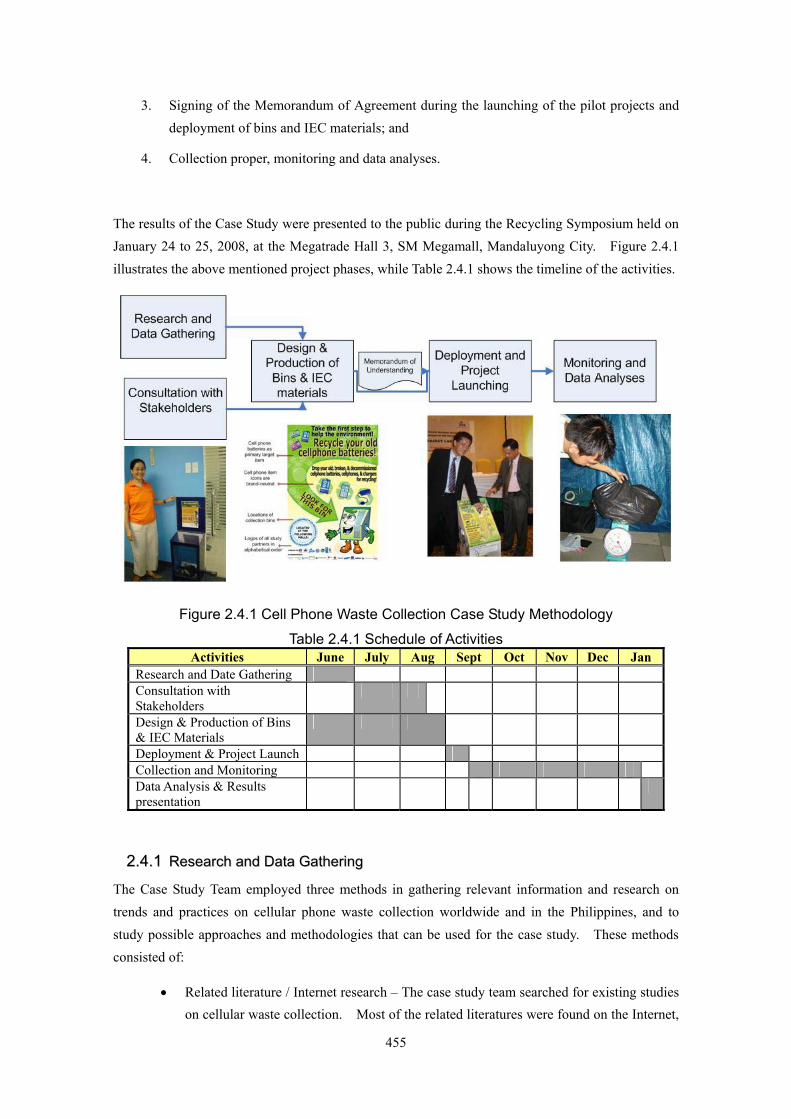
The results of the Case Study were presented to the public during the Recycling Symposium held on January 24 to 25, 2008, at the Megatrade Hall 3, SM Megamall, Mandaluyong City. Figure 2.4.1 illustrates the above mentioned project phases, while Table 2.4.1 shows the timeline of the activities.
Figure 2.4.1 Cell Phone Waste Collection Case Study Methodology
Table 2.4.1 Schedule of Activities Activities June July Aug Sept Oct Nov Dec Jan
Research and Date Gathering Consultation with Stakeholders
Design & Production of Bins & IEC Materials
Deployment & Project Launch Collection and Monitoring Data Analysis & Results presentation
22..44..11 RReesseeaarrcchh aanndd DDaattaa GGaatthheerriinngg
The Case Study Team employed three methods in gathering relevant information and research on trends and practices on cellular phone waste collection worldwide and in the Philippines, and to study possible approaches and methodologies that can be used for the case study. These methods consisted of:
• Related literature / Internet research – The case study team searched for existing studies on cellular waste collection. Most of the related literatures were found on the Internet,
456
ranging from websites of mobile phone manufacturers, take-back projects conducted by the manufacturers, government institutions or private groups, to scientific or academic research papers.
• Meetings with malls – The CS team and representatives from the participating malls held several meetings to identify the strategic locations where consumer traffic was high and investigated other possible concerns the Case Study may face, such as security.
• Consultation with groups that conducted take-back programs – The CS team also met with the organizations which have conducted their own cellular phone take back programs or are planning to conduct a similar program, namely Nokia Philippines, Inc., Globe Telecommunications Inc., and Motorola Communications Philippines Inc. to learn from their experiences and get suggestions regarding bin design, placement and campaign strategies.
22..44..22 CCoonnssuullttaattiioonn wwiitthh SSttaakkeehhoollddeerrss
In addition to the meetings mentioned above, the Case Study Team regularly met with the Steering Committee to give updates on the status of the project and get direction. The team made presentations during the five Technical Working Group Meetings, initially to present the general concept of the project then the detailed plan of the case study and finally to present the output of the study. There were around 30 meetings for the period covering June to August and conducted telephone conferences for stakeholders who were very busy.
22..44..33 DDrraaffttiinngg ooff tthhee MMeemmoorraanndduumm ooff UUnnddeerrssttaannddiinngg
An important process used in the Case Study was the creation of a Memorandum of Understanding (MOU), which was instrumental in binding the various stakeholders together for the project. The MOU outlined the roles of each of the partners and other venues for their involvement. The document was drafted mainly by the Steering Committee and the Case Study Team and was consulted and discussed during the TWG meetings prior to the launching of the pilot project. The MOU was officially signed by all concerned parties during the launching event of the recycling program.
22..44..44 DDeessiiggnn aanndd CCoonnssttrruuccttiioonn ooff CCoolllleeccttiioonn BBiinnss
The collection bin the team envisaged for case study was not only to be used as a receptacle for cellular phone waste but also as an information, education and communication (IEC) tool. It should therefore be attractive and functional.
Based on the data gathered from research and from the learnings of TWG members which have conducted cellular phone take back program, the team designed a bin which would be attractive at the same time informative.
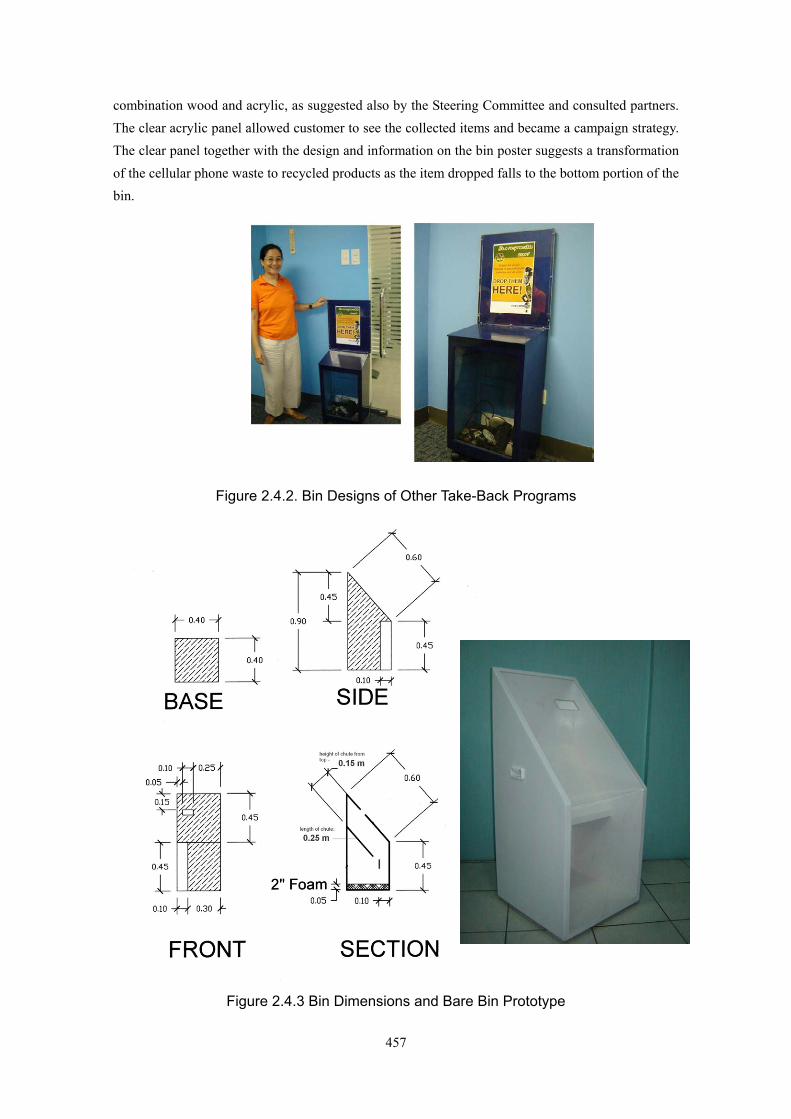
As an IEC tool, the bin had an inclined top to accommodate an interactive poster. It was made of
457
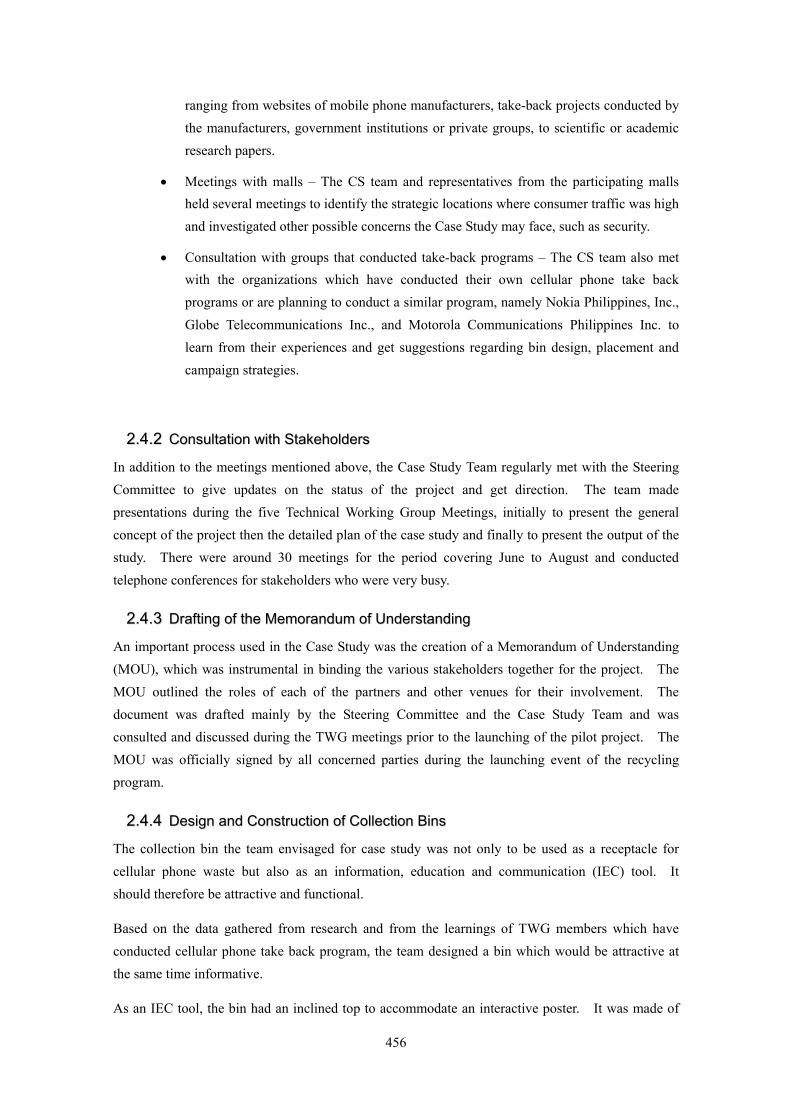
combination wood and acrylic, as suggested also by the Steering Committee and consulted partners. The clear acrylic panel allowed customer to see the collected items and became a campaign strategy. The clear panel together with the design and information on the bin poster suggests a transformation of the cellular phone waste to recycled products as the item dropped falls to the bottom portion of the bin.
Figure 2.4.2. Bin Designs of Other Take-Back Programs
Figure 2.4.3 Bin Dimensions and Bare Bin Prototype
458
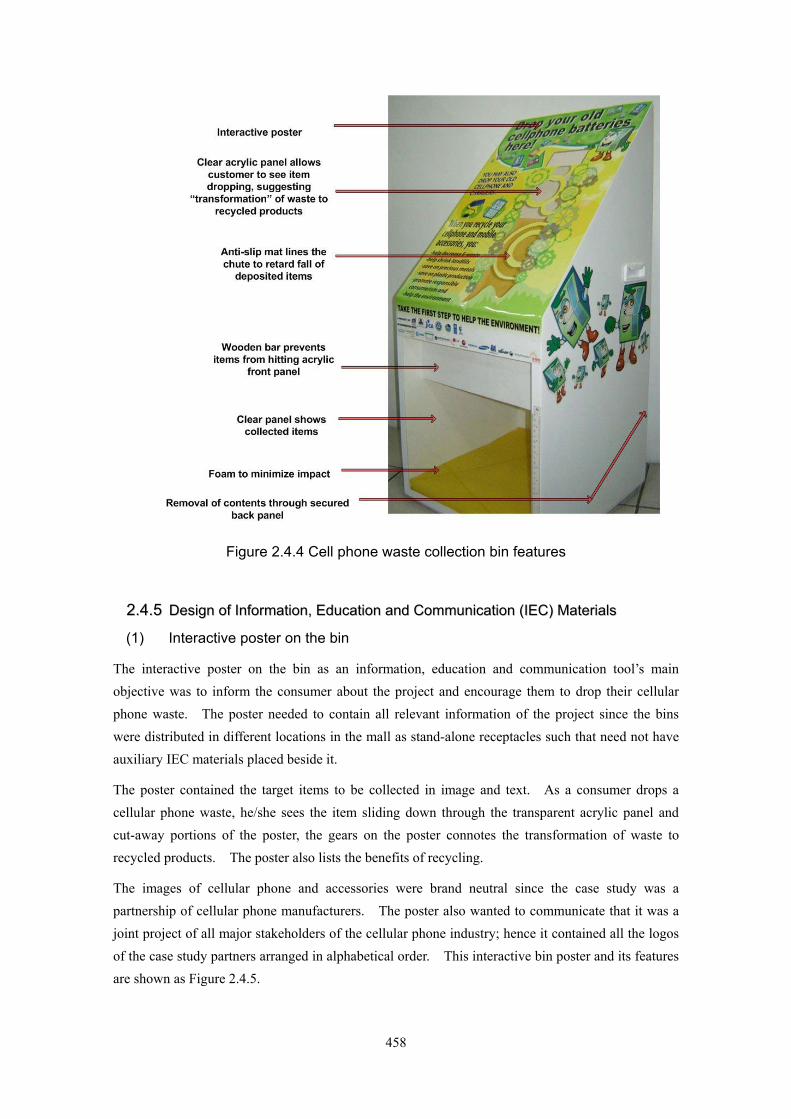
Figure 2.4.4 Cell phone waste collection bin features
22..44..55 DDeessiiggnn ooff IInnffoorrmmaattiioonn,, EEdduuccaattiioonn aanndd CCoommmmuunniiccaattiioonn ((IIEECC)) MMaatteerriiaallss
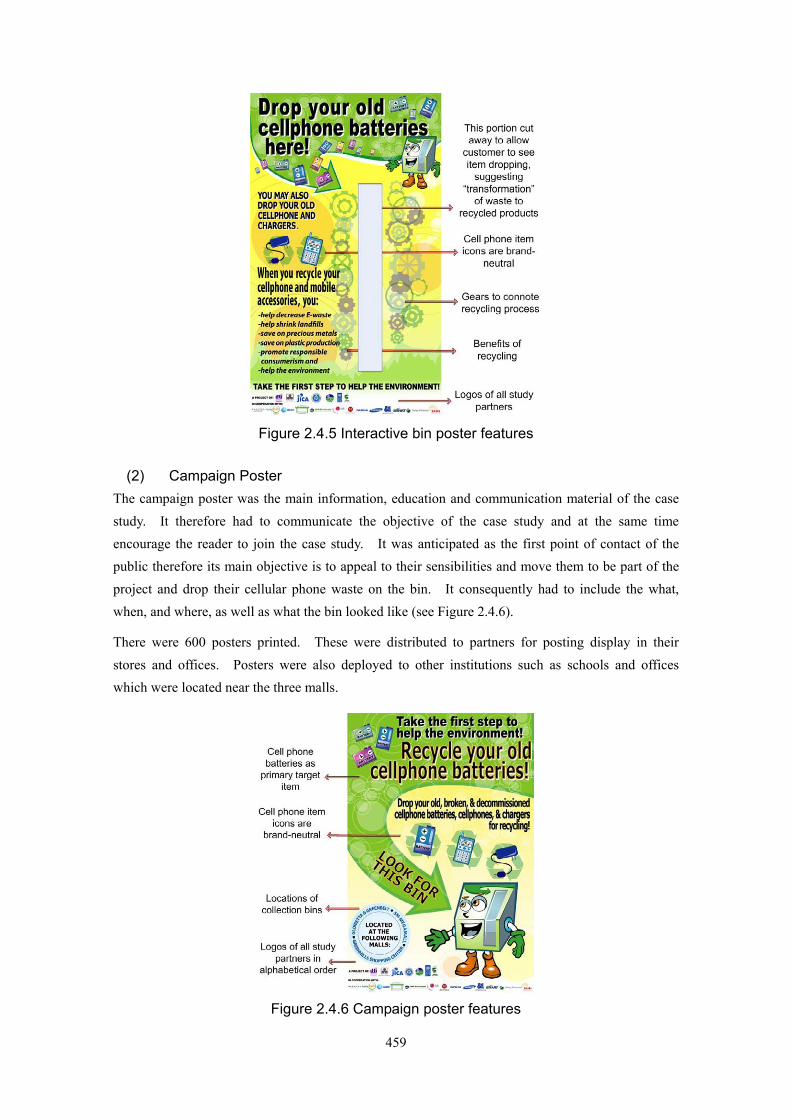
(1) Interactive poster on the bin
The interactive poster on the bin as an information, education and communication tool’s main objective was to inform the consumer about the project and encourage them to drop their cellular phone waste. The poster needed to contain all relevant information of the project since the bins were distributed in different locations in the mall as stand-alone receptacles such that need not have auxiliary IEC materials placed beside it.
The poster contained the target items to be collected in image and text. As a consumer drops a cellular phone waste, he/she sees the item sliding down through the transparent acrylic panel and cut-away portions of the poster, the gears on the poster connotes the transformation of waste to recycled products. The poster also lists the benefits of recycling.
The images of cellular phone and accessories were brand neutral since the case study was a partnership of cellular phone manufacturers. The poster also wanted to communicate that it was a joint project of all major stakeholders of the cellular phone industry; hence it contained all the logos of the case study partners arranged in alphabetical order. This interactive bin poster and its features are shown as Figure 2.4.5.
459
Figure 2.4.5 Interactive bin poster features
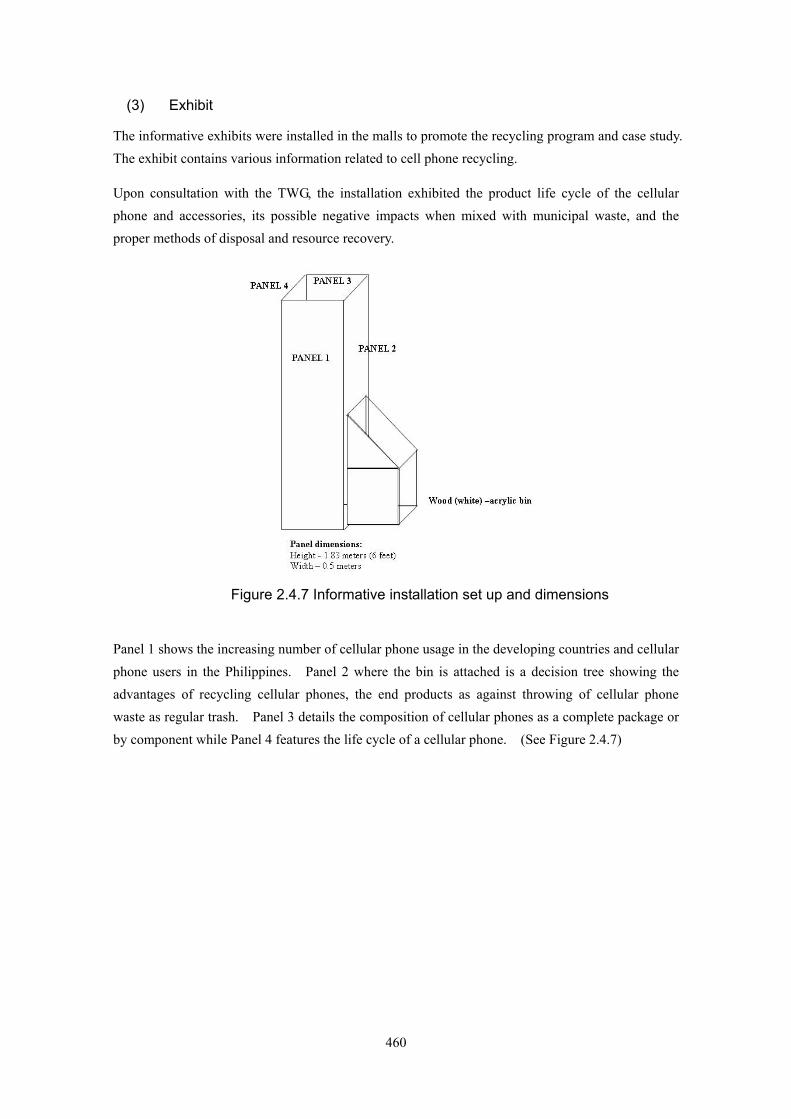
(2) Campaign Poster
The campaign poster was the main information, education and communication material of the case study. It therefore had to communicate the objective of the case study and at the same time encourage the reader to join the case study. It was anticipated as the first point of contact of the public therefore its main objective is to appeal to their sensibilities and move them to be part of the project and drop their cellular phone waste on the bin. It consequently had to include the what, when, and where, as well as what the bin looked like (see Figure 2.4.6).
There were 600 posters printed. These were distributed to partners for posting display in their stores and offices. Posters were also deployed to other institutions such as schools and offices which were located near the three malls.
Figure 2.4.6 Campaign poster features
460
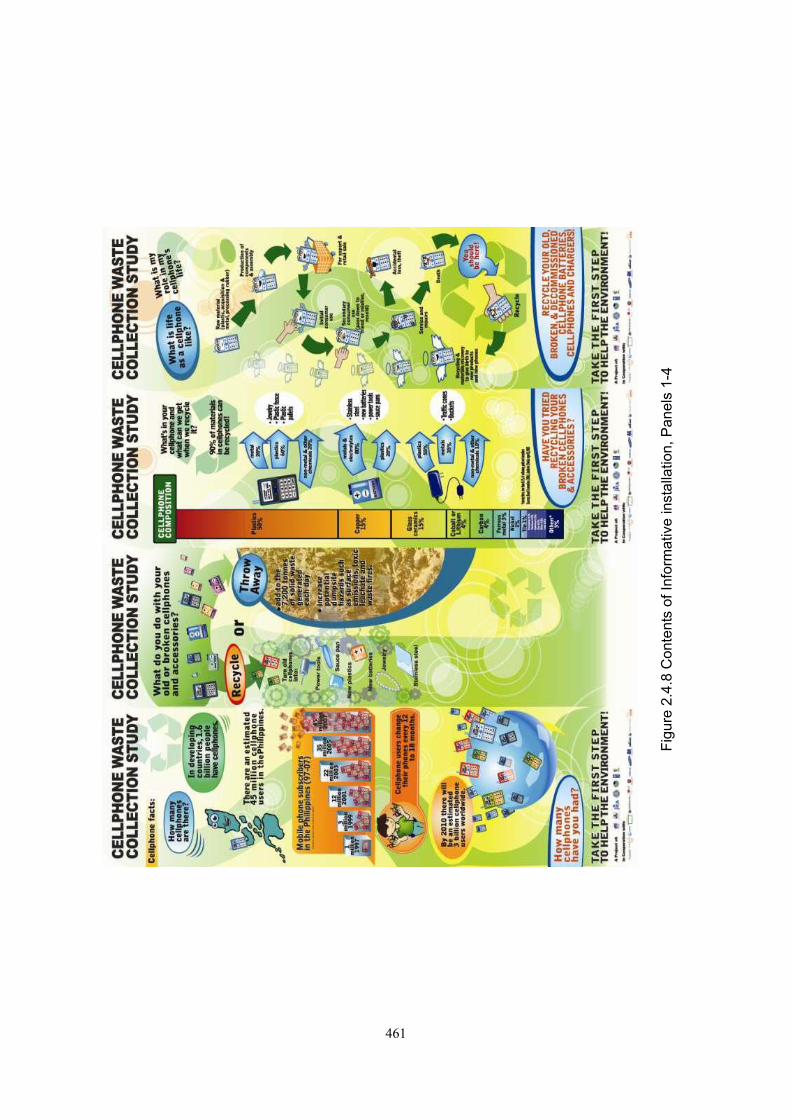
(3) Exhibit
The informative exhibits were installed in the malls to promote the recycling program and case study. The exhibit contains various information related to cell phone recycling.
Upon consultation with the TWG, the installation exhibited the product life cycle of the cellular phone and accessories, its possible negative impacts when mixed with municipal waste, and the proper methods of disposal and resource recovery.
Figure 2.4.7 Informative installation set up and dimensions
Panel 1 shows the increasing number of cellular phone usage in the developing countries and cellular phone users in the Philippines. Panel 2 where the bin is attached is a decision tree showing the advantages of recycling cellular phones, the end products as against throwing of cellular phone waste as regular trash. Panel 3 details the composition of cellular phones as a complete package or by component while Panel 4 features the life cycle of a cellular phone. (See Figure 2.4.7)
461
Figu
re 2
.4.8
Con
tent
s of
Info
rmat
ive
inst
alla
tion,
Pan
els
1-4
462
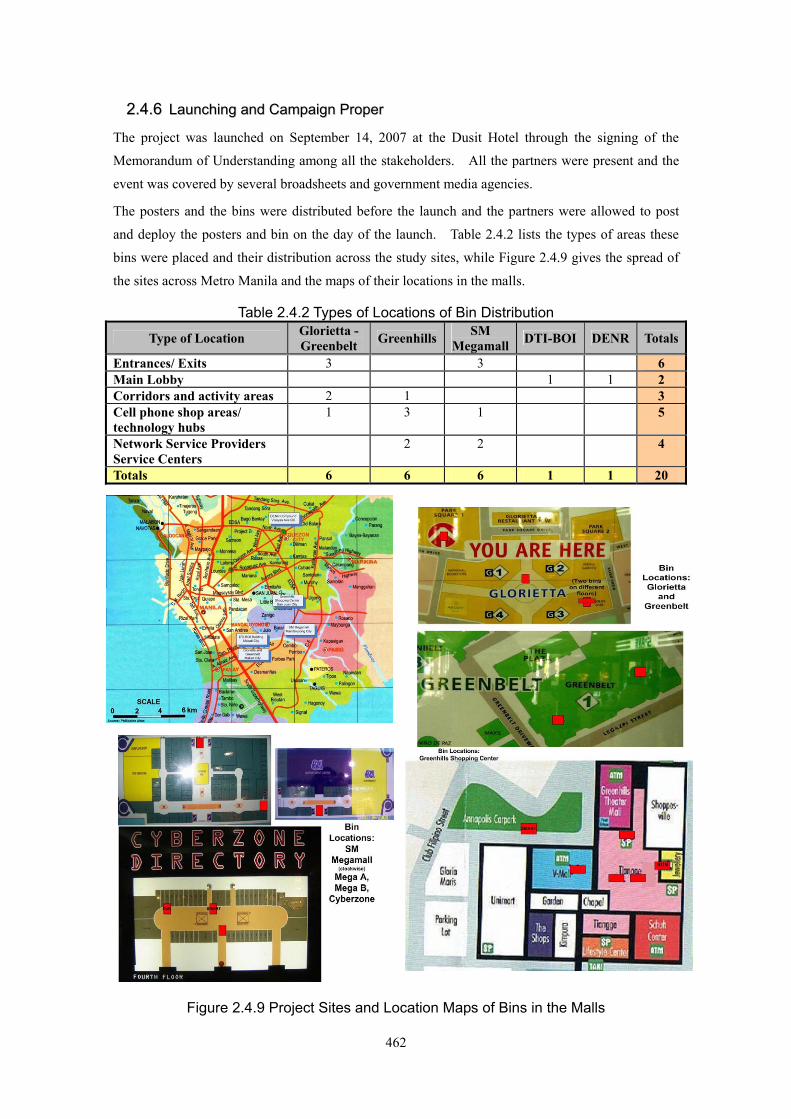
22..44..66 LLaauunncchhiinngg aanndd CCaammppaaiiggnn PPrrooppeerr
The project was launched on September 14, 2007 at the Dusit Hotel through the signing of the
Memorandum of Understanding among all the stakeholders. All the partners were present and the
event was covered by several broadsheets and government media agencies.
The posters and the bins were distributed before the launch and the partners were allowed to post
and deploy the posters and bin on the day of the launch. Table 2.4.2 lists the types of areas these
bins were placed and their distribution across the study sites, while Figure 2.4.9 gives the spread of
the sites across Metro Manila and the maps of their locations in the malls.
Table 2.4.2 Types of Locations of Bin Distribution
Type of Location Glorietta - Greenbelt Greenhills SM
Megamall DTI-BOI DENR Totals
Entrances/ Exits 3 3 6 Main Lobby 1 1 2 Corridors and activity areas 2 1 3 Cell phone shop areas/ technology hubs
1 3 1 5
Network Service Providers Service Centers
2 2 4
Totals 6 6 6 1 1 20
Figure 2.4.9 Project Sites and Location Maps of Bins in the Malls
463
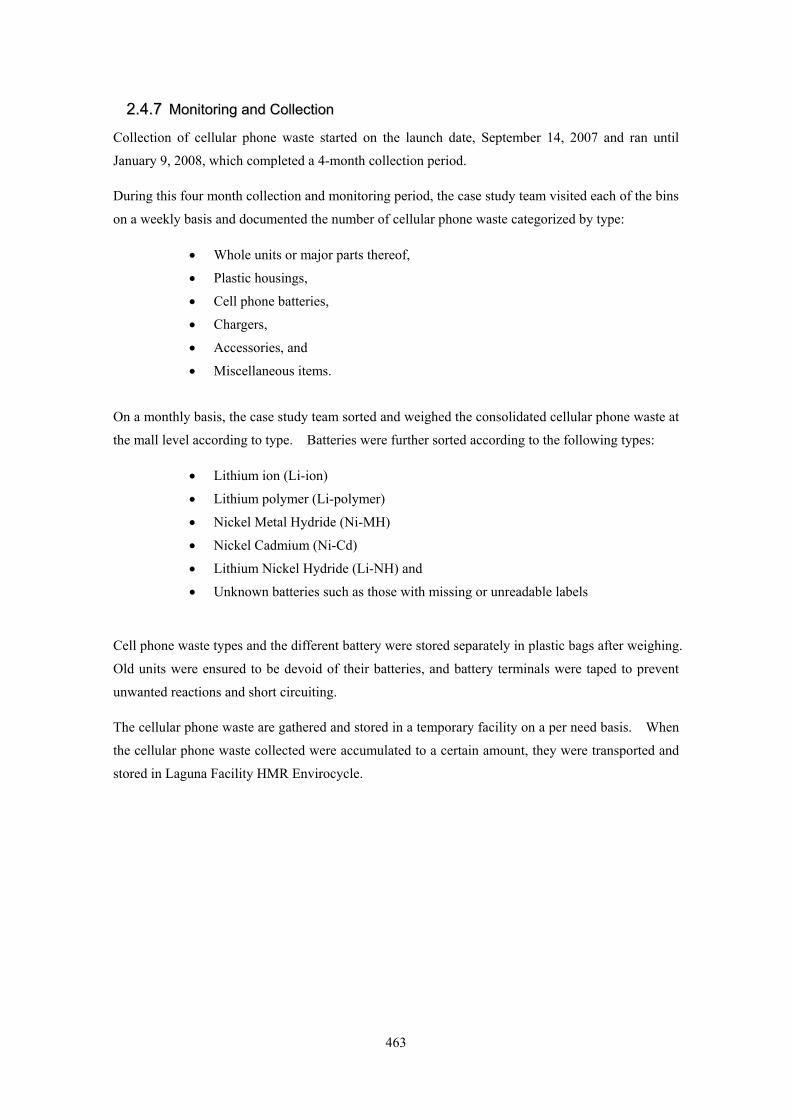
22..44..77 MMoonniittoorriinngg aanndd CCoolllleeccttiioonn
Collection of cellular phone waste started on the launch date, September 14, 2007 and ran until
January 9, 2008, which completed a 4-month collection period.
During this four month collection and monitoring period, the case study team visited each of the bins
on a weekly basis and documented the number of cellular phone waste categorized by type:
• Whole units or major parts thereof,
• Plastic housings,
• Cell phone batteries,
• Chargers,
• Accessories, and
• Miscellaneous items.
On a monthly basis, the case study team sorted and weighed the consolidated cellular phone waste at
the mall level according to type. Batteries were further sorted according to the following types:
• Lithium ion (Li-ion)
• Lithium polymer (Li-polymer)
• Nickel Metal Hydride (Ni-MH)
• Nickel Cadmium (Ni-Cd)
• Lithium Nickel Hydride (Li-NH) and
• Unknown batteries such as those with missing or unreadable labels
Cell phone waste types and the different battery were stored separately in plastic bags after weighing.
Old units were ensured to be devoid of their batteries, and battery terminals were taped to prevent
unwanted reactions and short circuiting.
The cellular phone waste are gathered and stored in a temporary facility on a per need basis. When
the cellular phone waste collected were accumulated to a certain amount, they were transported and
stored in Laguna Facility HMR Envirocycle.
464
Figure 2.4.10 Monitoring and Collection Protocol
22..55 OOuuttccoommeess aanndd AAnnaallyysseess
22..55..11 CCoolllleeccttiioonn DDaattaa aanndd RReessuullttss
The collection data were processed and analyzed using seven iterations:
• Collection volume per bin location, in number of pieces
• Total collection volume across sites, in number of pieces and weight
• Collection rate per site, in number of pieces
• Collection trends in the malls
• Cell phone waste distribution per site, in number of pieces
• Distribution of cell phone waste types in number of pieces and weight
• Distribution of battery types per site and per type, by weight
These iterations give insights on consumer participation and behavior, collection rates and trends,
and the nature of waste collected.
465
(1) Collection Volumes
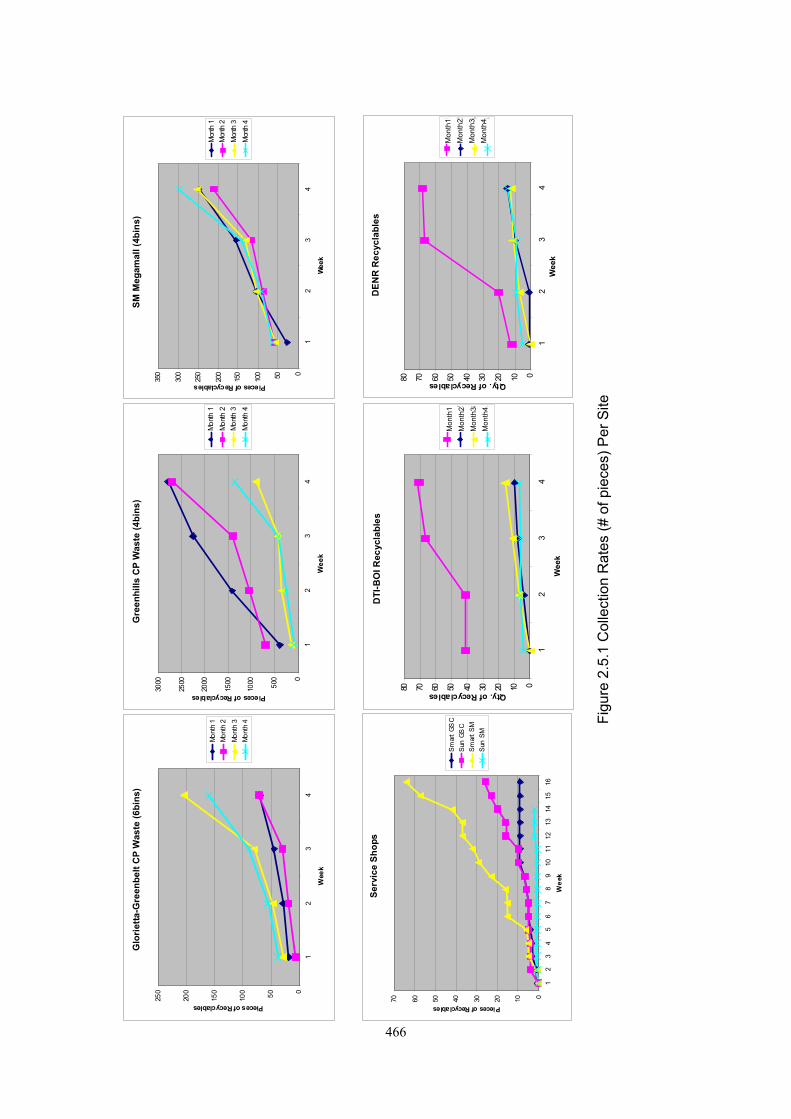
1) Collection volumes per bin location
The amounts of collected waste vary across the different types of bin locations in the malls, as
shown in Figure 2.5.1. The most collected waste in across all of the sites was predictably the Cell
Phone “Tiangge” or “flee market” in the second floor of the Greenhills Shopping Center main
building. This is where almost all the cell phones retail and repair stalls are located. These stalls,
numbering almost 750 during peak season, could be as small as 1.2 x 1.2 meters in floor area.
During monitoring activities, it was discovered that the high collected volumes in these areas are not
mainly due to customer or stall tenant participation, but were instead due to the janitors who would
deposit E-waste accumulated from the stalls. These wastes are sometimes given by the stalls but
more often than not these were still coming from mixed waste receptacles.
The collected volumes outside the Greenhills Cell Phone Tiangge area and those from other study
sites would be more reflective of public participation to the project. For Glorietta-Greenbelt,
highest participation was noted in the Activity Center while in SM Megamall, the entrances/exits and
the Cyberzone bin yielded the highest collection.
2) Total collection volumes across sites
Greenhills Shopping Center contributed the highest collection in terms of pieces and weight,
comprising 82% and 62% respectively.
466
G
lorie
tta -
Gre
enbe
lt C
P W
aste
(6 b
ins)
050100
150
200
250
12
34
Wee
k
Pieces of Recyclables
Mont
h 1
Mont
h 2
Mont
h 3
Mont
h 4
Gre
enhi
lls C
P W
aste
(4 b
ins)
0
500
1000
1500
2000
2500
3000
12
34
Wee
k
Pieces of Recyclables
Mon
th 1
Mon
th 2
Mon
th 3
Mon
th 4
SM M
egam
all (4
bins
)
050100
150
200
250
300
350
12
34
Wee
k
Pieces of Recyclables
Mon
th 1
Mon
th 2
Mon
th 3
Mon
th 4
Serv
ice
Shop
s
010203040506070
12
34
56
78
910
1112
1314
1516
Wee
k
Pieces of Recyclables
Smar
t GS
CSu
n GS
CSm
art S
MSu
n SM
DENR
Rec
yclab
les
01020304050607080
12
34
Wee
k No.
Qty. of Recyclables
Month
1Mo
nth 2
Month
3Mo
nth 4
Wee
k
DTI-B
OI R
ecyc
lables
01020304050607080
12
34
Wee
k No.
Qty. of Recyclables
Mon
th 1
Mon
th 2
Mon
th 3
Mon
th 4
Mon
th1
Mon
th2
Mon
th3
Mon
th4
Mon
th1
Mon
th2
Mon
th3
Mon
th4
Wee
k
DTI
-BO
I Rec
ycla
bles
Se
rvic
e Sh
ops
Glo
rietta
-Gre
enbe
lt C
P W
aste
(6bi
ns)
Gre
enhi
lls C
P W
aste
(4bi
ns)
SM M
egam
all (
4bin
s)
DEN
R R
ecyc
labl
es
Figu
re 2
.5.1
Col
lect
ion
Rat
es (#
of p
iece
s) P
er S
ite
467
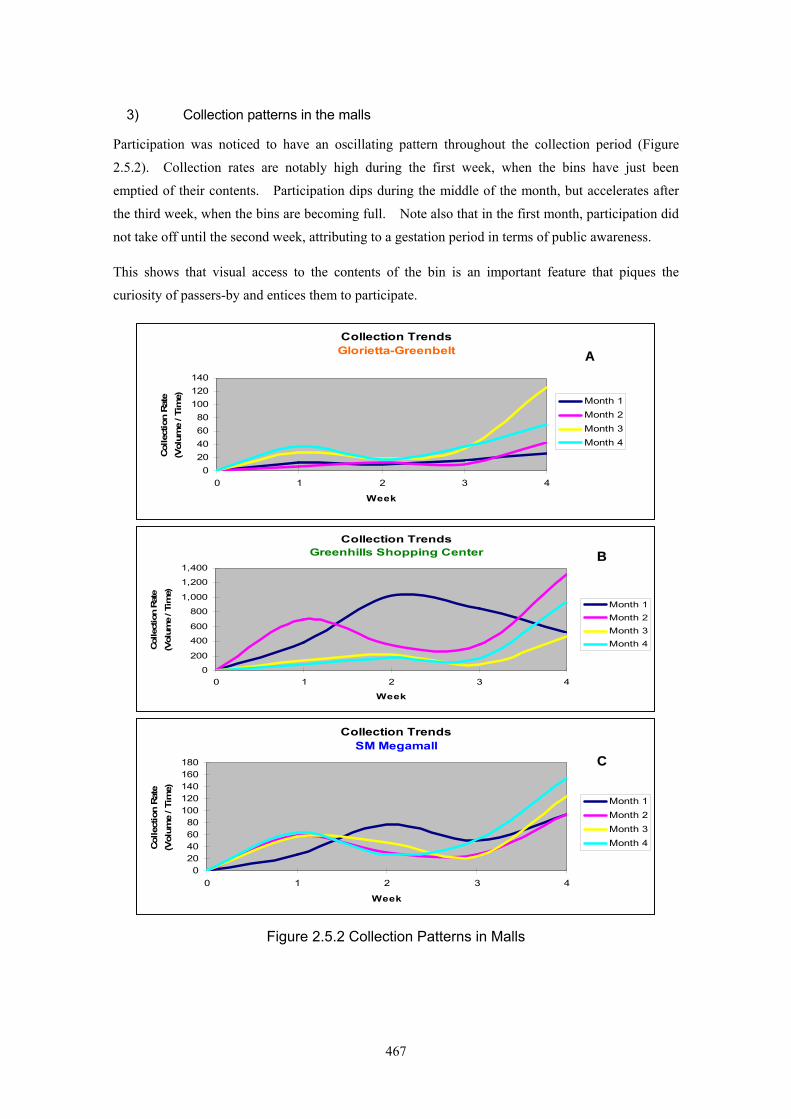
3) Collection patterns in the malls
Participation was noticed to have an oscillating pattern throughout the collection period (Figure
2.5.2). Collection rates are notably high during the first week, when the bins have just been
emptied of their contents. Participation dips during the middle of the month, but accelerates after
the third week, when the bins are becoming full. Note also that in the first month, participation did
not take off until the second week, attributing to a gestation period in terms of public awareness.
This shows that visual access to the contents of the bin is an important feature that piques the
curiosity of passers-by and entices them to participate.
Figure 2.5.2 Collection Patterns in Malls
Collection TrendsGlorietta-Greenbelt
020406080
100120140
0 1 2 3 4
Week
Col
lect
ion
Rate
(V
olum
e / T
ime) Month 1
Month 2Month 3Month 4
A
Collection TrendsGreenhills Shopping Center
0
200
400
600
800
1,000
1,200
1,400
0 1 2 3 4
Week
Colle
ctio
n Rat
e
(Vol
ume
/ Tim
e)
Month 1Month 2Month 3Month 4
B
Collection TrendsSM Megamall
020406080
100120140160180
0 1 2 3 4
Week
Colle
ctio
n Ra
te
(Vol
ume
/ Tim
e)
Month 1Month 2Month 3Month 4
C
468
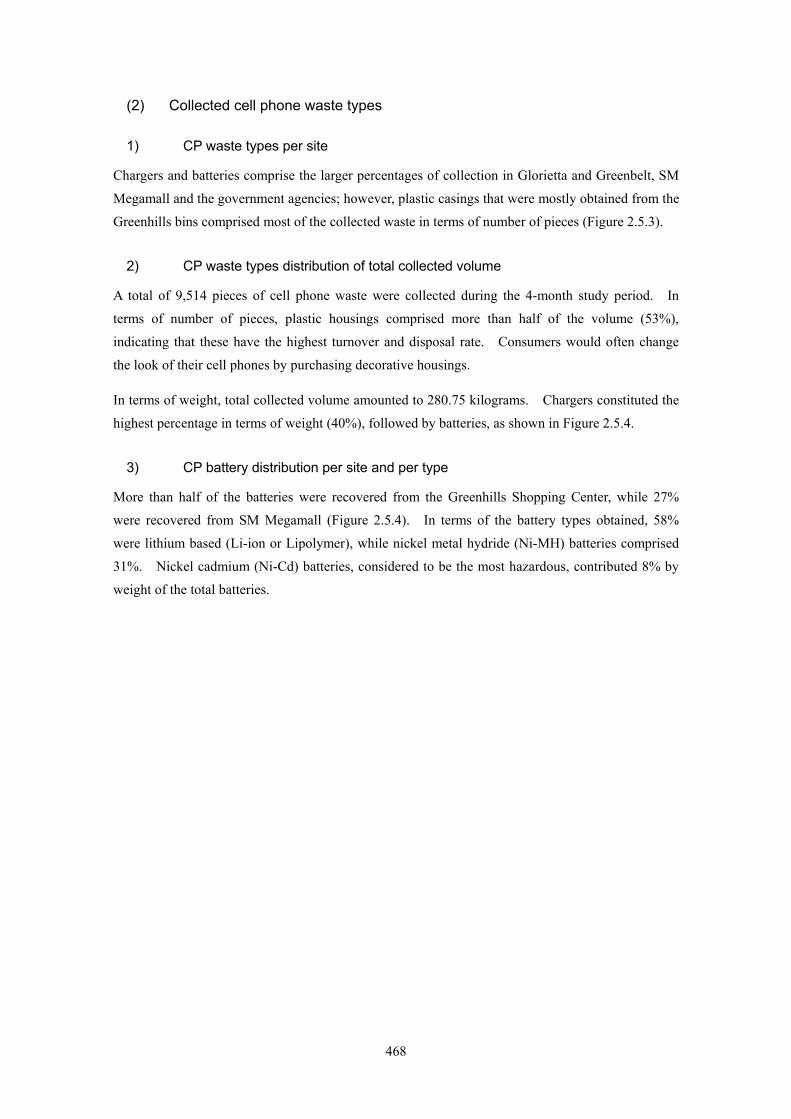
(2) Collected cell phone waste types
1) CP waste types per site
Chargers and batteries comprise the larger percentages of collection in Glorietta and Greenbelt, SM
Megamall and the government agencies; however, plastic casings that were mostly obtained from the
Greenhills bins comprised most of the collected waste in terms of number of pieces (Figure 2.5.3).
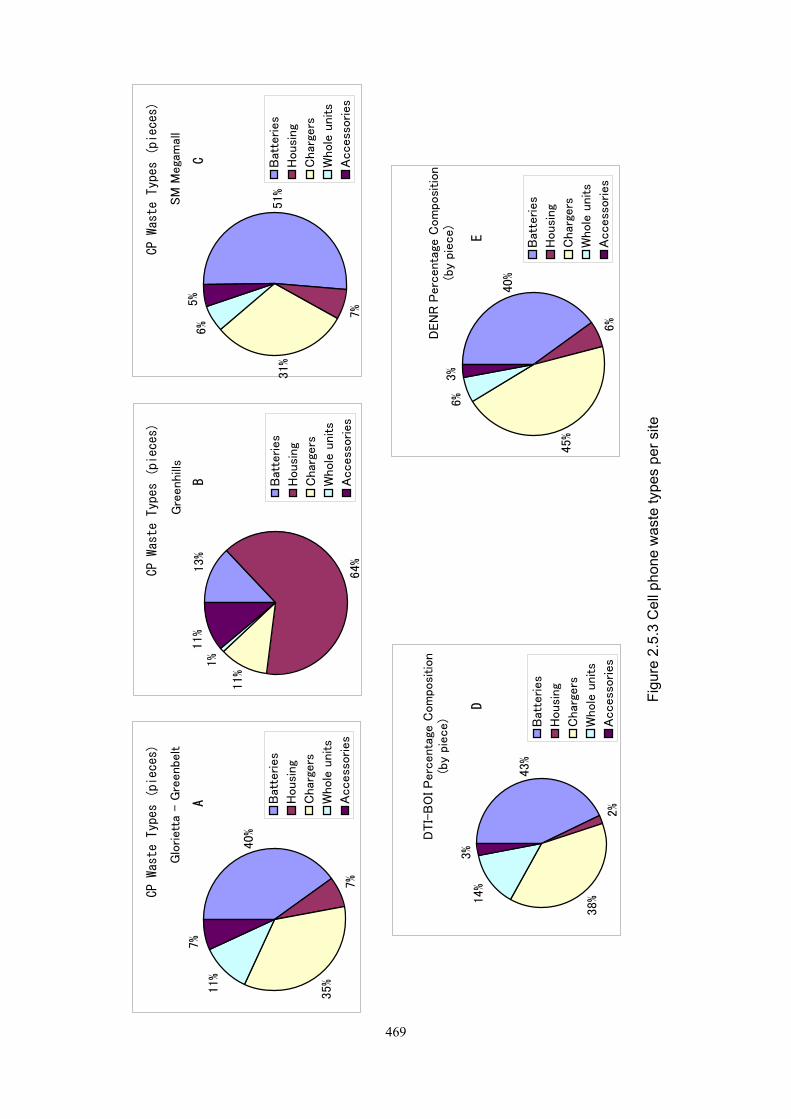
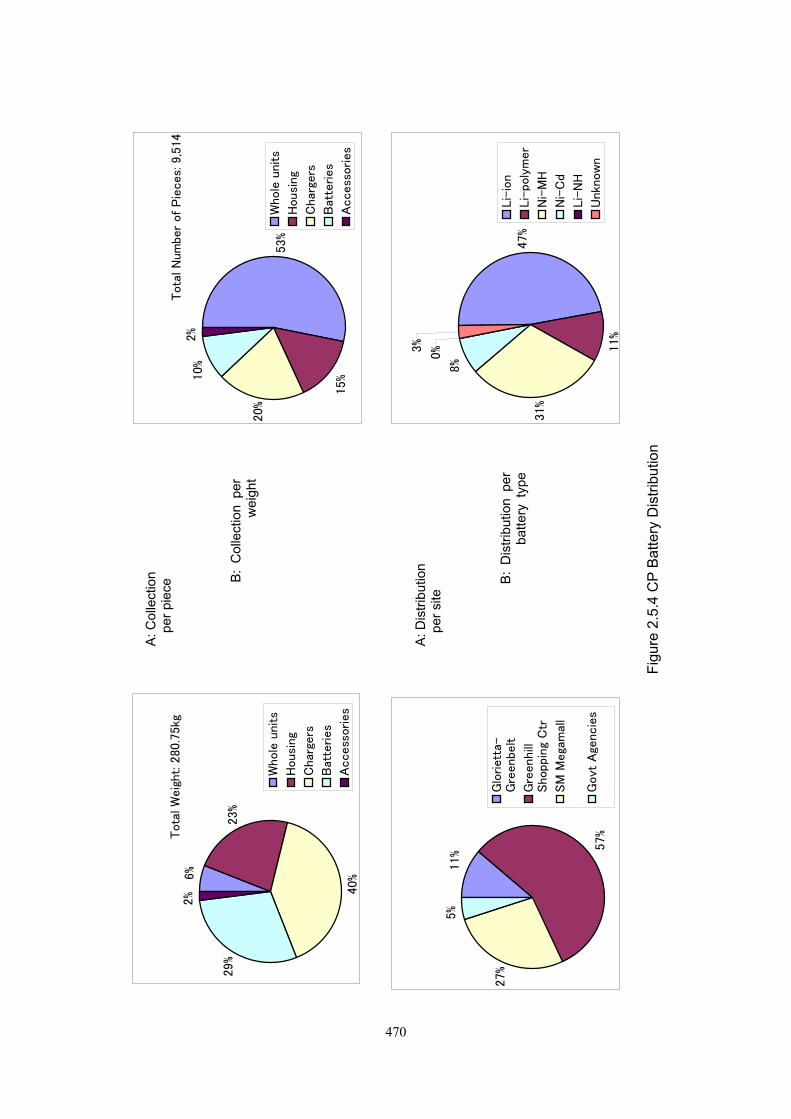
2) CP waste types distribution of total collected volume
A total of 9,514 pieces of cell phone waste were collected during the 4-month study period. In
terms of number of pieces, plastic housings comprised more than half of the volume (53%),
indicating that these have the highest turnover and disposal rate. Consumers would often change
the look of their cell phones by purchasing decorative housings.
In terms of weight, total collected volume amounted to 280.75 kilograms. Chargers constituted the
highest percentage in terms of weight (40%), followed by batteries, as shown in Figure 2.5.4.
3) CP battery distribution per site and per type
More than half of the batteries were recovered from the Greenhills Shopping Center, while 27%
were recovered from SM Megamall (Figure 2.5.4). In terms of the battery types obtained, 58%
were lithium based (Li-ion or Lipolymer), while nickel metal hydride (Ni-MH) batteries comprised
31%. Nickel cadmium (Ni-Cd) batteries, considered to be the most hazardous, contributed 8% by
weight of the total batteries.
469
Glo
riett
a - G
reenbe
lt
40%
7%
35%
11%
7%
Bat
teries
Housi
ng
Char
gers
Whole
units
Access
ories
Gre
enhill
s
13%
64%
11%
1%
11%
Bat
teries
Housi
ng
Char
gers
Whole
units
Access
ories
SM
Mega
mal
l
51%
7%
31%
6%
5%
Bat
teries
Housi
ng
Char
gers
Whole
units
Access
ories
DTI-
BO
I P
erc
enta
ge C
om
posi
tion
(by
piece)
43%
2%
38%14%
3%
Bat
teries
Housi
ng
Char
gers
Whole
units
Access
ories
DEN
R P
erc
enta
ge C
om
posi
tion
(by
piece)
40%
6%
45%
6%
3%
Bat
teries
Housi
ng
Char
gers
Whole
units
Access
ories
Figu
re 2
.5.3
Cel
l pho
ne w
aste
type
s pe
r site
CP Waste Types (pieces)
A
CP Waste Types (pieces)
B
CP Waste Types (pieces)
C
E
D
470
Tota
l W
eig
ht: 2
80.7
5kg
6%
23%
40%
29%
2%
Whole
units
Housi
ng
Char
gers
Bat
teries
Access
ories
A: C
olle
ctio
n
per p
iece
B:
Col
lect
ion
per
w
eigh
t
Tota
l N
umbe
r of P
ieces:
9,5
14
53%
15%
20%
10%
2%
Whole
units
Housi
ng
Char
gers
Bat
teries
Access
ories
11%
57%
27%
5%
Glo
riett
a-G
reenbe
lt
Gre
enhill
Shopp
ing
Ctr
SM
Mega
mal
l
Govt
Age
ncie
s
A: D
istri
butio
n
per s
ite
B:
Dis
tribu
tion
per
bat
tery
typ
e 47%
11%
31%
8%0
%3%
Li-
ion
Li-
poly
mer
Ni-
MH
Ni-
Cd
Li-
NH
Unkn
ow
n
Figu
re 2
.5.4
CP
Bat
tery
Dis
tribu
tion
471
22..55..22 RRaatteess,, VVaalluueess aanndd CCoossttss
(1) General Collection Rates
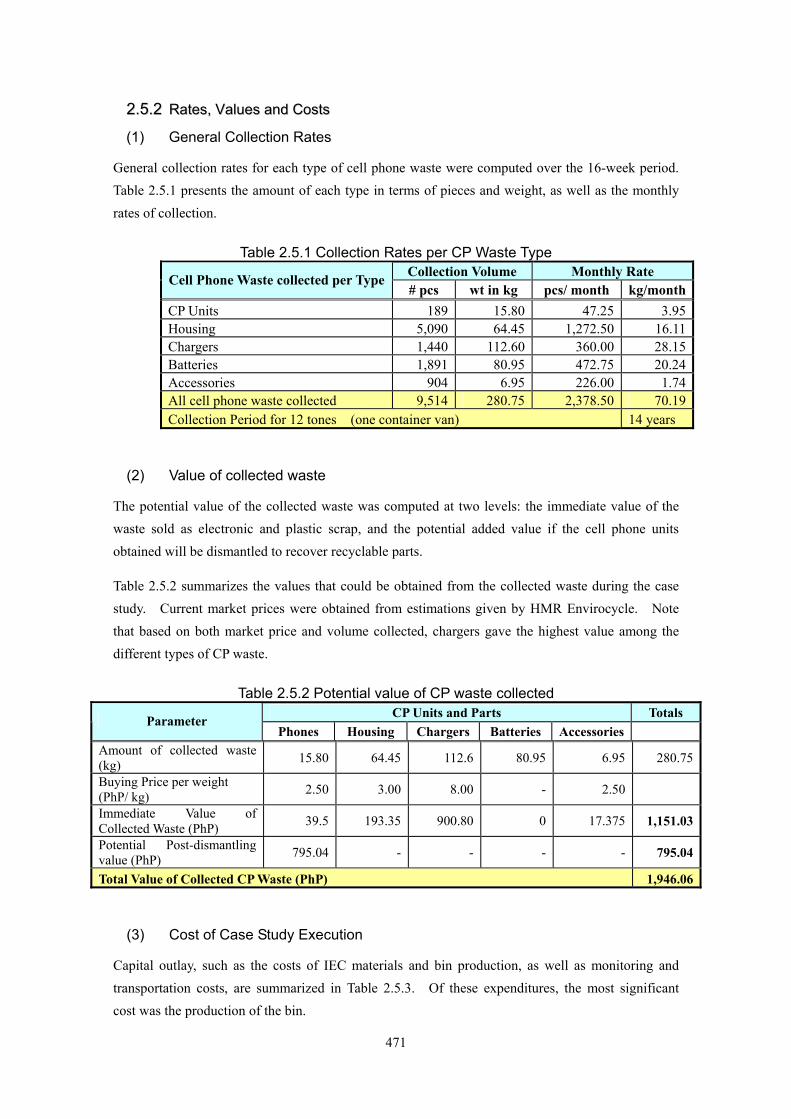
General collection rates for each type of cell phone waste were computed over the 16-week period. Table 2.5.1 presents the amount of each type in terms of pieces and weight, as well as the monthly rates of collection.
Table 2.5.1 Collection Rates per CP Waste Type Collection Volume Monthly Rate Cell Phone Waste collected per Type# pcs wt in kg pcs/ month kg/month
CP Units 189 15.80 47.25 3.95Housing 5,090 64.45 1,272.50 16.11Chargers 1,440 112.60 360.00 28.15Batteries 1,891 80.95 472.75 20.24Accessories 904 6.95 226.00 1.74All cell phone waste collected 9,514 280.75 2,378.50 70.19Collection Period for 12 tones (one container van) 14 years
(2) Value of collected waste
The potential value of the collected waste was computed at two levels: the immediate value of the waste sold as electronic and plastic scrap, and the potential added value if the cell phone units obtained will be dismantled to recover recyclable parts.
Table 2.5.2 summarizes the values that could be obtained from the collected waste during the case study. Current market prices were obtained from estimations given by HMR Envirocycle. Note that based on both market price and volume collected, chargers gave the highest value among the different types of CP waste.
Table 2.5.2 Potential value of CP waste collected CP Units and Parts Totals Parameter
Phones Housing Chargers Batteries Accessories Amount of collected waste (kg) 15.80 64.45 112.6 80.95 6.95 280.75
Buying Price per weight (PhP/ kg) 2.50 3.00 8.00 - 2.50
Immediate Value of Collected Waste (PhP) 39.5 193.35 900.80 0 17.375 1,151.03
Potential Post-dismantling value (PhP) 795.04 - - - - 795.04
Total Value of Collected CP Waste (PhP) 1,946.06
(3) Cost of Case Study Execution
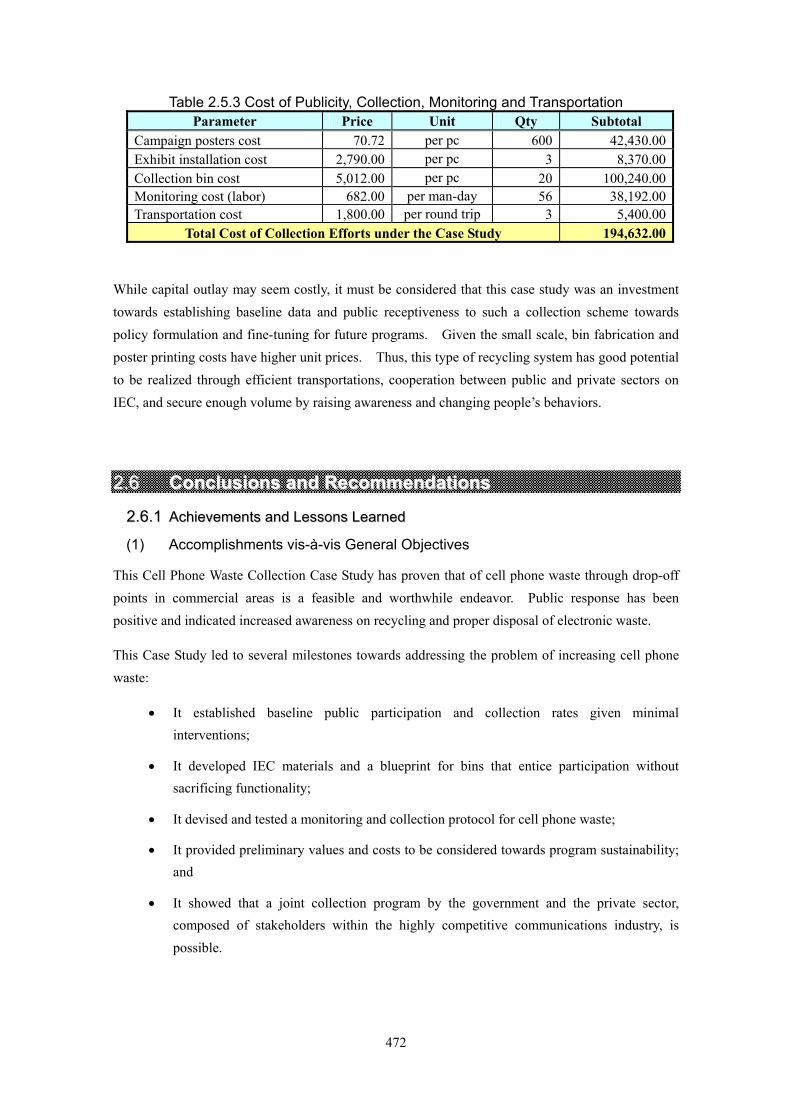
Capital outlay, such as the costs of IEC materials and bin production, as well as monitoring and transportation costs, are summarized in Table 2.5.3. Of these expenditures, the most significant cost was the production of the bin.
472
Table 2.5.3 Cost of Publicity, Collection, Monitoring and Transportation Parameter Price Unit Qty Subtotal
Campaign posters cost 70.72 per pc 600 42,430.00Exhibit installation cost 2,790.00 per pc 3 8,370.00Collection bin cost 5,012.00 per pc 20 100,240.00Monitoring cost (labor) 682.00 per man-day 56 38,192.00Transportation cost 1,800.00 per round trip 3 5,400.00
Total Cost of Collection Efforts under the Case Study 194,632.00
While capital outlay may seem costly, it must be considered that this case study was an investment towards establishing baseline data and public receptiveness to such a collection scheme towards policy formulation and fine-tuning for future programs. Given the small scale, bin fabrication and poster printing costs have higher unit prices. Thus, this type of recycling system has good potential to be realized through efficient transportations, cooperation between public and private sectors on IEC, and secure enough volume by raising awareness and changing people’s behaviors.
22..66 CCoonncclluussiioonnss aanndd RReeccoommmmeennddaattiioonnss
22..66..11 AAcchhiieevveemmeennttss aanndd LLeessssoonnss LLeeaarrnneedd
(1) Accomplishments vis-à-vis General Objectives
This Cell Phone Waste Collection Case Study has proven that of cell phone waste through drop-off points in commercial areas is a feasible and worthwhile endeavor. Public response has been positive and indicated increased awareness on recycling and proper disposal of electronic waste.
This Case Study led to several milestones towards addressing the problem of increasing cell phone waste:
• It established baseline public participation and collection rates given minimal interventions;
• It developed IEC materials and a blueprint for bins that entice participation without sacrificing functionality;
• It devised and tested a monitoring and collection protocol for cell phone waste;
• It provided preliminary values and costs to be considered towards program sustainability; and
• It showed that a joint collection program by the government and the private sector, composed of stakeholders within the highly competitive communications industry, is possible.
473
(2) Bin Design, Location and Maintenance
The design of the bin could be improved by taking into consideration the weak points observed during collection. The opening size may have to be increased to accommodate bulk deposits, such as batteries wrapped in plastic.
Since the bin and its contents serve as an IEC material in itself, maintaining its cleanliness cannot be over-emphasized. Miscellaneous trash such as paper or food wrappers deposited in these bins should be constantly removed, since these allow others to use it as a trash bin. In conjunction to this, bins should not be placed near food stalls, kiosks selling prepaid cards, or sales representatives giving away fliers.
(3) Establishments with High Concentration of Cell Phone Shops
IEC activities for cell phone retailers and repair technicians should be a pursued in future collection projects. Considering that majority of the gathered waste were sourced from these shops but were deposited by mall maintenance crew, true segregation at source would entail the formers’ active participation.
22..66..22 PPrroojjeecctt CCoonnttiinnuuiittyy
During the last TWG meeting, it was agreed upon that cell phone waste collection will continue after this case study, spearheaded by the participating malls in coordination with HMR Envirocycle. This will cover the same types of cell phone wastes, since sustainability would be dependent on recoverable recyclables to offset disposal of batteries. It will now include other branches, increasing the geographic coverage to include northern and southern Metro Manila, where residential areas are concentrated.
The cell phone and telecommunications industry players will continuously be involved through an ad-hoc committee that will meet regularly with the Steering Committee, which will still be chaired by DTI-BOI, for policy discussions and possible formation of a recycling association for cell phone waste.
22..66..33 RReeccoommmmeennddaattiioonnss aanndd FFuuttuurree CChhaalllleennggeess
(1) Insights for Policy
Increased involvement of the cell phone manufacturers in addressing the waste produced by the industry would be an ideal approach consistent with the Extended Producer Responsibility (EPR) principle. While there are a few take-back programs being conducted by individual manufacturers locally in consolidation with international corporate social responsibility policies, the impact of these programs is still to be felt.
A major difficulty in tackling proper cell phone waste disposal would be the inclusion of so-called “gray” items, such as generic/competition/imitation cell phone units, batteries, chargers and accessories, which dominate the market. Major manufacturers cannot be held responsible for products that do not carry their legitimate brand name. This would be where government and an
474
industry-based recycling committee should step in.
22..66..44 EExxppaannddiinngg PPuubblliicciittyy EEffffoorrttss
The reach of the publicity materials in the case study was limited mainly to customers who frequent the malls where the bins were deployed. Connecting with the waste generators at the household level could be achieved by print and broadcast media, capitalizing on the momentum established by the pilot project. Thus cooperation among not only government agencies but industries is also necessary in their respective roles in advancing publicity effort and thus cell phone waste recycling in the Philippines. TWG organized under this Case Study has a significant function that can permit a joint effort on achieving common goals among public and private entities, and continuous meetings to discuss further actions would cultivate the fruits.
475
3. Case Study III
33..11 BBaacckkggrroouunndd ooff tthhee CCaassee SSttuuddyy IIIIII ((MMoobbiillee PPllaassttiicc CCoolllleeccttiioonn AAnndd RReeccyycclliinngg))
The JICA Study Team and DTI-BOI, in coordination with relevant government agencies and the private sector, identified pilot projects to test the viability of recycling guidelines for plastics, paper, glass bottles, metals and electronic wastes as well as prepare Information and Education Campaign (IEC) materials to promote awareness on recycling.
For plastics, the Philippine Plastics Industry Association, Inc. (PPIA), a non-profit industry association, was contracted to implement a six-month pilot project entitled “Mobile Plastic Collection and Recycling”.
33..11..11 PPrroojjeecctt OObbjjeeccttiivveess
The main objective of this project is to:
• Enhance the recycling rate of plastics with focus on “plastic bags” through a mobile plastic collection and recycling approach, and
• Establish a mechanism for operational sustainability.
33..11..22 PPrroojjeecctt CCoonncceepptt
(1) With the emergence of recyclers of post-consumer plastic bags and films, there is a need to link up the generators of scrap plastics especially post-consumer plastic bags with the recyclers to develop a recycling market and to significantly reduce the volume of residual wastes.
(2) The Mobile Plastic Collection/ Recycling Project will serve as a showcase of the present capabilities for recycling plastic scraps and to increase awareness on the proper handling of waste plastics as prescribed in the Recycling Guidelines to increase their recovery and recycling.
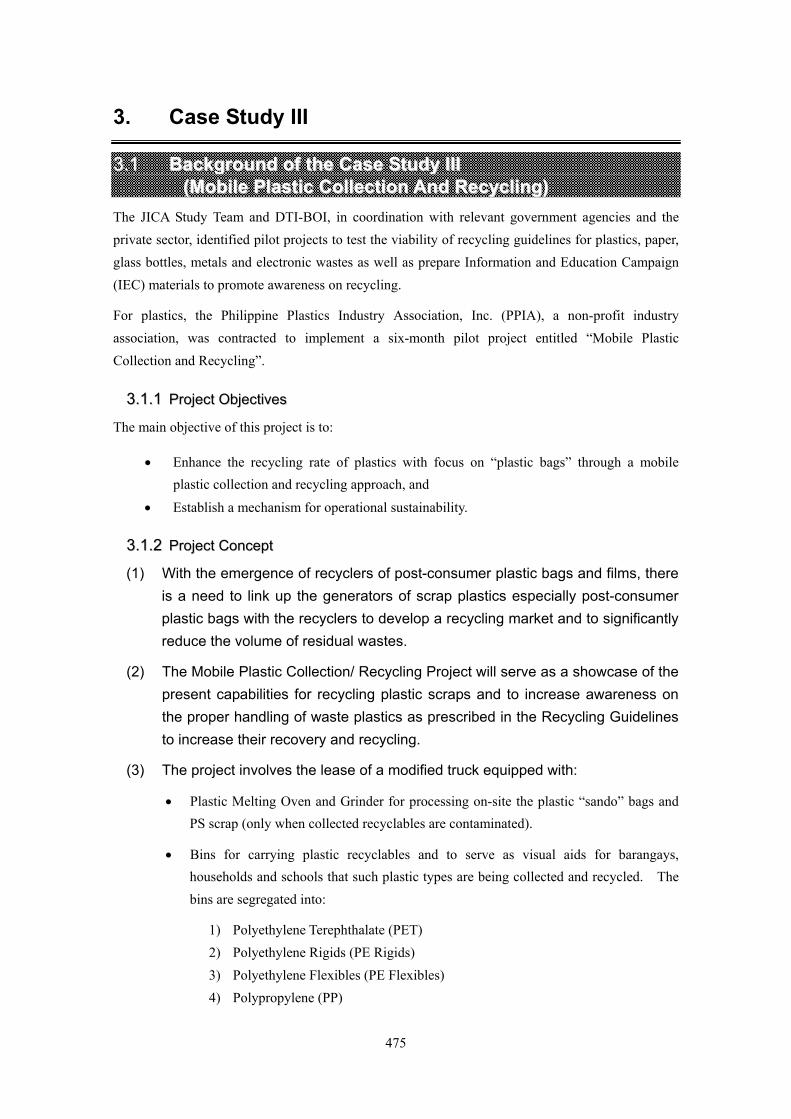
(3) The project involves the lease of a modified truck equipped with:
• Plastic Melting Oven and Grinder for processing on-site the plastic “sando” bags and PS scrap (only when collected recyclables are contaminated).
• Bins for carrying plastic recyclables and to serve as visual aids for barangays, households and schools that such plastic types are being collected and recycled. The bins are segregated into:
1) Polyethylene Terephthalate (PET) 2) Polyethylene Rigids (PE Rigids) 3) Polyethylene Flexibles (PE Flexibles) 4) Polypropylene (PP)
476
5) Polystyrene (Foam PS, EPS)
Figure 3.1.1 Mobile Plastic Recycling Truck Figure 3.1.2 Segregation Bins
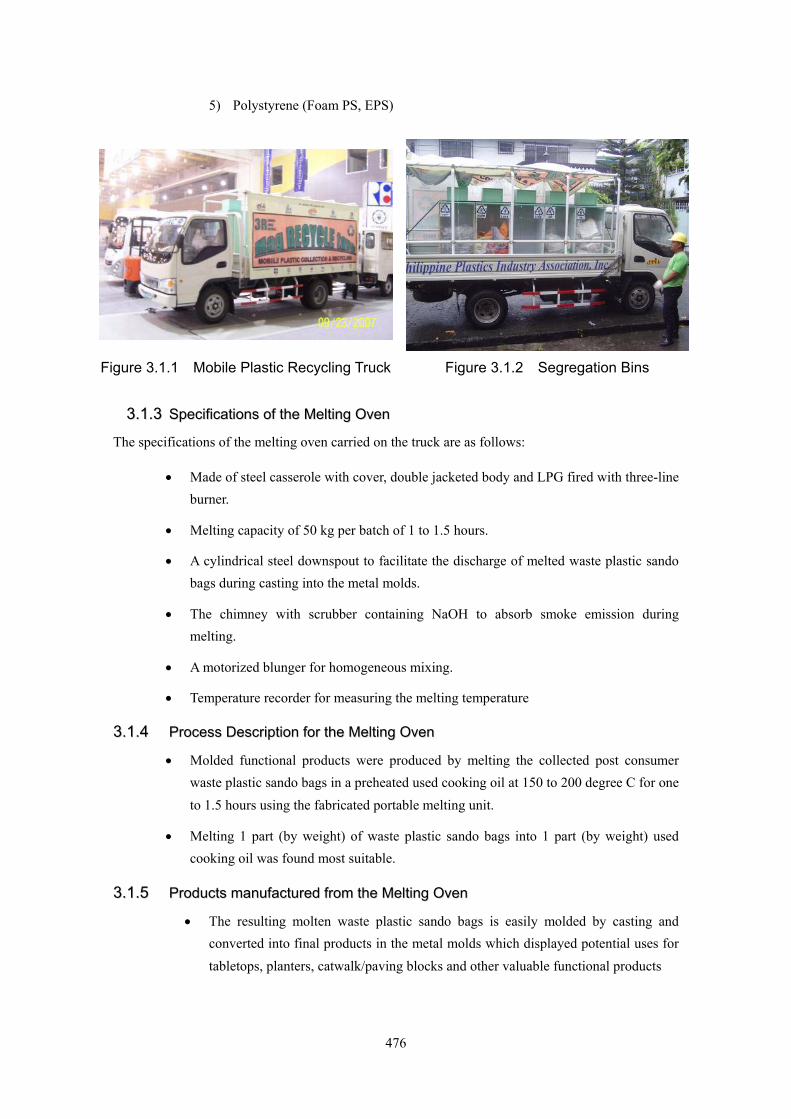
33..11..33 SSppeecciiffiiccaattiioonnss ooff tthhee MMeellttiinngg OOvveenn
The specifications of the melting oven carried on the truck are as follows:
• Made of steel casserole with cover, double jacketed body and LPG fired with three-line burner.
• Melting capacity of 50 kg per batch of 1 to 1.5 hours.
• A cylindrical steel downspout to facilitate the discharge of melted waste plastic sando bags during casting into the metal molds.
• The chimney with scrubber containing NaOH to absorb smoke emission during melting.
• A motorized blunger for homogeneous mixing.
• Temperature recorder for measuring the melting temperature
33..11..44 PPrroocceessss DDeessccrriippttiioonn ffoorr tthhee MMeellttiinngg OOvveenn
• Molded functional products were produced by melting the collected post consumer waste plastic sando bags in a preheated used cooking oil at 150 to 200 degree C for one to 1.5 hours using the fabricated portable melting unit.
• Melting 1 part (by weight) of waste plastic sando bags into 1 part (by weight) used cooking oil was found most suitable.
33..11..55 PPrroodduuccttss mmaannuuffaaccttuurreedd ffrroomm tthhee MMeellttiinngg OOvveenn
• The resulting molten waste plastic sando bags is easily molded by casting and converted into final products in the metal molds which displayed potential uses for tabletops, planters, catwalk/paving blocks and other valuable functional products
477
Figure 3.1.3 Plastic Melting Oven
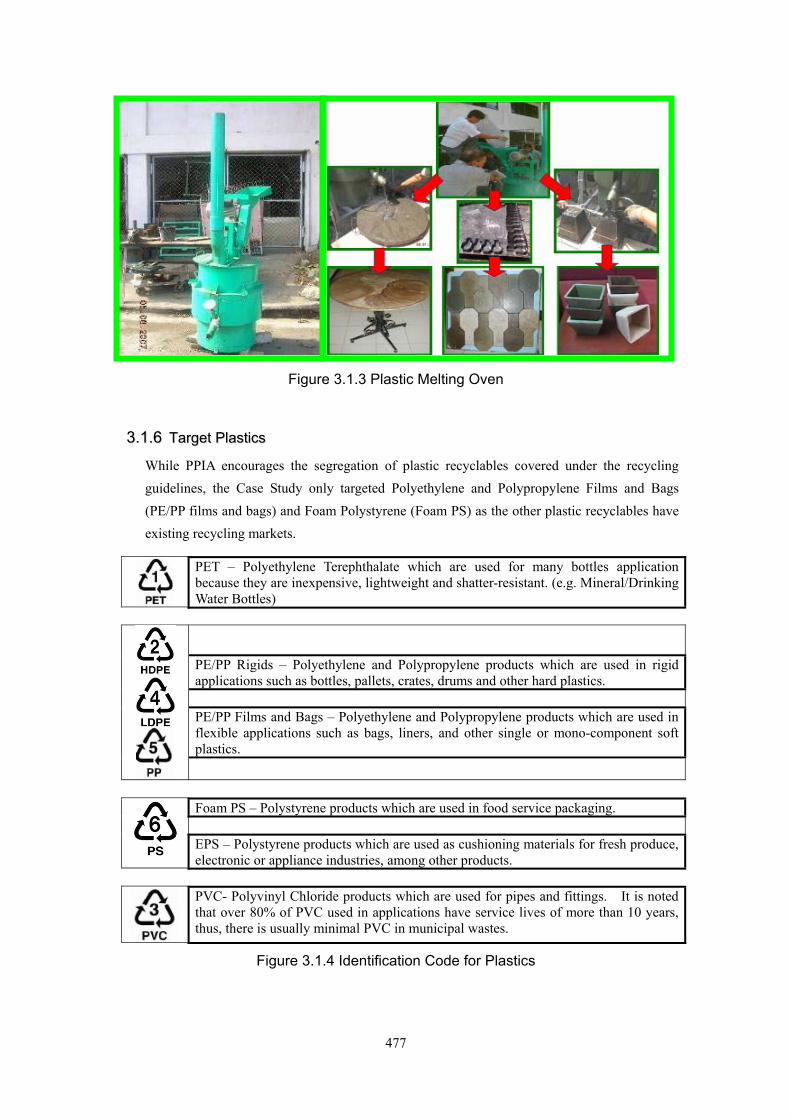
33..11..66 TTaarrggeett PPllaassttiiccss
While PPIA encourages the segregation of plastic recyclables covered under the recycling guidelines, the Case Study only targeted Polyethylene and Polypropylene Films and Bags (PE/PP films and bags) and Foam Polystyrene (Foam PS) as the other plastic recyclables have existing recycling markets.
PET – Polyethylene Terephthalate which are used for many bottles application because they are inexpensive, lightweight and shatter-resistant. (e.g. Mineral/Drinking Water Bottles)
PE/PP Rigids – Polyethylene and Polypropylene products which are used in rigid applications such as bottles, pallets, crates, drums and other hard plastics. PE/PP Films and Bags – Polyethylene and Polypropylene products which are used in flexible applications such as bags, liners, and other single or mono-component soft plastics.
Foam PS – Polystyrene products which are used in food service packaging.
EPS – Polystyrene products which are used as cushioning materials for fresh produce, electronic or appliance industries, among other products.
PVC- Polyvinyl Chloride products which are used for pipes and fittings. It is noted that over 80% of PVC used in applications have service lives of more than 10 years, thus, there is usually minimal PVC in municipal wastes.
Figure 3.1.4 Identification Code for Plastics
478
33..11..77 PPllaassttiicc BBaagg RReeccyycclliinngg
There are recyclers of plastic film bags located in Metro Manila. These firms either source their raw materials from post-industrial plastic films from bag manufacturers or post-consumer bags from dumpsite and other sources.
Table 3.1.1 Types and Use of Plastic Bags Types of Plastic Bags Examples
High Density Polyethylene (HDPE) Grocery, wet market bags or sando bags, and trash bags Low Density Polyethylene (LDPE) Bags for sugar, rice, toys, shopping bags in department
stores Polypropylene (PP) Packaging for T-shirt or clothing
Post-industrial plastic films particularly those made into plastic bags are 100% being recycled or converted into pellets. Once recycled, films can be used to manufacture a variety of products. For example, it is used in applications, such as trash bags and construction films. It is also used in household products, like garbage cans, wastebaskets and recycling bins.
Recyclers accept post-consumer plastic bags from LGUs as long as they can collect by the truckload or at least 500 kg per hauling on a regular basis. Payatas junkshops currently supply these recyclers.
For purposes of this study, PPIA partnered with the Metro Plastic Recycling Association, Inc. (MPRAI) for the recycling of plastic bags collected from the plastic sites. MPRAI cooperated by way of accepting non-commercial quantities of post-consumer plastic bags from the pilot sites.
There is a lot of potential for developing the recycling market for post-consumer plastic bags in Metro Manila which requires the cooperation by LGUs cascading to the barangays and the households. By collecting the recyclables from the households, they not only reduce the volume of waste going to the dumpsite but also derive income from trading additional recyclables with the junk shop operators. Recyclable materials sorted at source and kept clean and dry sell higher than when they are stained by garbage. This becomes an incentive for the Eco-aides to teach households to properly segregate and/or even clean the recyclables themselves.
33..11..88 FFooaamm PPoollyyssttyyrreennee RReeccyycclliinngg
Foam PS is currently sourced directly from fast food restaurants. PPIA is currently linking up with Polystyrene Packaging Council of the Philippines (PPCP) for the processing of Foam PS.
33..11..99 OOppeerraattiioonnaall FFrraammeewwoorrkk
(1) PPIA coordinates with the National Solid Waste Management Commission Secretariat and LGU Solid Waste Management Offices in the implementation of this project.
(2) The project has a two-fold approach:
• Promote the proper segregation by the households of plastic recyclables including
479
plastic bags and Foam PS following the established recycling guidelines at the
household level with the cooperation of Barangay Eco-aides.
• Link-up the barangays and schools with plastic recyclers for the collection of
post-consumer plastic bags and Foam PS.
(3) PPIA will only process the plastic bags and Foam PS through the melting oven in the event that the collected wastes are contaminated.
(4) Barangays and schools shall be given incentives to increase collection and segregation of plastics. For barangays and schools, PPIA shall donate plastic trash bags for every kg of plastic bags or Foam PS collected. For schools, PPIA shall install special standing bins to be strategically located inside schools as drop off points for plastic bags and Foam PS. PPIA shall also install plastic drums (120 liter) for temporary storage of target scraps inside the school MRFs.
33..11..1100 SSiittee SSeelleeccttiioonn CCrriitteerriiaa
The efforts of households in the barangays play a significant role in the recycling activities as their effort to segregate and properly handle recyclable materials will greatly affect the efficiency of scrap dealers and recyclers. PPIA encouraged barangays to cascade to the households the segregation and inclusion of plastic bags and Foam PS as part of their recyclables.
Barangays, on the other hand, may encourage buyers and junk shop dealers of plastic recyclables (especially PET, and rigid PE/ PP post consumer waste) to accept the collected plastic sando bags and take the responsibility in delivering the same to the recyclers. For barangays to sell the recyclables at a higher value, they may choose to deliver the waste plastic bags directly to the recycler. Thus, the project’s priority is for the recyclables to end up with the recyclers.
(1) Criteria for Barangays
PPIA, in consultation with the Solid Waste Management Offices of the Cities of Caloocan, Quezon and Valenzuela and the National Solid Waste Management Commission (NSWMC) Secretariat, arrived at the following criteria for selection:
• Must have an operational Material Recovery Facility (MRF) with an established network with junk shop operators.
• Has a record of plastic recyclables collected and traded
• Located near Barangays which makes clustering possible
For purposes of studying the effectivity of the criteria, PPIA chose LGUs with different levels of MRF operation.
480
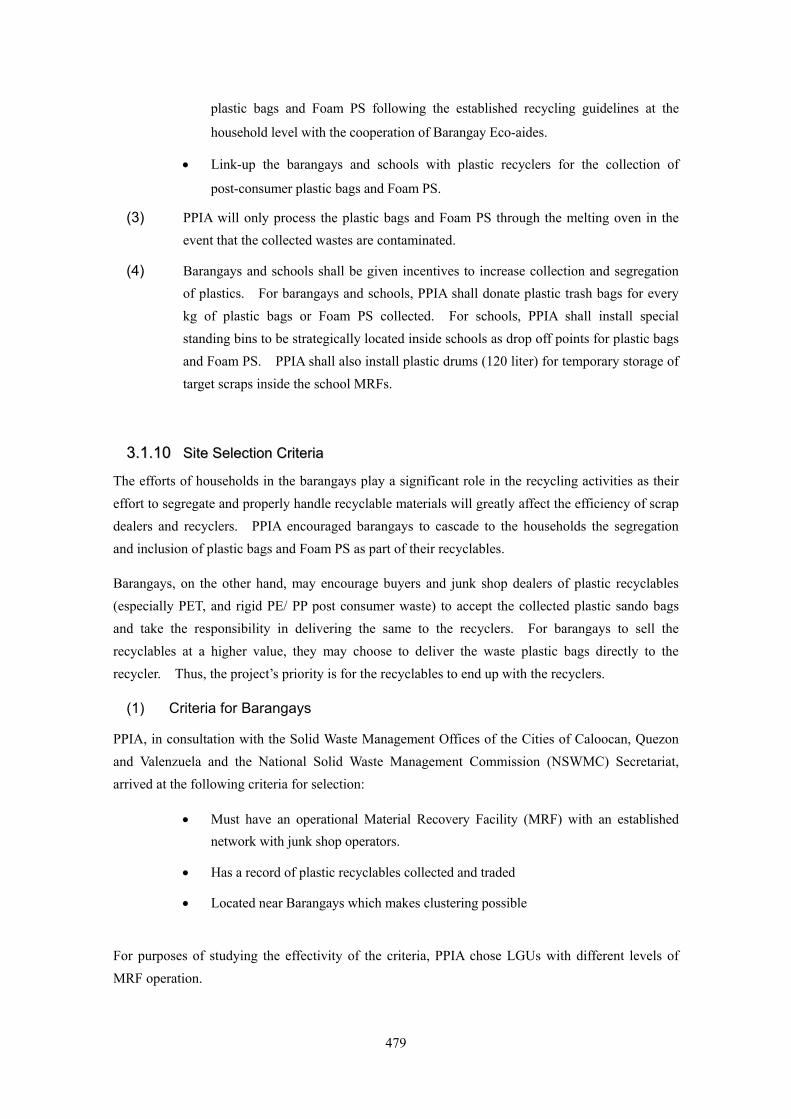
Table 3.1.2 Pilot LGUs Criteria LGU Coordinator Pilot Sites
Operational MRF
Quezon City
Quezon City Environmental Protection & Waste Management Department
- 4 Barangays
Semi-operational MRF
Caloocan City
Environmental Sanitation Services (ESS), Caloocan City
- 1 Cluster of 4 Barangays
- 1 Cluster of 6 Barangays
No MRF
Valenzuela City
Waste Management Office, Valenzuela City
- 1 Barangay
(2) Criteria for Schools:
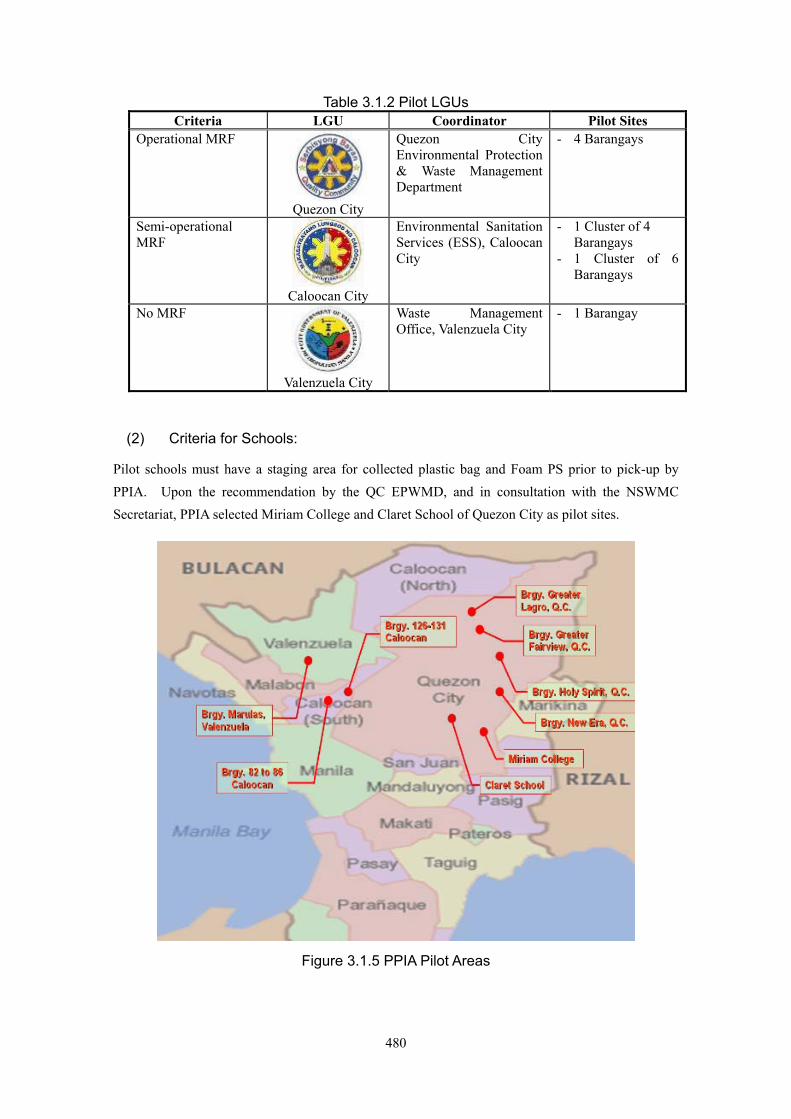
Pilot schools must have a staging area for collected plastic bag and Foam PS prior to pick-up by PPIA. Upon the recommendation by the QC EPWMD, and in consultation with the NSWMC Secretariat, PPIA selected Miriam College and Claret School of Quezon City as pilot sites.
Figure 3.1.5 PPIA Pilot Areas
481
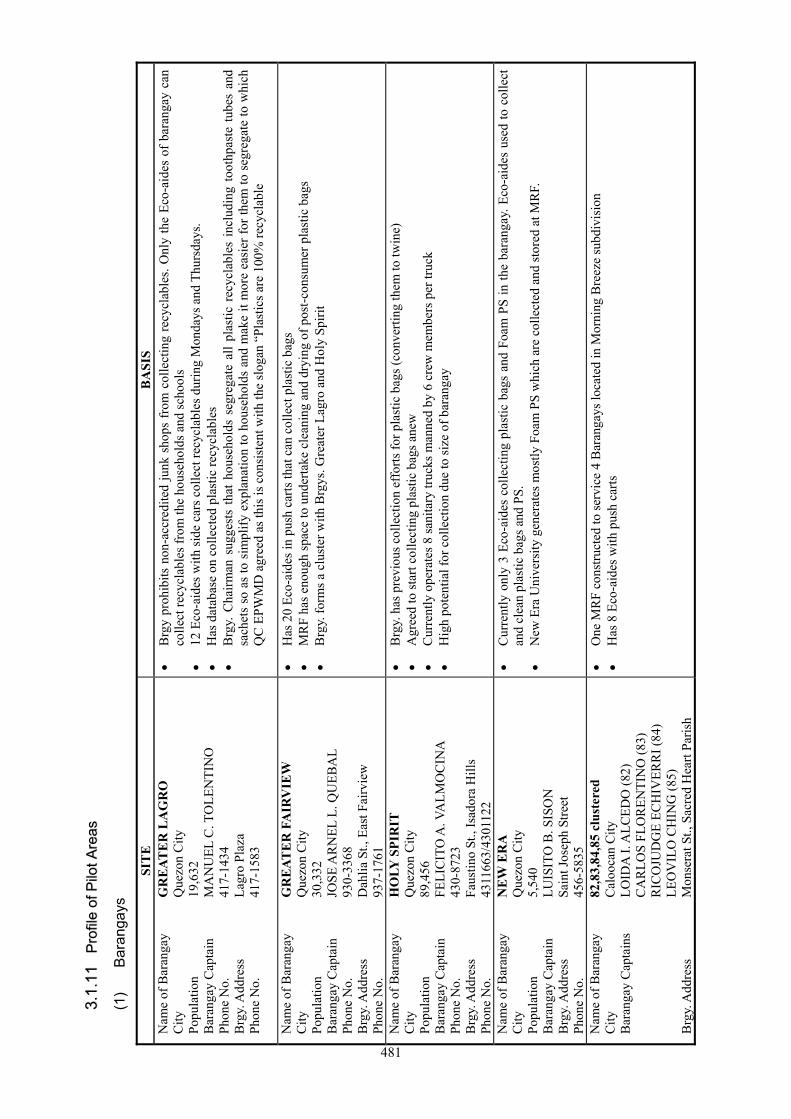
33 ..11 ..
11 11
PPrr oo
ff ii llee
oo ff PP
ii ll oott AA
rr eeaa ss
(1)
Bar
anga
ys
SIT
E
BA
SIS
Nam
e of
Bar
anga
y G
RE
ATE
R L
AG
RO
C
ity
Que
zon
City
Po
pula
tion
19,6
32
Bar
anga
y C
apta
in
MA
NU
EL C
. TO
LEN
TIN
O
Phon
e N
o.
417-
1434
B
rgy.
Add
ress
La
gro
Plaz
a Ph
one
No.
41
7-15
83
• B
rgy
proh
ibits
non
-acc
redi
ted
junk
sho
ps fr
om c
olle
ctin
g re
cycl
able
s. O
nly
the
Eco-
aide
s of
bar
anga
y ca
n co
llect
recy
clab
les f
rom
the
hous
ehol
ds a
nd sc
hool
s •
12 E
co-a
ides
with
side
car
s col
lect
recy
clab
les d
urin
g M
onda
ys a
nd T
hurs
days
. •
Has
dat
abas
e on
col
lect
ed p
last
ic re
cycl
able
s •
Brg
y. C
hairm
an s
ugge
sts
that
hou
seho
lds
segr
egat
e al
l pla
stic
rec
ycla
bles
incl
udin
g to
othp
aste
tube
s an
d sa
chet
s so
as
to s
impl
ify e
xpla
natio
n to
hou
seho
lds
and
mak
e it
mor
e ea
sier
for t
hem
to s
egre
gate
to w
hich
Q
C E
PWM
D a
gree
d as
this
is c
onsi
sten
t with
the
slog
an “
Plas
tics a
re 1
00%
recy
clab
le
Nam
e of
Bar
anga
y G
RE
ATE
R F
AIR
VIE
W
City
Q
uezo
n C
ity
Popu
latio
n 30
,332
B
aran
gay
Cap
tain
JO
SE A
RN
EL L
. QU
EBA
L Ph
one
No.
93
0-33
68
Brg
y. A
ddre
ss
Dah
lia S
t., E
ast F
airv
iew
Ph
one
No.
93
7-17
61
• H
as 2
0 Ec
o-ai
des i
n pu
sh c
arts
that
can
col
lect
pla
stic
bag
s •
MR
F ha
s eno
ugh
spac
e to
und
erta
ke c
lean
ing
and
dryi
ng o
f pos
t-con
sum
er p
last
ic b
ags
• B
rgy.
form
s a c
lust
er w
ith B
rgys
. Gre
ater
Lag
ro a
nd H
oly
Spiri
t
Nam
e of
Bar
anga
y H
OLY
SPI
RIT
C
ity
Que
zon
City
Po
pula
tion
89,4
56
Bar
anga
y C
apta
in
FELI
CIT
O A
. VA
LMO
CIN
A
Phon
e N
o.
430-
8723
B
rgy.
Add
ress
Fa
ustin
o St
., Is
ador
a H
ills
Phon
e N
o.
4311
663/
4301
122
• B
rgy.
has
pre
viou
s col
lect
ion
effo
rts fo
r pla
stic
bag
s (co
nver
ting
them
to tw
ine)
•
Agr
eed
to st
art c
olle
ctin
g pl
astic
bag
s ane
w
• C
urre
ntly
ope
rate
s 8 sa
nita
ry tr
ucks
man
ned
by 6
cre
w m
embe
rs p
er tr
uck
• H
igh
pote
ntia
l for
col
lect
ion
due
to si
ze o
f bar
anga
y
Nam
e of
Bar
anga
y N
EW
ER
A
City
Q
uezo
n C
ity
Popu
latio
n 5,
540
Bar
anga
y C
apta
in
LUIS
ITO
B. S
ISO
N
Brg
y. A
ddre
ss
Sain
t Jos
eph
Stre
et
Phon
e N
o.
456-
5835
• C
urre
ntly
onl
y 3
Eco-
aide
s co
llect
ing
plas
tic b
ags
and
Foam
PS
in th
e ba
rang
ay. E
co-a
ides
use
d to
col
lect
an
d cl
ean
plas
tic b
ags a
nd P
S.
• N
ew E
ra U
nive
rsity
gen
erat
es m
ostly
Foa
m P
S w
hich
are
col
lect
ed a
nd st
ored
at M
RF.
Nam
e of
Bar
anga
y 82
,83,
84,8
5 cl
uste
red
City
C
aloo
can
City
B
aran
gay
Cap
tain
s LO
IDA
I. A
LCED
O (8
2)
C
AR
LOS
FLO
REN
TIN
O (8
3)
R
ICO
JUD
GE
ECH
IVER
RI (
84)
LE
OV
ILO
CH
ING
(85)
B
rgy.
Add
ress
M
onse
rat S
t., S
acre
d H
eart
Paris
h
• O
ne M
RF
cons
truct
ed to
serv
ice
4 B
aran
gays
loca
ted
in M
orni
ng B
reez
e su
bdiv
isio
n •
Has
8 E
co-a
ides
with
pus
h ca
rts
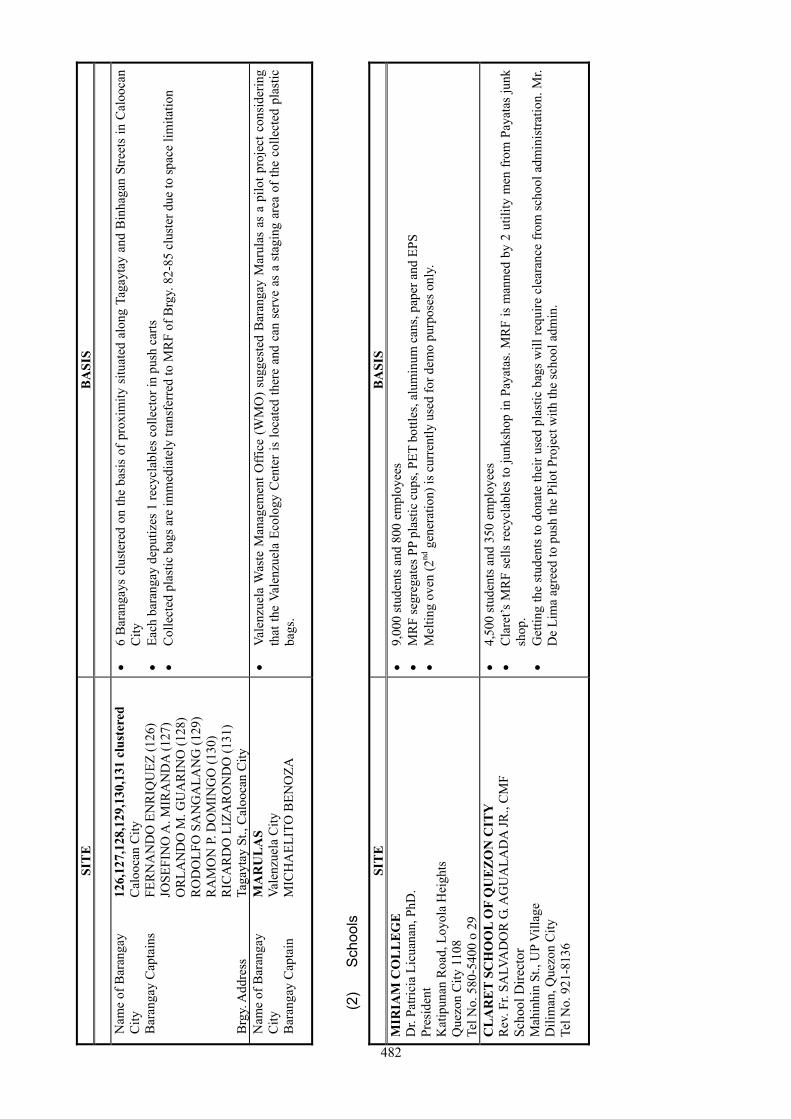
482
SIT
E
BA
SIS
Nam
e of
Bar
anga
y 12
6,12
7,12
8,12
9,13
0,13
1 cl
uste
red
City
C
aloo
can
City
B
aran
gay
Cap
tain
s FE
RN
AN
DO
EN
RIQ
UEZ
(126
)
JOSE
FIN
O A
. MIR
AN
DA
(127
)
OR
LAN
DO
M. G
UA
RIN
O (1
28)
R
OD
OLF
O S
AN
GA
LAN
G (1
29)
R
AM
ON
P. D
OM
ING
O (1
30)
R
ICA
RD
O L
IZA
RO
ND
O (1
31)
Brg
y. A
ddre
ss
Taga
ytay
St.,
Cal
ooca
n C
ity
• 6
Bar
anga
ys c
lust
ered
on
the
basi
s of
pro
xim
ity s
ituat
ed a
long
Tag
ayta
y an
d B
inha
gan
Stre
ets
in C
aloo
can
City
•
Each
bar
anga
y de
putiz
es 1
recy
clab
les c
olle
ctor
in p
ush
carts
•
Col
lect
ed p
last
ic b
ags a
re im
med
iate
ly tr
ansf
erre
d to
MR
F of
Brg
y. 8
2-85
clu
ster
due
to sp
ace
limita
tion
Nam
e of
Bar
anga
y M
AR
UL
AS
City
Va
lenz
uela
City
B
aran
gay
Cap
tain
M
ICH
AEL
ITO
BEN
OZA
• Va
lenz
uela
Was
te M
anag
emen
t Offi
ce (
WM
O)
sugg
este
d B
aran
gay
Mar
ulas
as
a pi
lot p
roje
ct c
onsi
derin
g th
at th
e Va
lenz
uela
Eco
logy
Cen
ter i
s lo
cate
d th
ere
and
can
serv
e as
a s
tagi
ng a
rea
of th
e co
llect
ed p
last
ic
bags
.
(2)
Sch
ools
SIT
E
BA
SIS
MIR
IAM
CO
LL
EG
E
Dr.
Patri
cia
Licu
anan
, PhD
. Pr
esid
ent
Kat
ipun
an R
oad,
Loy
ola
Hei
ghts
Q
uezo
n C
ity 1
108
Tel N
o. 5
80-5
400
o 29
• 9,
000
stud
ents
and
800
em
ploy
ees
• M
RF
segr
egat
es P
P pl
astic
cup
s, PE
T bo
ttles
, alu
min
um c
ans,
pape
r and
EPS
•
Mel
ting
oven
(2nd
gen
erat
ion)
is c
urre
ntly
use
d fo
r dem
o pu
rpos
es o
nly.
CL
AR
ET
SCH
OO
L O
F Q
UE
ZO
N C
ITY
R
ev. F
r. SA
LVA
DO
R G
. AG
UA
LAD
A JR
., C
MF
Scho
ol D
irect
or
Mah
inhi
n St
., U
P V
illag
e D
ilim
an, Q
uezo
n C
ity
Tel N
o. 9
21-8
136
• 4,
500
stud
ents
and
350
em
ploy
ees
• C
lare
t’s M
RF
sells
recy
clab
les
to ju
nksh
op in
Pay
atas
. MR
F is
man
ned
by 2
util
ity m
en fr
om P
ayat
as ju
nk
shop
. •
Get
ting
the
stud
ents
to d
onat
e th
eir u
sed
plas
tic b
ags w
ill re
quire
cle
aran
ce fr
om s
choo
l adm
inis
tratio
n. M
r. D
e Li
ma
agre
ed to
pus
h th
e Pi
lot P
roje
ct w
ith th
e sc
hool
adm
in.
483
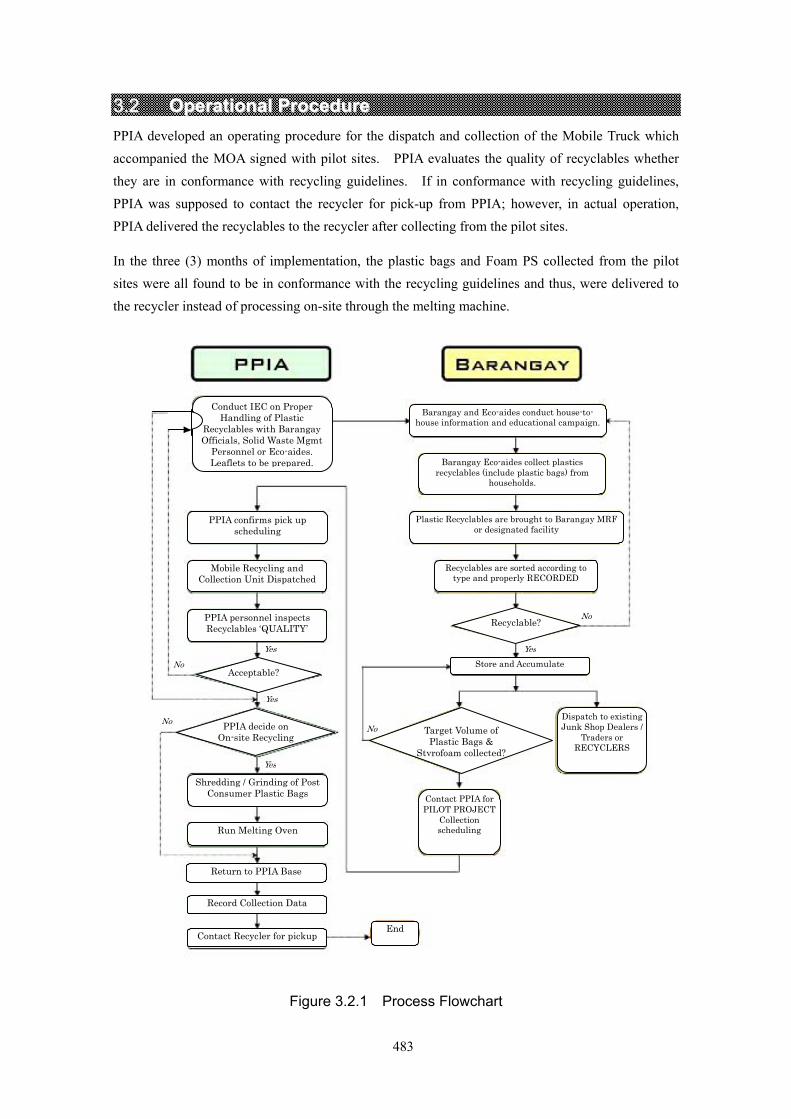
33..22 OOppeerraattiioonnaall PPrroocceedduurree PPIA developed an operating procedure for the dispatch and collection of the Mobile Truck which accompanied the MOA signed with pilot sites. PPIA evaluates the quality of recyclables whether they are in conformance with recycling guidelines. If in conformance with recycling guidelines, PPIA was supposed to contact the recycler for pick-up from PPIA; however, in actual operation, PPIA delivered the recyclables to the recycler after collecting from the pilot sites.
In the three (3) months of implementation, the plastic bags and Foam PS collected from the pilot sites were all found to be in conformance with the recycling guidelines and thus, were delivered to the recycler instead of processing on-site through the melting machine.
Conduct IEC on Proper Handling of Plastic
Recyclables with Barangay Officials, Solid Waste Mgmt
Personnel or Eco-aides. Leaflets to be prepared.
Barangay and Eco-aides conduct house-to- house information and educational campaign.
PPIA confirms pick up scheduling
Barangay Eco-aides collect plastics recyclables (include plastic bags) from
households.
Plastic Recyclables are brought to Barangay MRF or designated facility
Recyclables are sorted according to type and properly RECORDED
Store and Accumulate
Mobile Recycling and Collection Unit Dispatched
PPIA personnel inspects Recyclables ‘QUALITY’
Shredding / Grinding of Post Consumer Plastic Bags
Acceptable?
PPIA decide on On-site Recycling
Target Volume of Plastic Bags &
Styrofoam collected?
Recyclable?
Dispatch to existing Junk Shop Dealers /
Traders or RECYCLERS
Contact PPIA for PILOT PROJECT
Collection scheduling Run Melting Oven
Return to PPIA Base
Record Collection Data
Contact Recycler for pickup End
No
No
No Yes
Yes Yes
Yes
No
Figure 3.2.1 Process Flowchart
484
At Brgy. Greater Lagro, Holy Spirit and New Era plastic bags were already cleaned when given to the Brangay Eco-aides while in Brangay Greater Fairview, there were instances that Eco-aides have to clean and dry the plastic bags. In Caloocan, plastic bags picked up from households were already clean. Lack of awareness and discipline at the household level remains an issue in the implementation of the project.
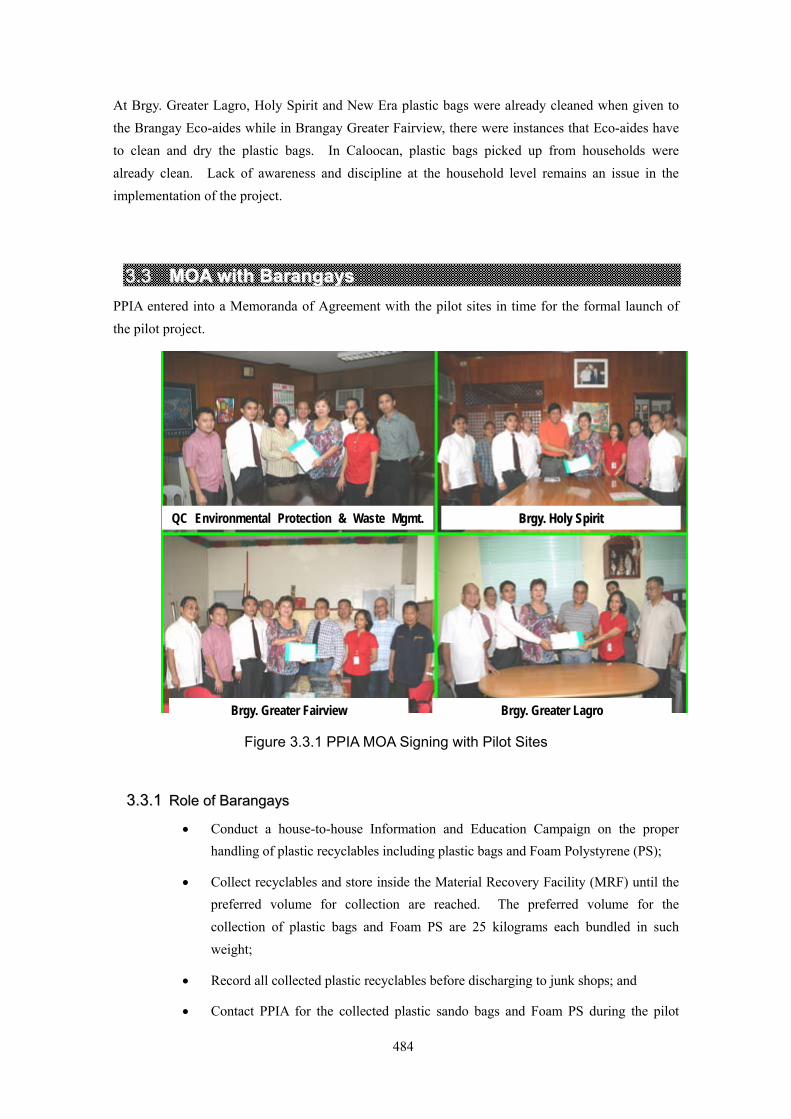
33..33 MMOOAA wwiitthh BBaarraannggaayyss PPIA entered into a Memoranda of Agreement with the pilot sites in time for the formal launch of the pilot project.
Figure 3.3.1 PPIA MOA Signing with Pilot Sites
33..33..11 RRoollee ooff BBaarraannggaayyss
• Conduct a house-to-house Information and Education Campaign on the proper handling of plastic recyclables including plastic bags and Foam Polystyrene (PS);
• Collect recyclables and store inside the Material Recovery Facility (MRF) until the preferred volume for collection are reached. The preferred volume for the collection of plastic bags and Foam PS are 25 kilograms each bundled in such weight;
• Record all collected plastic recyclables before discharging to junk shops; and
• Contact PPIA for the collected plastic sando bags and Foam PS during the pilot
QC Environmental Protection & Waste Mgmt.
Brgy. Greater Fairview
BBrrggyy.. HHoollyy SSppiirriitt
Brgy. Greater Lagro
485
project and eventually make arrangements with the existing accredited junk shops or plastic recyclable dealers operating within the area.
33..33..22 RRoollee ooff PPPPIIAA
• Conduct an orientation on the Guidelines on Proper Handling of Plastic Recyclables and provide IEC materials (e.g. leaflets, etc.) to Eco-aides;
• Schedule and dispatch the PPIA Mobile Plastic Recycling and Collection Truck to the respective barangay upon its advise when the preferred volume for collection are reached; and
• Operate the melting oven only when deemed necessary.
33..44 MMOOAA wwiitthh SScchhoooollss PPIA met with Miriam College and Claret School of Quezon City to formalize the partnership on the implementation of the pilot project. The outcome is as follows:
Table 3.4.1 Status of Pilot Schools PILOT SCHOOL STATUS
MIRIAM COLLEGE
- MOA signed on 6 November 2007 - Conduct of orientation for school personnel - PPIA donated 5 collection bins for the ff academic units:
• Grade School • High School • College Building • Child Study Center • Southeast Asian Institute of the Deaf
- PPIA donated 3 drums for the MRF - Provision of paper for 3,000 letters to parents - Collection of Plastic bags is 28 kg. and Foam PS is 49 kg.
CLARET SCHOOL OF QUEZON CITY
- Existing informal agreement with School administration - School’s collection of plastic bags generated inside the
campus started on September 3 - PPIA donated 3 Glutton bins and 2 drums to further promote
collection - Total plastic bag collected as of 11 Dec is 196.5 kg.
33..55 IInnffoorrmmaattiioonn,, EEdduuccaattiioonn aanndd CCaammppaaiiggnn
33..55..11 FFllyyeerrss PPrroommoottiinngg tthhee RReeccyycclliinngg GGuuiiddeelliinneess
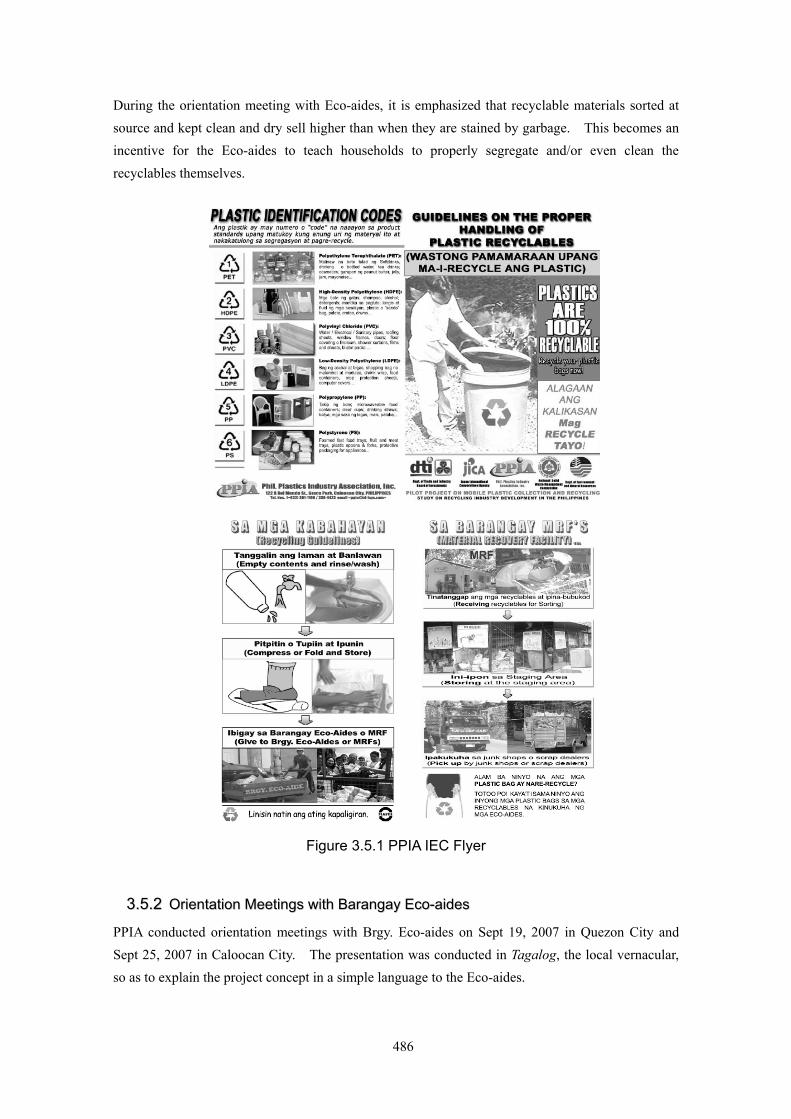
PPIA developed a flyer informing the households on the various types of plastic recyclables and encouraging them to properly segregate.
486
During the orientation meeting with Eco-aides, it is emphasized that recyclable materials sorted at source and kept clean and dry sell higher than when they are stained by garbage. This becomes an incentive for the Eco-aides to teach households to properly segregate and/or even clean the recyclables themselves.
Figure 3.5.1 PPIA IEC Flyer
33..55..22 OOrriieennttaattiioonn MMeeeettiinnggss wwiitthh BBaarraannggaayy EEccoo--aaiiddeess
PPIA conducted orientation meetings with Brgy. Eco-aides on Sept 19, 2007 in Quezon City and Sept 25, 2007 in Caloocan City. The presentation was conducted in Tagalog, the local vernacular, so as to explain the project concept in a simple language to the Eco-aides.
487
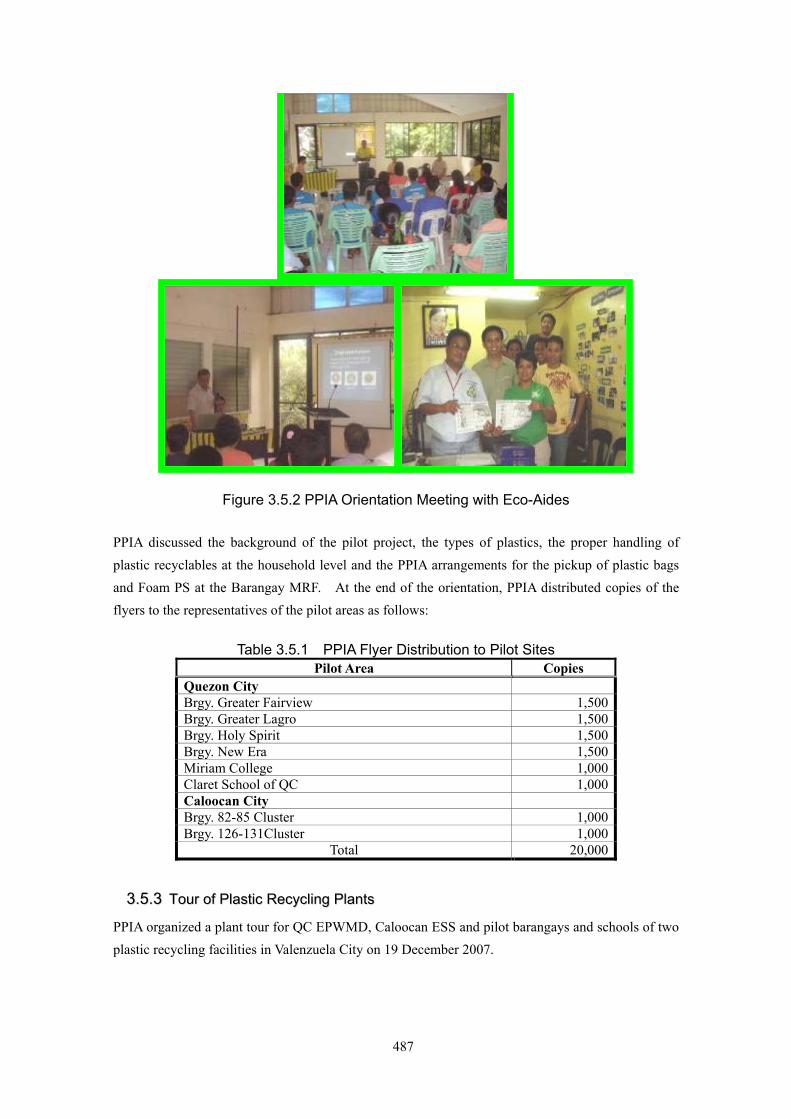
Figure 3.5.2 PPIA Orientation Meeting with Eco-Aides
PPIA discussed the background of the pilot project, the types of plastics, the proper handling of plastic recyclables at the household level and the PPIA arrangements for the pickup of plastic bags and Foam PS at the Barangay MRF. At the end of the orientation, PPIA distributed copies of the flyers to the representatives of the pilot areas as follows:
Table 3.5.1 PPIA Flyer Distribution to Pilot Sites Pilot Area Copies
Quezon City Brgy. Greater Fairview 1,500 Brgy. Greater Lagro 1,500 Brgy. Holy Spirit 1,500 Brgy. New Era 1,500 Miriam College 1,000 Claret School of QC 1,000 Caloocan City Brgy. 82-85 Cluster 1,000 Brgy. 126-131Cluster 1,000
Total 20,000
33..55..33 TToouurr ooff PPllaassttiicc RReeccyycclliinngg PPllaannttss
PPIA organized a plant tour for QC EPWMD, Caloocan ESS and pilot barangays and schools of two plastic recycling facilities in Valenzuela City on 19 December 2007.
488
Table 3.5.2 Recycling Plant Visited in the Tour Plant Type of Plastics
Phil-Ecoplast Recycling Industries Company, Inc. 1150 Oliveros Cmpd., F. Bautista St., Ugong, Valenzuela City
Plastic Bags
New Foundland Plastic Manufacturing Corp. #73 B. Maysan Rd., Valenzuela City
Rigid Plastics
The purpose of the plant visit is to provide the barangays with an appreciation of the actual recycling process for plastic scraps, especially the plastic bags which are the target recyclables in our project.
This activity was likewise intended to strengthen the link-up between the barangays and the recyclers in order to make the project sustainable and continue beyond the project schedule.
33..55..44 RRaaddiioo PPlluuggggiinngg ffoorr tthhee PPiilloott PPrroojjeecctt
PPIA held two radio plugs for the pilot project on November 17 and 24, 2007 at DZXL Radio Mindanao Network hosted by Ariel Fernandez. The topic of the discussion is Plastic Recyclables as Livelihood for Barangays. PPIA was headed by Ms. Mary G. Ng, PPIA president; Crispian Lao, PPIA vice president; Benson Tang, MPRAI president; Alfred Chan, Commissioner NSWMC and Mark Delumen, PPIA Secretariat. Two representatives from the barangays were Brgy. Chairman Rommel L. Carreon, Brgy. 738, Zone 80 (San Andres, Manila) and Brgy. Chairman Rodolfo G. Peña, Brgy. 699, Zone 76 (Malate, Manila).
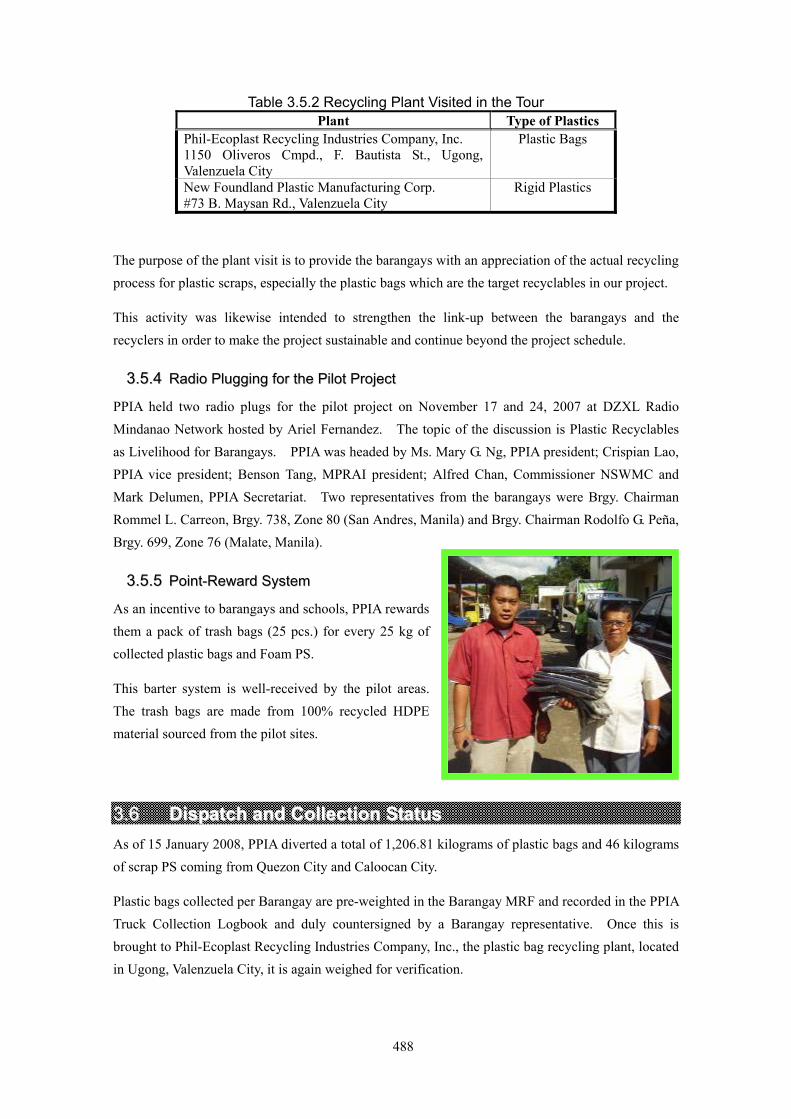
33..55..55 PPooiinntt--RReewwaarrdd SSyysstteemm
As an incentive to barangays and schools, PPIA rewards them a pack of trash bags (25 pcs.) for every 25 kg of collected plastic bags and Foam PS.
This barter system is well-received by the pilot areas. The trash bags are made from 100% recycled HDPE material sourced from the pilot sites.
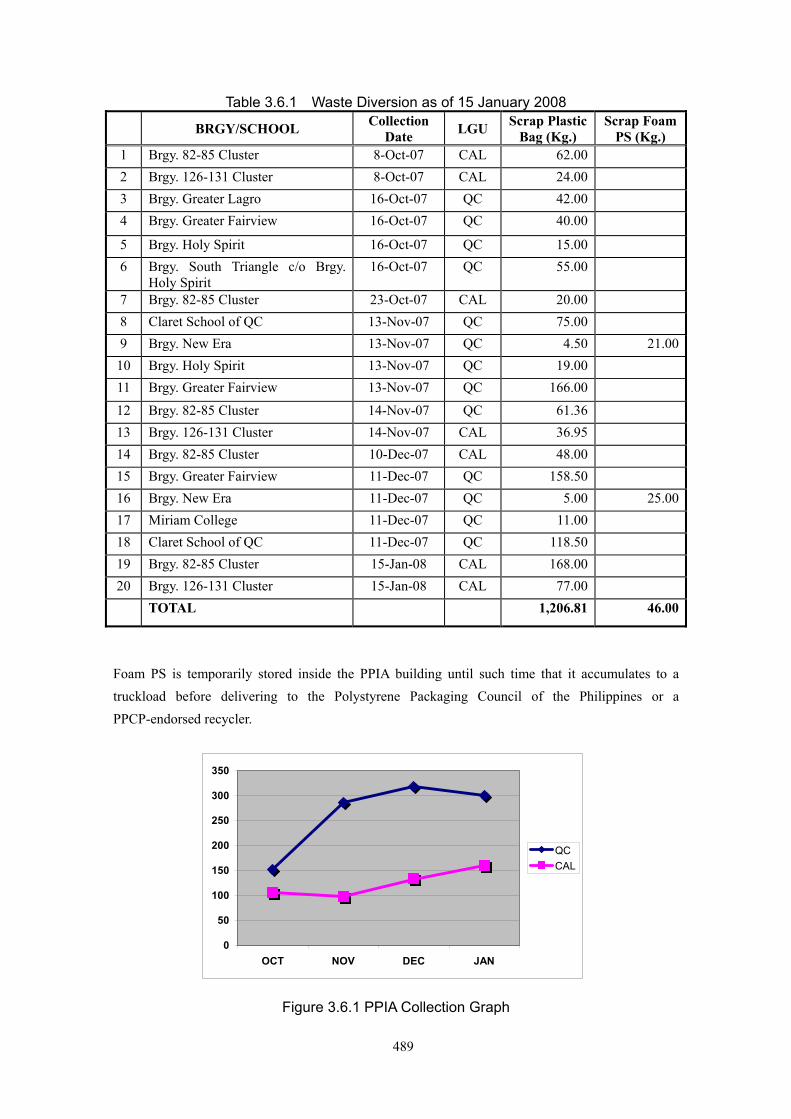
33..66 DDiissppaattcchh aanndd CCoolllleeccttiioonn SSttaattuuss As of 15 January 2008, PPIA diverted a total of 1,206.81 kilograms of plastic bags and 46 kilograms of scrap PS coming from Quezon City and Caloocan City.
Plastic bags collected per Barangay are pre-weighted in the Barangay MRF and recorded in the PPIA Truck Collection Logbook and duly countersigned by a Barangay representative. Once this is brought to Phil-Ecoplast Recycling Industries Company, Inc., the plastic bag recycling plant, located in Ugong, Valenzuela City, it is again weighed for verification.
489
Table 3.6.1 Waste Diversion as of 15 January 2008
BRGY/SCHOOL Collection Date LGU Scrap Plastic
Bag (Kg.) Scrap Foam
PS (Kg.) 1 Brgy. 82-85 Cluster 8-Oct-07 CAL 62.00 2 Brgy. 126-131 Cluster 8-Oct-07 CAL 24.00 3 Brgy. Greater Lagro 16-Oct-07 QC 42.00 4 Brgy. Greater Fairview 16-Oct-07 QC 40.00
5 Brgy. Holy Spirit 16-Oct-07 QC 15.00 6 Brgy. South Triangle c/o Brgy.
Holy Spirit 16-Oct-07 QC 55.00
7 Brgy. 82-85 Cluster 23-Oct-07 CAL 20.00 8 Claret School of QC 13-Nov-07 QC 75.00 9 Brgy. New Era 13-Nov-07 QC 4.50 21.00
10 Brgy. Holy Spirit 13-Nov-07 QC 19.00 11 Brgy. Greater Fairview 13-Nov-07 QC 166.00 12 Brgy. 82-85 Cluster 14-Nov-07 QC 61.36 13 Brgy. 126-131 Cluster 14-Nov-07 CAL 36.95 14 Brgy. 82-85 Cluster 10-Dec-07 CAL 48.00 15 Brgy. Greater Fairview 11-Dec-07 QC 158.50 16 Brgy. New Era 11-Dec-07 QC 5.00 25.00 17 Miriam College 11-Dec-07 QC 11.00 18 Claret School of QC 11-Dec-07 QC 118.50 19 Brgy. 82-85 Cluster 15-Jan-08 CAL 168.00 20 Brgy. 126-131 Cluster 15-Jan-08 CAL 77.00 TOTAL 1,206.81 46.00
Foam PS is temporarily stored inside the PPIA building until such time that it accumulates to a truckload before delivering to the Polystyrene Packaging Council of the Philippines or a PPCP-endorsed recycler.
0
50
100
150
200
250
300
350
OCT NOV DEC JAN
QCCAL
Figure 3.6.1 PPIA Collection Graph
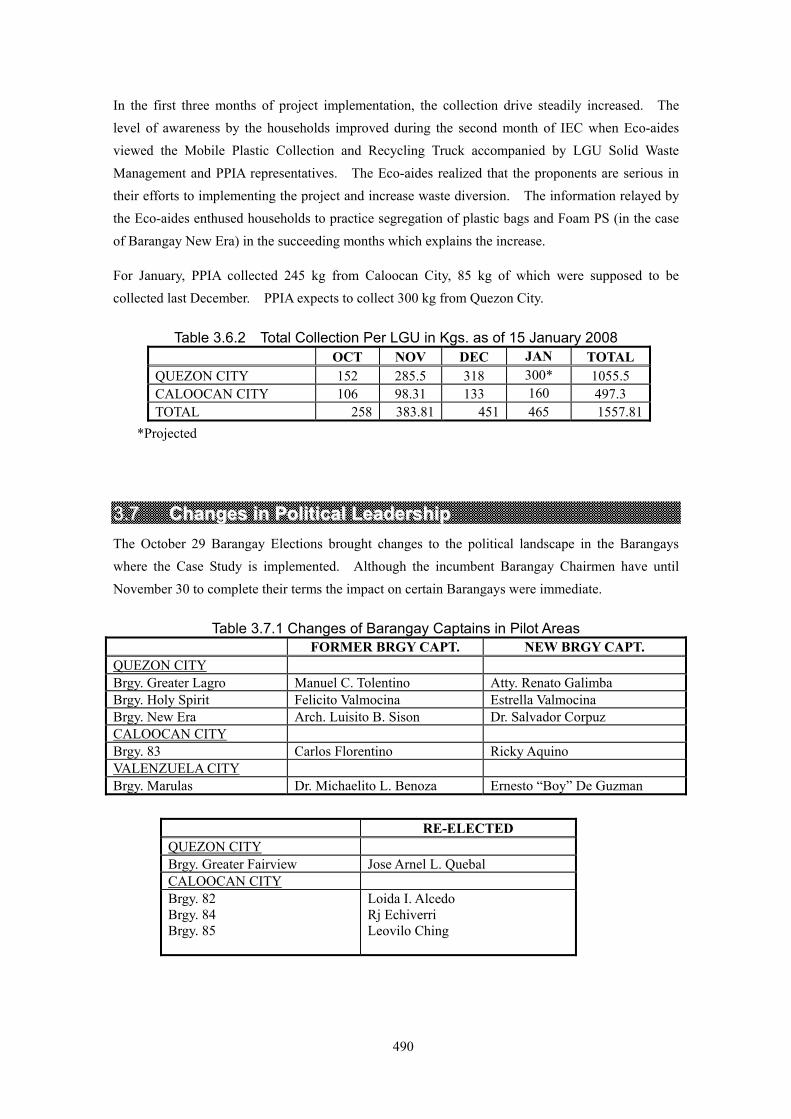
490
In the first three months of project implementation, the collection drive steadily increased. The level of awareness by the households improved during the second month of IEC when Eco-aides viewed the Mobile Plastic Collection and Recycling Truck accompanied by LGU Solid Waste Management and PPIA representatives. The Eco-aides realized that the proponents are serious in their efforts to implementing the project and increase waste diversion. The information relayed by the Eco-aides enthused households to practice segregation of plastic bags and Foam PS (in the case of Barangay New Era) in the succeeding months which explains the increase.
For January, PPIA collected 245 kg from Caloocan City, 85 kg of which were supposed to be collected last December. PPIA expects to collect 300 kg from Quezon City.
Table 3.6.2 Total Collection Per LGU in Kgs. as of 15 January 2008 OCT NOV DEC JAN TOTAL QUEZON CITY 152 285.5 318 300* 1055.5 CALOOCAN CITY 106 98.31 133 160 497.3 TOTAL 258 383.81 451 465 1557.81
*Projected
33..77 CChhaannggeess iinn PPoolliittiiccaall LLeeaaddeerrsshhiipp The October 29 Barangay Elections brought changes to the political landscape in the Barangays where the Case Study is implemented. Although the incumbent Barangay Chairmen have until November 30 to complete their terms the impact on certain Barangays were immediate.
Table 3.7.1 Changes of Barangay Captains in Pilot Areas FORMER BRGY CAPT. NEW BRGY CAPT. QUEZON CITY Brgy. Greater Lagro Manuel C. Tolentino Atty. Renato Galimba Brgy. Holy Spirit Felicito Valmocina Estrella Valmocina Brgy. New Era Arch. Luisito B. Sison Dr. Salvador Corpuz CALOOCAN CITY Brgy. 83 Carlos Florentino Ricky Aquino VALENZUELA CITY Brgy. Marulas Dr. Michaelito L. Benoza Ernesto “Boy” De Guzman
RE-ELECTED QUEZON CITY Brgy. Greater Fairview Jose Arnel L. Quebal CALOOCAN CITY Brgy. 82 Brgy. 84 Brgy. 85
Loida I. Alcedo Rj Echiverri Leovilo Ching
491
33..77..11 QQuueezzoonn CCiittyy
In Barangay Greater Lagro the loss of Chairman Manuel Tolentino meant the end of the Eco-boys in padyaks (side cars). As reported to us by the QC Environmental Protection and Waste Management Department (EPWMD), the Eco-boys who derive their allowances from the Chairman’s office have stopped operating since November 2007. According to EPWMD, the incoming Chairman, Atty. Renato Galimba, is reviewing the effectivity of the solid waste management program of the Barangay.
Meanwhile, there was continuity in Barangay Holy Spirit as Felicito Valmocina, who finished his third term will be replaced by his wife Estrella.
Likewise in Barangay New Era, Architect Luisito Sison was replaced by Kagawad Dr. Salvador Corpuz, who was a member of the Environment Committee of the Barangay who approved the signing of our MOA with them on 23 October.
In Barangay Fairview, it was a landslide victory for Chairman Jose Arnel Quebal who governs over the biggest Barangay in Quezon City.
33..77..22 CCaallooooccaann CCiittyy
Three of the four Barangay Chairmen were re-elected which augurs well for the project.
33..77..33 VVaalleennzzuueellaa CCiittyy
With the loss of Barangay Marulas Chairman, Dr. Michaelito Benoza, the Case Study Team have to re-introduce the project to the new Barangay Council. The previous Council of Barangay Marulas favorably endorsed the project to the Barangay Chairman; however, he was eventually defeated during the elections.
33..88 FFaaccttoorrss AAffffeeccttiinngg tthhee SSuucccceessss ooff tthhee PPrroojjeecctt The result of collection in pilot barangays indicated that a prerequisite for effective collection of plastic recyclables are the followings:
Factor Effect on the Project Political Changes in political leadership can disrupt project implementation
regardless of the MOA executed with a predecessor as successor is not bound to the MOA. This is the case for Barangay Lagro.
Infrastructure There is a need for an operational MRF which is a storage space with roofing and partitioned areas to hold recyclable materials in separate cells for plastic, glass, metal, aluminum, paper, etc. Brgy. Marulas in Valenzuela does not have a MRF and is incapable of recovering recyclables as a source of waste diversion. Brgys. 126-131 in Caloocan has a small MRF and does not have enough space to store collected plastic bags and relies on Brgys.82-85 MRF for storage. Eco-aides with push carts or karitons are necessary for the IEC and collection drive at the household level.
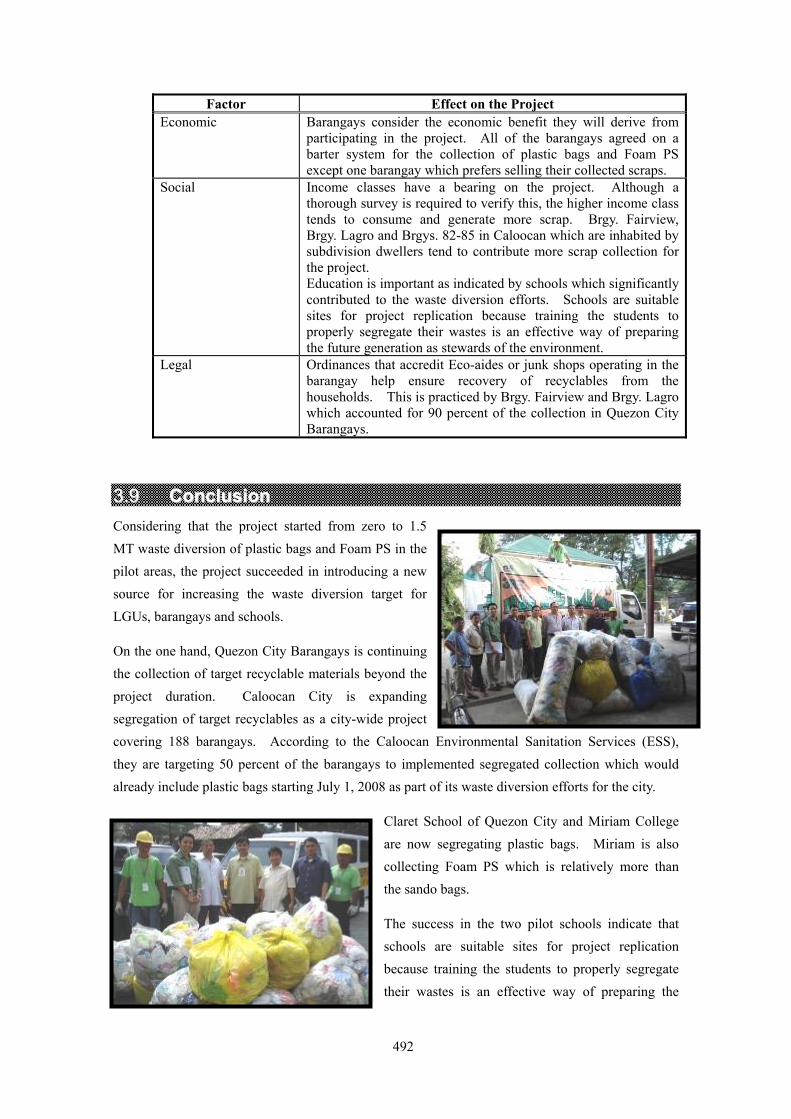
492
Factor Effect on the Project Economic Barangays consider the economic benefit they will derive from
participating in the project. All of the barangays agreed on a barter system for the collection of plastic bags and Foam PS except one barangay which prefers selling their collected scraps.
Social Income classes have a bearing on the project. Although a thorough survey is required to verify this, the higher income class tends to consume and generate more scrap. Brgy. Fairview, Brgy. Lagro and Brgys. 82-85 in Caloocan which are inhabited by subdivision dwellers tend to contribute more scrap collection for the project. Education is important as indicated by schools which significantly contributed to the waste diversion efforts. Schools are suitable sites for project replication because training the students to properly segregate their wastes is an effective way of preparing the future generation as stewards of the environment.
Legal Ordinances that accredit Eco-aides or junk shops operating in the barangay help ensure recovery of recyclables from the households. This is practiced by Brgy. Fairview and Brgy. Lagro which accounted for 90 percent of the collection in Quezon City Barangays.
33..99 CCoonncclluussiioonn Considering that the project started from zero to 1.5 MT waste diversion of plastic bags and Foam PS in the pilot areas, the project succeeded in introducing a new source for increasing the waste diversion target for LGUs, barangays and schools.
On the one hand, Quezon City Barangays is continuing the collection of target recyclable materials beyond the project duration. Caloocan City is expanding segregation of target recyclables as a city-wide project covering 188 barangays. According to the Caloocan Environmental Sanitation Services (ESS), they are targeting 50 percent of the barangays to implemented segregated collection which would already include plastic bags starting July 1, 2008 as part of its waste diversion efforts for the city.
Claret School of Quezon City and Miriam College are now segregating plastic bags. Miriam is also collecting Foam PS which is relatively more than the sando bags.
The success in the two pilot schools indicate that schools are suitable sites for project replication because training the students to properly segregate their wastes is an effective way of preparing the
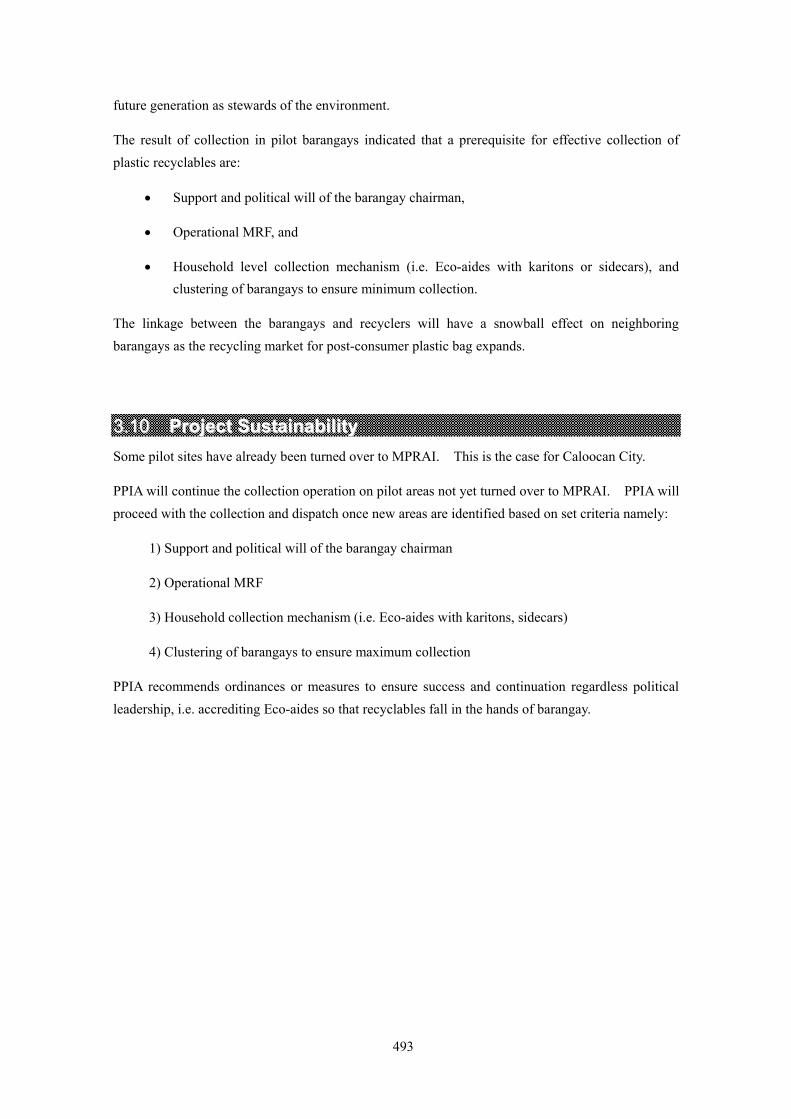
493
future generation as stewards of the environment.
The result of collection in pilot barangays indicated that a prerequisite for effective collection of plastic recyclables are:
• Support and political will of the barangay chairman,
• Operational MRF, and
• Household level collection mechanism (i.e. Eco-aides with karitons or sidecars), and clustering of barangays to ensure minimum collection.
The linkage between the barangays and recyclers will have a snowball effect on neighboring barangays as the recycling market for post-consumer plastic bag expands.
33..1100 PPrroojjeecctt SSuussttaaiinnaabbiilliittyy Some pilot sites have already been turned over to MPRAI. This is the case for Caloocan City.
PPIA will continue the collection operation on pilot areas not yet turned over to MPRAI. PPIA will proceed with the collection and dispatch once new areas are identified based on set criteria namely:
1) Support and political will of the barangay chairman
2) Operational MRF
3) Household collection mechanism (i.e. Eco-aides with karitons, sidecars)
4) Clustering of barangays to ensure maximum collection
PPIA recommends ordinances or measures to ensure success and continuation regardless political leadership, i.e. accrediting Eco-aides so that recyclables fall in the hands of barangay.