Embed Size (px)
DESCRIPTION
J. Bradford DeLong U.C. Berkeley IAS107 First Lecture Notes http://delong.typepad.com/berkeley_econ_101b_spring/ January 25, 2011 Resolution for screencast capture: 1024x768 Sections... M 10-11: 243 Dwinelle M 2-3: 183 Dwinelle M 3-4: 251 Dwinelle W 1-2: 255 Dwinelle W 4-5: 83 Dwinelle Th 2-3: 228 Dwinelle
Citation preview
Logistics: IAS 107
J. Bradford DeLong U.C. Berkeley
IAS107 First Lecture Notes
http://delong.typepad.com/berkeley_econ_101b_spring/
January 25, 2011
Resolution for screencast capture: 1024x768
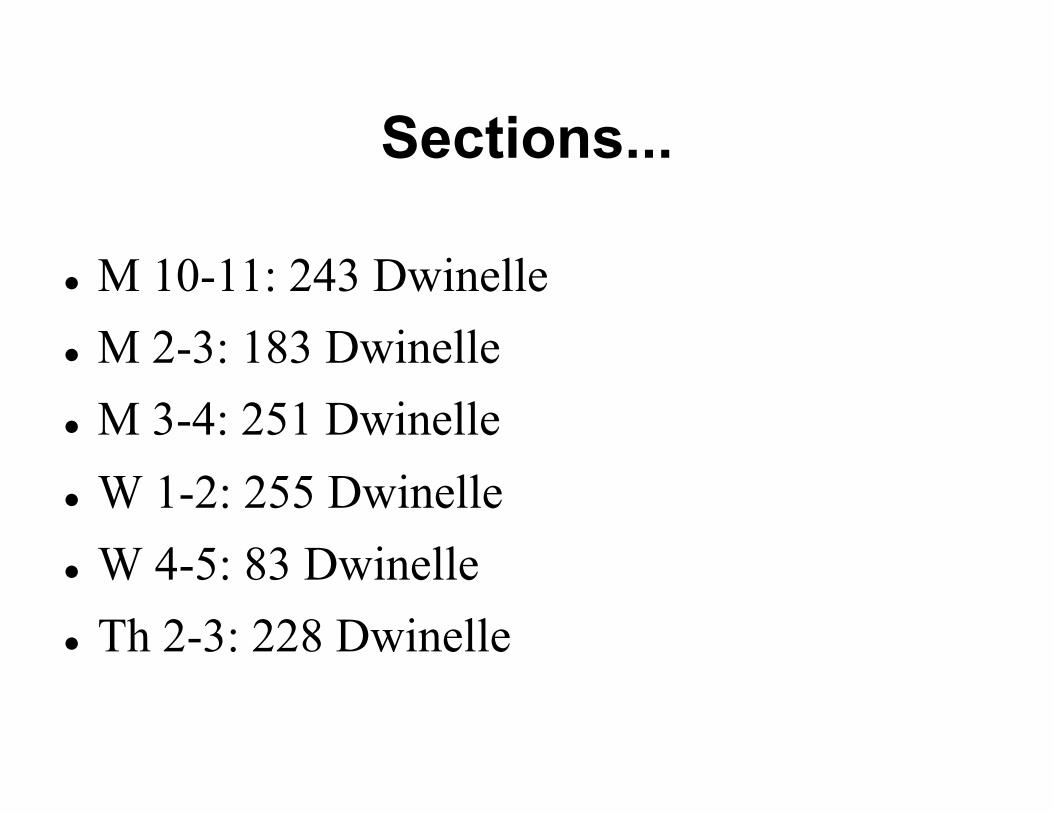
M 10-11: 243 Dwinelle M 2-3: 183 Dwinelle M 3-4: 251 Dwinelle W 1-2: 255 Dwinelle W 4-5: 83 Dwinelle Th 2-3: 228 Dwinelle
Sections...

Up at: <http://delong.typepad.com/20110118-ias-107-pset1.pdf>
Due on Th Jan 27 at the beginning of lecture.
Due at the start of lecture on Th Jan 27. A combination listen-to-lecture and data-
scavenger-hunt problem set. Thus easy to do.
Problem Set 1

Read the assigned chapters in the textbook. Look at the inside front and back covers of the
textbook. Listen to the lectures. Browse the Federal Reserve Economic Data website
<http://research.stlouisfed.org/fred2/> "Job Openings and Labor Turnover" and "Employment and Population: Household Survey”.
Browse the Gapminder Website <http://www.gapminder.org/world/>, and you will do fine.
Other problem sets will involve model-building and computation. This one doesn’t: this one is a warm-up.
How to Do Problem Set 1
The Overall Measure of Economic Activity
J. Bradford DeLong U.C. Berkeley
IAS107 Lecture Notes
http://delong.typepad.com/berkeley_econ_101b_spring
January 25, 2011
Resolution for screencast capture: 1024x768
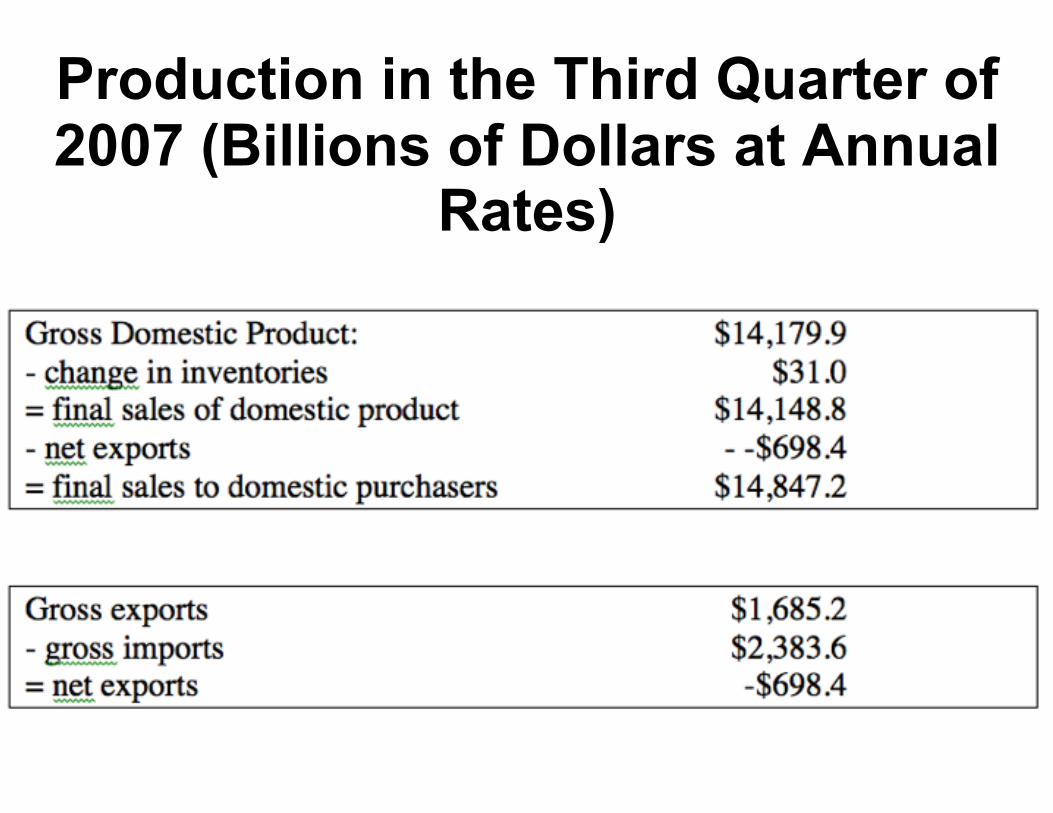
Production in the Third Quarter of 2007 (Billions of Dollars at Annual
Rates)
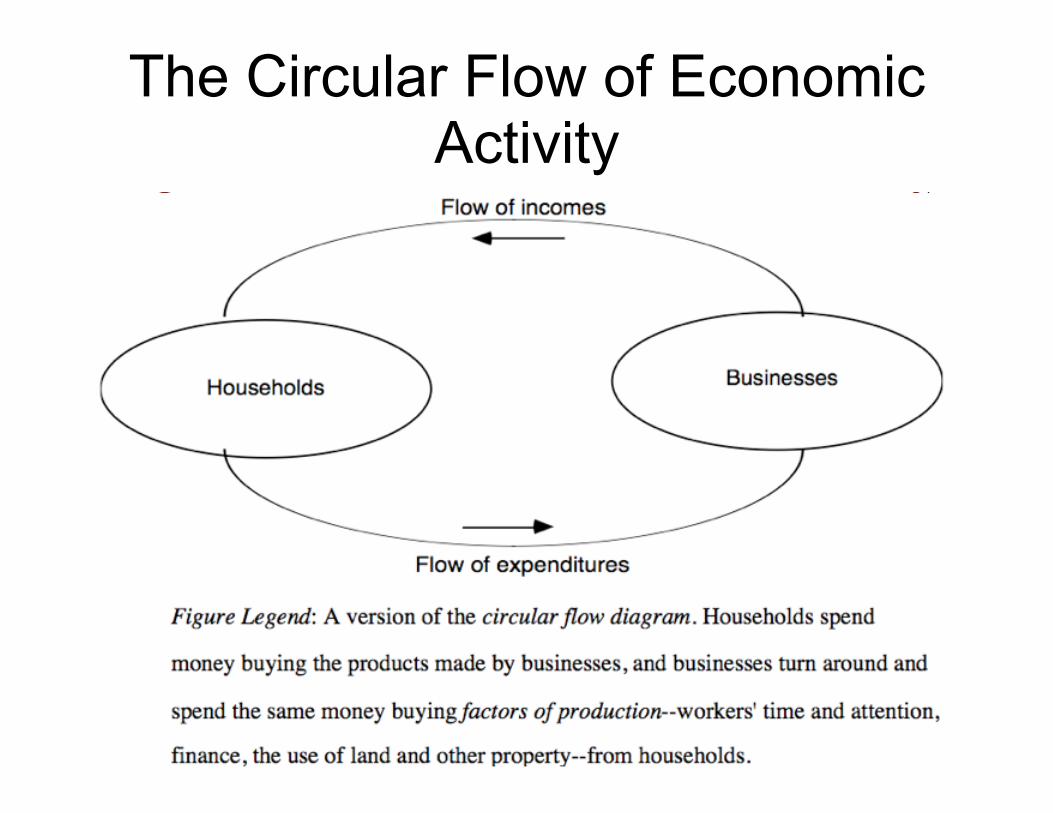
The Circular Flow of Economic Activity

Nobody makes unless they plan to sell or use....
Nobody sells unless they plan to buy... Thus total planned sales must be equal to
total planned spending... And the idea that there is a shortage of
demand is incoherent A shortage of demand for one commodity
—lattes, say—must be offset by a surplus of demand for another—yoga lessons
And so while we can have sectoral unemployment—unemployed baristas, say—we cannot have general unemployment, because when there are unemployed baristas there is a great shortage of yoga instructors
Jean-Baptiste Say and the Circular Flow
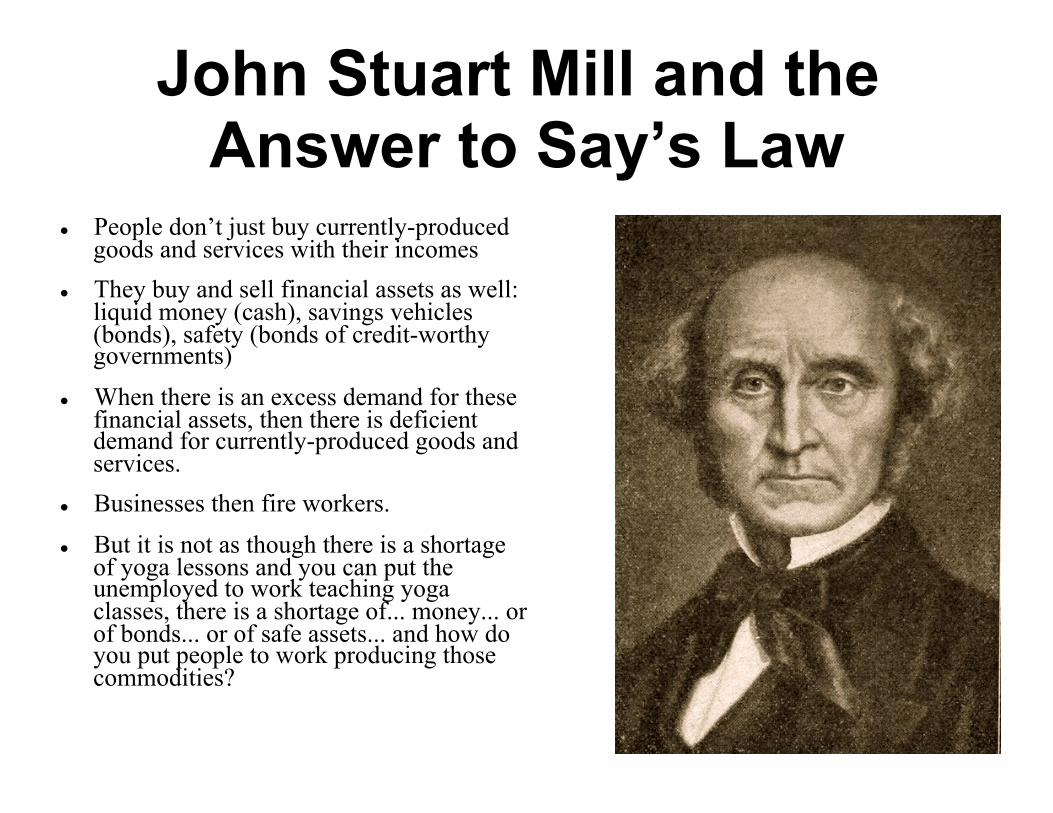
People don’t just buy currently-produced goods and services with their incomes
They buy and sell financial assets as well: liquid money (cash), savings vehicles (bonds), safety (bonds of credit-worthy governments)
When there is an excess demand for these financial assets, then there is deficient demand for currently-produced goods and services.
Businesses then fire workers. But it is not as though there is a shortage
of yoga lessons and you can put the unemployed to work teaching yoga classes, there is a shortage of... money... or of bonds... or of safe assets... and how do you put people to work producing those commodities?
John Stuart Mill and the Answer to Say’s Law

Introduction to Economic Growth J. Bradford DeLong
U.C. Berkeley IAS107 Lecture Notes
http://delong.typepad.com/berkeley_econ_101b_spring
January 25, 2011
Resolution for screencast capture: 1024x768

Say’s Law works... Or at least that it works right now... Or that the central bank—the Federal
Reserve—and the Treasury make it work well enough in practice even though it is false in theory...
Then what determines the level of real GDP Y?
Assume for the Next Couple of Weeks...
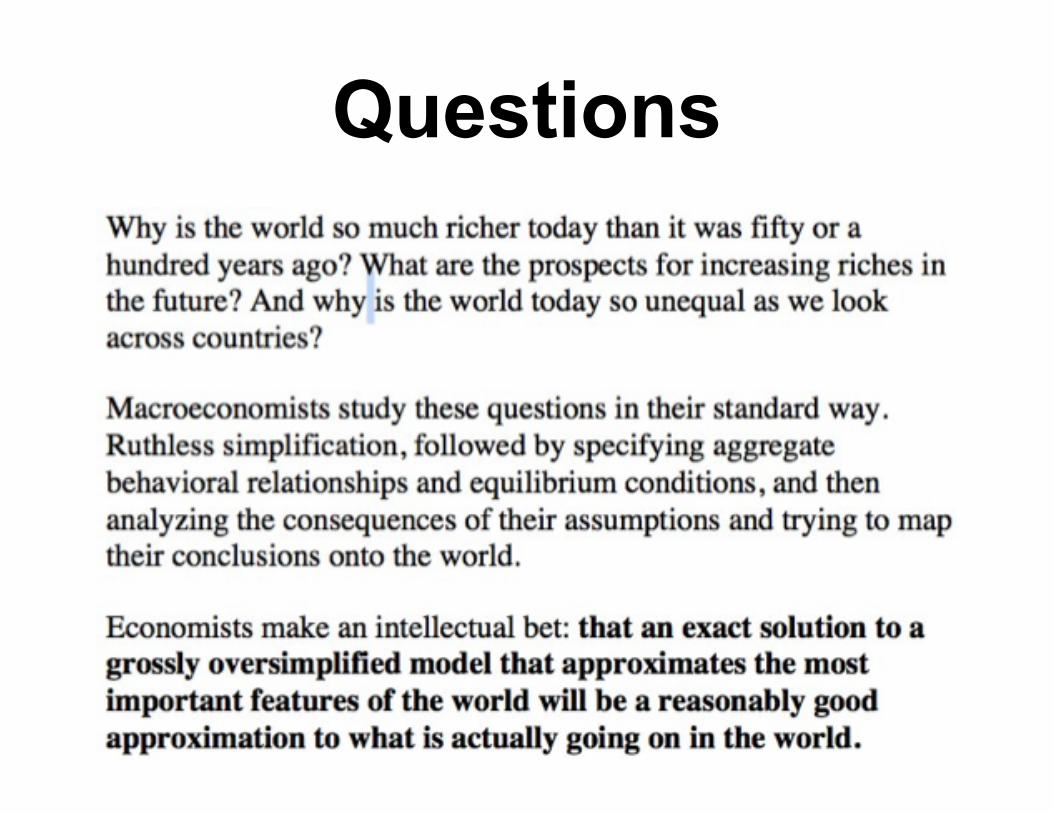
Questions
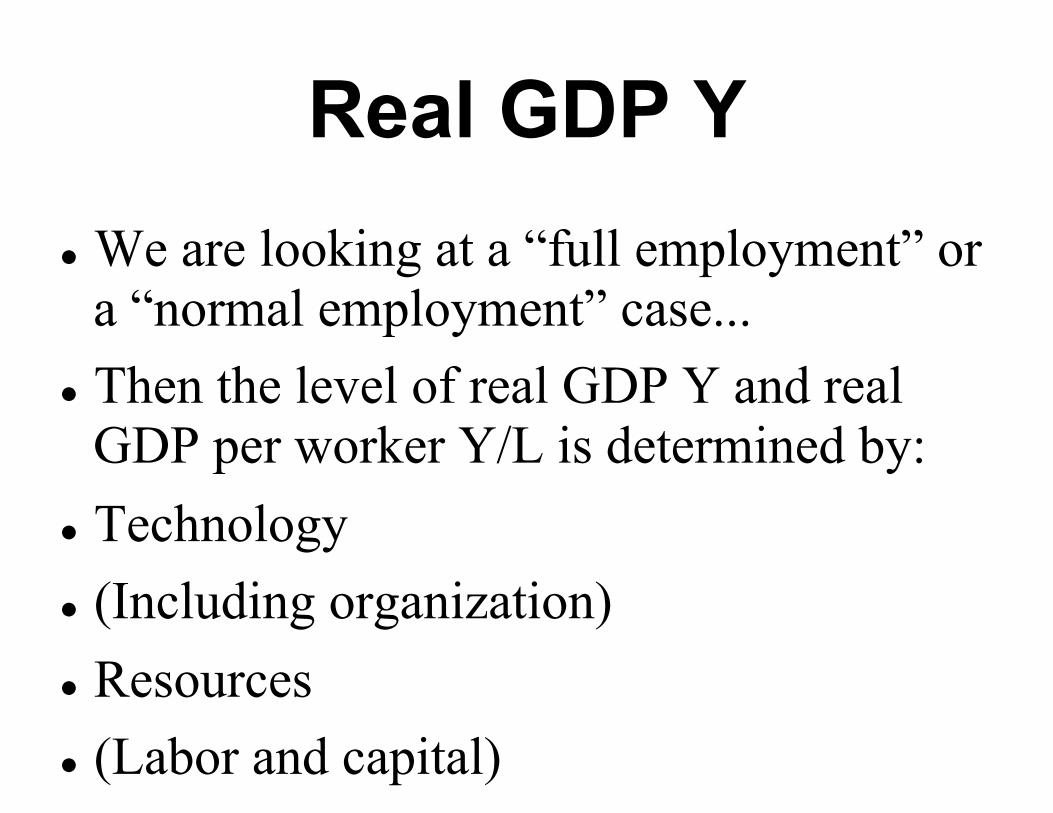
We are looking at a “full employment” or a “normal employment” case...
Then the level of real GDP Y and real GDP per worker Y/L is determined by:
Technology (Including organization) Resources (Labor and capital)
Real GDP Y
Cumulative processes build on each other. Suppose we have a process growing at
1% per year. How long does it take to double?
Compound Growth
4 x 18 = 72 6 x 12 = 72 The rule of 72 Only approximate Works for halving too... A quantity shrinking by 4% per year will halve
itself after 18 years
Notice Anything?
Real GDP Y Labor force L Capital stock K Efficiency of labor E
Basics for Our Model
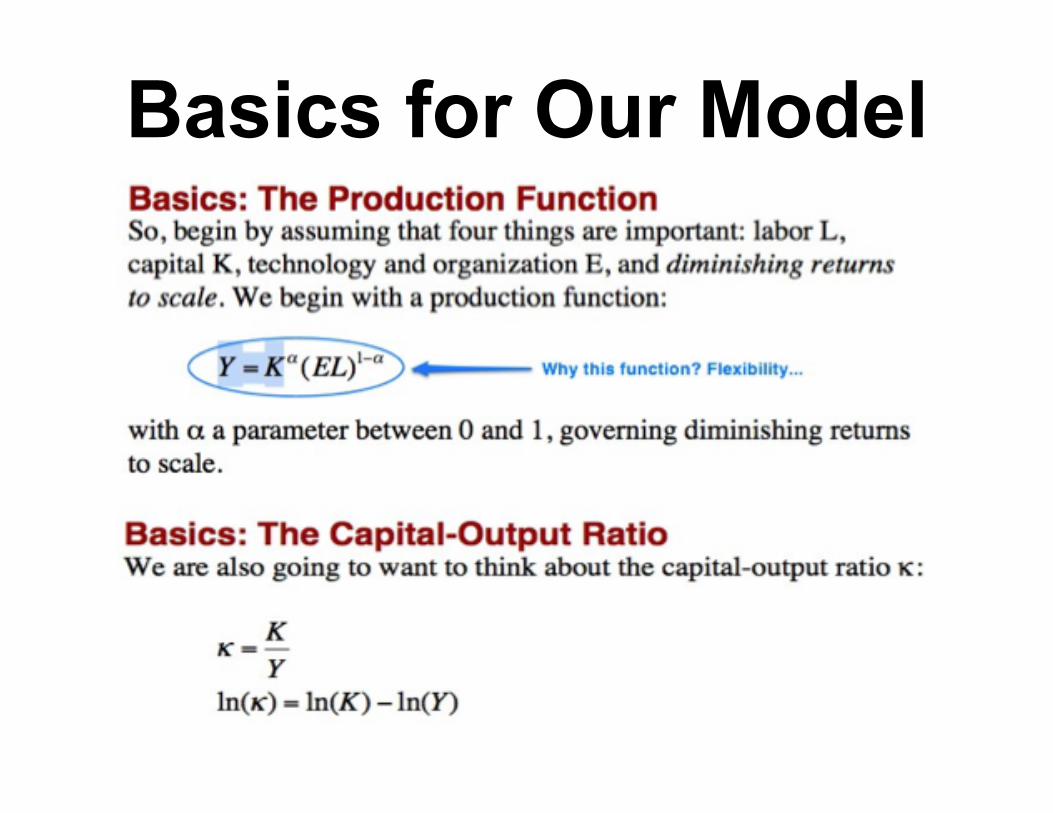
Basics for Our Model
If the economy is saving “a lot” of output, then the capital stock K will be growing faster than output Y—and the capital-output ratio κ = K/Y will rise...
If the economy is saving “a lot” of output, then the capital stock K will be growing slower than output Y—and the capital-output ratio κ = K/Y will fall...
If the economy is saving just the right amount, K and Y will be growing at the same rate and κ = K/Y will be constant: growth will be balanced...
Steady-State Balanced Growth Equilibrium
What is “just the right amount”? A property of our particular production
function: Y=Kα(EL)1-α If K goes up by 1%, Y goes up by α percent... So if E goes up by g%, and L goes up by n%,
and Y goes up by y%: y% = αk% + (1-α)(n%+g%) If growth is to be balanced, y%=k% So then: y% = n% + g%
Steady-State Balanced Growth Equilibrium II
If E goes up by g%, and L goes up by n%, and Y goes up by y%:
y% = αk% + (1-α)(n%+g%) If growth is to be balanced, y%=k% So then: k% = y% = n% + g% But also: k = s/κ – δ s/κ – δ = n + g κ = s/(n+g+δ) That tells you what the steady-state balanced-
growth capital intensity of the economy is going to be.
Steady-State Balanced Growth Equilibrium III
Start with the production function: Y=Kα(EL)1-α
Rewrite to substitute in the capital-output ratio:
Y=(Yκ)α(EL)1-α
Distribute the exponent: Y=Yακα(EL)1-α
Calculating the Balanced-Growth Path
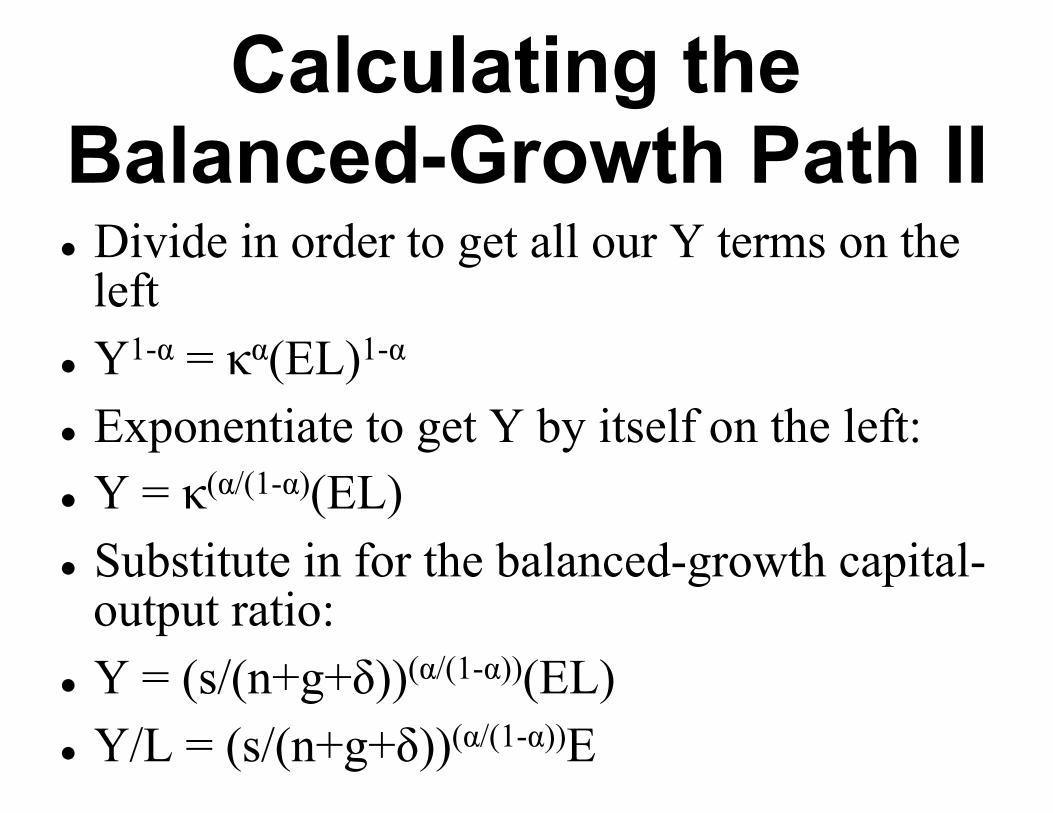
Divide in order to get all our Y terms on the left
Y1-α = κα(EL)1-α
Exponentiate to get Y by itself on the left: Y = κ(α/(1-α)(EL) Substitute in for the balanced-growth capital-
output ratio: Y = (s/(n+g+δ))(α/(1-α))(EL) Y/L = (s/(n+g+δ))(α/(1-α))E
Calculating the Balanced-Growth Path II
Because if an economy is not on its balanced-growth path, it is heading for its balanced-growth path...
And it will get close to its balanced-growth path in no more than a couple of generations...
Why Is This Interesting?
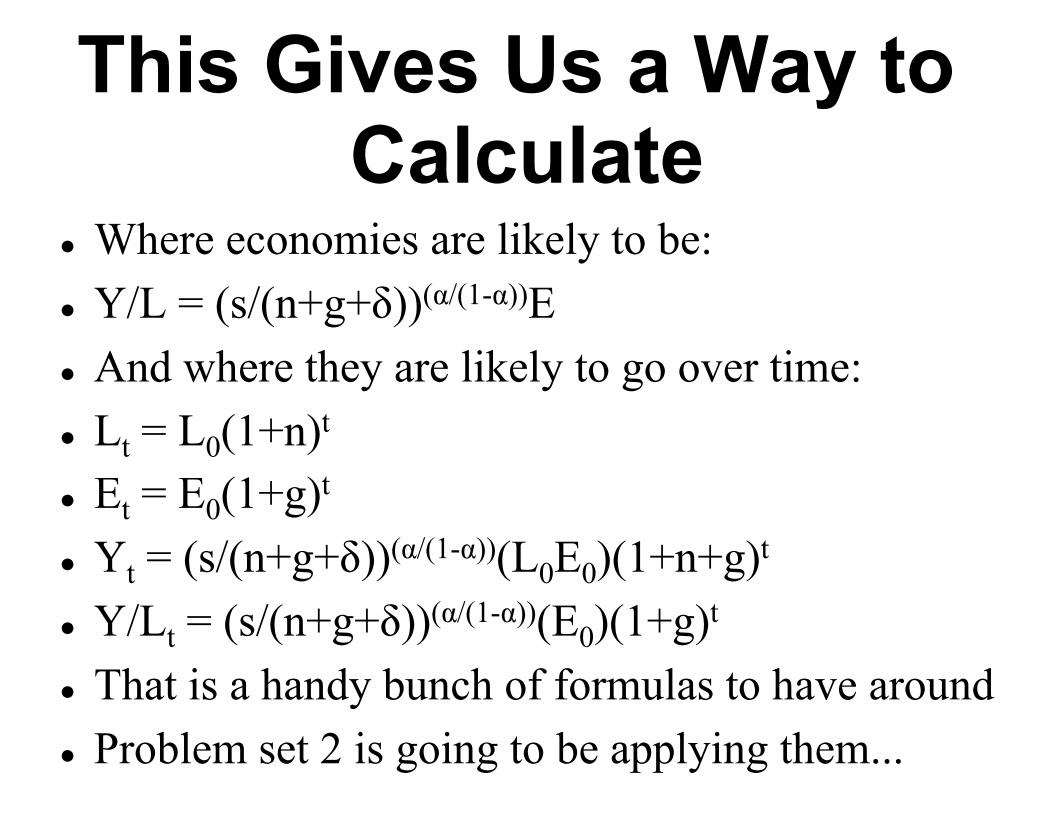
Where economies are likely to be: Y/L = (s/(n+g+δ))(α/(1-α))E And where they are likely to go over time: Lt = L0(1+n)t Et = E0(1+g)t Yt = (s/(n+g+δ))(α/(1-α))(L0E0)(1+n+g)t Y/Lt = (s/(n+g+δ))(α/(1-α))(E0)(1+g)t That is a handy bunch of formulas to have around Problem set 2 is going to be applying them...
This Gives Us a Way to Calculate
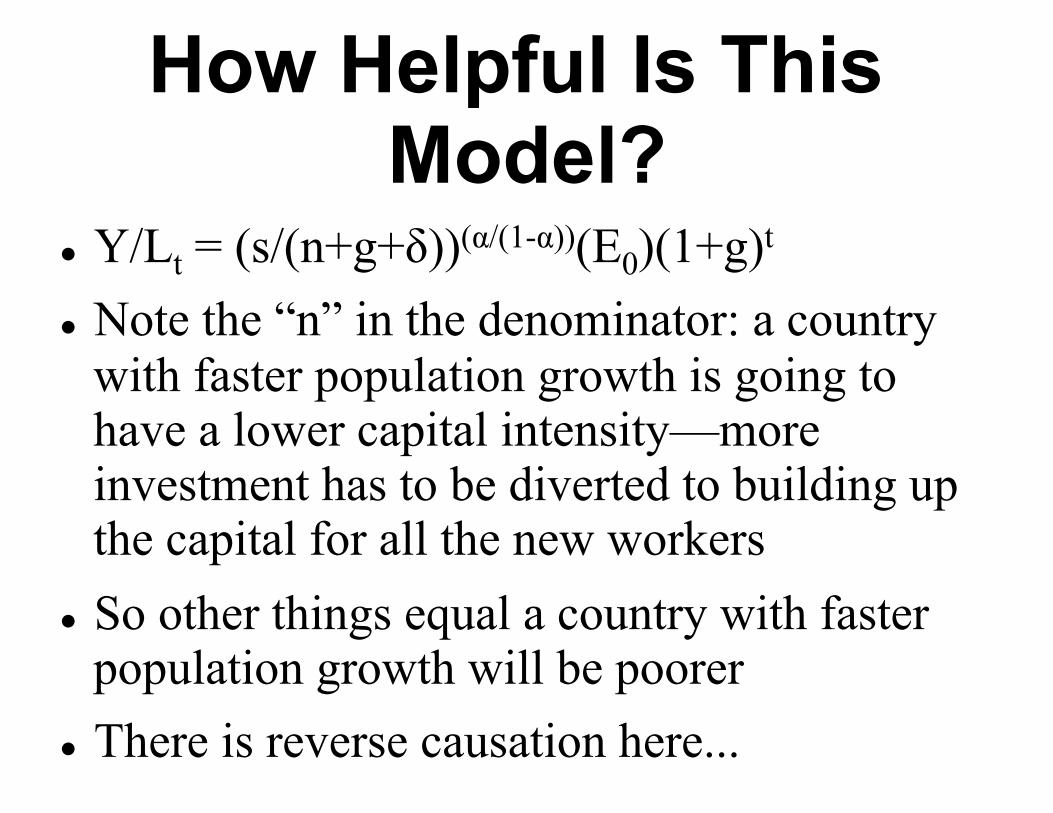
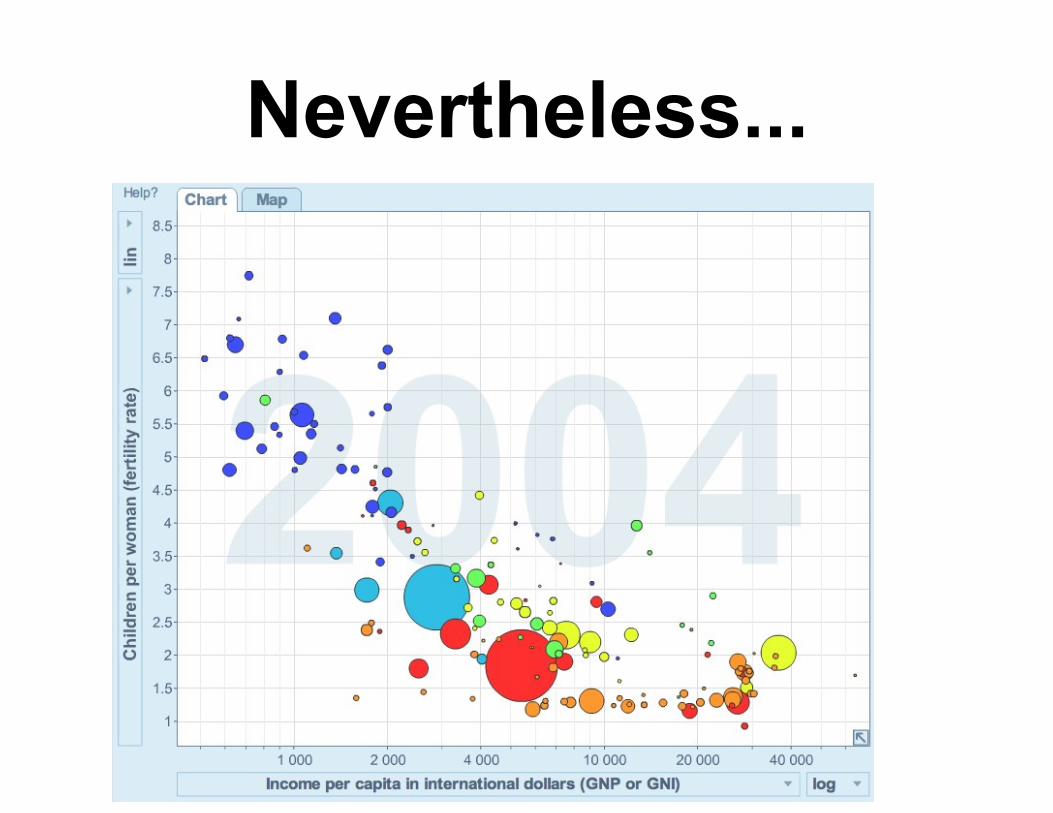
Y/Lt = (s/(n+g+δ))(α/(1-α))(E0)(1+g)t Note the “n” in the denominator: a country
with faster population growth is going to have a lower capital intensity—more investment has to be diverted to building up the capital for all the new workers
So other things equal a country with faster population growth will be poorer
There is reverse causation here...
How Helpful Is This Model?
Nevertheless...
Y/Lt = (s/(n+g+δ))(α/(1-α))(E0)(1+g)t Note the “s” in the numerator: a country
that is saving and investing more will have a higher capital intensity
So other things equal a country with a higher savings-investment share will be richer
There is reverse causation here...
How Helpful Is This Model?
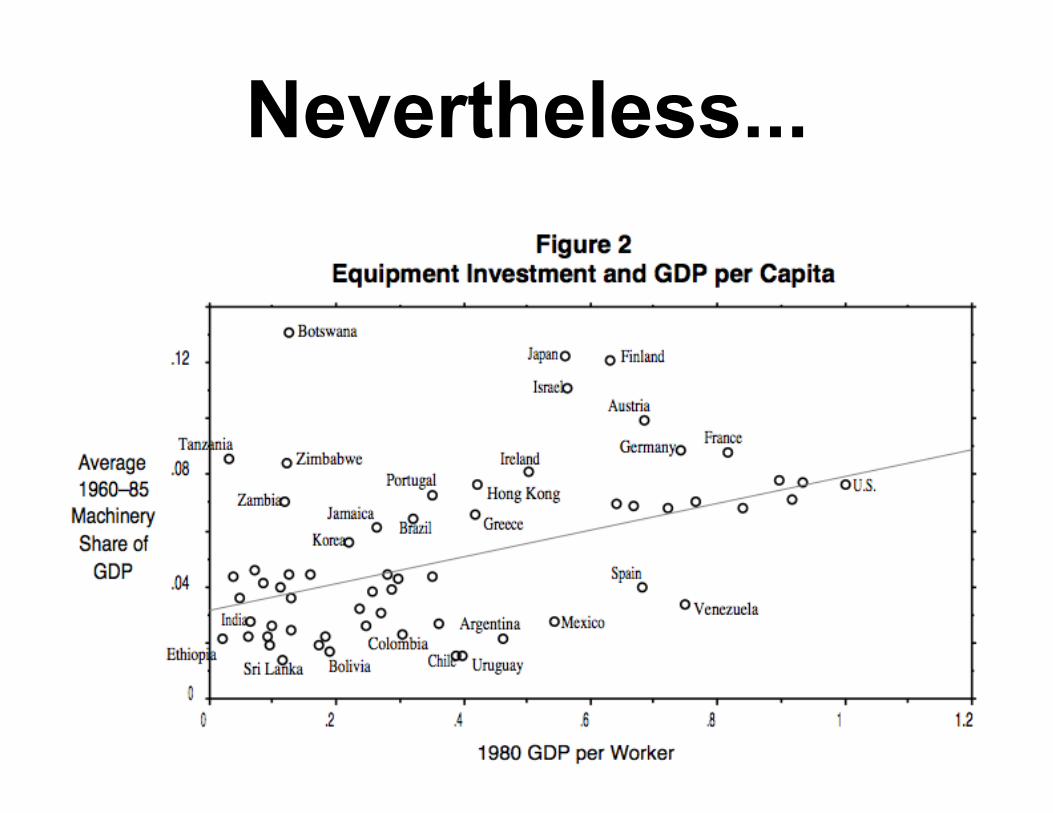
Nevertheless...
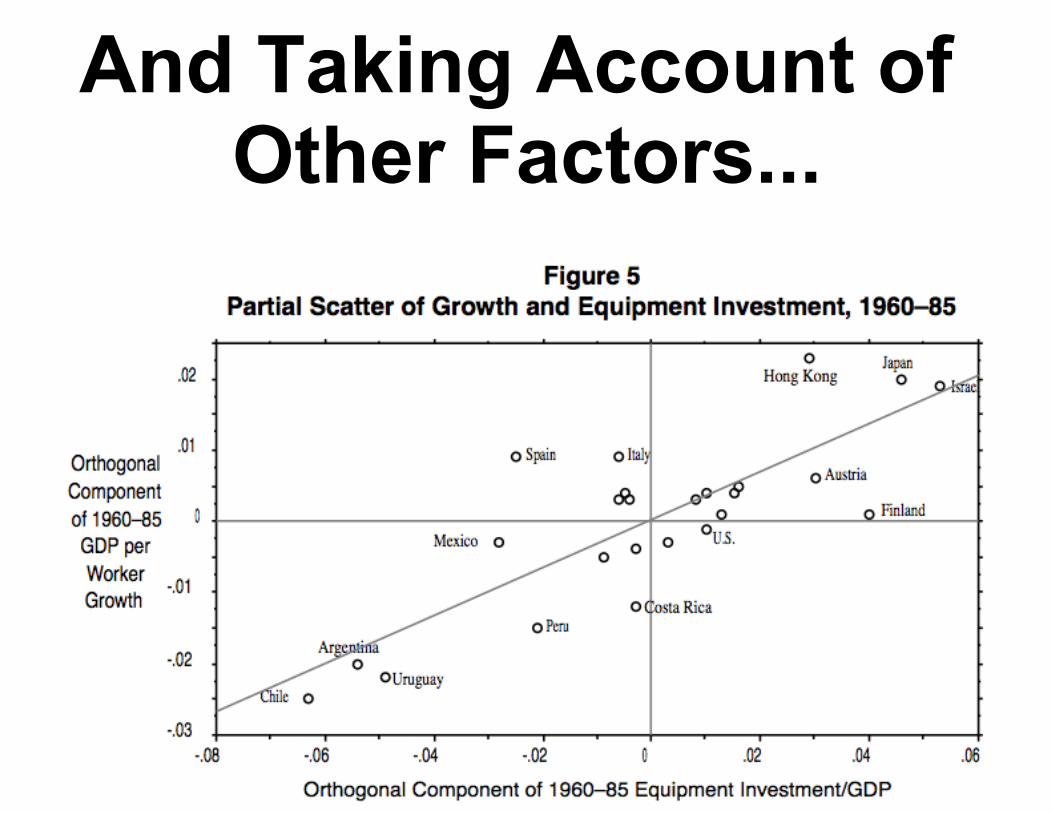
And Taking Account of Other Factors...


