Embed Size (px)
DESCRIPTION
Snapshot of rubbish removed by Clean Up Australia volunteers during 2014
Citation preview
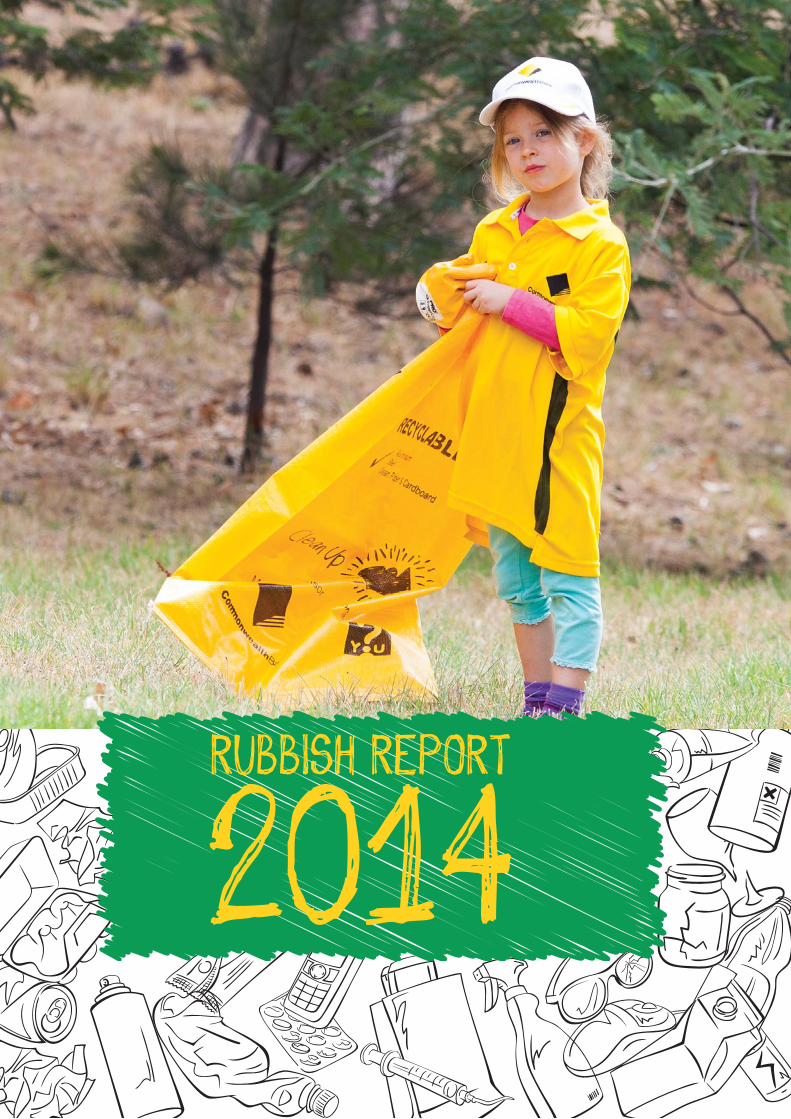
RUBBISH REPORT
2014
THANKS to our Sponsors and Supporters
Table Of ContentsINTRODUCTION . . . . . . . . . . . . . . . . . . . . . . . . . . . . . . . . . . . . . . . . . . . . . . . . . . . . . . . . . . . . . . . . . . . . 03
EXECUTIVE SUMMARY . . . . . . . . . . . . . . . . . . . . . . . . . . . . . . . . . . . . . . . . . . . . . . . . . . . . . . . . . . . . 04· Sites Surveyed· Rubbish Sources
TOP TEN . . . . . . . . . . . . . . . . . . . . . . . . . . . . . . . . . . . . . . . . . . . . . . . . . . . . . . . . . . . . . . . . . . . . . . . . . . . . . 06
SITE TYPES . . . . . . . . . . . . . . . . . . . . . . . . . . . . . . . . . . . . . . . . . . . . . . . . . . . . . . . . . . . . . . . . . . . . . . . . . . 08· Most Surveyed
METHODOLOGY . . . . . . . . . . . . . . . . . . . . . . . . . . . . . . . . . . . . . . . . . . . . . . . . . . . . . . . . . . . . . . . . . . . 09
RETURNED VALID SURVEYS BY STATE . . . . . . . . . . . . . . . . . . . . . . . . . . . . . . . . . . . . . . . . 10
RETURNED VALID SURVEYS BY SITE TYPE . . . . . . . . . . . . . . . . . . . . . . . . . . . . . . . . . . . 10
TOP TEN RUBBISH ITEMS . . . . . . . . . . . . . . . . . . . . . . . . . . . . . . . . . . . . . . . . . . . . . . . . . . . . . . . . 11
MAJOR SOURCES OF RUBBISH . . . . . . . . . . . . . . . . . . . . . . . . . . . . . . . . . . . . . . . . . . . . . . . . . 12
HISTORICAL COMPARISON TRENDS . . . . . . . . . . . . . . . . . . . . . . . . . . . . . . . . . . . . . . . . . . . 13
MAJOR SOURCES OF RUBBISH . . . . . . . . . . . . . . . . . . . . . . . . . . . . . . . . . . . . . . . . . . . . . . . . 14· Plastic· Miscellaneous Items· Metal and Aluminium· Paper and Cardboard · Glass· Expanded Polystyrene· Wood· Rubber
SITE RUBBISH COMPOSITION . . . . . . . . . . . . . . . . . . . . . . . . . . . . . . . . . . . . . . . . . . . . . . . . . . . 22
THE GREAT NORTHERN CLEAN UP 2014 . . . . . . . . . . . . . . . . . . . . . . . . . . . . . . . . . . . . . . 23
03
Introduction
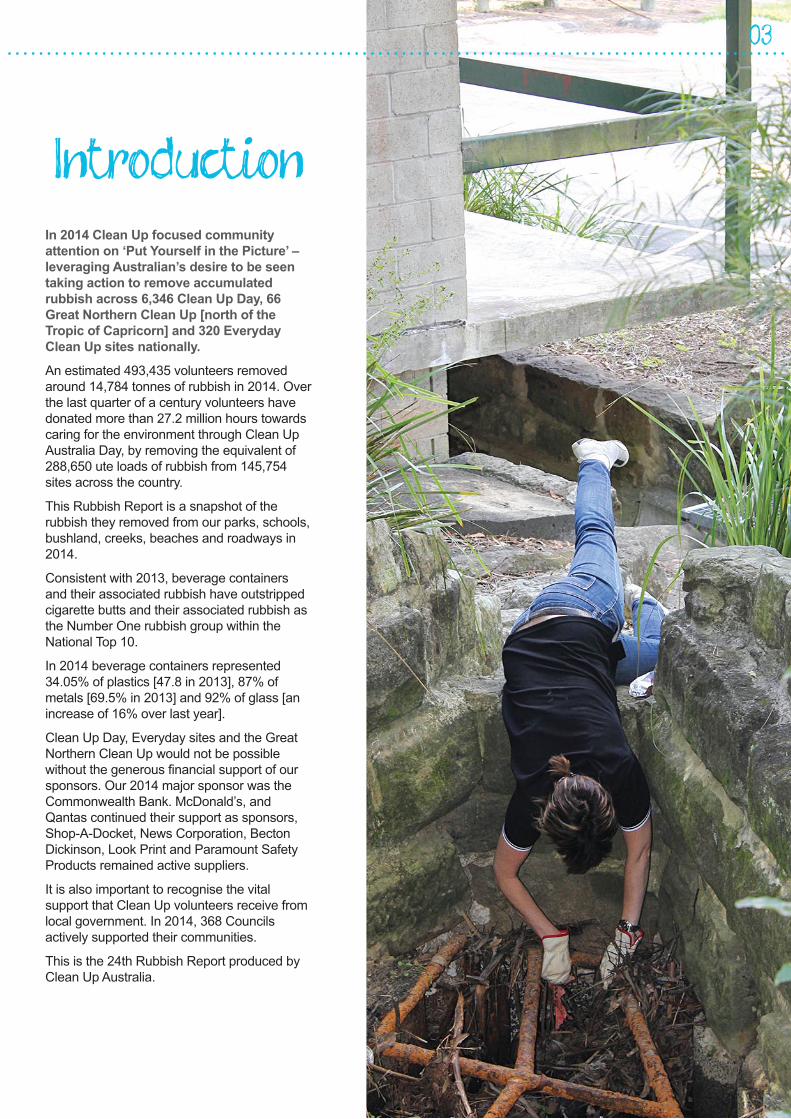
In 2014 Clean Up focused community
attention on ‘Put Yourself in the Picture’ –
leveraging Australian’s desire to be seen
taking action to remove accumulated
rubbish across 6,346 Clean Up Day, 66
Great Northern Clean Up [north of the
Tropic of Capricorn] and 320 Everyday
Clean Up sites nationally.
An estimated 493,435 volunteers removed
around 14,784 tonnes of rubbish in 2014. Over
the last quarter of a century volunteers have
donated more than 27.2 million hours towards
caring for the environment through Clean Up
Australia Day, by removing the equivalent of
288,650 ute loads of rubbish from 145,754
sites across the country.
This Rubbish Report is a snapshot of the
rubbish they removed from our parks, schools,
bushland, creeks, beaches and roadways in
2014.
Consistent with 2013, beverage containers
and their associated rubbish have outstripped
cigarette butts and their associated rubbish as
the Number One rubbish group within the
National Top 10.
In 2014 beverage containers represented
34.05% of plastics [47.8 in 2013], 87% of
metals [69.5% in 2013] and 92% of glass [an
increase of 16% over last year].
Clean Up Day, Everyday sites and the Great
Northern Clean Up would not be possible
without the generous financial support of our
sponsors. Our 2014 major sponsor was the
Commonwealth Bank. McDonald’s, and
Qantas continued their support as sponsors,
Shop-A-Docket, News Corporation, Becton
Dickinson, Look Print and Paramount Safety
Products remained active suppliers.
It is also important to recognise the vital
support that Clean Up volunteers receive from
local government. In 2014, 368 Councils
actively supported their communities.
This is the 24th Rubbish Report produced by
Clean Up Australia.
04 EXECUTIVE SUMMARY
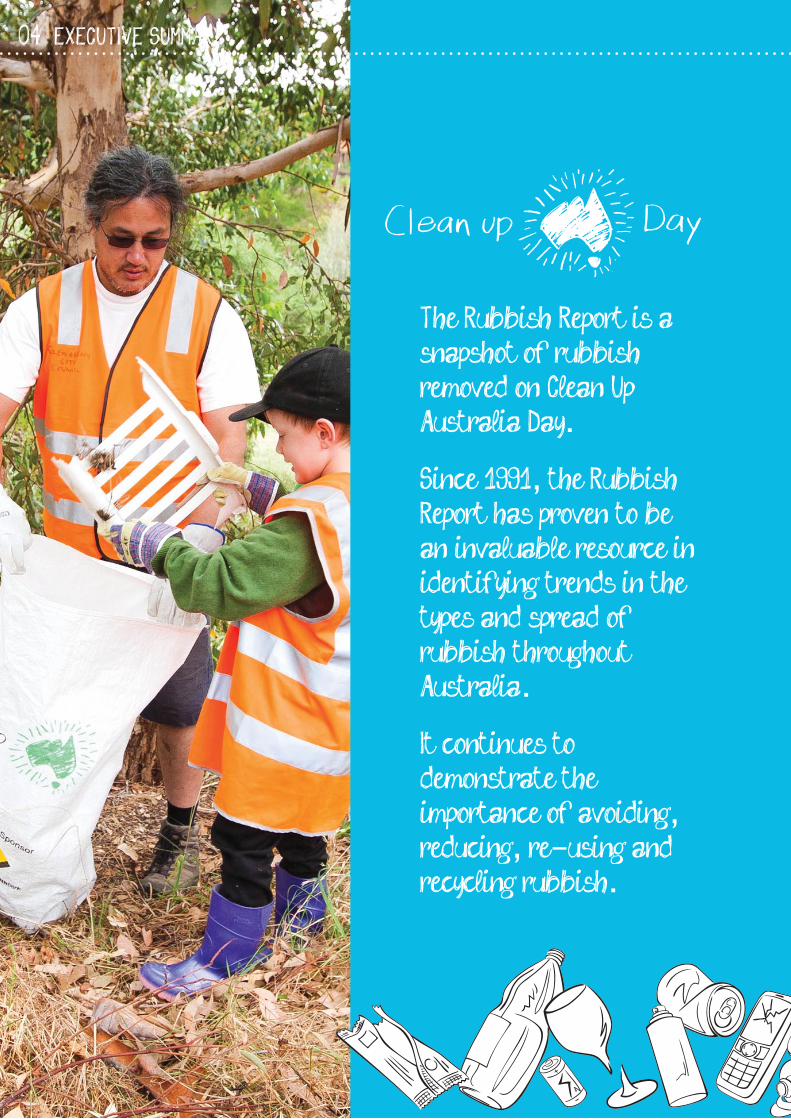
The Rubbish Report is asnapshot of rubbishremoved on Clean UpAustralia Day.Since 1991, the RubbishReport has proven to bean invaluable resource inidentifying trends in thetypes and spread ofrubbish throughoutAustralia.It continues todemonstrate theimportance of avoiding,reducing, re-using andrecycling rubbish.
rubbish items were reported
194,137
PLASTICrepresented 30% of all rubbish
05
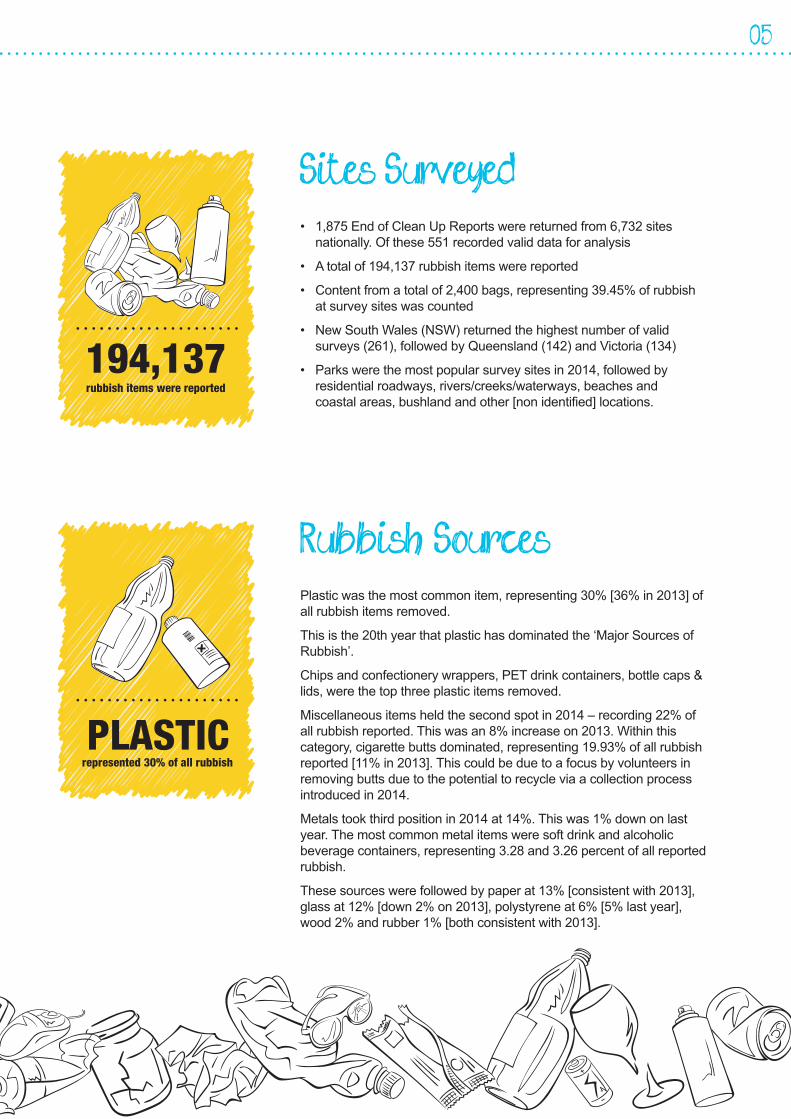
Sites Surveyed• 1,875 End of Clean Up Reports were returned from 6,732 sites
nationally. Of these 551 recorded valid data for analysis
• A total of 194,137 rubbish items were reported
• Content from a total of 2,400 bags, representing 39.45% of rubbish
at survey sites was counted
• New South Wales (NSW) returned the highest number of valid
surveys (261), followed by Queensland (142) and Victoria (134)
• Parks were the most popular survey sites in 2014, followed by
residential roadways, rivers/creeks/waterways, beaches and
coastal areas, bushland and other [non identified] locations.
Rubbish SourcesPlastic was the most common item, representing 30% [36% in 2013] of
all rubbish items removed.
This is the 20th year that plastic has dominated the ‘Major Sources of
Rubbish’.
Chips and confectionery wrappers, PET drink containers, bottle caps &
lids, were the top three plastic items removed.
Miscellaneous items held the second spot in 2014 – recording 22% of
all rubbish reported. This was an 8% increase on 2013. Within this
category, cigarette butts dominated, representing 19.93% of all rubbish
reported [11% in 2013]. This could be due to a focus by volunteers in
removing butts due to the potential to recycle via a collection process
introduced in 2014.
Metals took third position in 2014 at 14%. This was 1% down on last
year. The most common metal items were soft drink and alcoholic
beverage containers, representing 3.28 and 3.26 percent of all reported
rubbish.
These sources were followed by paper at 13% [consistent with 2013],
glass at 12% [down 2% on 2013], polystyrene at 6% [5% last year],
wood 2% and rubber 1% [both consistent with 2013].
06 TOP TEN
BEVERAGECONTAINERS
11%
7%
SMALL PIECESOF PAPER
GARBAGERUBBISH BAGS
22% 8%4%
3%
3%
1%
CIGARETTEBUTTS
FAS
T F
OO
DP
AC
KA
GIN
G
ALL
C
ON
FEC
TIO
NE
RY
WR
AP
PE
RS
POLYSTYRENE PIECES
BEVERAGECONTAINERRUBBISH2
3
1
4
9
8
7
6
5
RUBBISH ITEMS Clean Up Australia Day 2014 Grouped data 2014
as a percentage of allrubbish were:
THE TOP 10
1%P
LAS
TIC
PA
CK
AG
ING
25%
MISCELLANEOUSITEMS
10
0707
2
3
1
4
9
8
7
6
5
10
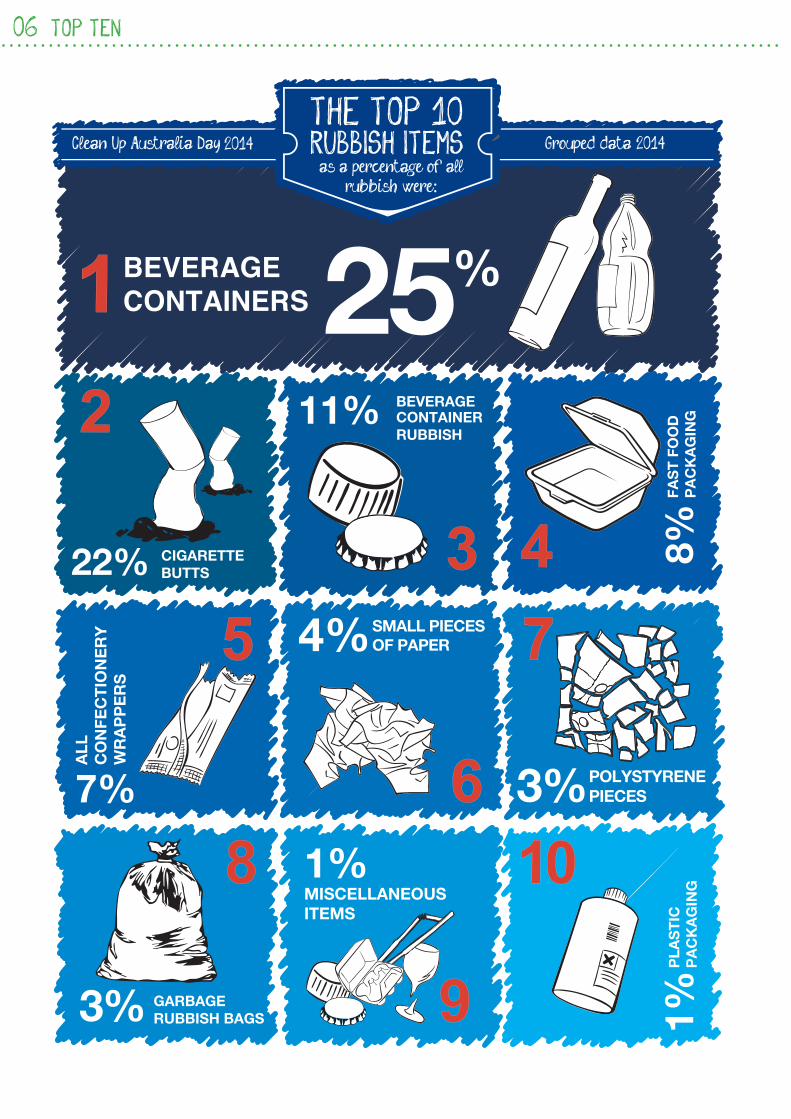
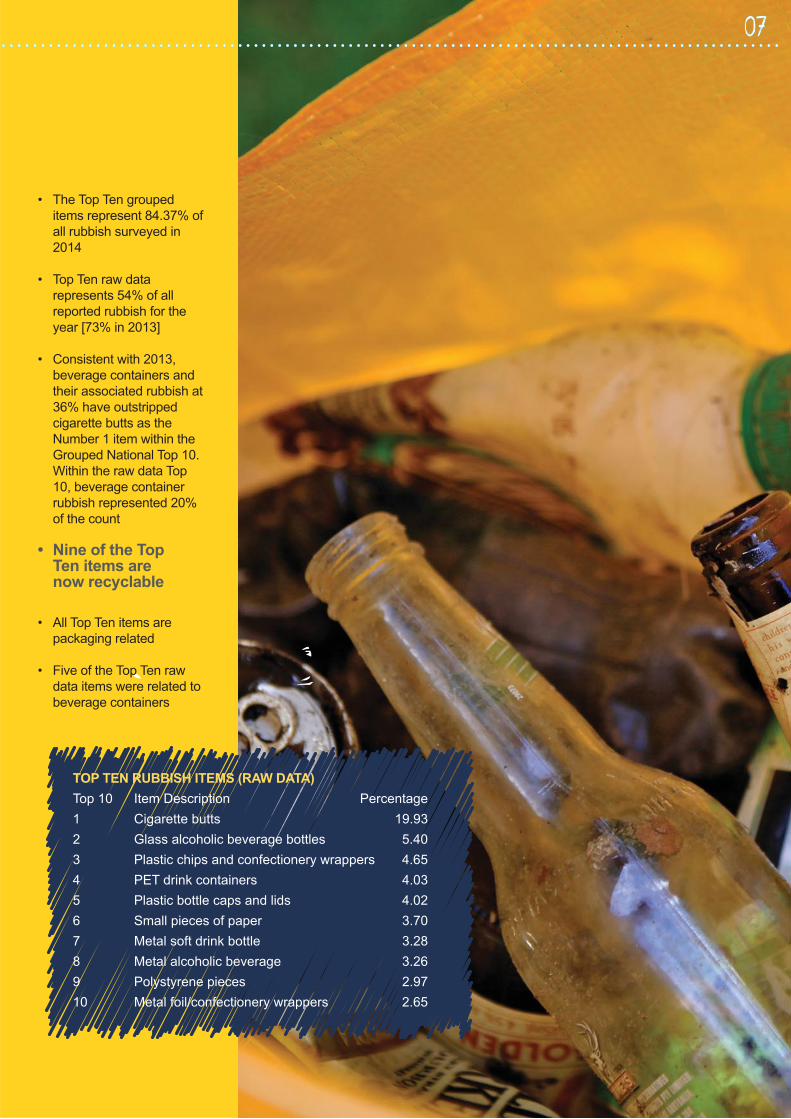
• The Top Ten grouped
items represent 84.37% of
all rubbish surveyed in
2014
• Top Ten raw data
represents 54% of all
reported rubbish for the
year [73% in 2013]
• Consistent with 2013,
beverage containers and
their associated rubbish at
36% have outstripped
cigarette butts as the
Number 1 item within the
Grouped National Top 10.
Within the raw data Top
10, beverage container
rubbish represented 20%
of the count
• Nine of the TopTen items arenow recyclable
• All Top Ten items are
packaging related
• Five of the Top Ten raw
data items were related to
beverage containers
TOP TEN RUBBISH ITEMS (RAW DATA)
Top 10 Item Description Percentage
1 Cigarette butts 19.93
2 Glass alcoholic beverage bottles 5.40
3 Plastic chips and confectionery wrappers 4.65
4 PET drink containers 4.03
5 Plastic bottle caps and lids 4.02
6 Small pieces of paper 3.70
7 Metal soft drink bottle 3.28
8 Metal alcoholic beverage 3.26
9 Polystyrene pieces 2.97
10 Metal foil/confectionery wrappers 2.65
08 SITE TYPES
Site TypesAUSTRALIA
Most Surveyed Site Types
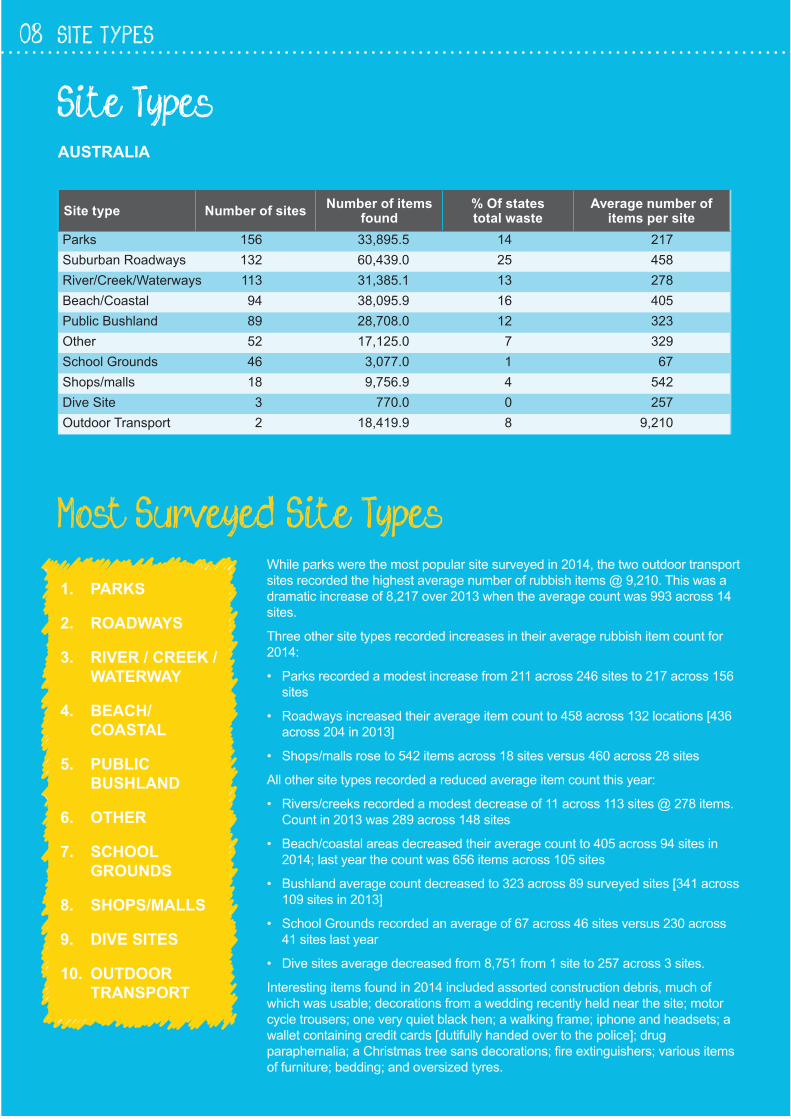
Site type Number of sites Number of items found
% Of states total waste
Average number of items per site
While parks were the most popular site surveyed in 2014, the two outdoor transport
sites recorded the highest average number of rubbish items @ 9,210. This was a
dramatic increase of 8,217 over 2013 when the average count was 993 across 14
sites.
Three other site types recorded increases in their average rubbish item count for
2014:
• Parks recorded a modest increase from 211 across 246 sites to 217 across 156
sites
• Roadways increased their average item count to 458 across 132 locations [436
across 204 in 2013]
• Shops/malls rose to 542 items across 18 sites versus 460 across 28 sites
All other site types recorded a reduced average item count this year:
• Rivers/creeks recorded a modest decrease of 11 across 113 sites @ 278 items.
Count in 2013 was 289 across 148 sites
• Beach/coastal areas decreased their average count to 405 across 94 sites in
2014; last year the count was 656 items across 105 sites
• Bushland average count decreased to 323 across 89 surveyed sites [341 across
109 sites in 2013]
• School Grounds recorded an average of 67 across 46 sites versus 230 across
41 sites last year
• Dive sites average decreased from 8,751 from 1 site to 257 across 3 sites.
Interesting items found in 2014 included assorted construction debris, much of
which was usable; decorations from a wedding recently held near the site; motor
cycle trousers; one very quiet black hen; a walking frame; iphone and headsets; a
wallet containing credit cards [dutifully handed over to the police]; drug
paraphernalia; a Christmas tree sans decorations; fire extinguishers; various items
of furniture; bedding; and oversized tyres.
Parks 156 33,895.5 14 217
Suburban Roadways 132 60,439.0 25 458
River/Creek/Waterways 113 31,385.1 13 278
Beach/Coastal 94 38,095.9 16 405
Public Bushland 89 28,708.0 12 323
Other 52 17,125.0 7 329
School Grounds 46 3,077.0 1 67
Shops/malls 18 9,756.9 4 542
Dive Site 3 770.0 0 257
Outdoor Transport 2 18,419.9 8 9,210
1. PARKS
2. ROADWAYS
3. RIVER / CREEK /
WATERWAY
4. BEACH/
COASTAL
5. PUBLIC
BUSHLAND
6. OTHER
7. SCHOOL
GROUNDS
8. SHOPS/MALLS
9. DIVE SITES
10. OUTDOOR
TRANSPORT
0909
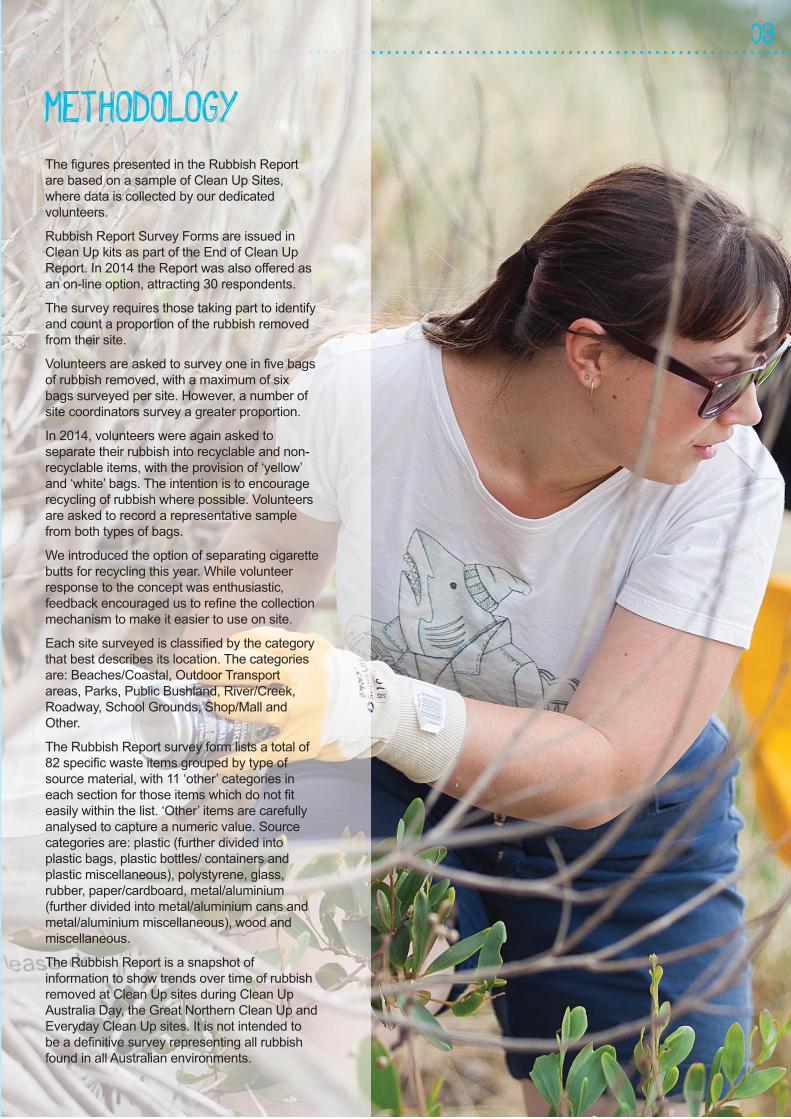
METHODOLOGY The figures presented in the Rubbish Report
are based on a sample of Clean Up Sites,
where data is collected by our dedicated
volunteers.
Rubbish Report Survey Forms are issued in
Clean Up kits as part of the End of Clean Up
Report. In 2014 the Report was also offered as
an on-line option, attracting 30 respondents.
The survey requires those taking part to identify
and count a proportion of the rubbish removed
from their site.
Volunteers are asked to survey one in five bags
of rubbish removed, with a maximum of six
bags surveyed per site. However, a number of
site coordinators survey a greater proportion.
In 2014, volunteers were again asked to
separate their rubbish into recyclable and non-
recyclable items, with the provision of ‘yellow’
and ‘white’ bags. The intention is to encourage
recycling of rubbish where possible. Volunteers
are asked to record a representative sample
from both types of bags.
We introduced the option of separating cigarette
butts for recycling this year. While volunteer
response to the concept was enthusiastic,
feedback encouraged us to refine the collection
mechanism to make it easier to use on site.
Each site surveyed is classified by the category
that best describes its location. The categories
are: Beaches/Coastal, Outdoor Transport
areas, Parks, Public Bushland, River/Creek,
Roadway, School Grounds, Shop/Mall and
Other.
The Rubbish Report survey form lists a total of
82 specific waste items grouped by type of
source material, with 11 ‘other’ categories in
each section for those items which do not fit
easily within the list. ‘Other’ items are carefully
analysed to capture a numeric value. Source
categories are: plastic (further divided into
plastic bags, plastic bottles/ containers and
plastic miscellaneous), polystyrene, glass,
rubber, paper/cardboard, metal/aluminium
(further divided into metal/aluminium cans and
metal/aluminium miscellaneous), wood and
miscellaneous.
The Rubbish Report is a snapshot of
information to show trends over time of rubbish
removed at Clean Up sites during Clean Up
Australia Day, the Great Northern Clean Up and
Everyday Clean Up sites. It is not intended to
be a definitive survey representing all rubbish
found in all Australian environments.
10 RETURNED VALID SURVEYS
NSW
QLD
VIC
SA
WA
TAS
ACT
NT
Waterways/Water storage
Parks
Beach/Coastal
Roadway
Bushland
School Grounds
Outdoor Transport
Shops/malls
Dive Site
Other
River/Creek/
0 50 100 150 200 250 300
0 50 100 150 200
113
156
94
132
89
46
2
18
3
52
261
142
134
68
55
29
14
2
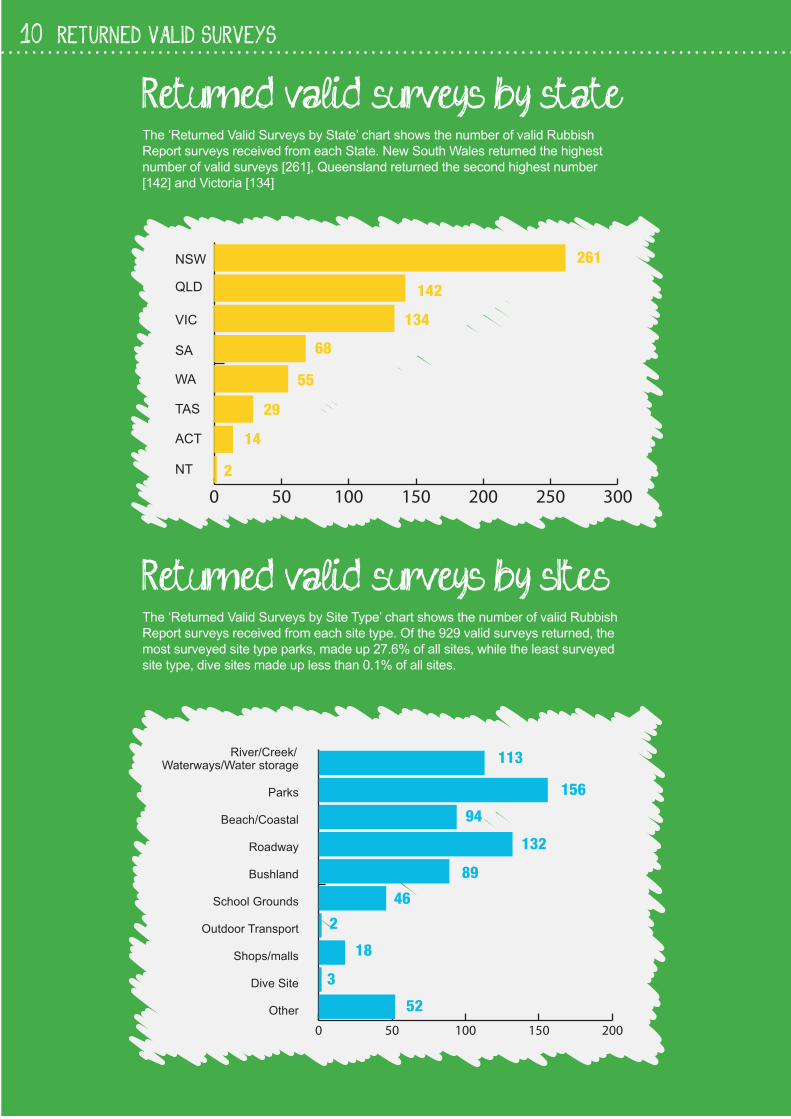
Returned valid surveys by stateThe ‘Returned Valid Surveys by State’ chart shows the number of valid Rubbish
Report surveys received from each State. New South Wales returned the highest
number of valid surveys [261], Queensland returned the second highest number
[142] and Victoria [134]
Returned valid surveys by sItesThe ‘Returned Valid Surveys by Site Type’ chart shows the number of valid Rubbish
Report surveys received from each site type. Of the 929 valid surveys returned, the
most surveyed site type parks, made up 27.6% of all sites, while the least surveyed
site type, dive sites made up less than 0.1% of all sites.
Beverage containers
Cigarette butts
Beverage containerrubbish
Fast food packaging
All confectionary wrappers
Small piecesof paper
Polystyrene pieces
Garbage rubbishbagsOther miscellaneousitems
Plastic packaging
1st
2nd
3rd
4th
5th
6th
8th
9th
10th
7th
1111
The TOP TEN Rubbish Items
25%
22%11%
8%
7%
4%3%
3%1%1%
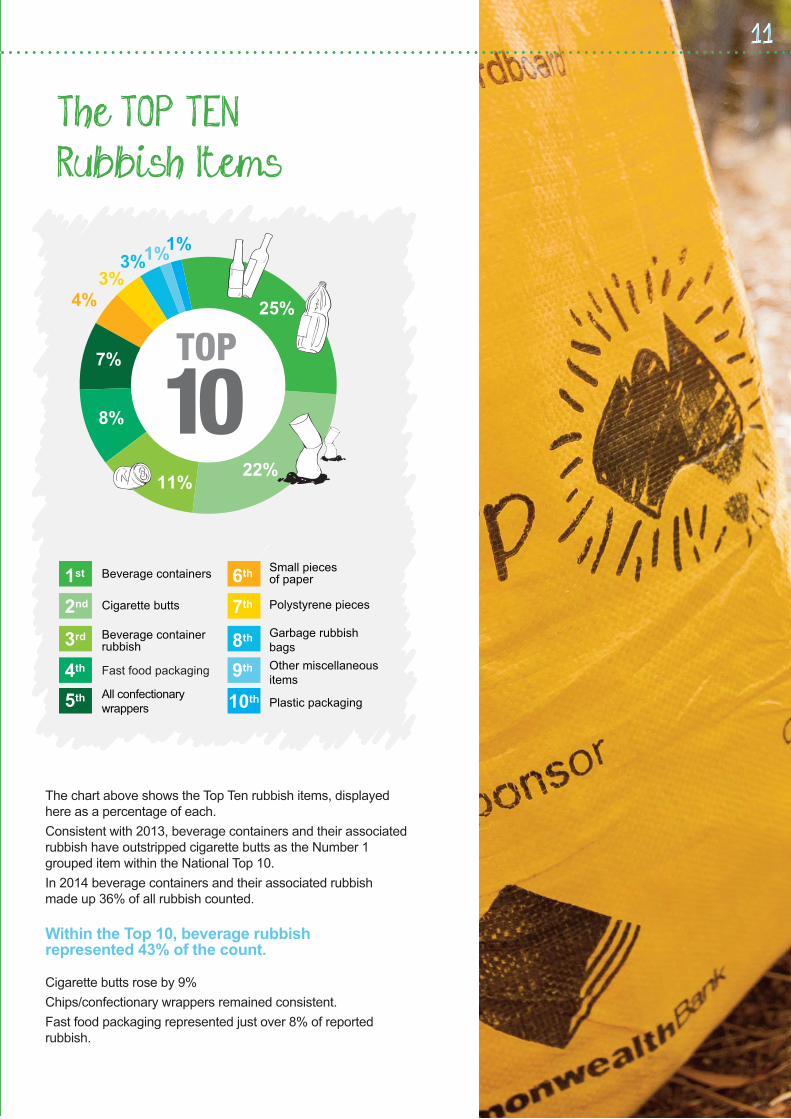
The chart above shows the Top Ten rubbish items, displayed
here as a percentage of each.
Consistent with 2013, beverage containers and their associated
rubbish have outstripped cigarette butts as the Number 1
grouped item within the National Top 10.
In 2014 beverage containers and their associated rubbish
made up 36% of all rubbish counted.
Within the Top 10, beverage rubbishrepresented 43% of the count.
Cigarette butts rose by 9%
Chips/confectionary wrappers remained consistent.
Fast food packaging represented just over 8% of reported
rubbish.
12 MAJOR SOURCES OF RUBBISH
Major Sources Of Rubbish
Summary
Plastics30%
22%
2%
14%
13%
1%
12%6%
Miscellaneous
Wood
Metal
Paper
Rubber
Glass
Polystyrene
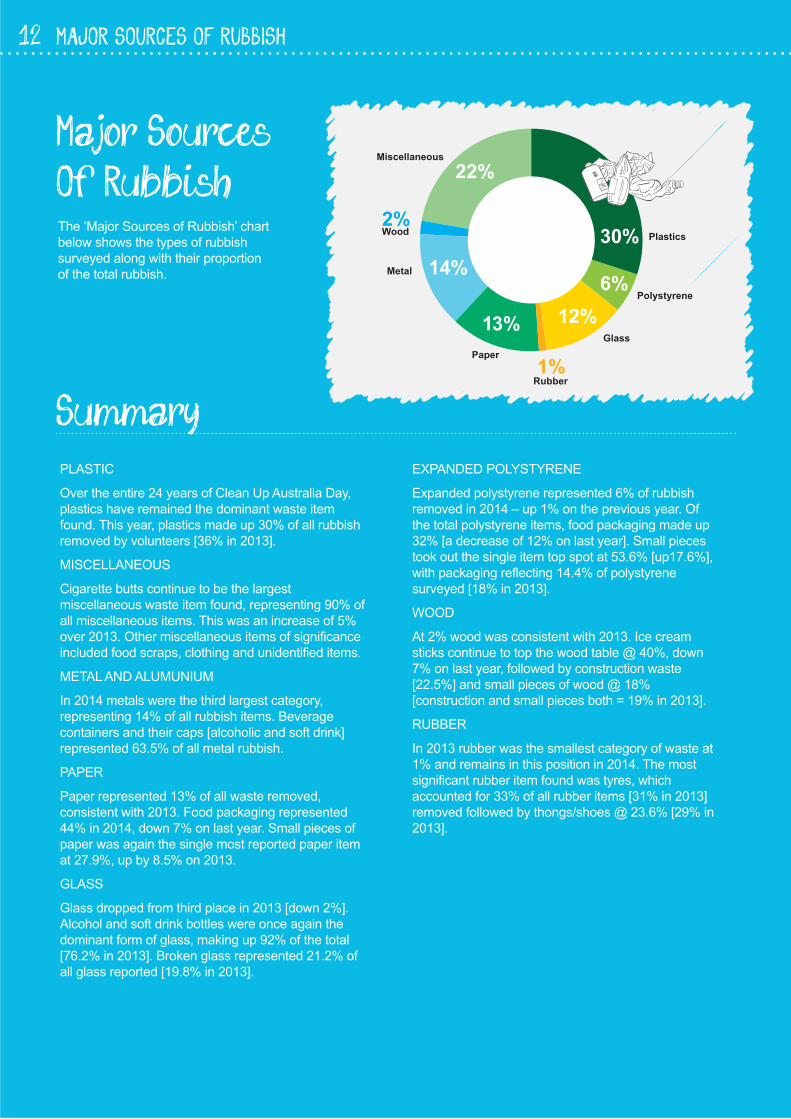
PLASTIC
Over the entire 24 years of Clean Up Australia Day,
plastics have remained the dominant waste item
found. This year, plastics made up 30% of all rubbish
removed by volunteers [36% in 2013].
MISCELLANEOUS
Cigarette butts continue to be the largest
miscellaneous waste item found, representing 90% of
all miscellaneous items. This was an increase of 5%
over 2013. Other miscellaneous items of significance
included food scraps, clothing and unidentified items.
METAL AND ALUMUNIUM
In 2014 metals were the third largest category,
representing 14% of all rubbish items. Beverage
containers and their caps [alcoholic and soft drink]
represented 63.5% of all metal rubbish.
PAPER
Paper represented 13% of all waste removed,
consistent with 2013. Food packaging represented
44% in 2014, down 7% on last year. Small pieces of
paper was again the single most reported paper item
at 27.9%, up by 8.5% on 2013.
GLASS
Glass dropped from third place in 2013 [down 2%].
Alcohol and soft drink bottles were once again the
dominant form of glass, making up 92% of the total
[76.2% in 2013]. Broken glass represented 21.2% of
all glass reported [19.8% in 2013].
EXPANDED POLYSTYRENE
Expanded polystyrene represented 6% of rubbish
removed in 2014 – up 1% on the previous year. Of
the total polystyrene items, food packaging made up
32% [a decrease of 12% on last year]. Small pieces
took out the single item top spot at 53.6% [up17.6%],
with packaging reflecting 14.4% of polystyrene
surveyed [18% in 2013].
WOOD
At 2% wood was consistent with 2013. Ice cream
sticks continue to top the wood table @ 40%, down
7% on last year, followed by construction waste
[22.5%] and small pieces of wood @ 18%
[construction and small pieces both = 19% in 2013].
RUBBER
In 2013 rubber was the smallest category of waste at
1% and remains in this position in 2014. The most
significant rubber item found was tyres, which
accounted for 33% of all rubber items [31% in 2013]
removed followed by thongs/shoes @ 23.6% [29% in
2013].
The ‘Major Sources of Rubbish’ chart
below shows the types of rubbish
surveyed along with their proportion
of the total rubbish.
13
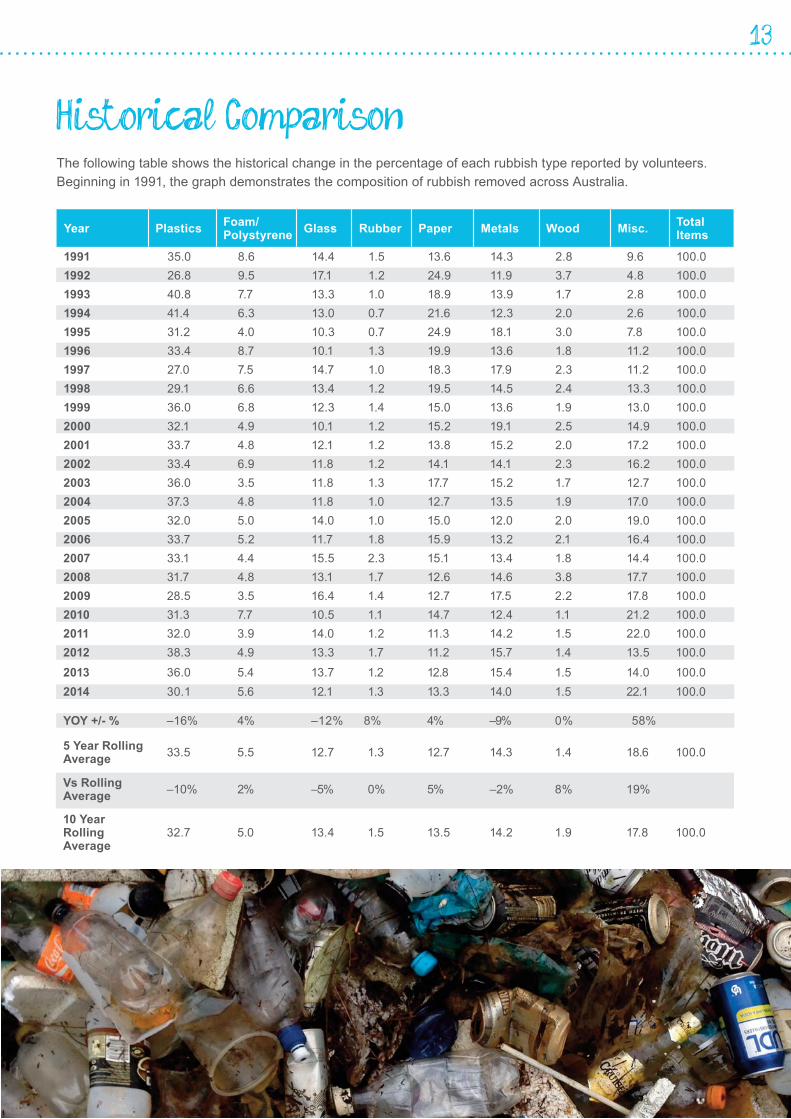
Historical Comparison The following table shows the historical change in the percentage of each rubbish type reported by volunteers. Beginning in 1991, the graph demonstrates the composition of rubbish removed across Australia.
Year Plastics Foam/ Polystyrene Glass Rubber Paper Metals Wood Misc. Total
Items
1991 35.0 8.6 14.4 1.5 13.6 14.3 2.8 9.6 100.01992 26.8 9.5 17.1 1.2 24.9 11.9 3.7 4.8 100.01993 40.8 7.7 13.3 1.0 18.9 13.9 1.7 2.8 100.01994 41.4 6.3 13.0 0.7 21.6 12.3 2.0 2.6 100.01995 31.2 4.0 10.3 0.7 24.9 18.1 3.0 7.8 100.01996 33.4 8.7 10.1 1.3 19.9 13.6 1.8 11.2 100.01997 27.0 7.5 14.7 1.0 18.3 17.9 2.3 11.2 100.01998 29.1 6.6 13.4 1.2 19.5 14.5 2.4 13.3 100.01999 36.0 6.8 12.3 1.4 15.0 13.6 1.9 13.0 100.02000 32.1 4.9 10.1 1.2 15.2 19.1 2.5 14.9 100.02001 33.7 4.8 12.1 1.2 13.8 15.2 2.0 17.2 100.02002 33.4 6.9 11.8 1.2 14.1 14.1 2.3 16.2 100.02003 36.0 3.5 11.8 1.3 17.7 15.2 1.7 12.7 100.02004 37.3 4.8 11.8 1.0 12.7 13.5 1.9 17.0 100.02005 32.0 5.0 14.0 1.0 15.0 12.0 2.0 19.0 100.02006 33.7 5.2 11.7 1.8 15.9 13.2 2.1 16.4 100.02007 33.1 4.4 15.5 2.3 15.1 13.4 1.8 14.4 100.02008 31.7 4.8 13.1 1.7 12.6 14.6 3.8 17.7 100.02009 28.5 3.5 16.4 1.4 12.7 17.5 2.2 17.8 100.02010 31.3 7.7 10.5 1.1 14.7 12.4 1.1 21.2 100.02011 32.0 3.9 14.0 1.2 11.3 14.2 1.5 22.0 100.02012 38.3 4.9 13.3 1.7 11.2 15.7 1.4 13.5 100.0
2014 30.1 5.6 12.1 1.3 13.3 14.0 1.5 22.1 100.02013 36.0 5.4 13.7 1.2 12.8 15.4 1.5 14.0 100.0
YOY +/- % –16% 4% –12% 8% 4% –9% 0% 58%
5 Year Rolling Average 33.5 5.5 12.7 1.3 12.7 14.3 1.4 18.6 100.0
Vs Rolling Average –10% 2% –5% 0% 5% –2% 8% 19%
10 Year Rolling Average
32.7 5.0 13.4 1.5 13.5 14.2 1.9 17.8 100.0
Trends
14 MAJOR SOURCES OF RUBBISH
SERIES 1
0 3000 6000 9000 12000 15000
Beverage Rubbish
Beverage Containers
Plastic Bags
Chips & Confectionery
Food Packaging
Packaging
Other Items
Toys & Sporting
Other Bottles
Cigarette Lighters
Sanitary Items
13079
11614
14727
7828
5498
4062
5474
807
944
566
304
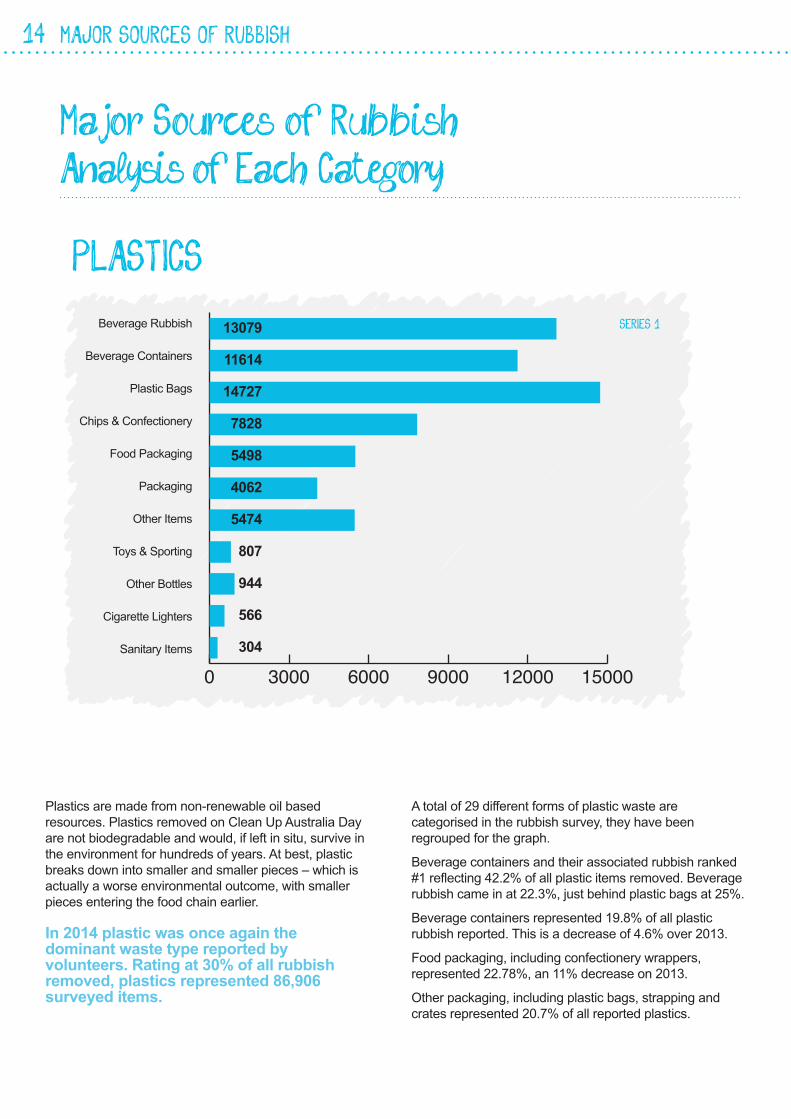
Major Sources of RubbishAnalysis of Each Category
Plastics are made from non-renewable oil based
resources. Plastics removed on Clean Up Australia Day
are not biodegradable and would, if left in situ, survive in
the environment for hundreds of years. At best, plastic
breaks down into smaller and smaller pieces – which is
actually a worse environmental outcome, with smaller
pieces entering the food chain earlier.
In 2014 plastic was once again thedominant waste type reported byvolunteers. Rating at 30% of all rubbishremoved, plastics represented 86,906surveyed items.
A total of 29 different forms of plastic waste are
categorised in the rubbish survey, they have been
regrouped for the graph.
Beverage containers and their associated rubbish ranked
#1 reflecting 42.2% of all plastic items removed. Beverage
rubbish came in at 22.3%, just behind plastic bags at 25%.
Beverage containers represented 19.8% of all plastic
rubbish reported. This is a decrease of 4.6% over 2013.
Food packaging, including confectionery wrappers,
represented 22.78%, an 11% decrease on 2013.
Other packaging, including plastic bags, strapping and
crates represented 20.7% of all reported plastics.
PLASTICS
15
SERIES 1Food Scraps
Clothing
Other Items
Car/machinery Parts
Ceramics
Syringes
Batteries
Furniture
Shopping Trolleys
E-waste
Carpet
0 200 400 600 800 1000 1200
1118
862
558
356
259
249
248
211
186
112
110
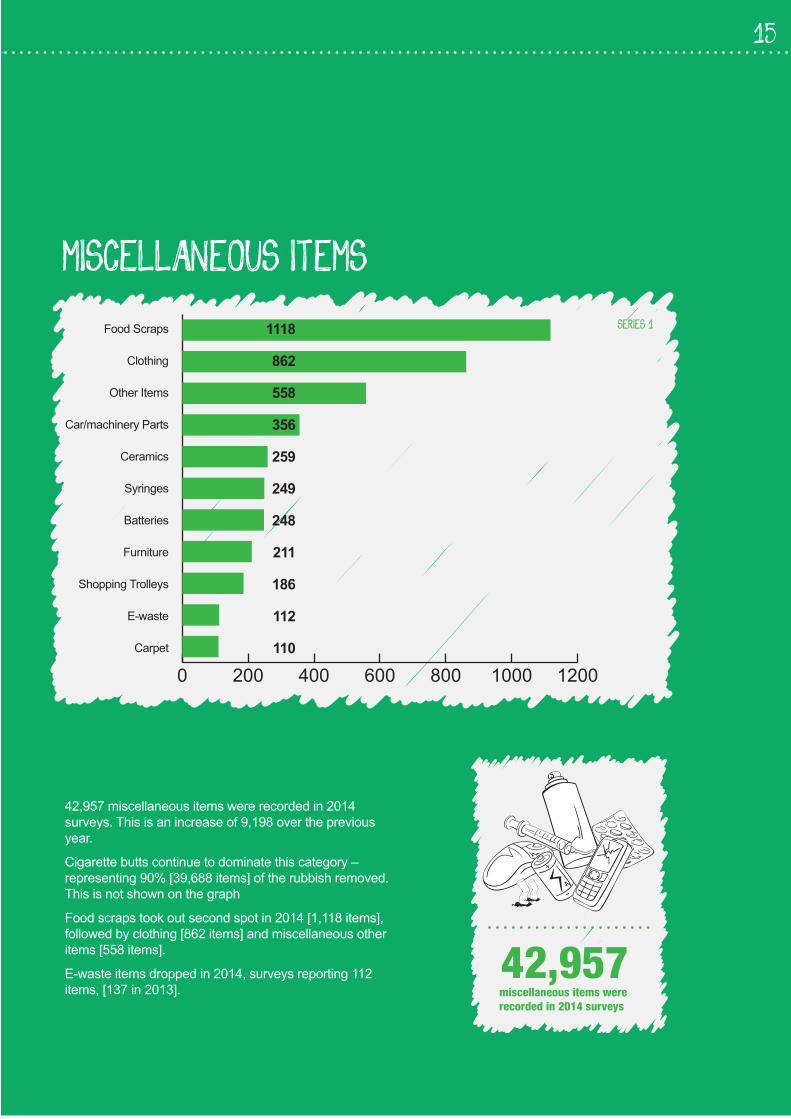
42,957 miscellaneous items wererecorded in 2014 surveys
42,957 miscellaneous items were recorded in 2014
surveys. This is an increase of 9,198 over the previous
year.
Cigarette butts continue to dominate this category –
representing 90% [39,688 items] of the rubbish removed.
This is not shown on the graph
Food scraps took out second spot in 2014 [1,118 items],
followed by clothing [862 items] and miscellaneous other
items [558 items].
E-waste items dropped in 2014, surveys reporting 112
items, [137 in 2013].
MISCELLANEOUS ITEMS
16 MAJOR SOURCES OF RUBBISH
METAL AND ALUMINIUM
Soft Drink Bottle
Alcoholic Beverage
Foil/confectionery Wrappers
Bottle Caps
Pipe
Other
Large Pieces
Construction Materials
Aerosol Cans
Small Pieces
Food Containers
Wire
Appliances
Paint Tins
44 Gallon Drums
0 1000 2000 3000 4000 5000 6000 7000 8000
6376633451374578121677550347042241236934011211244
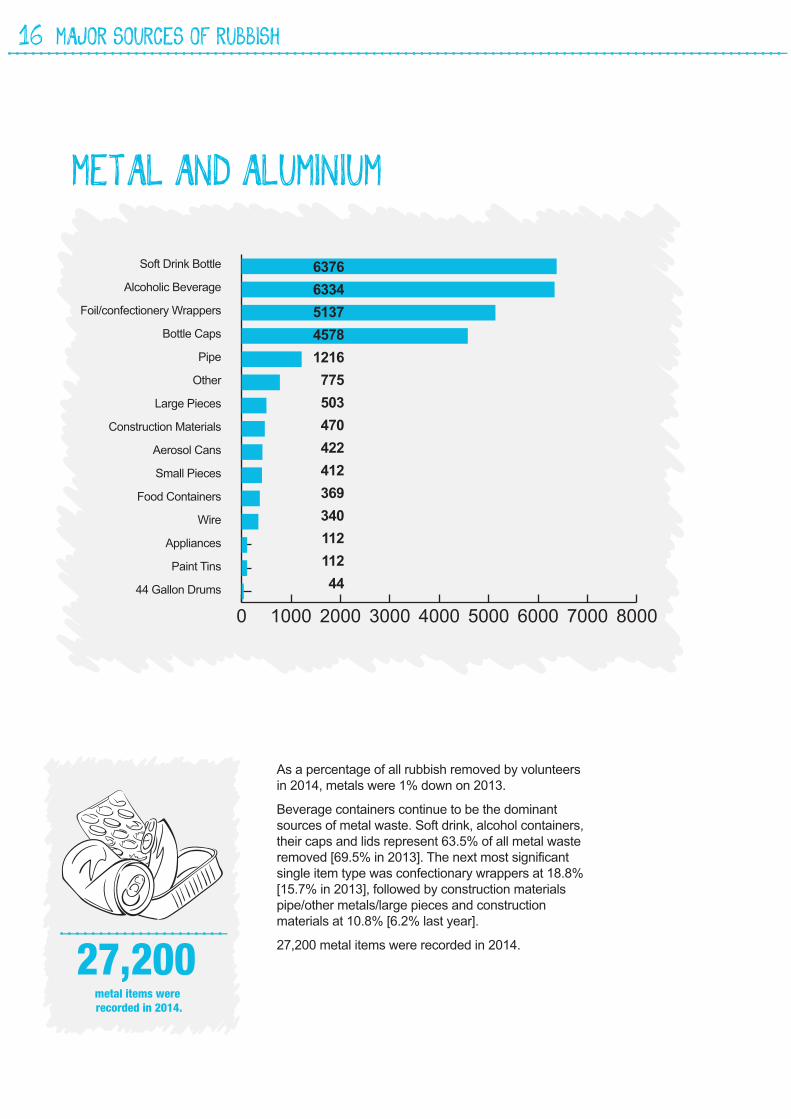
metal items were recorded in 2014.
27,200
As a percentage of all rubbish removed by volunteers
in 2014, metals were 1% down on 2013.
Beverage containers continue to be the dominant
sources of metal waste. Soft drink, alcohol containers,
their caps and lids represent 63.5% of all metal waste
removed [69.5% in 2013]. The next most significant
single item type was confectionary wrappers at 18.8%
[15.7% in 2013], followed by construction materials
pipe/other metals/large pieces and construction
materials at 10.8% [6.2% last year].
27,200 metal items were recorded in 2014.
17
PAPER AND CARDBOARD
paper and cardboard items were counted in 2014
27,753
Small Paper Pieces
Fast Food Packaging
Cigarette Packets
Napkins And Tissues
Cups
Bags
Newspapers/books/magazines
Drink Cartoons
Boxes
Other
Large
Milk Cartons
Wine Casks
Egg Cartons
0 1000 2000 3000 4000 5000 6000 7000 8000
71923231274721881810176817511562116210915615508456
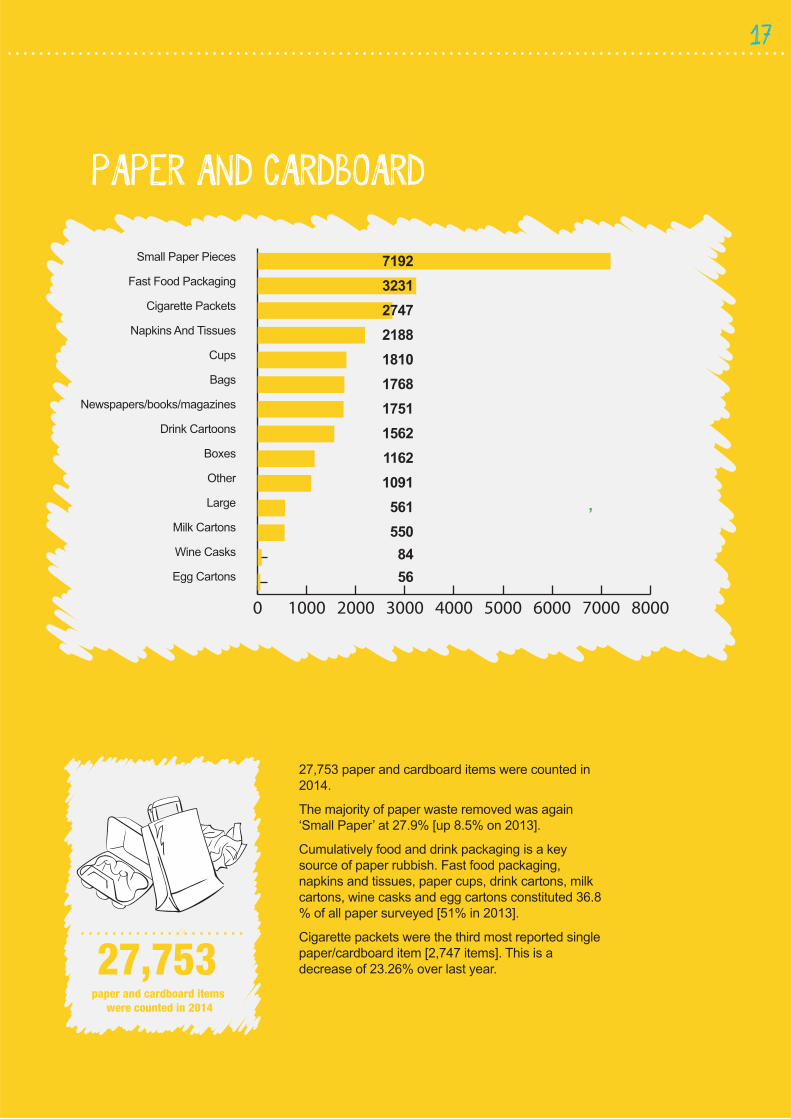
27,753 paper and cardboard items were counted in
2014.
The majority of paper waste removed was again
‘Small Paper’ at 27.9% [up 8.5% on 2013].
Cumulatively food and drink packaging is a key
source of paper rubbish. Fast food packaging,
napkins and tissues, paper cups, drink cartons, milk
cartons, wine casks and egg cartons constituted 36.8
% of all paper surveyed [51% in 2013].
Cigarette packets were the third most reported single
paper/cardboard item [2,747 items]. This is a
decrease of 23.26% over last year.
1918 MAJOR SOURCES OF RUBBISH
GLASS
SERIES 1
Volunteers counted
glass items in 2014.
23,511
Alcoholic Beverage Bottles
Soft Drink Bottles
Pieces
Other
Fruit Juice Bottles
Food Jars
Light Globes
0 2000 4000 6000 8000 10000 12000
10474
5114
5009
1120
1081
659
54
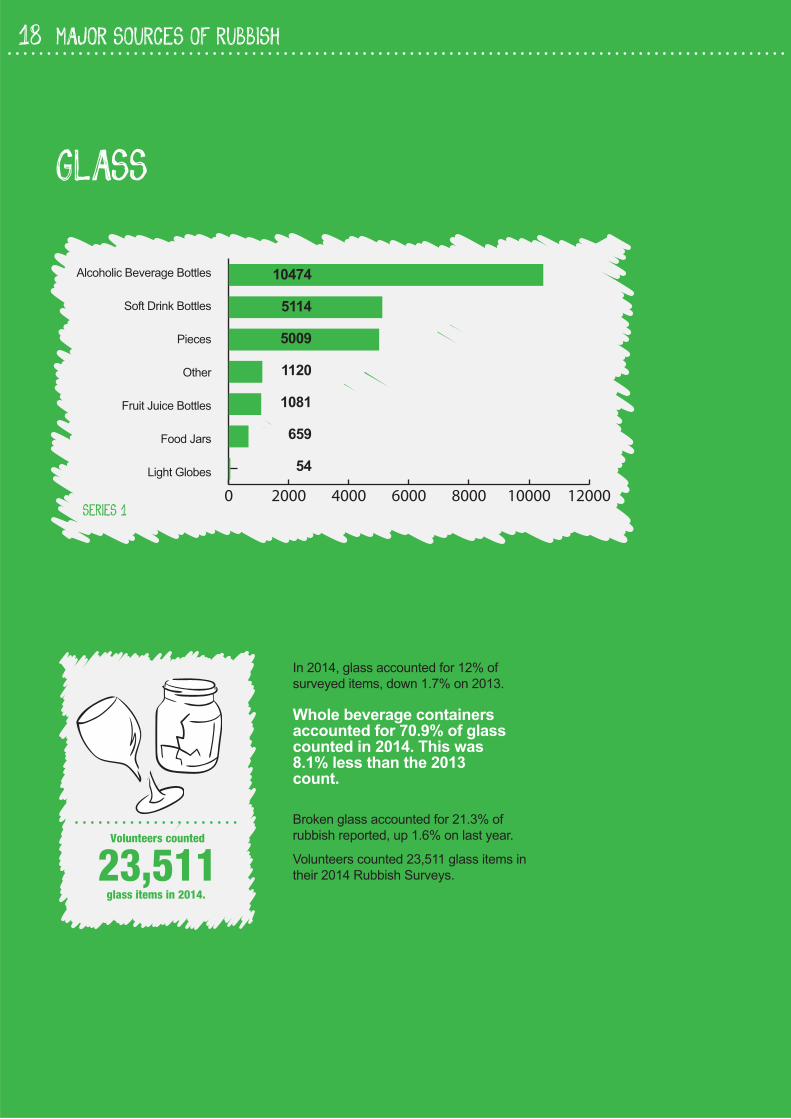
In 2014, glass accounted for 12% of
surveyed items, down 1.7% on 2013.
Whole beverage containersaccounted for 70.9% of glasscounted in 2014. This was8.1% less than the 2013count.
Broken glass accounted for 21.3% of
rubbish reported, up 1.6% on last year.
Volunteers counted 23,511 glass items in
their 2014 Rubbish Surveys.
19
EXPANDED POLYSTYRENE
SERIES 1
Polystyrene fast food containers and cups/plates accounted for
of reported rubbish32%
Pieces
Fast Food Containers
Plates And Cups
Packaging
Other
0 1000 2000 3000 4000 5000 6000
5775
1975
1472
1340
208
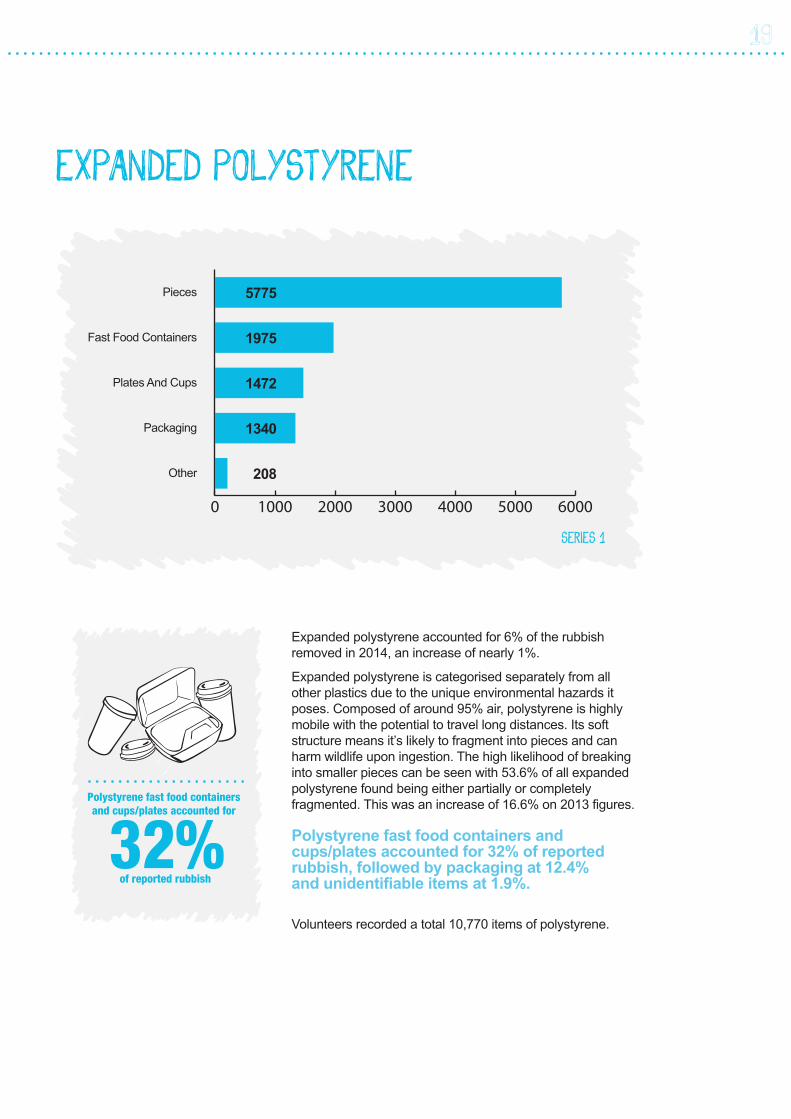
Expanded polystyrene accounted for 6% of the rubbish
removed in 2014, an increase of nearly 1%.
Expanded polystyrene is categorised separately from all
other plastics due to the unique environmental hazards it
poses. Composed of around 95% air, polystyrene is highly
mobile with the potential to travel long distances. Its soft
structure means it’s likely to fragment into pieces and can
harm wildlife upon ingestion. The high likelihood of breaking
into smaller pieces can be seen with 53.6% of all expanded
polystyrene found being either partially or completely
fragmented. This was an increase of 16.6% on 2013 figures.
Polystyrene fast food containers andcups/plates accounted for 32% of reportedrubbish, followed by packaging at 12.4%and unidentifiable items at 1.9%.
Volunteers recorded a total 10,770 items of polystyrene.
SERIES 1
20 MAJOR SOURCES OF RUBBISH
WOOD
of all wood items found were ice cream sticks
40.4%
0 200 400 600 800 1000 1200
Ice Cream Sticks
Construction Materials
Pieces
Other
Bottle Corks
1162
646
520
384
158
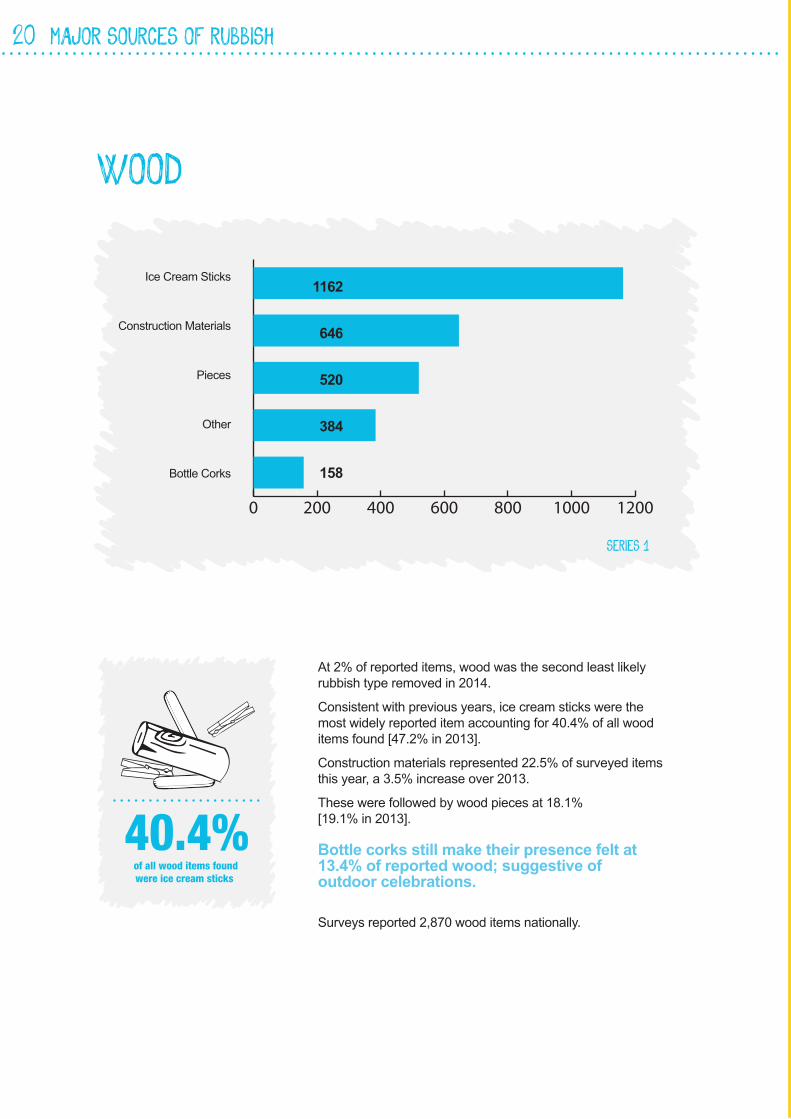
At 2% of reported items, wood was the second least likely
rubbish type removed in 2014.
Consistent with previous years, ice cream sticks were the
most widely reported item accounting for 40.4% of all wood
items found [47.2% in 2013].
Construction materials represented 22.5% of surveyed items
this year, a 3.5% increase over 2013.
These were followed by wood pieces at 18.1%
[19.1% in 2013].
Bottle corks still make their presence felt at13.4% of reported wood; suggestive ofoutdoor celebrations.
Surveys reported 2,870 wood items nationally.
21
RUBBER
SERIES 1
0
200
400
600
800
1000
Tyre
s
Thon
gs/s
hoes
Oth
er
Rub
ber G
love
s
Con
dom
s
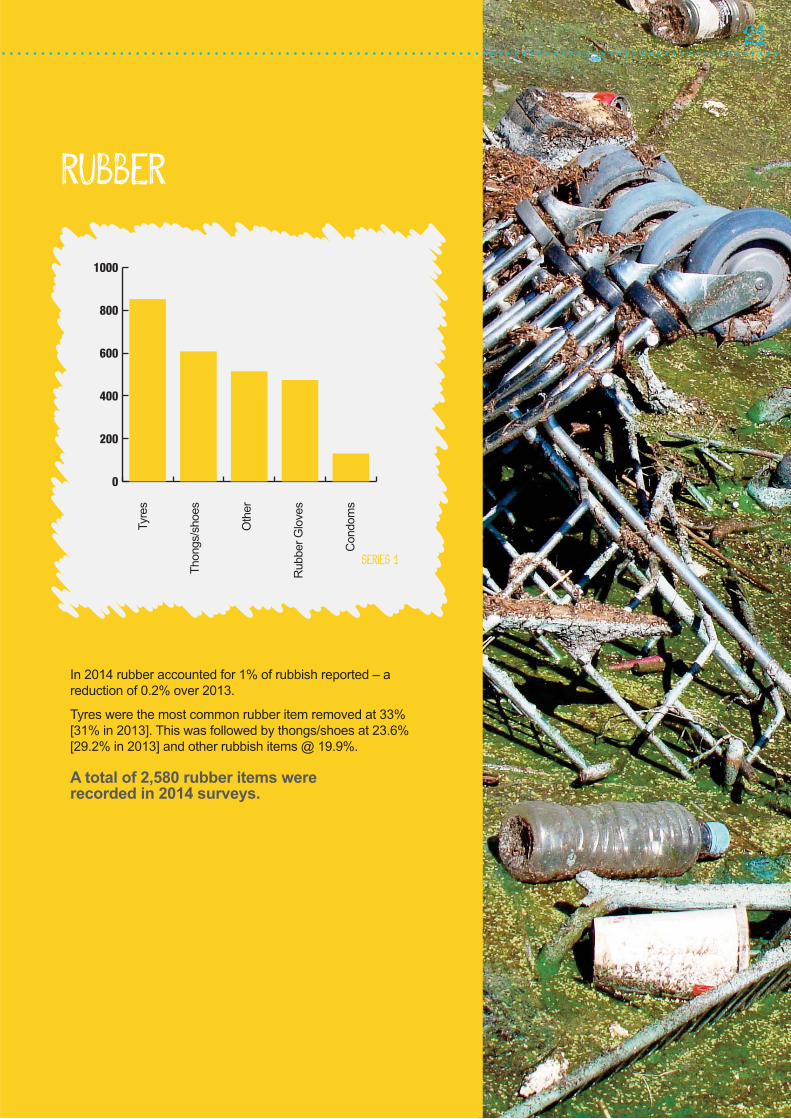
In 2014 rubber accounted for 1% of rubbish reported – a
reduction of 0.2% over 2013.
Tyres were the most common rubber item removed at 33%
[31% in 2013]. This was followed by thongs/shoes at 23.6%
[29.2% in 2013] and other rubbish items @ 19.9%.
A total of 2,580 rubber items were recorded in 2014 surveys.
2014 Sponsors
and Supporters
Site Rubbish Composition
22 SITE RUBBISH COMPOSITION
30.31
4.95
17.10
1.45
9.90
16.16
0.98
19.15
100.00
Plastic
Polystyrene
Glass
Rubber
Paper/cardboard
Metals
Wood
Miscellaneous
Total
26.58
6.13
10.08
1.09
11.34
12.91
1.22
30.65
100.00
Beach
CoastalRoadway
27.58
5.32
13.89
1.98
19.96
14.91
1.47
14.89
100.00
37.77
3.85
10.55
1.10
14.51
13.00
2.15
17.07
100.00
Outdoor
Transport
Shops
MallsDive
40.17
9.86
10.46
1.20
12.60
14.81
1.14
9.75
100.00
Rivers Parks
29.12
6.96
8.66
1.33
9.27
13.31
1.04
30.31
100.00
25.76
5.66
15.31
1.32
14.94
15.07
1.50
20.44
100.00
Public
Bushland
School
Grounds
39.52
2.50
11.67
0.42
22.62
7.25
1.10
14.92
100.00
33.49
14.44
7.53
2.09
17.25
12.26
2.00
10.94
100.00
50.00
10.78
16.23
0.52
0.00
20.91
0.00
1.56
100.00
Other
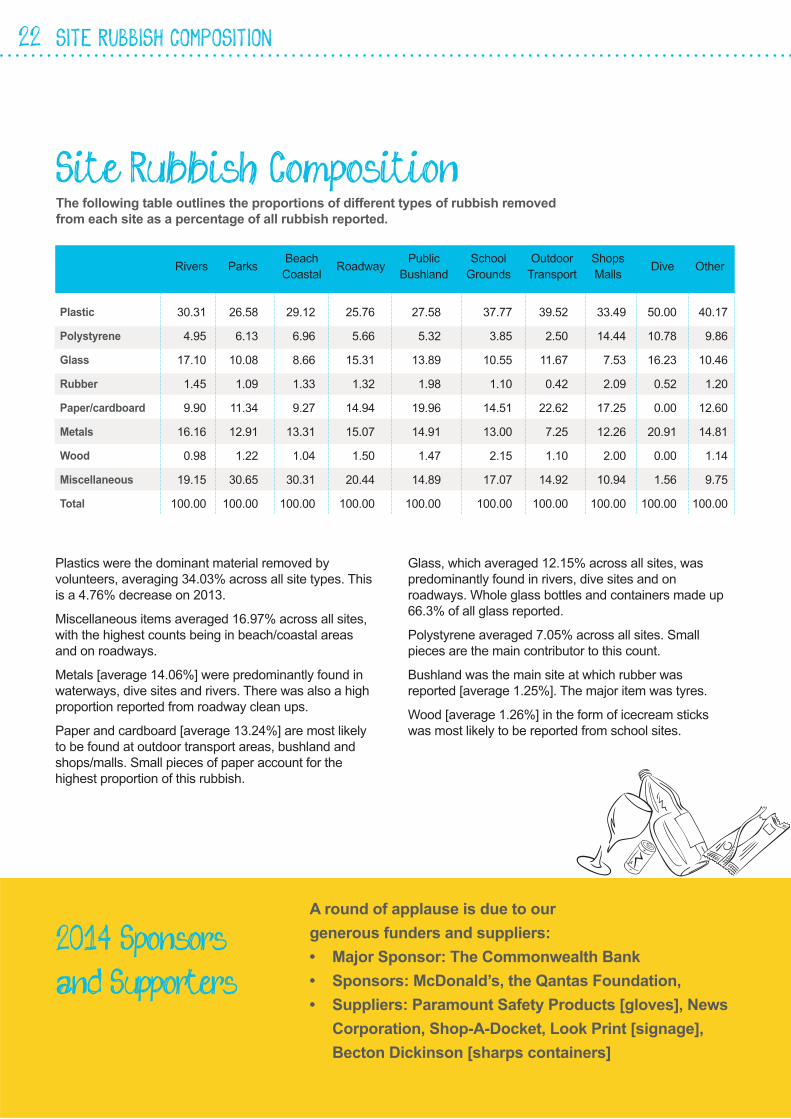
The following table outlines the proportions of different types of rubbish removed
from each site as a percentage of all rubbish reported.
Plastics were the dominant material removed by
volunteers, averaging 34.03% across all site types. This
is a 4.76% decrease on 2013.
Miscellaneous items averaged 16.97% across all sites,
with the highest counts being in beach/coastal areas
and on roadways.
Metals [average 14.06%] were predominantly found in
waterways, dive sites and rivers. There was also a high
proportion reported from roadway clean ups.
Paper and cardboard [average 13.24%] are most likely
to be found at outdoor transport areas, bushland and
shops/malls. Small pieces of paper account for the
highest proportion of this rubbish.
Glass, which averaged 12.15% across all sites, was
predominantly found in rivers, dive sites and on
roadways. Whole glass bottles and containers made up
66.3% of all glass reported.
Polystyrene averaged 7.05% across all sites. Small
pieces are the main contributor to this count.
Bushland was the main site at which rubber was
reported [average 1.25%]. The major item was tyres.
Wood [average 1.26%] in the form of icecream sticks
was most likely to be reported from school sites.
[*It should be noted there were only 3 dive sites surveyed]
A round of applause is due to our
generous funders and suppliers:
• Major Sponsor: The Commonwealth Bank
• Sponsors: McDonald’s, the Qantas Foundation,
• Suppliers: Paramount Safety Products [gloves], News
Corporation, Shop-A-Docket, Look Print [signage],
Becton Dickinson [sharps containers]
23
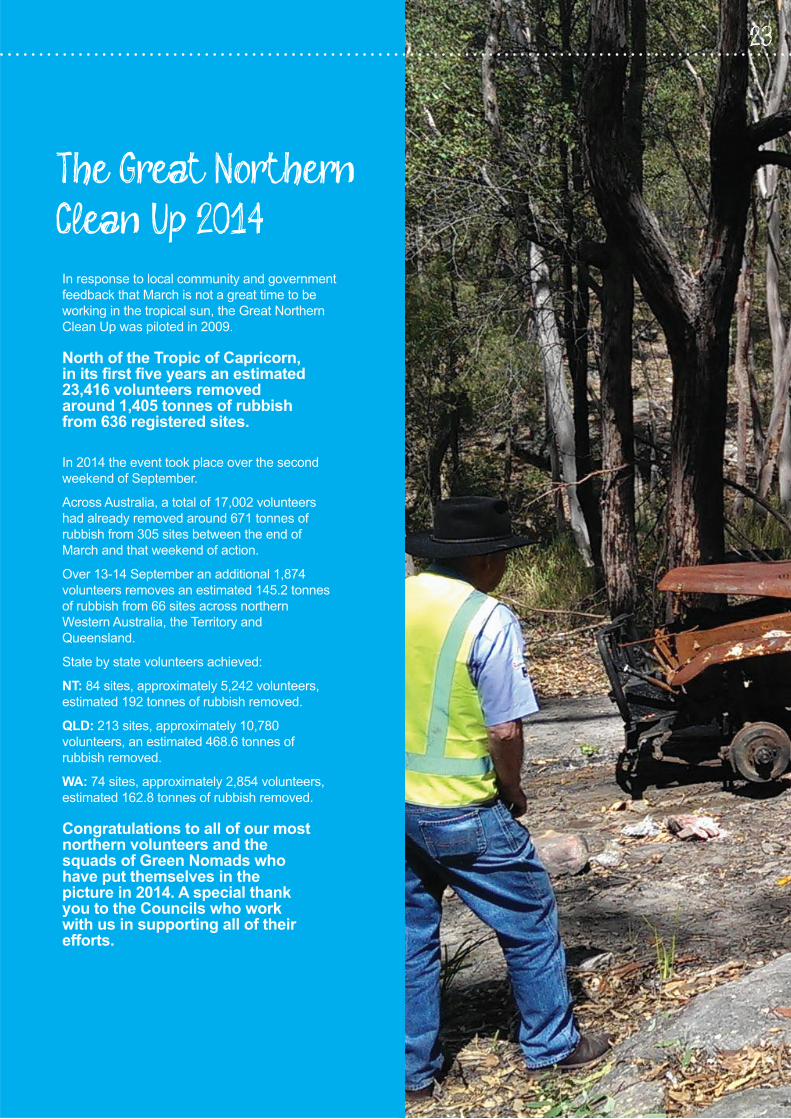
The Great Northern Clean Up 2014In response to local community and government
feedback that March is not a great time to be
working in the tropical sun, the Great Northern
Clean Up was piloted in 2009.
North of the Tropic of Capricorn,in its first five years an estimated23,416 volunteers removedaround 1,405 tonnes of rubbishfrom 636 registered sites.
In 2014 the event took place over the second
weekend of September.
Across Australia, a total of 17,002 volunteers
had already removed around 671 tonnes of
rubbish from 305 sites between the end of
March and that weekend of action.
Over 13-14 September an additional 1,874
volunteers removes an estimated 145.2 tonnes
of rubbish from 66 sites across northern
Western Australia, the Territory and
Queensland.
State by state volunteers achieved:
NT: 84 sites, approximately 5,242 volunteers,
estimated 192 tonnes of rubbish removed.
QLD: 213 sites, approximately 10,780
volunteers, an estimated 468.6 tonnes of
rubbish removed.
WA: 74 sites, approximately 2,854 volunteers,
estimated 162.8 tonnes of rubbish removed.
Congratulations to all of our mostnorthern volunteers and thesquads of Green Nomads whohave put themselves in thepicture in 2014. A special thankyou to the Councils who workwith us in supporting all of theirefforts.
Clean Up Australia Ltd
193 Darlinghurst Rd, Darlinghurst NSW 2010
cleanup@ cleanup.com.au
Clean Up Australia Day 1800 282 329
Clean Up Australia +61 2 8197 3400
Clean Up the World +61 2 8197 3420
www.cleanup.org.au