Embed Size (px)
Citation preview
<=>/30< 87 9-56 835 ?3=2 <90.3-5 ;010;07.0 =8
37=0;0<==0;313.-=387
2@KHOHL -ACRJ 4HEJH
- =GDPHP <RAKHQQDC EMO QGD /DFODD ME 9G/@Q QGD
>LHSDOPHQV ME <Q" -LCODTP
%*)%
1RJJ KDQ@C@Q@ EMO QGHP HQDK HP @S@HJ@AJD HL;DPD@OBG,<Q-LCODTP+1RJJ=DUQ
@Q+GQQN+##ODPD@OBG!ODNMPHQMOV"PQ!@LCODTP"@B"RI#
9JD@PD RPD QGHP HCDLQHEHDO QM BHQD MO JHLI QM QGHP HQDK+GQQN+##GCJ"G@LCJD"LDQ#%$$&'#&*(%
=GHP HQDK HP NOMQDBQDC AV MOHFHL@J BMNVOHFGQ
STUDIES ON PALM OIL
WITH SPECIAL REFERENCE TO INTERESTERIFICATION
being a Thesis
presented by
HAlv1IRIN ABDUL KIFLI, M.Sc.
to the
UNIVERSITY OF ST. ANDREWS
in application for
THE DEGREE OF DOCTOR OF.PHILOSOPHY
February 1981
SUMMARY
Interesterification which can be considered as the removal of
fatty acids at random from glyceride molecules, the shuffli.ng
of these acids and their replacement of the glyceride m.olecules,
has been investigated for palrn oil, palrn oil fractions and palm
oil mixed with other vegetable o11s. The reaction 'has been
effected at 900
C in the presence o£ sodium. methoxide as a
catalyst. Pancreatic lipolysis has been ernployed to check the
completene s s of the reacti.on. On cOluplete :candornisation,
the fatty acid composition. of the 2-position is the sarne as that
of the whole fat either before 014 after interestel'ification.
The changes in the glyceride cO:tYlposition resulting fron'1
interesterification have been exarnined by various standard
technique s. Silver ion thin layer chron'1atography which
separates glycerides according to their degree of unsaturation
has been used extensively. Using luethyl heptadecanoate as
an internal standard various com.ponent glyc,erides have been ",
" ~
··;.{Y'
quantified. . GLG of glycerides has als~,l1!s~nused to study the
. ''''?;'~ changes in glyceride composition of fats cont£'tning a wide
".
range of fatty acid cOluposHion.
The application of thin layer chromatography, usi.ng methy_l
heptadecanoate as an interncll standard, ha.s aiso been extended
to deterrnine the esters for.r-ned during interesterification when
sodiur:n. methoxide is used as a catalyst.
The changes in physical properti.es which resuE from
interestel'ification have been determined by NMR (solids .fat
content) and DSC (thermal behaviour).
Attempts to prepare a mixture of fats and oils containing
palm oil and / or palm oil fraction s which simulate s vanaspati
have been made. Many rnixtul'es have been subjected to
interesterification and the physical properties of the products
have been investigated using NMR for all the mixtures and
DSC of selected mixtures. The SFC curve of each rnixture
has been compared with that of vana spati.
useful mixtures are recognised.
Some potentially
Stereospecific glyceride analysis of various types of palm
oils has also been carried out using Brockerhoff 1 s method.
This involves partial deacylation of the triacylglyce!'ols,
i.solation of the a,l3-diacylglycerols, conversion of these
diacylglycerols to phospholipid derivatives and finally
stereospecific hydrolysis by Phospholipase AZ
from fmake
venom, The possible component glycerides have then been
computed as suming a i-random, z- random, 3.:. random
distribution of the fatty acids found in each of these positions.
The results have been discussed in tenus of double bond
nUluber and of carbon nunlber: The latter has been compared
with results obtained by gas chromatography of the whole oil.

To
Atasha and Siti Anabaena
D EC LARA TICYN
I hereby declare that this thesi -s is a record of the results
of my own experirnentG, that it is my own composi.tion, and
that it h as not previously been presented ill application for a
higher degree.
The research was carried out in the Chemistry Research
Department of the University of St. Andrews under the direction
of Professor F.D. Gunstone, D.Sc. ,F.R.I.C.
C ERTIFIC P.T.E
I hereby certify that Mr. Hamil'in Abdul Kifli has spent
twelve terms at reseaJ: ch work und er my supervision, has
fulfilled the conditions of t he Resolution of the University
Court No.1 (1967) and that h e is qualifi e d to subm.it the
accompanying thesis in application for the degree of Doctor
of Philo s oph y.
Re search Supervi sor
LECTURE
"The Compo sition and Physical Behaviour of Fats Before and
After Interesterificz"Ltion With Special Reference to Palm Oil ll
B.A. Kifli and F.D. Gunstone, presented to the ISF/AOCS
Congress, New York,April 28th, 1980.

ACKNOWLEDGEMENTS
I wish to express xny sincere grc(titude to Professor
F.D. Gunstone for his continued supervisi.on, guidance and
assistance throughout this research and writing of this thesis.
I wish also to record my sincere thanks and appreciation to
Dr. Charlie Scrimgeour for much practical advice and discussion
atthebencli., toMr. OhChuanHo and Mr. K.G. Berger of
Pall"n Oil Research Institute of Malaysia and also to Dr. F.B. Padley
of Unilever Research, Colworth House, Bedford, England; for
their assistance in NMR and DSC analyses.
Thanks must also be expressed to Pepe (E. Ba(3cetta) for
his help and good company, to Andrew Watson for his help in
photographic work and to Mr s. VV ilma Pogorzelec for typing
this thesis.
I must also express my deepest thanks and appreciation
to rny wife, Atasha, for hel' artistic talent and for sacrificing
many long hours in drawing all graphs and histograms of this
the si s.
Finally, I must convey my gratitude to the Director General
of the Palm Oil Research lnst,i.tute of Malaysia for the study
grant and full pay study leave.
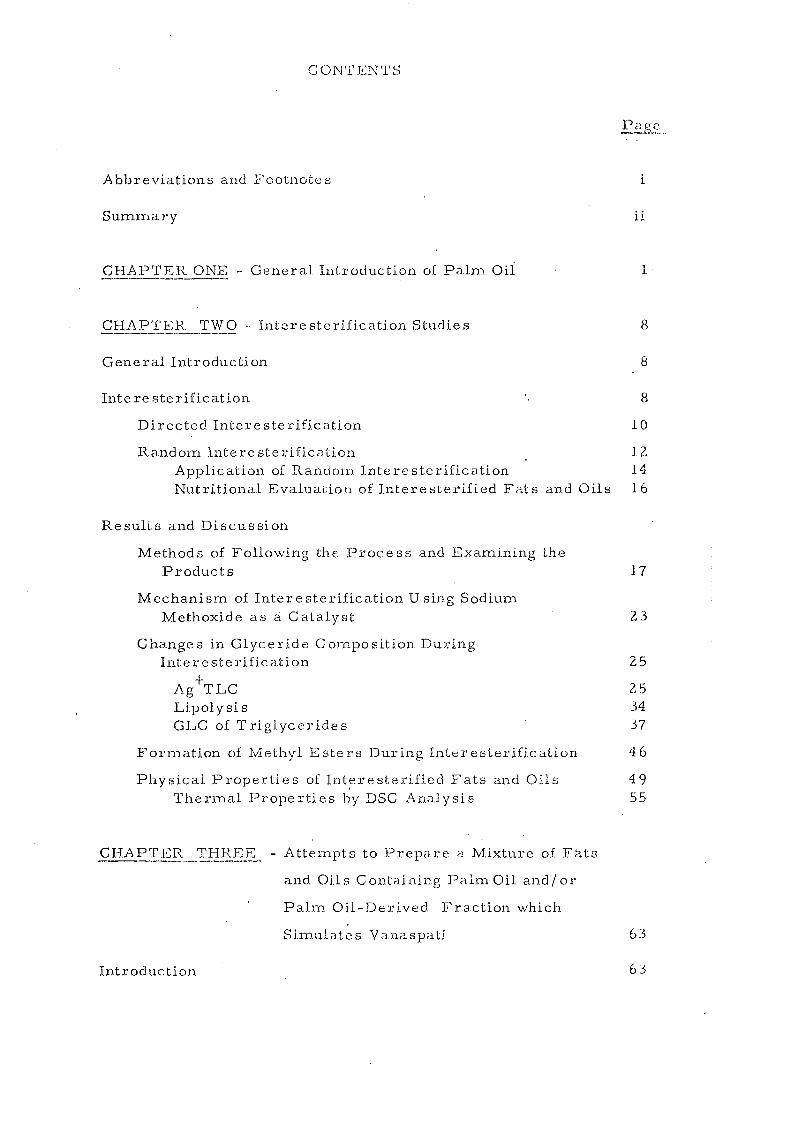
CONTENTS
A bbreviations and Footnote 8 i
Sumrnary ii
CHAPTER ONE - General Introduction of Palm Oil 1
CHAPTER TWO - Interesterification Studies 8
General Introduction 8
Interesterification 8
Directed Interesterification 10
Randorn Intere sterification 12 Application of Random Interesterification 14 Nutriti.onal Evaluation of Interesterified Fats and Oils 16
Results and Discussion
Method s of Follo\ving the Proce S8 and Examining the Products 17
Mechanism of Intere8terification U sing Sodium Methoxide as a Catalyst 23
Changes in Glyceride Composition DuX'ing Interesterification 25
+ Ag TLC 25 Lipolysis 34 GLC of Triglycerides 37
Formation of Methyl Esters During Interesterification 46
Physical Properties of Int,eresteri£i.ed Fats and Oils 49 Thermal Properties by DSC Analysis 55
CHAPTER THREE
Introduction
- Atternpts to Prepare a Mixture of Fats
and Oils Containing Palm Oil and/or
Palm Oil-Derived Fraction which
Simulates Vanaspati. 63
63
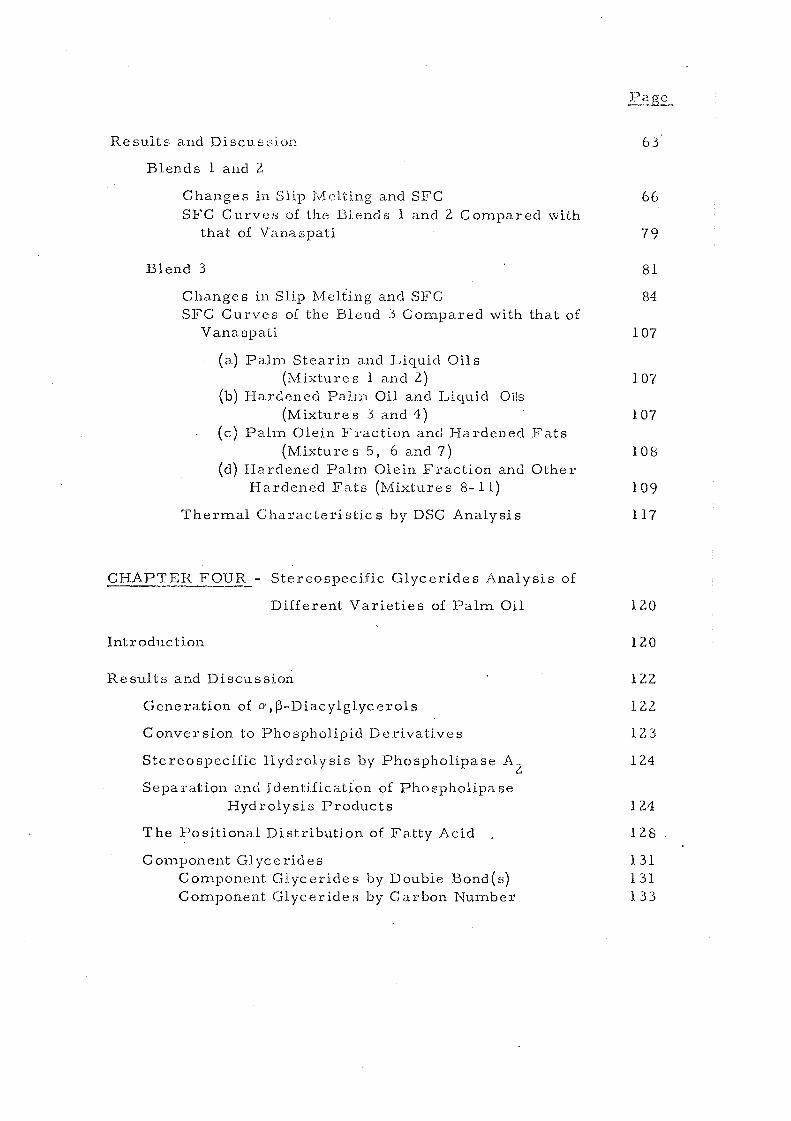
Results and Discussi.on
Blends 1 and 2.
Change s in Slip Melting and SFC 66 SFC Curves of the Blends 1 and 2. Compared with
that of Vanaspati 79
Blend 3 81
Chan.ge s in Slip Melting and SFC 84 SFC Curves of the Blend.) Compared with that of
Vanaspati 107
(a) Palm Stearin and Liquid Oils (Mixture s 1 and 2) 107
(b) Hardened Pal.nl Oil and Liquid Oils (Mixture s .) and 4) 107
(c) Palm Olein Fraction and Hardened Fats (Mixtures 5, 6 and 7) 108
(d) Hardened Palm Olein Fraction and Other Hardened Fats (Mixture s 8- 11) 109
Thermal Gharacte ri stic s by DSC Analysi s 117
CHAPJ;:..ER :f0"QB-_ - Stereospecific Glycerides Analysis of
Different Varieties of Palm Oil
Introduction
Results and Discussion
Generation of O:',~-Diacylglycerols
Conversion to Phospholipid Derivatives
Stereospecific Hydrolysis by Phospholipase AZ
Separation and Identification of Phospholipase Hyd rolysis Produc ts
The ~'ositional Distribution of Fatty Acid
Component Glycerides Component Glycerides by Double Bond(s) Component Glyceride s by C arbon Number
120
120
122
122
I ') 'j {~ J
124
124
128
131 131 133
General J. 35
Purification of Lipid Samples 135
Gas Liquid Ch romat.ogl'aphy of Methyl Ester s 135
Acid -C atal ysed E steriHc ation 136
Base-C at.alysed T ransesterification 136
Preparation of Chromatoplate s 137
Normal Silica Gel G Thin Layer Chromatography 137
Preparative Silver Ion Thin Layer Chromatography 137
lntere sterification 13,'
Preparation of Sodium 1v1:ethoxide 137
Interesterification Process 139
Triglyceride Analysis 140
Ag+TLC 140
Ag+TLC - Calculation of the Triglyceride Composition of an Oil from the Ii'atty Acid Composition of ea.ch Fraction, using Methylheptadecanoate (17: 0 ester) as Internal Standard 141
Gas Chromatography of T riglyc eride s Preparation and Conditioning of the Column Operating Conditions Calculat.ion of Glyceride According to Carbon
Nurllber Component Glycerides by Ag+TLC and GLC of
Glycerides
Lipolysis Preparation of Buffer Solution Lipolysis Procedure Calculation of COlnponent Glyceddes
Determination of Methyl Esters Formed During Inte re s t:e rific ation
SFC by Pulsed NMR (Unilever Method)
Cali b ration
Procedure
146 116 146
147
151
151 151 151 152
153
154
154
154
Wide Line NMR (PORHA lvlethod) 155
Reproducibility of ]\·JMR Iv1easurement of Palm Oil 155
DSC Analy si s (Unilever Method) 156
DSC Anal ysi s (PORIM Method) 156
The Slip Me lting PoLn.t 156
Preparation of Grignard Reagent· 156
Generation of Q', f3-Diacy1g1yc ero1 s 157
Preparation of Phosphatidylphenol 158
Preparation of T r1 s Buffer 158
Ste reospeciflc Hydrolysi s with Phospholipase A 2 158
Isolation and Identi.fication of the Hydrolysates 159
Preparation of Glycerol I-Palmitate 160
Preparation of Acid Chloride (St.earoyl chloride) 161
Preparation of Gl yce 1'01 I-Palmitate 3-Stearate 162
Preparation of Glycerol I-Palmitate 2-Caprate 3-Stearate 162
SYNTHESIS OF GLYCEROL l··PALMITATE 2-CAPRATE
3-STEARATE 164
Glyc erol I-Palmitate 164
Glycerol I-Palmitate 3-Stearate 166
G1yc erol I-Palmitate 2-C aprate 3-Stearate 166
REFERENCES 168
APPENDICES 176
i
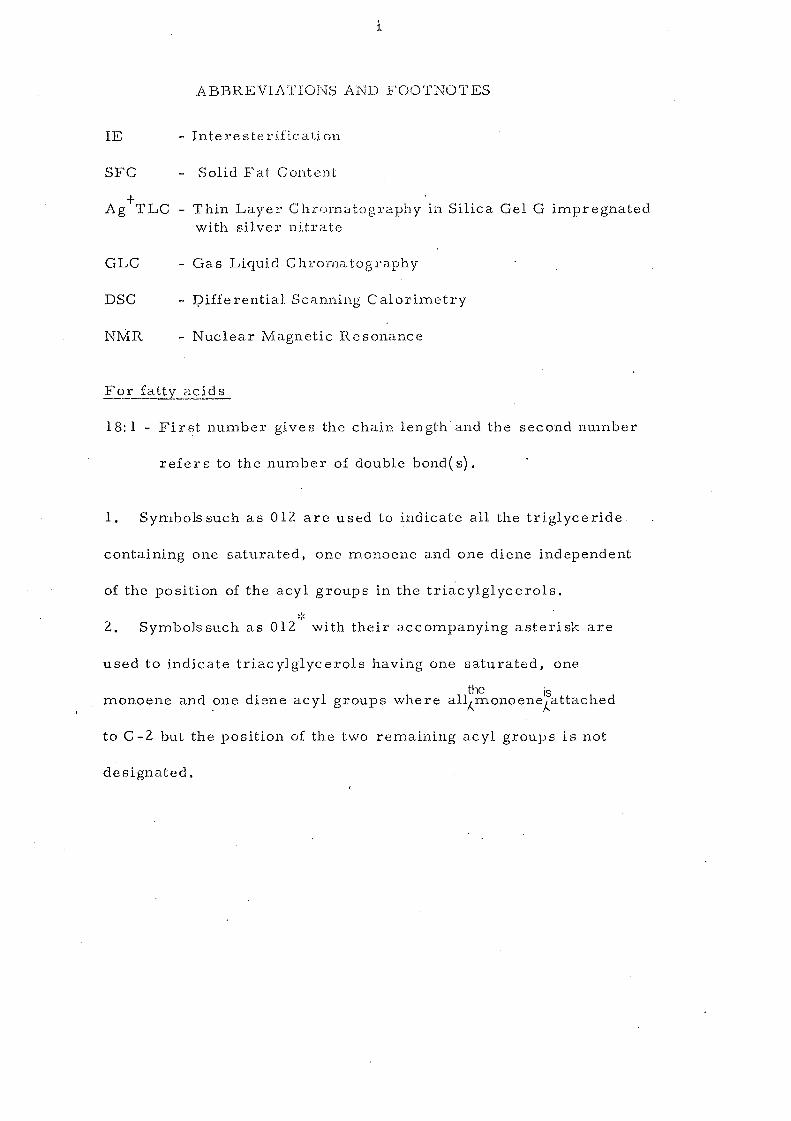
ABBREVU\TIOl'~.s AND :F'OOTNOTES
IE - InteresteriHcation
SFC - Solid Fat Content
+ Ag TLC - Thin Layer Chromatography in Silica Gel G impregnated
with silver nitrate
GLC Gas Liquid Chrornatography
DSC - Oi££e rential SCdnning Calor imetry
NMR - Nuclear Magnetic Resonance
18: 1 - First number gives the chain length and tbe second nurnber
refers to the number of double bond(s).
1. Symbols such as 012 are used to indicate all the triglyceride
containing one saturated, one lYlOllOene and one diene independent
of the position of the acyl groups in the triacylglycerols.
* 2. Symbols such as 012 with their a_ccompanying asterisk are
used to indicate triacylglycerols having one saturated, one
the is monoene and _one diene acyl groups where all"rnonoene,(attached
to C -2 but the position of the two remaining acyl groups is not
designated.
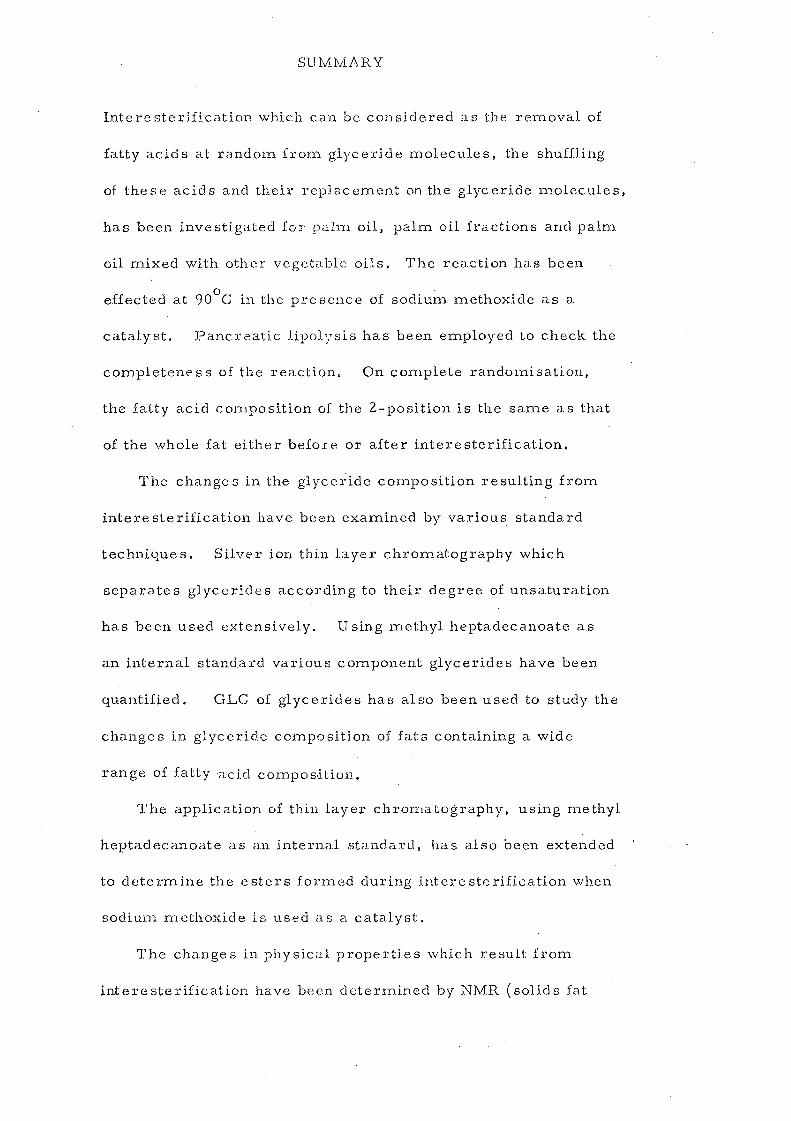
SUMMARY
Interesterifi.cation which can be considered as the rernoval of
fatty acids at random frOln glyceride molecules, the shuffling
of these acids and their replacement on the glyceride rnolecules,
has been investigated for palrn oil, palm oil fractions and palm.
oil mixed with other vegetable oils. The reaction has been
effected at 900
C in the preflence of sodiUln methoxide as a
catalyst. J?anc):eatic lipolysis has been employed to check the
completeness of the reaction. On complete randoluisation,
the fatty a.cid composition of the 2-position is the same as that
of the whole fat either before or after interesterification.
The change s in the glyceride composition resulting from
intere st.erification have been examined by va:dous standard
techniques. Silver ion thin layer chromatography which
separates glycerides according to their degree of unsa.turation
has been used extensively. U sing methyl heptadecanoate as
an internal standard various component glycerides have been
quantified. GLC of glycerides has also been used to study the
changes in glyceride cOlllposition of fats containing a wide
range of £attyacid cOlupos,ition.
The application of thi.n layer chromatography, using methyl
heptadecanoate as an internal standard, has also been extended
to determine the esters forlllcd during interesterification when
sodiurn nlethoxide is used as a catalyst.
The changes in physical properties which retiult from
interesterification have been determined by NMR (solids fat
content) and DSG (therma.l behaviour).
Atten.lpts to prepare a lnixture of fats and oils containi.ng
palm oil and lor palrn oil fraction s which simulates vanaspati
have been lnade. Many mixtures have been subjected to
intere sterification and the physical propertie s of the products
have been investigated using NMR for all. the mixtures and
DSG of selected mixture s. The SFC curve of each mixture
has been compared with that of vanaspati. Some potentially
useful mixtures are recognised.
Stereospecific glyceri.de analysis of various types of palm
oils has also been carried out using Brockerhoff1s method.
This involves partial dEeacylation of the triacylglycerols,
isolation of the a,~-diacylglycel'ols, conversion of these
diacylglycerols to phospholipid derivatives and finally
stereo specific hyd 1'01 ysi s by Pho spholipase A 2 from snake
venom. The possible component glycerides have then been
conlputed as surning a 1- random, 2- random, 3- randorn
distribution of the fatty acids found in each of these .positions.
The results have been discussed in terms of double bond
number and of carbon nunlber'. The latter has been compared
with results obtained by gas chromatography of the whole oil.

CHAPTER ONE
1
General Introduction of Palm Oil.
Palm oil, a semi-solid at arnbient tenlperature, is derived from
The oil palm probably oTiginated in the West Coast of Afric a and
does not grow wild in IVlalaysia. Introduced in 1875, it remained
an ornamental palm (tree) until 1917 when it became cornmercially
important with the increasing worldwide consurnption of vegetable
1 oils and fats . Malaysia has been a leading supplier of palm oil
since 1966 when a Dlere 352, 000 acres under oil pa.lm cultivation
. 2 yielded 185, 000 tonne s of palm all Malaysia is now the world's
largest producer and exporter of palm oil, accounting for 51% and
74% respectively of world production and exports in 1978.
Production is proj ected to be more than double from 1.78 million
3 tonnes 1978 to over 3.5 lTlillion tonnes by 1985
Oil palrn can be categorised int.o three different varieties based
on the characteri-stic s of the internal fruit: Dura is characterised
by a thick shell between the me socal'p and the kernel. Pisifera
is distinguished by the absence of the shell, and Tenera, a hybrid
progeny of Dura x PisHera cross, is characterised by a thin shell
and the presence of a ring of fibres encircling the nuts. Tenera
is the most important variety for commerci.al cultivation in
Malaysia becau:::e of its econornicaJ. viability in terms of oil yield
and processing suitability.
4 The processing of palm fruit involves several stages .
Harvesting of ripe fruit bunches is carried out using a chisel or a
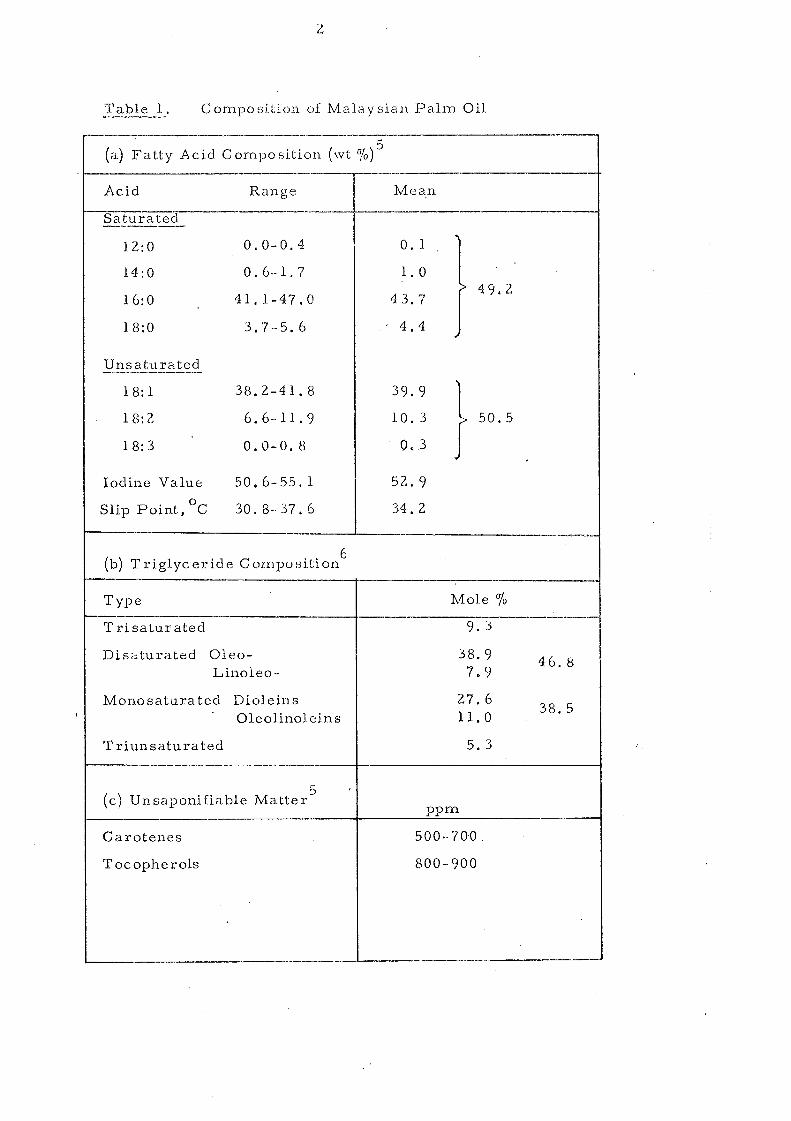
Table 1. -.. ----- Composition of Malaysian Palm Oil
r-----:,..-------.-------~-----.------------.-
(a) Fatty Acid Composition (wt vlo)S
~----------.---------------------~----.----.----------------------
Acid
12: a 14:0
16: 0
18:0
Dns aturated
18: 1
18: 2
18: 3
Iodine Value
Slip Point, °c
Range
0.0-0.4
O. 6··1. 7
41.1-47.0
3.7-5.6
38.2-41.8
6.6-11.9
0.0-0.8
50.6-55.1
30.8-37.6
Mean
O. 1
1.0
43.7 49.2
4.4 .
39.9 } 10.3 50.5
0.3
52.9
34.2
r-------------------------------J---________________________ .~
(b) Triglyceride Composition6
------.--------------.----------~--------------------------~
Type Mole % r------------------------------4------.--------------.--.-------9.3
38.9 7.9
Trisaturated
Di saturated OleoLinoleo-
Monosaturated Dioleins Oleolinoleins
T riunsatura ted
5 (c) Dnsaponifiable Matter
Carotenes
Tocophe:cols
27.6 11.0
5.3
ppm
500-700.
800-900
46.8
38.5
~--------.------------------.~----.----------.----------------
curved knife on a long pole. The harve sted blmche s are carefull y
handled to m.inirnise bnlising and tJ.';~mpol·ted by lorries or rail
trucks to the mill or factory without delay. At the mill the fruit
bunche s are subj ected to stearn. sterili sation for about one hour.
Thi s serve s several purpose s. It inactivates the fruit lipase
which otherwise promotes a high free fatty acid (£fa) content,
loosens the fruits from the bunches for easy stripping, improves
extraction and settling of the crude oil to a certain extent and
loosens the kernel fronl the shell making it possible to crush the
nuts without damaging tIle kernels. The sterilised fruits are
stripped and separated horn bunches in a drum stripper. The loose
fruits are then conveyed into a digester where they are converted
into a hornogenous oily mash ready for processing. The palm oil
is extracted frorn. the mesocarp by automatic hydraulic press or
by screw press. The c rude palm oil is then separated from the
cell debris and water in continuous settling tanks and high speed
centrifugal separator s. The rnoisture content' of the 'crude pahn oil
is normally reduced under vacuur£l to about 0.10/0 to inhibit chemical
hydrol ysi s. The clean dry crude palm oil is then pumped into the
storage tanks ready for transportation to the ports or to the local
manufacturer s.
The typical composition of Malaysian palm oil is set out in
Table 1, Saturated and unsaturated fatty acids are present: in almost
equal proportions with palrnitic and 'oleic constituting the m.ajor
fatty acid s. This re sult s in the predominanc e of SU land Sl U
glycerides. The quality assessment of crude palm oil is shown in
Table 2. The free fatty acid content represents a <;legree of
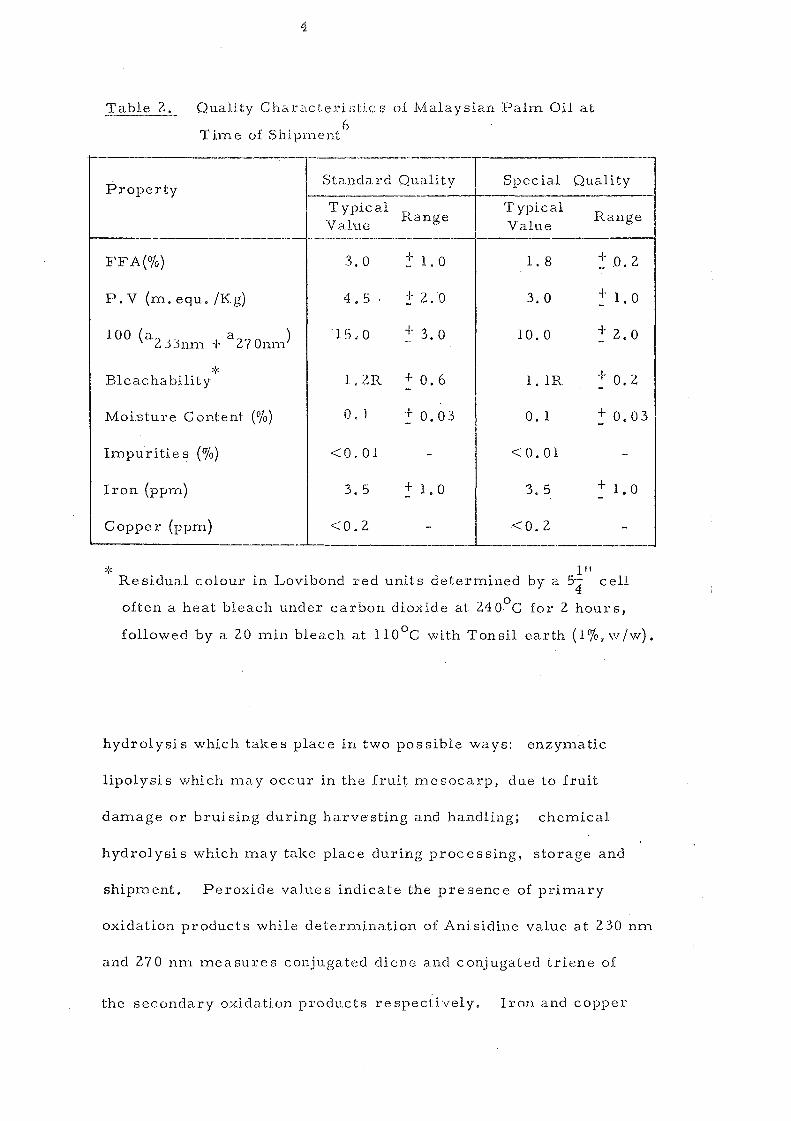
4
Table 2. Quality Chcu-act:eri ntic s of Malaysian Pahn Oil at
T f h ' 6 lrn.e o. S lprnent
-----
Standard ~ua1it~ Spec ial QuaH ty
FFA(%)
P. V (m. e q u. /K g)
100 (a 2 . a 2,0) J :inn"l + 7 run
;;:< B1eachability
Moi:sture Content (%)
Impuritie s (%)
Iron (ppm)
Copper (ppm) '-------------
Typical Range
Value ~-~-"--
3.0 t 1.0 -
4.5 i- 2.0
"15.0 + 3.0
1.2R t 0.6
0, 1 + 0.03
<0.01
3.5 ~ 1. 0
<0.2
T ypica1 Value
1.8
3.0
10.0
1.1R
0.1
<0.01
3. 5
<0.2
Range
:- .0.2
~ 1.0
~- 2.0
+ 0.2
:- 0.03
+ 1,0
-.-----------'--____ . _____ ---1
':' I" Residual colour in Lovibond :red units determined by a 5- cell
4 often a heat bleach under carbon dioxide at 240
0C for 2 hour s,
followed by a 20 min bleach at 1100C V'lith Tonsil earth (l%,w/w).
hydrolysis which takes place in two possible ways: enzymatic
lipolysis which may occur in the fruit mesocarp, due to fruit
damage or bruising during harvesting and handling; chemical
hydrolysis which may take place during processing, storage and
shipment. Peroxide value s indicate the pre sene e of primary
oxidation products while determination of Anisidine value at 230 nm
and 270 nn"l measures conjugated diene and conjugated triene of
the secondary oxidation products respecti.\lely. Iron and copper
I
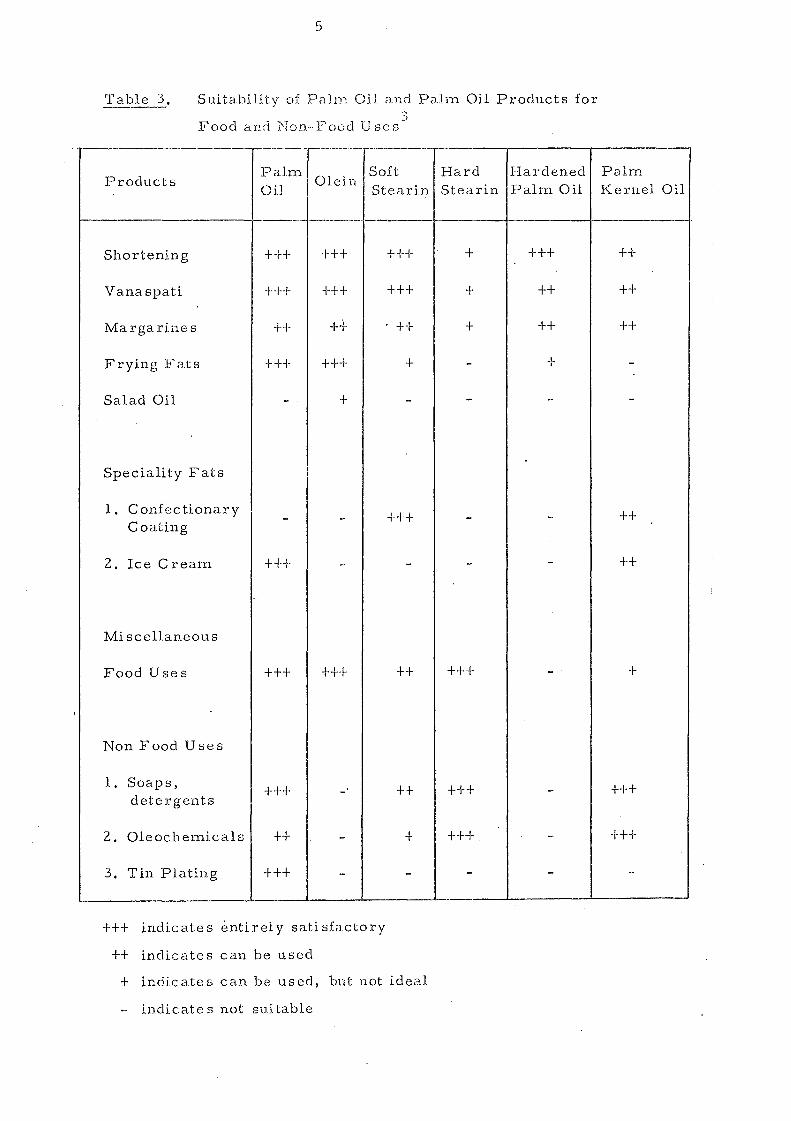
Table 3, ---- Suitability of PalIn Oil and Palm Oil Products for ",
Food and NOD·-}T'ocd U seg.)
--,-----,-----
Products Pahn
Olein Soft
0" 11 Stearin
1--- -----------~-
Shortening +++ +++
Vanaspati +++ +++
Margarines ++ ++
Frying Fats +++ +++
Salad Oil - +
Speciality Fats
1. Confectionary - -Coating
2. Ice Cream +++ -
Mi scellaneous
Food Uses +++ +++
Non Food Uses
1. Soaps, +++ -detergents
2. 01eochelnicals ++ -
3. T in Plating +++ -
+++ indicates entirely satisfactory
++ indicates can be used
+-\--1-
+++
++
+
-
+++
-
++
++
+
-
+ indicate s can be used, bnt not ideal
- indicate s not sui table
Hard Hardened Stearin Palm Oil
+ +++
+ ++
+ ++
- +
- -
- -
- -
+++ -
+++ -
+++ . -
- -
------Palm Kernel Oil
++
++
++
-
-
++
++
+
+++
+++
-
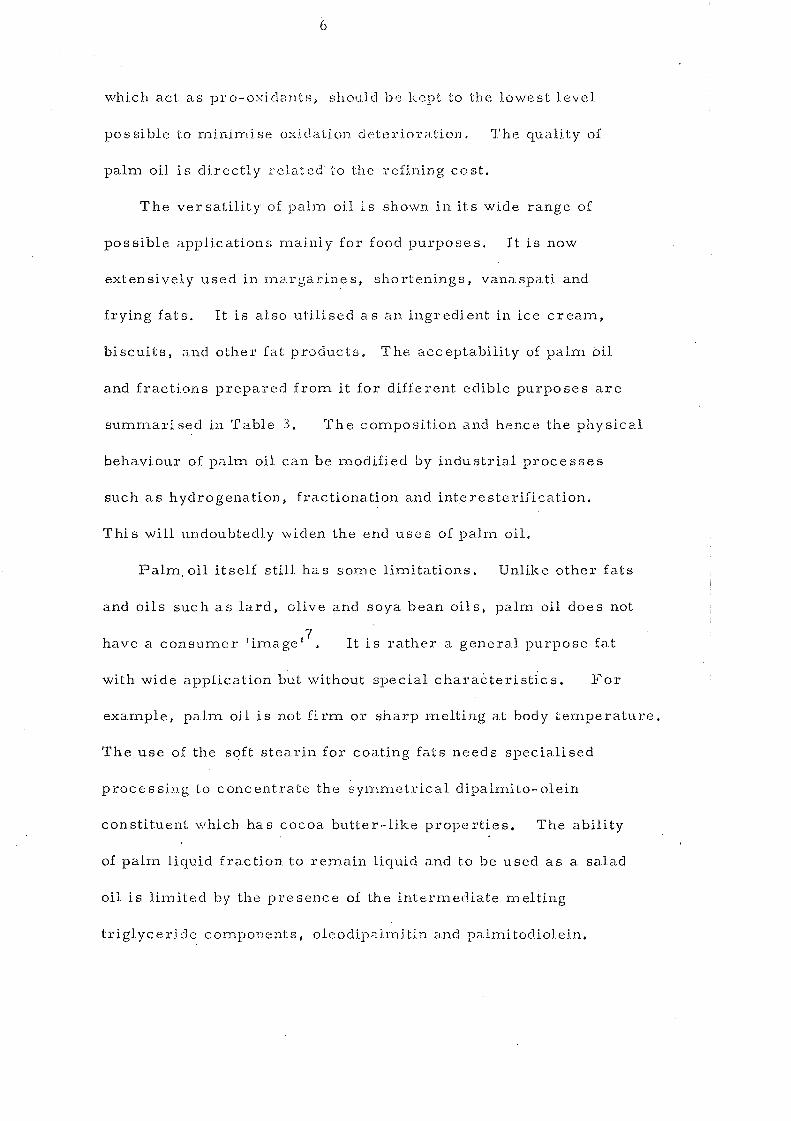
6
which act as pro-oxidants, should be kept to the lowest level
po S 8i ble to rninilYlise oxidation deterioration. The quality of
palm. oil is directly related to the refining cost.
The versatility of palm oil is shown in its wide range of
possible applications n:lainly for food purposes. It is now
extensively used in lTlargarin,es, shortenings, vanaspati and
frying fat s. It is also utilised as an ingredient in ice cream,
biscuits, and other fat products. The acceptability of palm oil
and fractions prepared from it for different edible purposes are
sumnl.ari sed in Table 3. The composition and hence the physical
behaviour of palm oil can be rnodified by industrial processes
such as hydrogenation, fractionation and interestel'ification.
Thi s will undoubtedly widen the end use s of palm oil.
Palm,oll itself still has some limitations. Unlike other fats
and oils such as lard, olive and soya bean oils, palm oil does not
have a consumer 'irnage,7. It is rather a general purpose fat
with wide application b~t without special characteristics. For
example, palm oil is not firm or sharp lnclting at body temperature.
The use of the soft stearin for coating fats needs specialised
proce s sing to c onc entrate the symmetrical dipalmito- olein
constituent which has cocoa butter-like propel'ties. The ability
of palm liquid fraction to remai.n liquid and to be used as a salad
oil is limited by the pre senc e of the intermediate melting
triglycerj,de COlYlpOnents, oleodipalmi!:in and palmitodiolein.
7
About 90% of lvLlla·Y:3ian palnl oil production is exported.
Total world production of oils and fats is projected to rise
about 3% per annum, and that for palnl oil about 8% 3. From
this forecast it is obvious that palm oil will have to compete
increasingly with the fats and oils in the world market.
Thes e two factor s - the phys~cal limitations and the
increasing competition - indicat~ a need for more research
with the view to increasing the existing end uses of palm oil.
Of the various processes for modifying pc.lIn oil to increase
its usefulness, this study is devoted mainly to interesterification,

CHAPTER TWO
8
Interesterification Studies
General Introduction _o=o ___ .~ ________ _
The physical nature of triacylglycerols is influenced by the chain -
length, the unsaturation and the distribution of the fatty acid s among
the three hydroxyl groups. Fats with a high proportion of long-chain
saturated acids are solid at alnhicnt ten'peratures: those in which
unsaturated fatty acids are predominant, are liquid. The
distribution of fatty acid s among the triglycerides is also si.gnificant
and it is known that randomisati.on of natural non·· random mixture s
influence s physical propertie s. For these reasons the end uses of
a natural fat or oil is lin"lited, but this can be extended by various
processing steps such as fractionation, hydrogenation·and
interesterification. Fractionation separates oils or fats into solid
and liquid fractions, each of which can be utilised differently.
Hyd rogenation change s a liquid oil into a semi-solid or solid fat.
Interesterification modifies the natu.ral distribu.t.ion of fatty acids in
the glycerol moieties thereby producing fats or oils with different
glyceride composition and physical behaviour from the naUve oil.
Intere sterification
InteresteJ'.'lfication as applied to.fats and oils may be defined as a
process by which the fatty acid moieties of glyceride molecules
are arranged in either a randorn or directed 1'"nanner. In both
cases the reaction re sults in a di.fferent triglyceride composition
which in turn lead s to diffe rent physical behaviour from the
native fats or oils.
9
Baile y 8
cla s sified inte re steT iiie ation into thre e different
types of reactions:··
(i) Acidolysis involves the interchange of acyl groups between
a fat and free fatty acid. VariOUf; conditions of acidolysis reaction
have been de se ribed. Uncatalysed reactions generally require
high temperatures (250- 300oC) compared with those catalysed by
agents such as sulphuric acid, boron trifluoride, mercuric
sulphate, oxides and soaps of alumInium, magnesium, tin and zinc.
Acidolyse s of vegetable oil s which have been reported include
the reaction of cottonseed oil, peanut oil or mahua oil with lauric
9 'd 10 - 12 acid ; coconut oil with stearic aCl and soybean oil with
13 butyric acid
(ii) Alcoholysis refers to the interchange reaction between
acyl chains of triglycerides and an alcohol. Triglycerides react
with methanol and ethanol to produce corresponding methyl and
14 ethyl esters and free glycerol . The reaction can be effected
by either acid or alkaline catalysts but the latter are more
15 reactive . Alcoholysis with glycerol is important in the
production of alkyd resins and of edible and oil- soluble surface-
active agents. The reaction of peanut oil. with ethanol has been
16 studied in detail by Feuge and Gros .
17 It has been reported that
saturated acids interesterify more rapidly than the unsaturated
acids and that the rate of alcoholysis of the latter decreases with
increase in unsaturation"
(iii) The ester interchange reaction is the most important
interesteri£i.cation reacti.on for processing fats and oils. This
10
reaction can be carried out in two \vays de signa ted randorn, and
directed interesterification. Randon interesterification is the
lnajor aspect of the studief; presented in this thesis.
. 18 Directed interesterification was first established by Eckey who
realised that interesterification can be directed away from. its
usually random end product, if the reaction mixture is allowed to
crystallise during the reaction. The reaction equilibrium of the"
the reaction mixture is cooled below its melting poi~t, the
trisaturated glycerides (S) will crystallise and disturb the
equilibrium within the liquid phase. This induces the forITlation
of more trisaturated glycerides in an effort to regain equilibrium.
The rate of directed rearrangement will be influenced by the rate
of randomisation in the liquid phase, the rate of heat removal, the
extent of nucleation i.. e. number of crystal centres formed on which
trisaturated glycerides can be crystallised and the rate at which
the trisaturated glycerides crystallise out of the liquid phase.
Directed interesterification has found application in the production
of various types of fats of desired physical properties.
Improvement of plasticity in the production of lard shorteni.ng 19 is achieved
by increasing trisaturated and triuDsaturated glycerides and
reducing ITlonounsaturated (USZ
) and diunsaturated (U 2S) glyc eride s
of intennediate n~elting points. 20
Naudet and De snuelle separated
the shorter chain acids f:con~ coconut oil by mixing it with the
methyl esters of peanut oil and subj ected the mixture to directed
11
interesteri.£ication in the prcGencC' of sodiurn hydroxide as a
catalyst. N 011.- random. intere ste rification ha s also be en applied
21 to palm oil to pr epare fats of specific melting point. It has
been reported22
that a hard interef.terified product similar to
cocoa buttel' in appearance and melting characteristics can be
obtained when mixtures of 8y~lthetic triglycerides differing in
melting point are interesterifled non-randomly with approximately
equinlOlar amounts of 18:0, 16:0 and 18:1 acids. Instead of the
synthetic glycerides, natural triglycerides such as mutton tallow,
paln.1. oil or cottonseed oil may be used.
23 Ghobanov et al recently studied the changes in glyceride
com.position during non- randonl interesterification of lard. They
employed two different conditions of directed interesterification:
isothermal at various ten1.peratures and a step-wise reduction of
tempe rature. The fonner pr ovided information a bout the inte rvals
at which to change temperature during the course of the latter
reaction. U sing a cornbination of silver ion t11in layer
chromatography and densitometry, they were able to demonstrate
the change s in the content of various groups of glyceride s according
to their degree of unsaturation during the course of non- random
inte re ste rifica tio11.
Directed rearrangement is relatively slow because of the
lower tem.peratures used and the time required for crystallisation.
Other than preparation of plastic shortening this process has
lnany possibilities. Among them are the production of confectionery
19,24 25 24 hard butters , salad oils I drying oils I and margarine
12
,24,26 ol1.s .
27 Hustedt l'eported that directed inte re sterific ation
can be combined V1i.th fTactionation to get a higher yield of
liquid fraction from palrn oil than is obtained by fractionation alone,
This liquid fraction can be used as a salad oil.
Random intere sterification can be' considered as the rem.oval of
fatty acids at random frorn the glyceride lTIolecules, the shuffling
of these acids, and their replacement on the glyceride molecules
at random. There are two significant reaction s taking place,
intra- e sterilication and inter- esterification. The two together
are generally referred to as randoDl interesterification or rand01TI
rearrangement.
Random rearrangem.ent can be effected in the presence of a
catalyst. 28,29
Variou s type s of catalyst s have been reported
but sodium m.ethoxide is the most comm.on and widely used in
industry as a low~ ternperature rear rangement catalyst. Sodi.um.
lTIethoxide has an advantage over the alkali metals in that it can
be easily dlspe r sed in a fat. l\,f" 130 r 11 d lVilkl ~.!:. ~ succ e s SIU y use
caustic soda as catalyst along with gl.ycerine and water to
randomise refined palm oil, lard, or m.ixtures withi.n 4 min at
'loooe in a high vacuum reactor. They found that the keeping
quality and taste of the products were cOlTIparabl.e with that of
non-interes1:erified oil and fat products.
A system.atic study of the reactions occurring during random
interesterification using sodiUlTI luethoxide as a catalyst have been
13
2.9,32, reported by several. workers
31 and notably by Weiss ~~ ~
who postulated that the fm1ction of sodiun'l rnethoxide was to
~.1
generate re sonanc e- stabiE sed ~,' enolate ion or carbanion which
was itself the true catalyst. BaileyS calculated the glyceride
composition of randomly rearranged fat or oil from the .molar
percentage~ of fatty acids present on the basis of probability.
Experil'11ental confirmation of the statistical composition resulting
from randomisation an equirnolar Inixture of tri stearin and
29 triolein has been reported . U sing silver ion thin layer
, 35 chromatography F reen'lan studied the changes in cOInposition
of glyceride during interesterification, He concluded that intra-
esterification, in which ester interchanges take place between
positions on the same n:JOlecule, occur red at a faster rate than
the overall randomisation \vhich include interesterification.
36 Padley and Fincke studied the changes in vegetable oils
and fats in terms of glyceride carbon number m.easured by gas
liquid chromatography. They reported that significant deviations
£1'01'11 the unmodified 1,3- randoln 2- random COITlposition were
observed for fats containing appreciable levels of 16: 0 acid but
significant difference s were not observed between the natural and
iute re sterifled fats when the se contained littie' or no 16: 0 acid.
This illustrates both the advantages and the limitations of the gas
liquid chromatography technique.
Analytical l1'lethods for checking that i:::1tCl'ester.i.fication has
2 0 37 gone to co.mpletion have been :reported in a number of reviews /,
14
such as melting point dcte:n:nination, solid fat content curve,
d 'ff '1 l' 30 1 . erentla coo lng curve and differential scanning
. 40,41 calonm.etry have been used to detect changes effected by
intere ste rification,
Pancreatic lipolysis IS tedious and time-consuming but it
gives conclusive and inforrnati.ve results. On cornplete random-
isatiol1., the fatty acid composition of the 2-position is the same as
that of the whole fat both before and after interesterificatiol1.. It
is known 38 that most of the 16:0 acid in lard is attached at the
2-position but after ra.ndomisation29
the content of 16:0 acid in the
2-position and the total randomised fats are identical.
In this study we have used lipolysis as a standa:;:d technique
to ascertain that interesterification of palm oil, palm fractions
and palm oil mixed with other oils, is complete. 39
List et al
applied a sin1ilar method for the intere sterification of mixture s of
soybean oil and soybean stearine. T he change s in the component
glycerides as a result of interesterification may be determined by
the silver ion thin layer chromatography- technique using 17: 0 ester
as an internal standa rd.
Random Interesterification of fats and oils, resulting in changed
melting and c rystalli sation characteri stic s, has been used to
produce shortenings, margarines a11d confectionary fats.
Glyceride rearrangenlent was reported as early as in the
2B 1920 1 s when a srnall arnount of soap wa s ac cid entall y 1 eft in oil
15
which wa s being deodar! sed. . 31,42,44,45
Lard shortening is
characterised by very coarse or gralny crystals attributed to
a relatively high propo]:tion of 16:0 acid at the 2-position of
monounsaturated glycerides. Randonlisation which reduces the
content of glycerides with. ] 6:0 acid in the middle position improves
the plastic range.
Random interesterification is an irnportant process for
rnargarine production. 46
Babayan ,£01' exarnple, subjected a
mixture of hydrogenated coconut oil, cottonseed stearin and
triglyceride of lower mixed fatty acids to random rearrangement.
Similar methods of obtaining rnargarine from different blends of
47-56 oUs and fats have also been reported . Randomisation has
also been used to produce cocoa butter substitutes for confectionary
fats. This is important because of the high price of cocoa butter.
Palm kernel oil (melting point 30 0 C), for instance, when parti.ally
hydrogenated results in a fat containing 3. sizeable fraction which
remains solid and waxy taste at body temperature. Inter-
esterification removes the.high melting fractions without signiHcantly
reducing the solid content at room tClnperature. Thus by blending
hydrogenated palm kernel oil and its random.ised product in various
29 proportions a whole range of hard butters with highly desirable.
1 1.57 m.e ting qu.alities are obtained. It has iJeen reported that a palm
olein with good stability at SoC can be obtained by a combination of
random. interesterification and fractionation. The Hquid fraction
can be a potential sou rc e of salad oil. The accompanying solid
fraction contains tripalmitin ( > 90%).
16
Nutritional Evaluation of Interet;terifi'~d Fats and Oils
~';8 Roslyn et ~l showed that intere sterified fats with a high level
of 18:2 acid were as digestible by' rats as the liquid native oil.
Biological assessm,ent, based on growth, reproduction, lactation
and tissue exan'lination, revealed that the' illterest~ri£ied fats
studied were utilised by the animal, to a degree comparable
. h d '1 lId b . d 59 l' h h . W1t cottonsee 01. t 'la een reporte ear ler t at t ere IS
no ~is_ t!-~'.E~ isomerisation and practically no conjugation could be
detected by uv/ir when soybean oil is interestel'ified with methyl
oleate or triolein with various catalysts under different reaction
conditions; but polymerisation occurs when the reaction is ?1500C.
39 List et al prepared I zero ' .!!-.:..an~ n'largarine by interesterifying
soybean oil and fully hydrogenated soybean fat. The organoleptic
evaluation of the randomised product showed no adverse effect on
flavour or oxidative stability. X-Ray diffraction indicated that
the randomised blend possesses the pI-crystal structure desirable
for use in margarine production. Nor does glyceride rearrange-
60 ment affect the oxidative stability of the product. Changes in
stability are as sociated with the los s of natural antioxidant,
tocopherol.
17
Re suIts and Di scu s sion
Pahn oil, palnl olein, pahn mid··fraction, sunflower seed oil and
mixtures (1: 1, w/w) of palm oil with palm kernel oil and sunflower
seed oil have been subjected to interesteri£i.cation by the procedure
outlined i.n the Experimental Section p. 139.
Materials to be interesterified were purified by column
chromatography on silica gel to remove free fatty acid and heated
on a steam bath over nitrogen to relDove trac es of moisture since
the presence of those impurities slows down the reaction.
The rearrangement process is usually catalysed to speed the
reaction and reduce temperature requirements. Generally,
. 28 intere ste rifi.cation catal yst s can be grouped into two type s
high and low temperature catalysts. Sodium methoxide (0.2%,
w/w) has been used in this study as a low temperature rearrangement
catalyst which is perhaps the most widely employed in industry.
The possible rnechanisms of interesterification using sodium
methoxide as a catalyst will also be discussed.
The process and products of interesterification can be examined
by (i) following colour changes as· the reaction progresses;
(ii) changes i.n melting point; (iii) dil&tometry changes in solid fat
content; (iv) GLC of triglycerides - changes in the GLC profile
which indicate alterations in the glyceride composition; (v) silver
29 ion thin layer chromatography; and (iv) rnass spectronletry
Table 4. Fatty Acid Composition of Whole Triglyceride and of Fatty Acid at the 2-position
and Ratio of each Fatty Acid at the 2-position
Fatty Acid Composition (o/c ·mo1e) 12:0 14:0 16:0 18: 0 18: 1 18:2 18: 3
I Ila Palm oil triglyceride (a) I 0.93 43.95 3.55 41.12. 10.22 0.23
2-Monog1yceride (b) I 0.36 13.53 0.70 65.97 19.13 0.31
Ratio (b)j(a)I 0.39 0.31 0.20 1. 60 1. 87 1. 35
lb IE-PO 0.92 44.56 3.91 40.93 9.36 0.32 2-MG 0.88 44.92 4.38 39.56 9.74 0.52 Ratio 0.96 1. 01 1. 12 0.97 1.04 1. 63
2a Palm. olein fraction 0.31 1.17 39.81 4.96 41. 64 11.58 0.53 2-MG 0.85 1. 34 16.39 3.58 58.96 18.37 o ~> . ..,.)
Ratio I 2.74 1. 15 0.41 0.72 1. 42 1. 59 1. 00 I-'
Q")
2b IE-P.o.£. 0.30 1. 24 39.98 4:.81 42. 15 10.82 0.70 2-MG 0.47 1.42 40.93 4.15 41.2..6 11.24 OA53
I Ratio 1. 57 1. 15 1. 02 0.86 0.98 1. 04 0.76
I 3a Palm mid-fraction O. 13 1. 04 48.85 5.77 34.80 9.03 0.38 , 2-MG 0.22 0.77 18.4:9 2.11 59.43 18.53. 0.45
I Ratio 1. 69 0.74 0.38 0.37 1. 71 2.05 1. 18
13b IE-P.m.f Tr 1. 05 48.91 5. 31 35.29 9.08 0.36
I 2-MG 0.16 1. 23 48.34 6,59 33.97 9.09 0.62 Ratio 1. 17 0.99 . 1.24 0.96 1.00 1.72
4a Sunflower seed oil 0.08 6.18 3.86 28.]0 60.74 0.44 2-MG 0.04 0.52 0.36 26.55 72.16 0.36 Ratio 0.50 0.08 0.09 0.93 1. 19 0.82
4b IE-SFO 0.08 6. 71 4.02 29.97 58.62 0.60 2-MG 0.10 7.16 4.22 28.66 59.32 0.54 Ratio 1.25 1.07 1. 05 0.96 1. 01 0.90
5a Palm oil/palm kernel oil (1: 1 f:< 19.80 8.82 29.55 3.9~ 28.62 6.65 0 • .58
2-MG 17.77 8. 12 10.45 1. 09 47.99 13.58 0.28 Ratio .0.90 0.92 0,35 0.28 1. 68 2.04: 0.74
,t.. I-' '>'
5b I-PO/PKO (1:1) 19.65 8.83 28.90 3.90 29.59 6.65 0.25 --.D
2-MG 19.59 8.95 30.18 4:.10 29.27 ,6.60 0.29 Ratio 1. 00 1. 01 1. 04 1.05 0.99 0.99 L 16
6a Palm oil/ sunflower . oil (1:1) 0.48 24.91 4.22 35.15 34.67 0.57
2-MG 0.28 8.97 0.74 4: 6. 30 <1.:$,22 0.4:9 Ratio 0.58 0.36 0.18 1. 32 1.25 0.86
6b IE-PO /$FO (1: 1) 0.53 25.64 4.14 34. 91 34.24 0.54 2-MG 0.58 26.52 4.30 34.63 3j.:57 0.60 Ratio 1. 09 1. 03 1. 04 0.99 0.97 1. 11
::!<
also (4a) before IE 8:0 (0.89, 0.50, O. 56); 10:0 (1.33,0.22,0.17)
(4b) after IE 8:0 (0.90, 0.46, O. 51); 10:0 (1. 33, O. 56, 0.42)
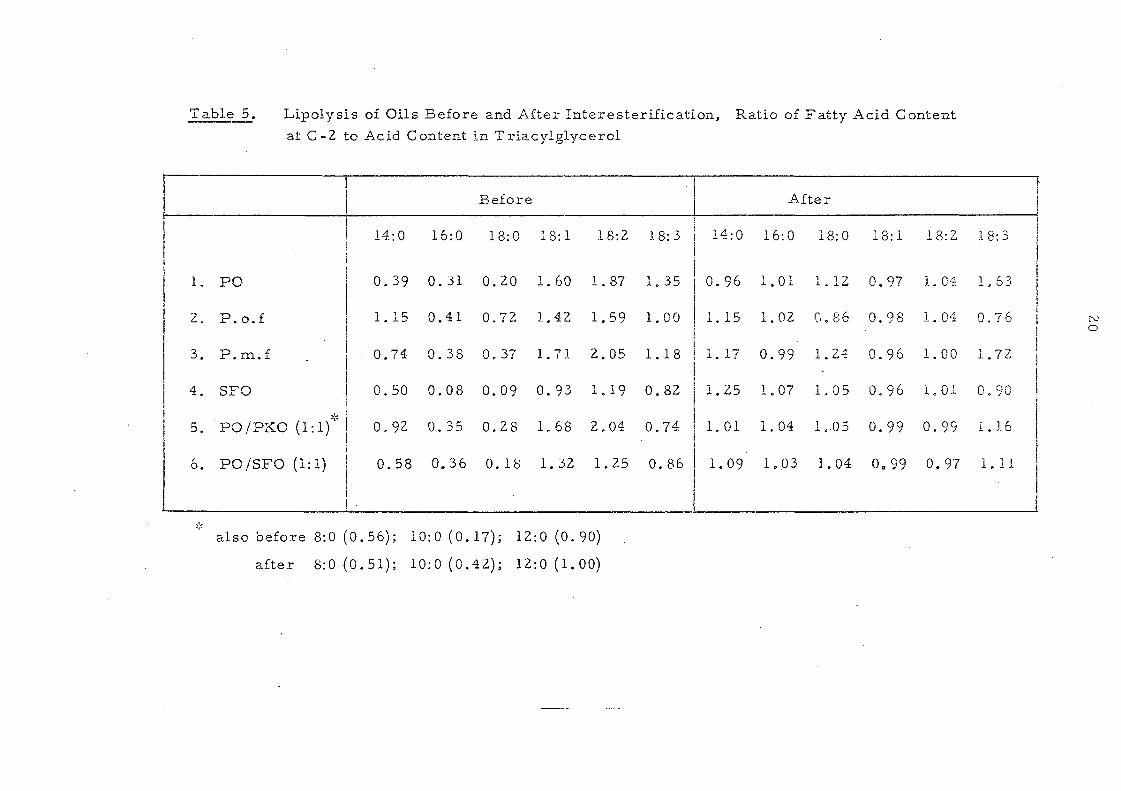
Table 5. Lipolysis of Oils Before and After Interesterification, Ratio of Fatty Acid Content
at C -2 to Acid Content in T riacylg1ycero1
I ~-- ------ Belore -I After r
I 14,0 16,0 18,0 IS,1 18,2 18,3 I 14,0 16,0 18,0 IS,1 18,2 IS,3 1
I i
1. PO 0.39 0.31 0.20 1.60 1.87 1.35 0.96 1.01 1.12 0.97 1.04 1,63 I !
2. P.o.f 1.15 0.41 0.72 1.42 1.59 1.00 1.15 1.02 C.1-36 0.98 1.04 0.76 i I
3. P.rn.f 0.74 0.38 0.37 1.71 2.05 1.18 1.17 0.99 1.24 0.96 1.00 1.72 I
4. SFO I 0.50 0.08 0.09 0.93 1.19 0.82 1.25 1. 07 1. 05 0.96 1. 01 o ~." & '1v
r-PO/PKO (l:lt I 0.92 0.35 0.28 1. 68 2.04 0.74 1. 01 1. 04 1.05 0.99 0.99 1. 16 :J.
6. PO/SFO (1:1) I 0.58 0.36 O. 18 1. ..:$2 1. 25 0.86 1. 09 1.03 1.04 0 0 99 0.97 1.11
I ::!{
also before 8:0 (0.56); 10:0 (0.17); 12:0 (0.90)
after 8: 0 (0. 51); 10:0 (0.42); 12:0 (1. 00)
N o
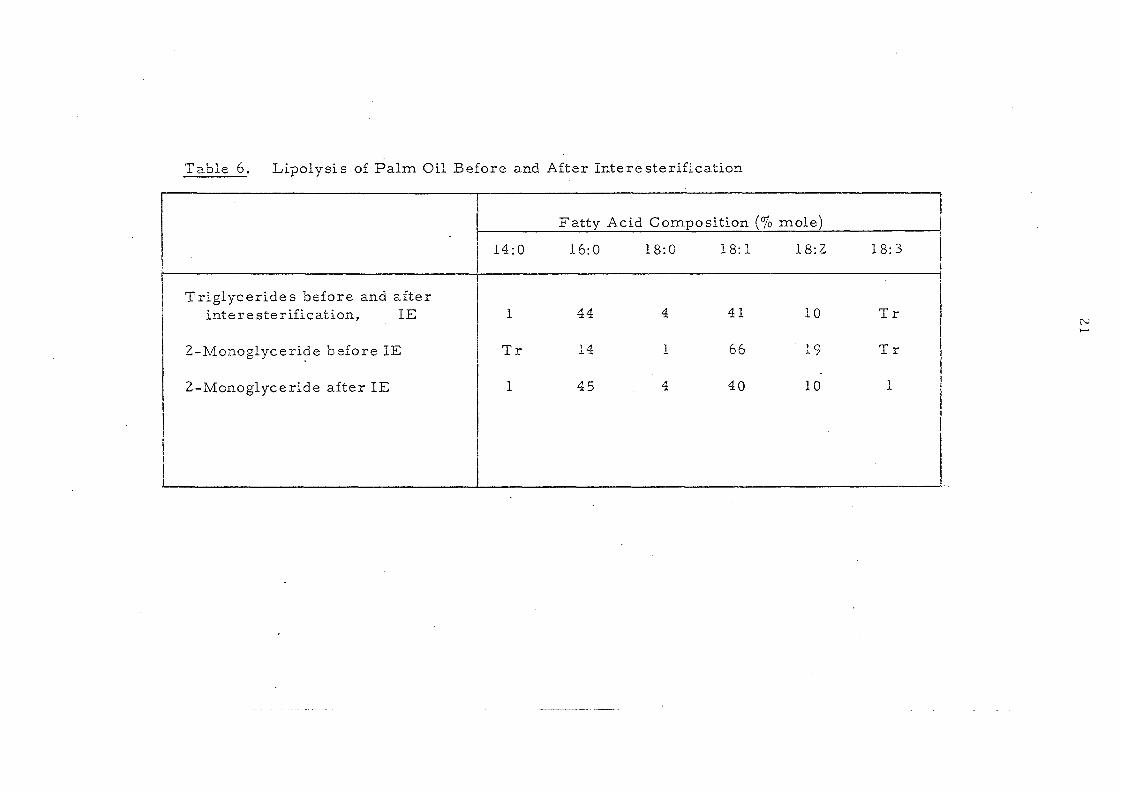
Table 6. Lipolysis of Palm Oil Before and After Interesterification
Fatty Acid Composition (0/0 molel
14:0 16:0 18:0 18: 1 18:2 18: 3
Triglycerides before and after intere steriiication, IE 1 44 4 41 10 Tr
N ......
2-Mo:J.oglyceride before IE Tr 14 1 66 19 Tr
2-Monoglyceride after IE 1 45 4 40 10 1
We have exploited the fact that intel'PsteTification is
accornpanied by rnovernent toward s a randorn di stribution of ac y1
groups which can be followed by lipoi y si s. Pancreatic lipase is
known to hydrolyse specifically the fatty acids attached to the
two p:drnary hydroxyl groups of glycerol and liberates 2-mono-
glyceri.des from the trigJ.ycel~ides. Changes in glyceride composition
occurring duri.ng intereEterification are n10st conveniently expressed
in the ratio:-
__ C ont Cl~.L2L~_a tt'y'_acL.cLin._~-mon2.ElYc c!id e s _____ _ Content of the same acid in the whole triglycerides
as shown in Table 4.
It is weH known that in the natural fats these ratios, which
are also referred to as !Enrichrnent Factor,61 vary considerably.
In seed oils acids such as oleic and linoleic show a value > 1.0
indicating that the se acids are concentrated in the 2-position.
Acids such as palmitic and stearic have value considerably < 1. 0
showing that these acids are to be found mainl~ at positions 1
61, 62 ( and/or 3 . Sorne short-chain acids lauric and m.y:ristic) give
value around 1.0. Thif3 is apparent in the figures collated in
Table 5.
After interesterification these ratios have values of 1.00 ± 0.04
(except for SOlne m.inor components v;"here experimental error leads
to a greater variation) and this is also shown in Table 5. The change
on intercsterification is also appar~nt in Table 6 which shows the
results obtained for palm oil. The 2-·nl.Onoglyceride from
interestel'ified oil. is very different fron: that produced from the
original paIn! oil but very sirnUar to the original palm oU triglycerides.
Z " .)
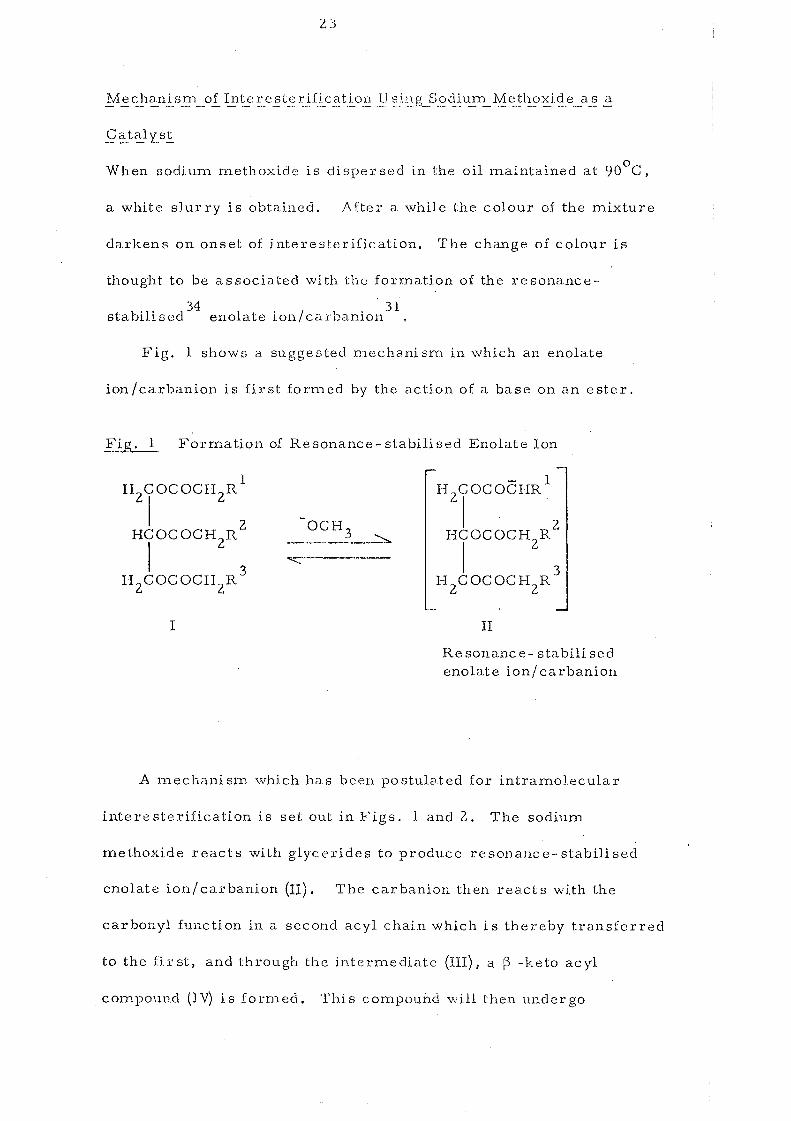
When sodium methoxide is dispersed in the oil maintained at 900C,
a white slurry is obtained. After a while the colour of the mixture
darkens on onset of interesterification. The change of colour is
thought to be associated with the formation or the resonance-
., 34 " .. 31 stablhsed enolate lon/cal'banlOn .
Fig. 1 shows a sugge sted xnechani SHl in which an enolate
ion/carbanion is first fornled by the action of a base on an ester.
Fi~ Formation of Resonance- stabilised Enolate Ion
~----
I
HZCOCOCHR 1
I 'z HfoCOCHZR3
HZCOCOCHZR
II
Resonance- stabilised enolate ion/ carbanion
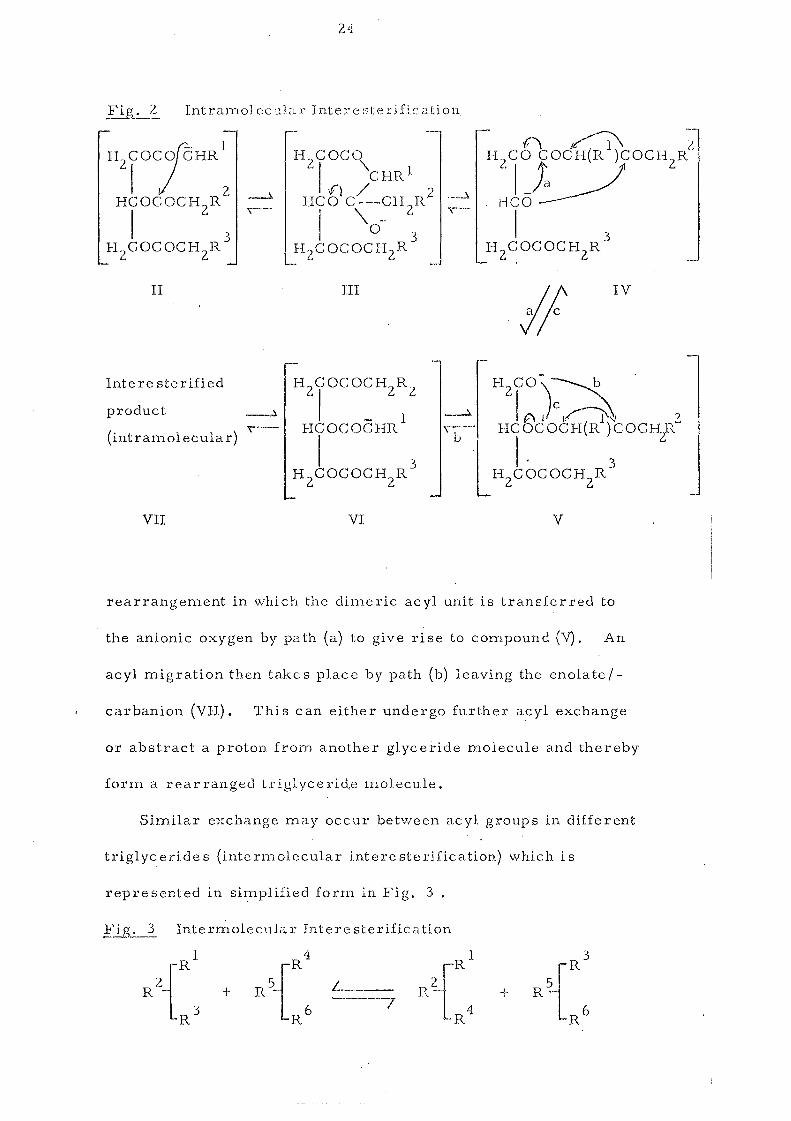
A nlechanisn'l which has been postulated for intramolecular
interesterification is set out in Figs. 1 and 2. The sodium
methoxide reacts with glycerides to produce resonance- stabilised
enolate ion/ carbanion (II). The carbanion then reacts wi.th the
carbonyl function in a second acyl chain which is thereby transferred
to the first, and through the intermediate (III), a. ~ -keto acyl
compound (IV) is formed. This compound will then undergo
Z4
Int rarnol ec :.~la r Inter (:; st e r Hie a ti on
II
lntere stcrified
product ~
(intramolecular)
VII
III
HZCOCOCHZR Z
I - 1 HCOCOCHR
I 3 HZCOCOCHZR
VI V
rearrangement in which the dilneric acyl unit is transferred to
the anionic oxygen by path (a) to give rise to compound (V). An
acyl migration then takes place by path (b) leaving the enolate/-
carbanion (VII). This can either undergo further acyl exchange
or abstract a proton from another glyceride molecule and thereby
form a rearranged triglycerid,c lnolecule.
Similar exchange may occur between acyl groups in different
trigl yc eride s (inte rnl.olecular intere ste rHication) which is
represented in simplified forn1 in Fig. 3 .
.ElK: 3 Intermolecular Intere sterification
+ +
25
Three standard techl1iqv.es of i.nvestigating COITlponE;nt glycerides
- Ag +TLG, lipolysis, and GLG have been applied to fats and fat
mixtures before and after interesi,erification.
Silver ion chromatography separates triacylglycerols according
to their degree of unsaturation. The separations depend U.pon
the ability of unsaturated compounds to fonn coordination complexes
63 with silver ion . The eluti.on sequence established by Gunstone and
64 Padley J. is assumed to hold. This sequence can be predicted if
each fatty acid is assigned a. cornplexing power as follows,
saturated::: 0, nlOnoen~ ;:: I, diene ::: 2 + a, and triene ::: 4. + 4a with
a < 1. The total complexing power (P) for a triacylglycerol is
calculated by summing the value s for the individual fatty acid s.
For example, it can be predicted that 011 glycerides with P=2
will run above 002 glycerides with p.::2+a. It can be generalised
that double bonds that are closer to the methyl-terminal end of the
fatty acids have 3. greater complexing power than double bonds that
are farther from the end. In addition, there is a stronger
interaction between silver ions and cis-double bonds than between
silver ions and trans-double bonds.
It should be noted that separated bands of glycerides are
seldom com.pletely pure and must be calculated as appropriate
mixtures. Also the acyl chains can only be categorised according
to the number of double bonds they contain so that all saturated
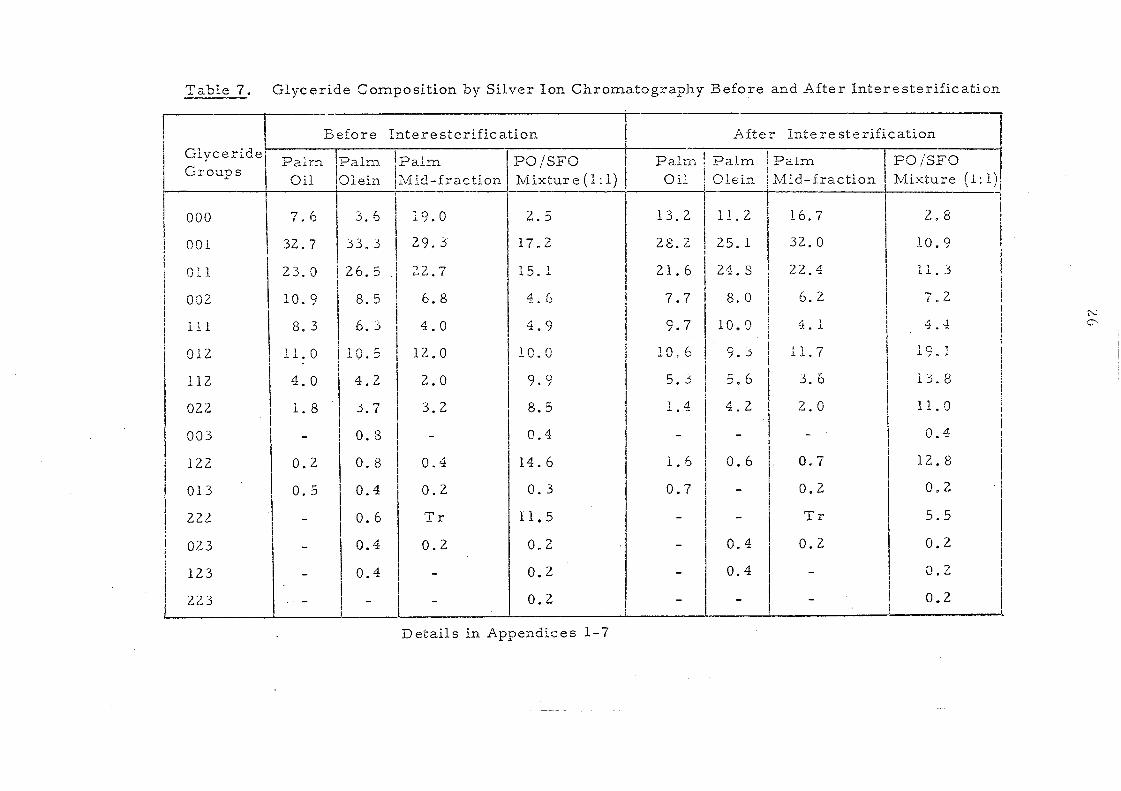
Table 7. Glyceride Composition by Silver Ion Chromatography Before and After Interesterification
Glyceride Groups
000
001
011
002
111
012
112
022
003
122
013
222
023
123
223
Before Interesterification
Palm II,palm. Oil Olein
7.6
32,7
23.0
10.9
8.3
11. 0
4.0
1.8
0.2
0.5
3. 6
33.3
I 26.5 I
'I 8.5 6.3
I
110.5
I 4.2
3.7
0.8
0.8
0.4
0.6
0.4
IPal:n ! PO /SFO IMid-fraction I Mixture (1: 1)
I I I 19.0 I 2.5
129.3 117.2 1 I ., 2 7 I ~. . I 6.8
I 4.0
I I
12.0
2.0
3.2
0.4
0.2
Tr
0.2
15. 1
4. ()
4 Q . /
10.0
9.9
8.5
0.4
14.6
O. 3
0.4 I
Il.5
0.2
0.2
0.2 I I
Details in Appendices 1-7
After lnte re sterification I Pah"n. ! Palm Oil I Olein
13.2
28.2 !
21. 6
7.7
9.7
10.6
5.3
1.4
1.6
0.7
i I I
I I !
I
11. 2
25.1
24.8
8. 0
10.0
9.3
5.6
4.2
0.6
0.4
0.4
I Palm ! PO iS~ I Mid-fraction I Mixtu.:...~ I I I
16.7
32.0
22.4
6.2
<1. 1
11.7
3. 0
2.0
0.7
0.2
Tr
0.2
2.8 ! 10.9 I 11. j
7.2
4.4
1 Q 1 ..J.. " ~ .....
1 J. 8
11.0
0.4
12.8
0.2
5.5
0.2
0.2
0.2
I I
I ! i I
i i
~
C'
27
FIG.4
SILVER ION CHROMATOGRAPHY 30
PALM OIL
M D before IE
o after IE
L 20
E
10
000 001 011 002 111 012 112 022
COM P 0 N E N T G Lye E RID E S
28
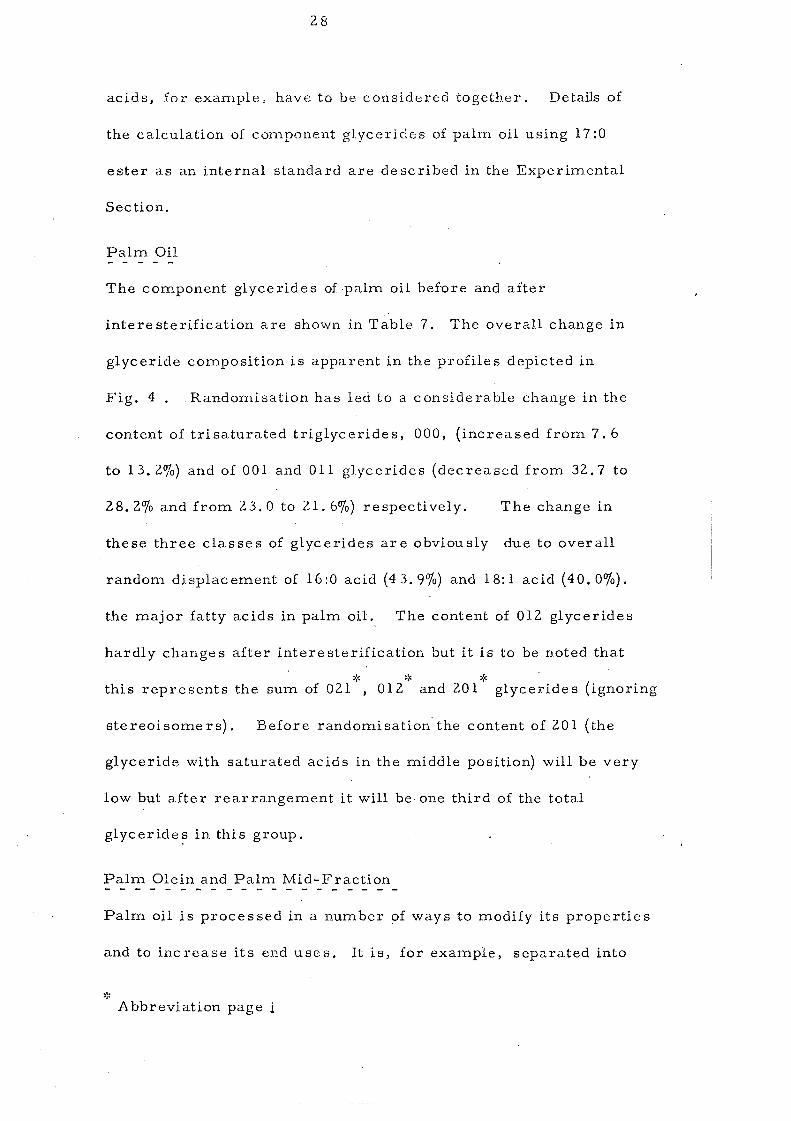
acids, for example, have to be considered together. Details of
the calculation of component glycerides of palm oil using 17:0
ester as an internal standard are described in the Experimental
Section.
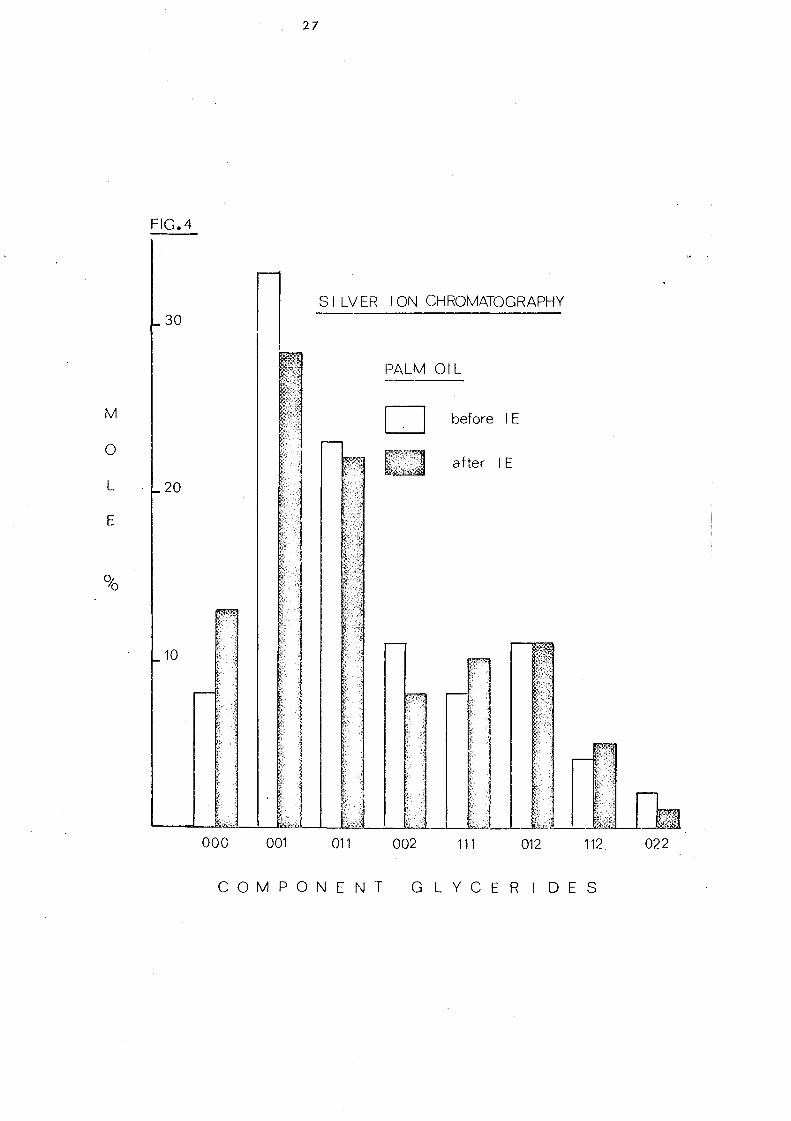
Palm Oil
The component glycerides of -palm oil before and after
interesterification are shown in Table 7. The overall change in
glyceride composition is apparent in the profiles depicted in
Fig. 4. Randomisation has led to a considerable change in the
content of trisaturated triglycerides, 000, (increased from 7.6
to 13.2%) and of 001 and 011 glycerides (decreased from 32.7 to
28.2% and from 23.0 to 21.6%) respectively. The change in
these three classes of glycerides are obviously due to overall
random_ displacement of 16:0 acid (43.9%) and 18:1 acid (40.0%).
the major fatty acids in palm oiL The content of 012 glycerides
hardly changes after interesterification but it is to be noted that
)~}l< ~::
this represents the sum of 021 , 012 and 201 glycerides (ignoring
stereoisomers). Before randomisation- the content of 201 (the
glyceride with saturated acids in the middle position) will be very
low but after rearrangement it will be one third of the total
glyceride~ in this group.
Palm Olein and Palm Mid-Fraction
Palm oil is processed in a number of ways to modify its properties
and to inc rease its end use s. It is, for example, separated into
A bbreviation page i
M
o
L
E
( ~)
FIG. 5
30
20 .
-10
29
SILVER ION CHROMATOGRAPHY
PALM OLEIN
D .before interesterific.ation (I E)
after' IE
000 001 011 002 111 012 112 022
COM P 0 N E NT GLYCER I DES
30
solid and liquid fractions termed stearin and olein respectively.
Either of these fractions may be further separated to give modified
stearin or olein and a second portion referred to as the mid-fraction .
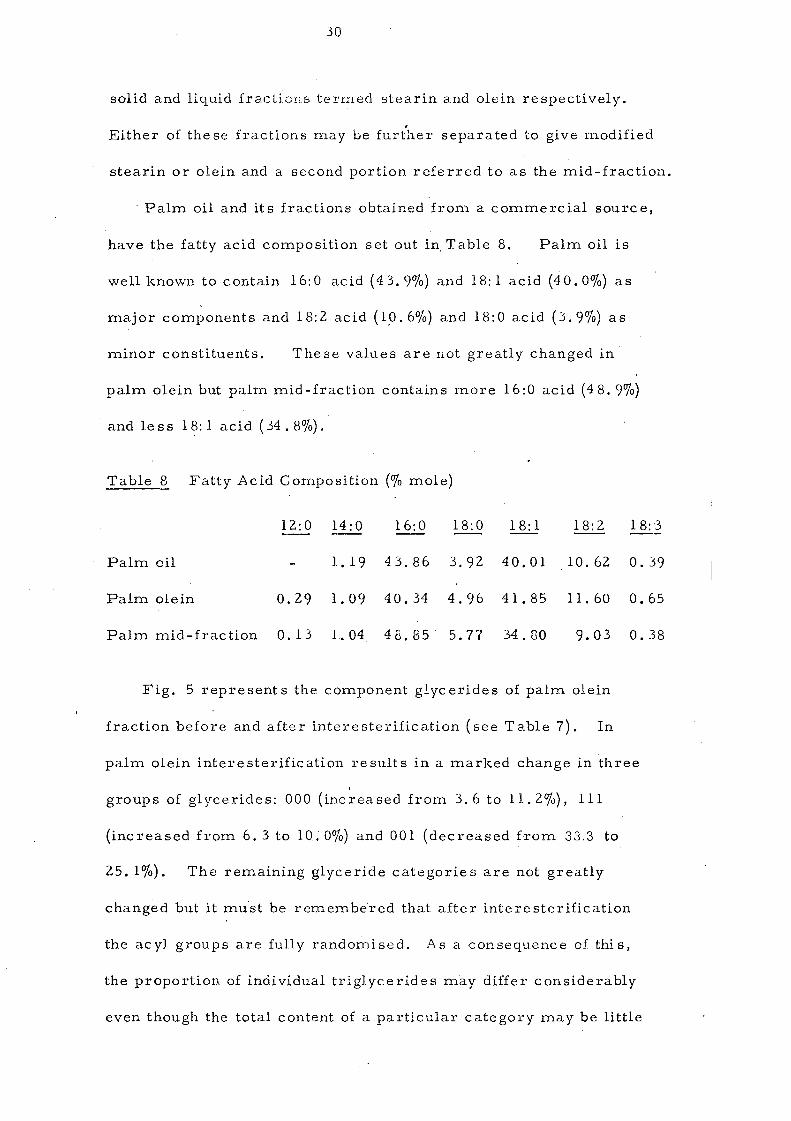
. Palm oil and it s fractions obtained fron~ a comme rcial sourc e,
have the fatty acid composition set out in Table 8. Palm oil is
well known to contain 16:0 acid (43.9%) and 18:1 acid (40.0%) as
major components and 18:2 acid (1,0.6%) and 18:0 acid (3.9%) as
minor constituents. These values are not greatly changed in
palm olein but palm mid-fraction contains more 16:0 acid (48.9%)
and Ie s s 18: 1 acid (34. 8%) .
Table 8 Fatty Acid Composition (% mole)
12:0 14:0 16:0 18:0 18:1 18:2 18:-3
Palm oil 1.19 43.86 3.92 40.01 10.62 0.39
Palm olein 0.291.0940.344.9641.8511.600.65
Pa1mmid-fraction 0.131..04 48.85 5.7~' 34.80 9.030.38
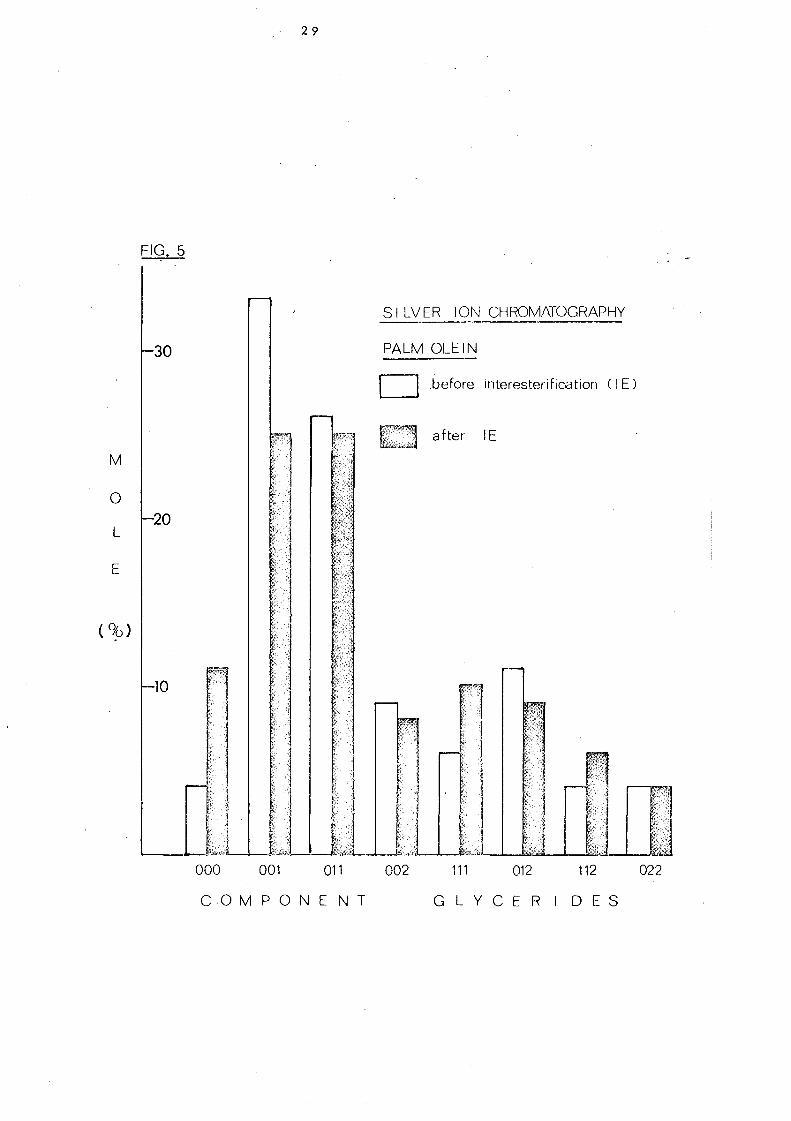
Fig. 5 represent s the component glyc eride s of palm olein
fraction before and afte r intere sterification (se e Table 7). In
palm olein interesterification results in a marked change in three
, groups of glycerides: 000 (increased from 3.6 to 11.2%), III
(increased from 6.3 to 10.0%) and 001 (decreased from 33.3 to
25. 1 %). The remaining glyceride categorie s are not greatly
changed but it mu'st be remembered that after interesterification
the ac yl groups are fully randomi sed. A s a c:onsequenc e of thi. s,
the proportion of individual triglycerides may differ considerably
even though the total content of a particular category may be little
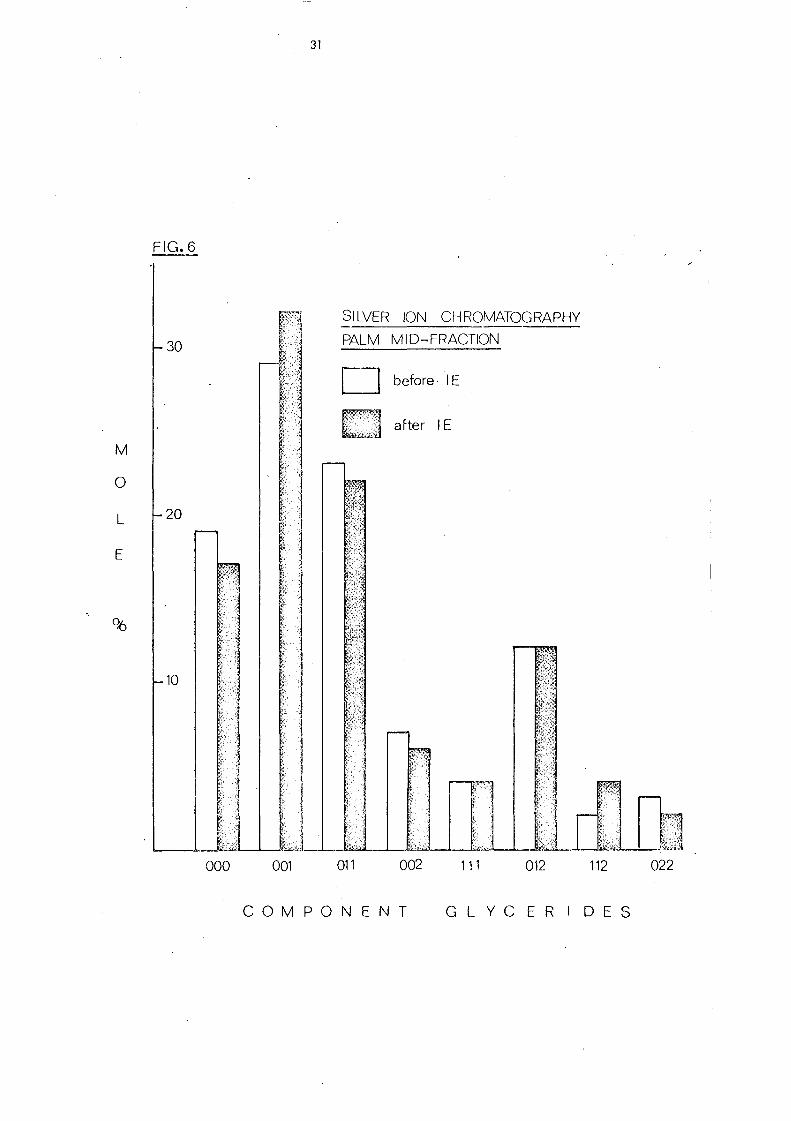
FIG.6
30
M
o
L
E
0-6
000
31
001
SILVER ION CHROMATOGRAPHY
PALM MID-FRACTION
D before IE
after IE
011 002 111 012 112
COMPONENT GLYCER DES
022
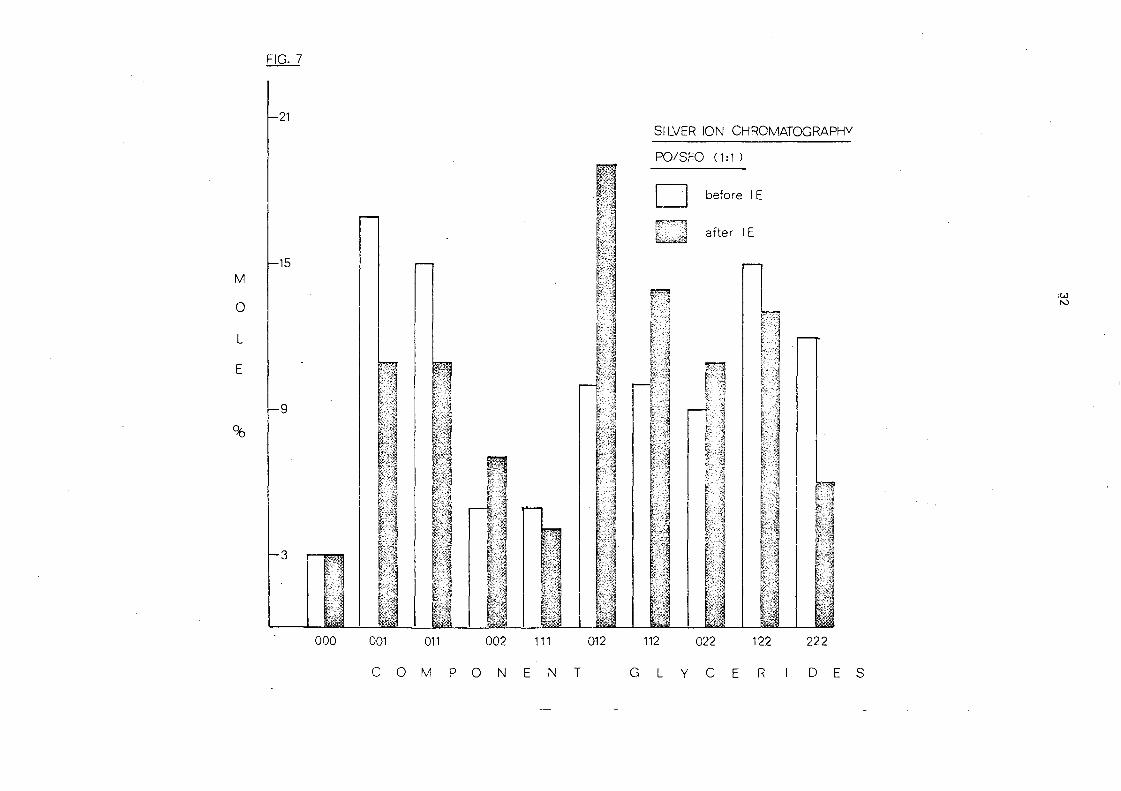
FIG. 7
21 81 LVER ION CHROMATOGRAPHY
PO/8FO (1:1)
D before IE
after IE
I I 15
M
I I I I ~ I I :W
0 l'V
L
E
~9 I
0-6
3
000 001 011 002 111 012 112 022 122 222
COM P 0 N E N T G Lye E R D E 8
33
changed. For example, the 011 (26.5%) in palm olein will
~< contain vr;.ry little 101 with saturated acyl group attached to the
2-position but after interesterificati.on the glyceride will constitute
one third of all the 011 glycerides.
The component gl yc eride s of palm mid-fraction before and
after interesterificati.on is repre sented in the hi stogram shown
in Fig. 6. There is little difference between several classes of
glycerides before and after randomisation but the content of each
com.ponent within one category may change considerably. There
* * will thus, for example, be more 010 and 110 before
interesterification but after rearrangement each glyceride will
constitute one third and two thirds respectively of the total
glyceride s of that particular group.
The component glycerides of this mixture before and after
interesterification are presented in Table 7. The overall change
in the triglycer ide group composition of the mixture caused by
randomisation is shown in Fig. 7.
B efo re inte 1'e sterification the mixture contains those glyc e ride s
which are characteristic of each component, viz. 001 and 0·11 frol;TI
palm oil and 012, 117.., 022, 122 and 222 from sunflower seed oil.
These are the results expected of oils rich in 16:0 (44.0%) and
18:1 (41.10/0) and 18:1 (28.7%) and 18:1 (60.7%) respectively (see
Table 4J.
* A bbreviation page i
34
After interesterification the randomised mixture is
produced. This contai.ns more of the 002, 012, 112 and 022
glyceride"s and less of the 001,011 and 222 glycerides.
Lipolysis has been used mainly in this study to che'ck th,e randomness
of fatty acid di stri bution in fats and oil s during intere sterification.
Interesterification is complete i. e. the distribution of fatty acids
is completely random, when the fatty acid composition of the
. 2-monoglyceride resulting after lipolysis is identical with that of
the whole triglyceride.
Lipolysis may also be employed to calculate glyc eride
composition by procedures suggested independently by Van der
65 66 67 Waal and by Goleman and Fulton and based on two assum.ptions
It is important not to lose sight of these assumptions. They are:
(1) the fatty acids attached to the 1- and 3-positions are the same
and (U) the fatty acids occupyi.ng the 1-, 2-. and 3-positions are
associated with each other in a random rnanner.
In addition lipolysis data are valid only as long as the enzymic
hydrolysis is controlled entirely by the positional specificity of the
acyl groups and not at all by their nature. Acyl groups attached
to the 2-position should be completely resistan:t to hydrolysis and
all those attached at the 1- and 3-positions should be hydrolysed at
the same rate independently of their structure. However, evidence
h h 6 9 -71 h f h .' f 'd (4 lOb as sown t at esters 0 s ort-cnaln attyacl s - car on
atoms) are hydrolysed faster than those of long-chain fatty acids
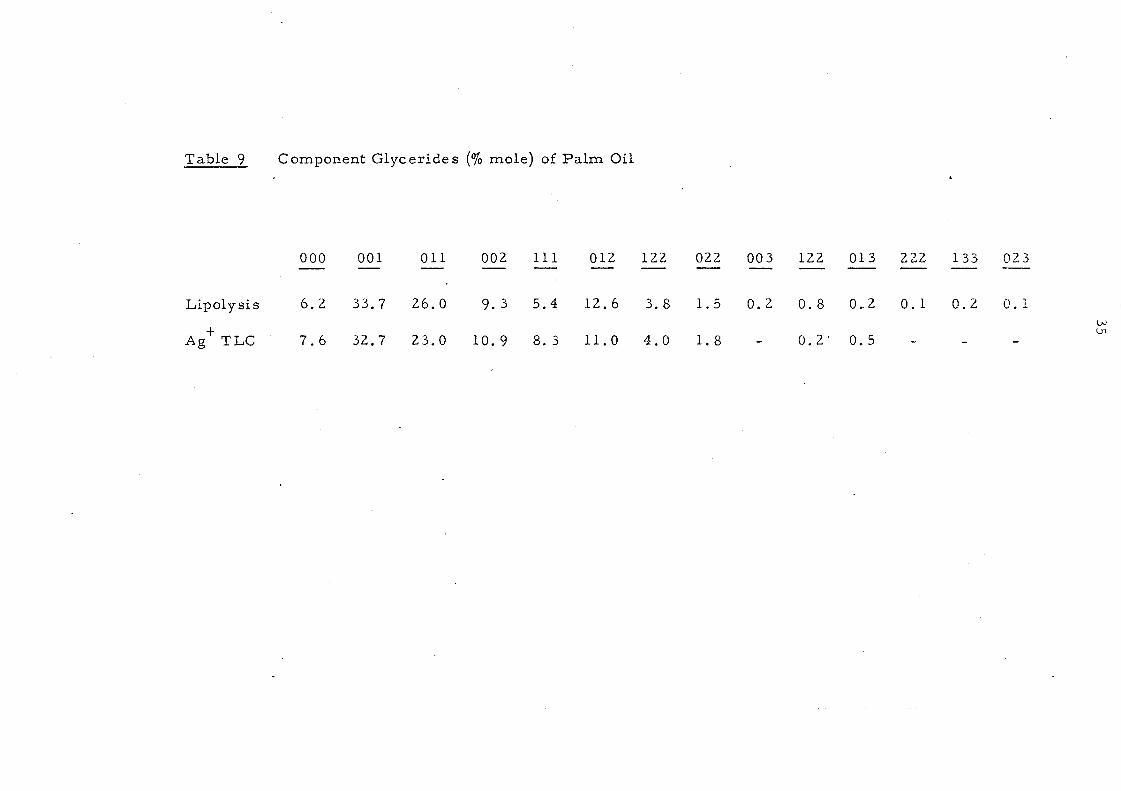
Table 9
Lipolysis
Ag+ TLC
Component Glycerides (% mole) of Palm Oil
000 001 011 002 111 012 122 022 003 122 013 222 133 023
6.2 33.7 26.0 9.3 5.4 12.6 3.8 1.5 0.2 0.8 0~2 0.1 0.2 0.1
7.6 32.7 23.0 10.9 8.3 11.0 4.0 1.8 0.2' 0.5 V-J U1
36
(12-18 carbon atoms), the latter having simila.r rate within this
72 group. It is also known that the rate of hydrolysis is slower
in oils wh'ich are rich in fatty acids (.6..4,5,6) having double bonds
nearer to the carboxyl groups. These fatty acids are found mainly
in fish oils.
, 61,73-79 The composition of a wide range of seed 011s have been
calculated froln lipolysis data and in general the results agree with
tho se obtained in othe r techni.que s, The method, however, is not
, f f ' f 1 '1 67,68 f appropnate or ractl0ns 0 na.tura 01 s . Such ractions
however they are obtained, are enriched in certain glycerides and
impoveri shed in other s. The experimental data are valid but the
assumptions which underlie the subsequent calculat ions no longer
hold and results obtained by Van der Waal calculation are
meaningle s s. This has not alwa ys been appreciated.
Table 9 shows the component glycerides of palm oil estimated
by this technique but expre ssed in the sarne form as results
obtained by silver ion chromatography. The details of calculations
are shown i.n the Experimental Section p.152 and Appendix 8, The
results seem to be in good agreement with those obtained by silver
ion chromatography. Some minor categorie s of glycerides (003,
222, 113 and 023) which show up in lipolysis results do not appear
at all in silver ion chromatography analysis. The use of lipolytic
data to calculate glyceride composition is confined to palm oil.
It has not been appli'ed to fractionated oils and mixed oils.
37
9.?-_s_ ~!g~~~ ~_l:1:~~~ ~r: ~=:: p~!:,
GLC separation of triglyTcerides depends on groBs differences in
molecular. weight. In this context it is convenient to refer to
triglyc er ide s by the total number of carbon atorn s in the three
fatty acid moieties which they contain. Thus palmitodiolein is
referred to as C 52 because the acyl chains are 16: 0, 18: 1 and
18: 1. Triglyceride carbon numbt:;rs do not distinguish between
saturated and unsaturated glycerides nor do they distinguish
positional and stereochemical isomers.
Low molecular \-veight mater ial eluted at the beginning of the
run is usually a sign of fragmentation of the triglyceride molecules
in the flash evaporator. A good elution pattern is characterised
by smooth and symmetrical peaks and by a complete return to the
baseline between peaks. The slight base line elevation is normally
due to the bleeding of the stationary phase. Deterioration of the
rubber ring and rubber septum(s) near one end of the column at the
injection port may also contribute to these problems.
Since non"-polar stationary phases (1% dexsil on 100/ 120
Supelc,oport ) are used in the GLC of glycerides, this technique
does not permit the separation'of triglycerides on the basis of
unsaturation alone. Oil s which c ontain mainly .C 18 fatty acid s
gi ve alar ge C 54 peak and their elution patterns are not very
informative.
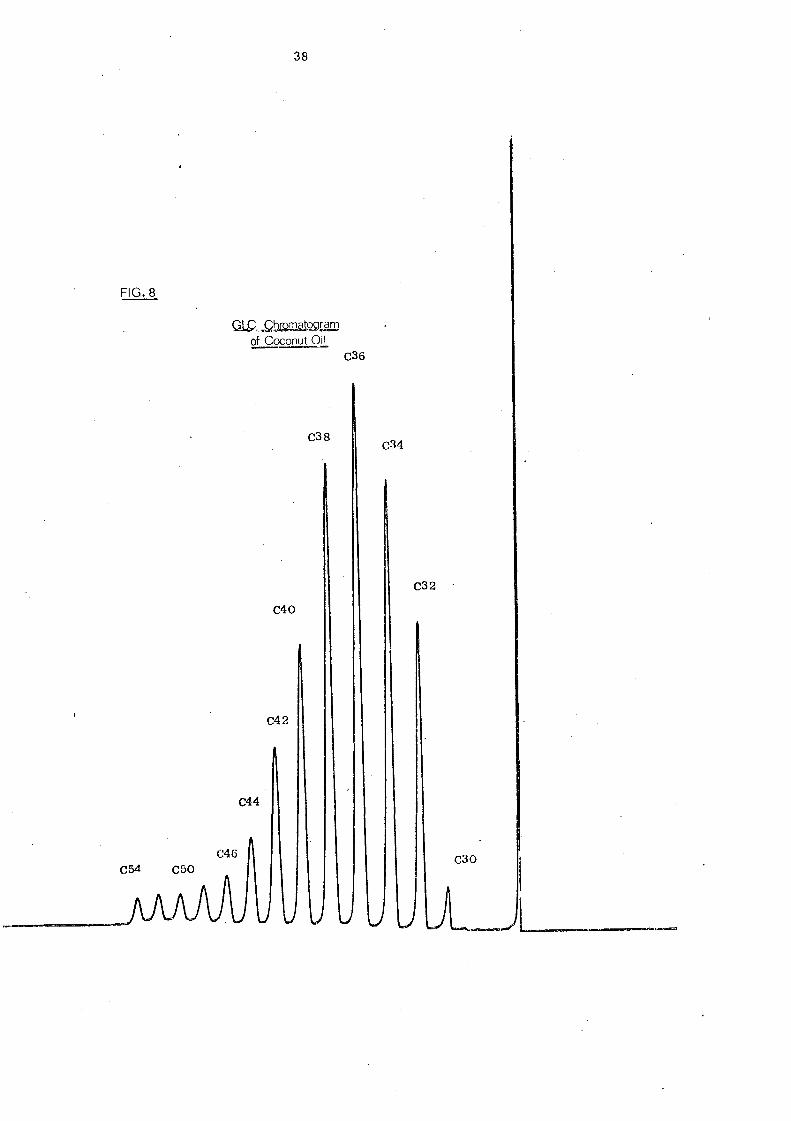
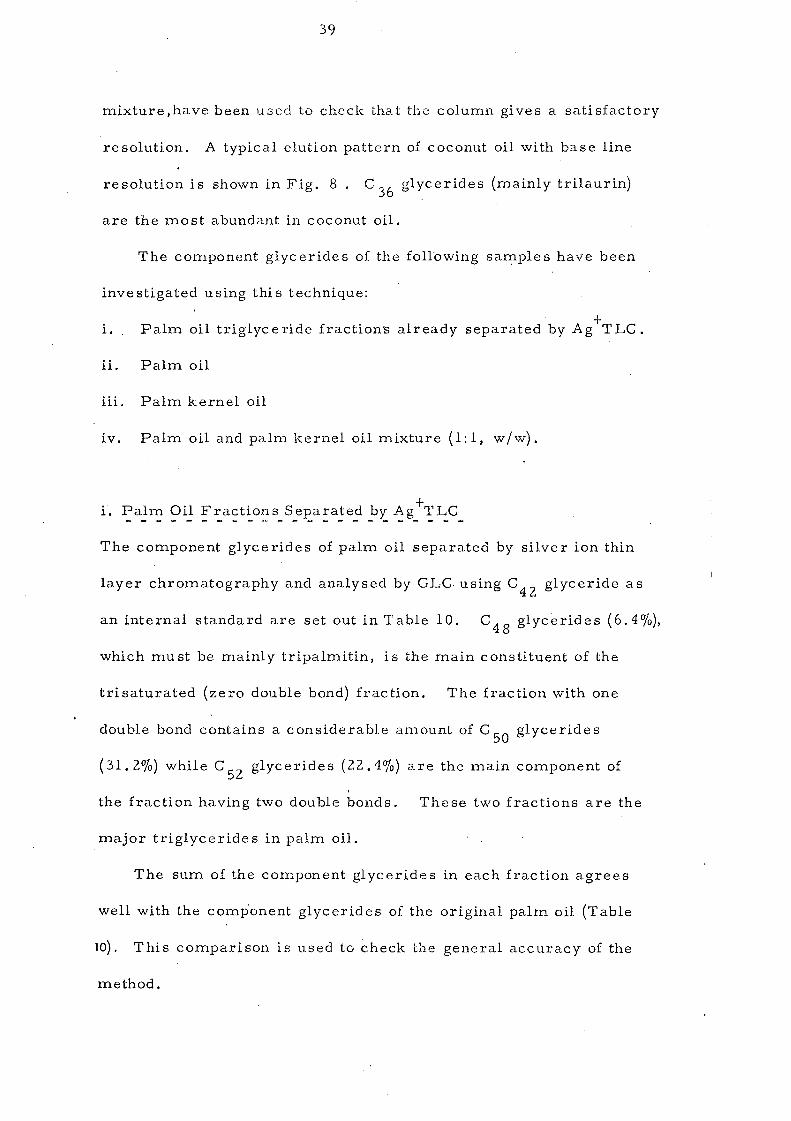
Coconut oil with its wider range of component glycerides
(C28
-C54
). along with a series of a known synthetic triglyceride
38
e38
e40
C42
e44
e54 e50
e36
e34
e32
C30
I L-,---
39
mixture,have been used to check that the column gives a satisfactory
resolution. A typical elution pattern of coconut oil with base line
resolution is shown in Fig. 8. C 36 glycerides (mainly trilaurin)
are the most abundant in coconut oil.
The component glycerides of the foHowing san:1ples have been
inve stigated using thi s technique:
i.
i1.
iii.
iv.
+ Palm oil triglyceride fraction'S already separated by Ag TLC.
Palm oil
Palm kernel oil
Palm oil and palm kernel oil mixture (1:1, w/w).
The component glycerides of palm oil separated by silver ion thin
layer chromatography and analysed by GLG using C42
glyceride as
an internal standard are set out in Table 10. C48
glycerides (6.4%),
which mu st be mainly tripalmitin, is the main constituent of the
trisaturated (zel'o double bond) fraction. The fraction with one
double bond contains a considerable amount of C 50 glycerides
(31.2%) while C52
glycerides (22.4%) are the main component of
the fraction having two double bonds. These two fractions are the
major triglyceride s in palm oil.
The sum of the component glycerides in each fraction agrees
well with the component glycerides of the original palm oil (Table
10). This comparison is used to check the general accuracy of the
method.
M
o L
E
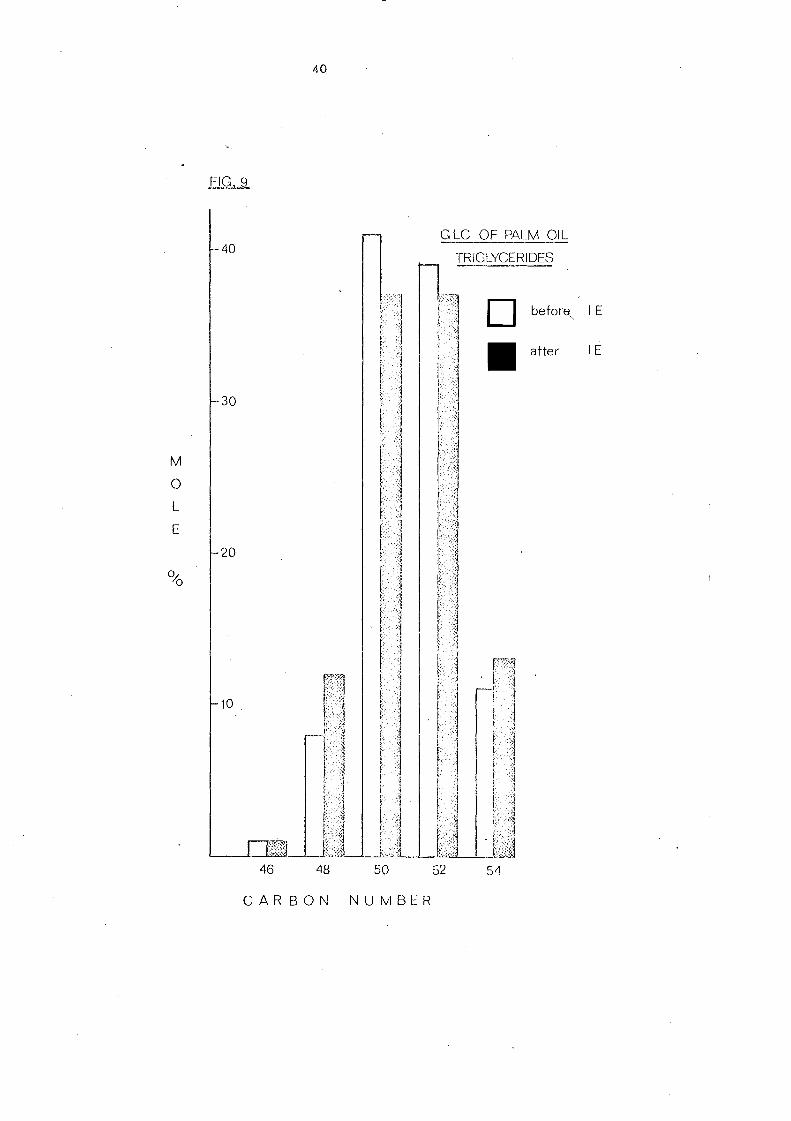
40
30
20
10 .
40
46 48 50
CARBON NUMBER
G LC OF PALM OIL
TRIGLYCERIDES
o before, IE
after IE
52 54
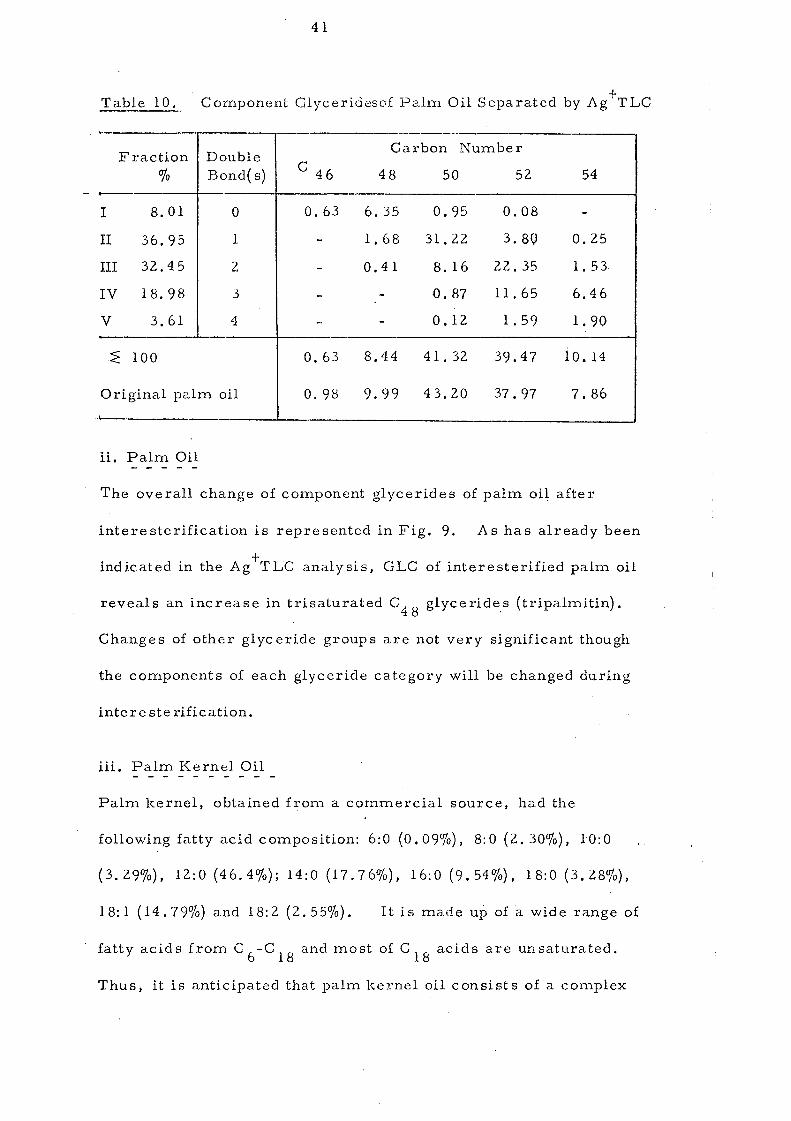
41
Table 10, Component Glycerideso£ Palm Oil Separated by Ag +TLC
- ---,
Fraction Double Carbon Number
% Bond( s) C 46 48 50 52 54
I 8.01 0 0.63 6.35 0.95 0.08 -
II 36.95 1 - 1. 68 31.22 3.80 0.25
III 32.45 2 - 0.41 8.16 22.35 1.53,
IV 18.98 3 - - 0.87 11.65 6.46
V 3.61 4 _. - 0.12 1. 59 1. 90 -.~ 100 0.63 8.44 41.32 39.47 10.14
Original palm oil 0.98 9.99 43.20 37.97 7.86 ,
ii. Palm Oil
The overall change of component glycerides of palm oil after
interesterification is represented in Fig. 9. As has already been
indicated in the Ag +TLC analysis, GLC of interesterified palm oil
reveals an increase in trisaturated C 48 glyce ride,s (tripalmitin).
Changes of other glyceride groups are not very significant though
the components of each glyceride category will be changed during
intere ste rification.
iii. Palm Kernel Oil
Palm kernel, obtained from a cornmercial source, had the
following fatty acid composition: 6:0 (0.09%), 8:0 (2.30%), 1'0:0
(3.29%),12:0 (46.4%); 14:0 (17.76%), 16:0 (9.54%),18:0 (3.28%),
18:1 (14.79%) and 18:2 (2.55%). It is made up of a wide range of
fatty acids from C6-C
18 and most of C
18 acids are unsaturated.
Thus, it is anticipated that palm kernel oil consists of a complex
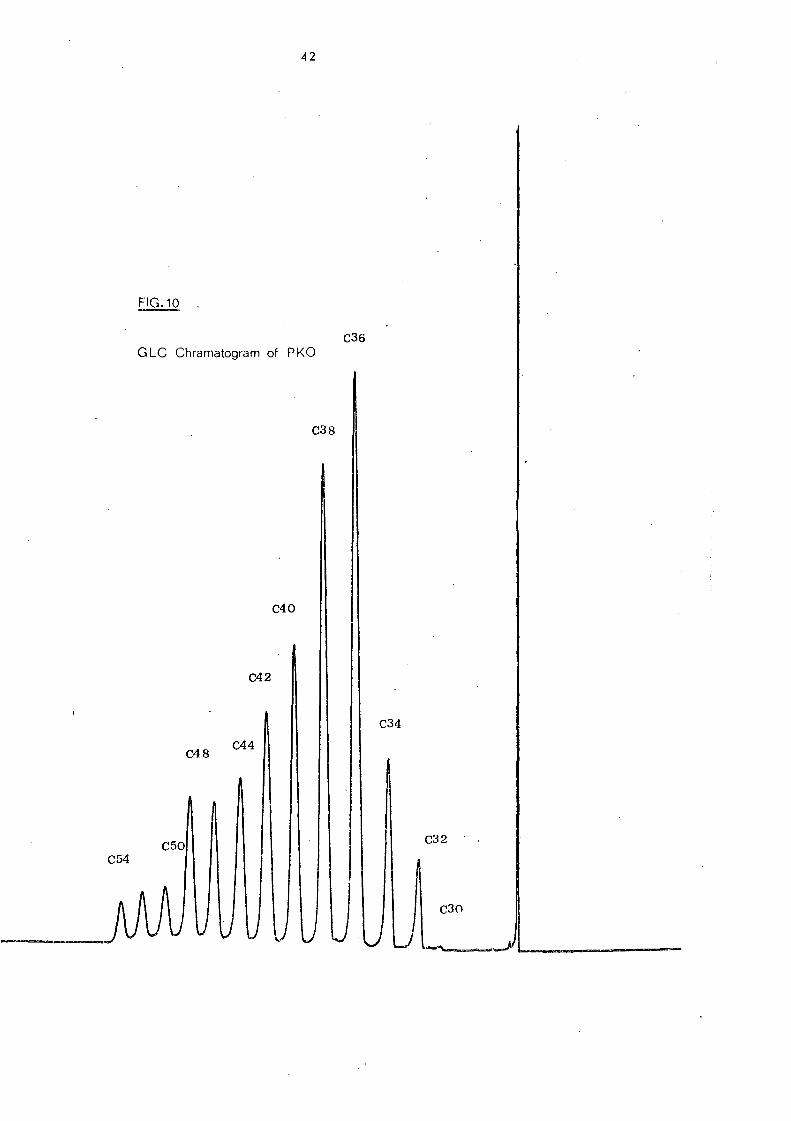
42
FIG.10
C36 GLC Chramatogram of PKO
e38
e40
e42
e34
C48 e44
e50 C32
e54
C30
43
mixture of glycerides.
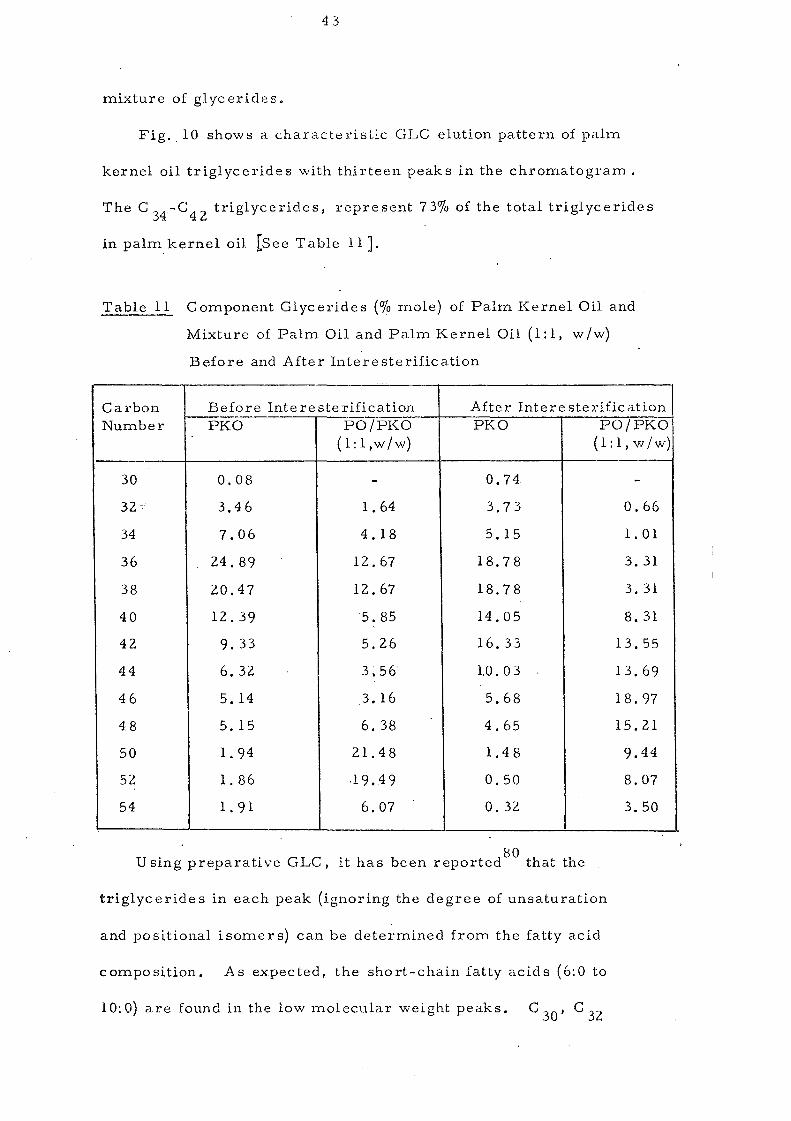
Fig. 10 shows a characteristic GLC elution pattern of palm
kernel oil triglycerides with thirteen peaks in the chromatogram.
The C 34-C42 triglycerides, represent 73% of the total triglycerides
in pa1mkernel oil [See Table 11 J.
Table 11 Component Glycerides (% mole) of Palm Kernel Oil and
Mixture of Palm Oil and Palm Kernel Oil (1:1, w/w)
Before and After lnteresterification
Carbon Before lnte re ste rification After Intere sterification Number -PKO PO/PKO PKO PO/PKO
(l:l,w/w) (l:l,w/w) --
30 0.08 - 0.74 -32= 3,46 1.64 3.73 0.66
34 7.06 4.18 5.15 1. 01
36 24.89 12.67 18.78 3.31
38 20.47 12.67 18.78 3.31
40 12.39 5.85 14.05 8. 31
42 9.33 5.26 16.33 13.55
44 6.32 3,56 1.0.03 13.69
46 5. 14 3.16 5.68 18.97
48 5. 15 6.38 4.65 15.21
50 1. 94 21. 48 1.48 9.44
52 1. 86 .19.49 0.50 8.07
54 1. 91 6,07 0.32 3,50
80 U sing preparative GLC, it has been reported that the
triglyceride s in each peak (ignoring the degree of unsaturation
and po sitional i some r s) can be determined from the fatty acid
composition. As expected, the short-chain fatty acids (6:0 to
10: 0) are found in the low molecular weight peaks. C 30' C 32
M
o L
E
qo
FIG. 11
25
20
15
10
5
28 30 . 32 34 36
GLC OF PKO
D before IE
after IE
38 40 42 44 46 48 50 52 54
.I>.I>-
M
o
L
E
9'0
FIG.12
21
15
9
I l 3
32 34 36
GLC OF PO/PKO (11)
o before IE
n after IE ,\ i f ,¥
38 40 42 44 46 48
CAR BON N U M B E R
50 52 54
~ (..~
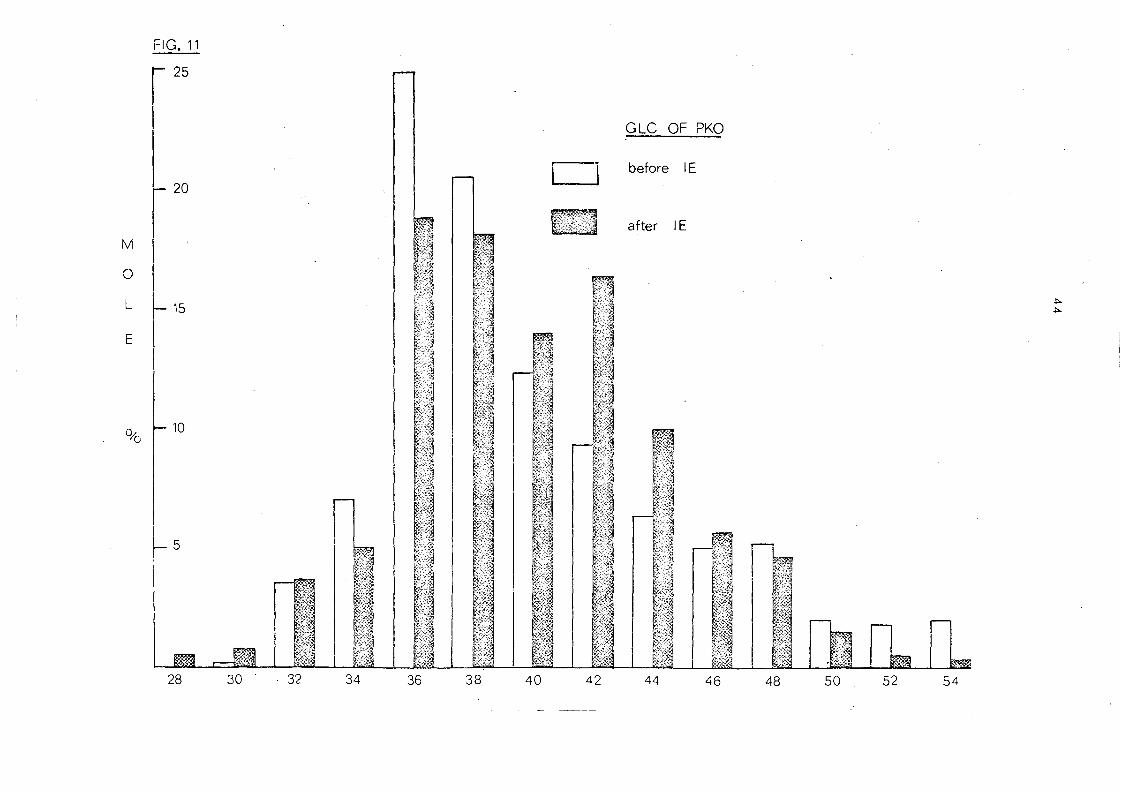
46
and C 34 and the long··chain fatty acids (16:0, 18:0, 18: 1 and 18:2)
in the intermediate and high molecular weight peaks. The
intermediate chain fatty acids (12:0 and 14:0) are present in
alrnost every peak; 12:0 acid occurs more particularly in peaks
C30
to C48
, while 14:0 acid is found especially inC34
to C50
glyceride s.
After interesterification the glyceride compositions of palm
kernel oil is somewhat changed. This is apparent mainly in a
redistribution of proportions in the ,C 36 to C 44 groups. The C 36
and C 38 glyc eride s, though still the large st, are Ie s s than in the
native oil and this fall is compensated by an increase in the C40
-C44
glycerides. Only small changes are apparent in the glycerides
of higher and lower molecular weight. The gross effect of the
randomisation is depicted in Fig. 11 .
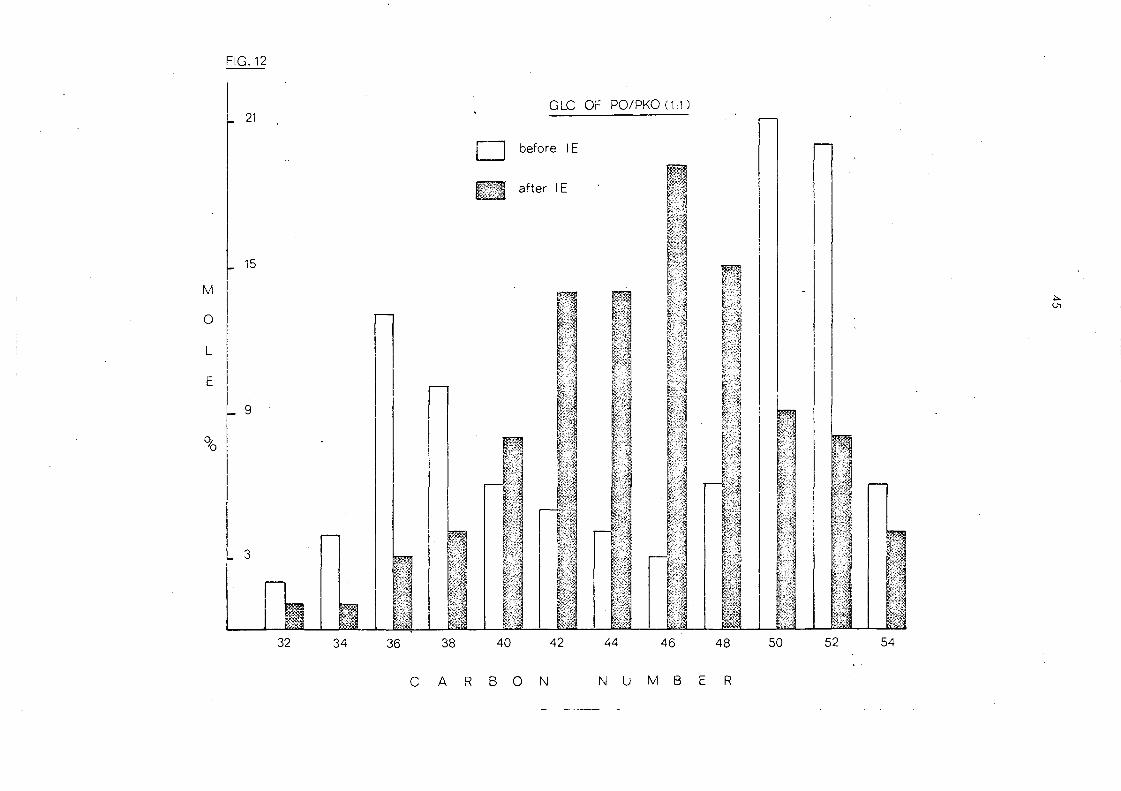
i v. !'c:.h~ 9~1 ~r:d _P~l.:n_~e:n_el_ ~,il_ (~: ~,_ w..1'!:'t ~i:::t~r_e _
Fig. 12 shows the effect of interesterifi.cation on a 1:1 mixture of
palm oil and palm kernel oil. Before interesterification the
glyceride distribution is bimodal with maxima at C 36/C 38 and
C 50 IC 52 glycerides representing the palm kernel oil and palm oil
constituents respectively. After randomisation there is a single
maximum'at C46
and a considerable increase in the C40
-C48
glyc eride s.
!'~YE1~t.!:PE ,2f_l\i..el h 'yly:~~!:.. s_D21~~_I£:.t:~r~ ~e2'iJ.i.£aJ;i~y!;._
Methyl ester s are by~products formed during interesterification
when sodium methoxide is used as a catalyst. The mechanism of
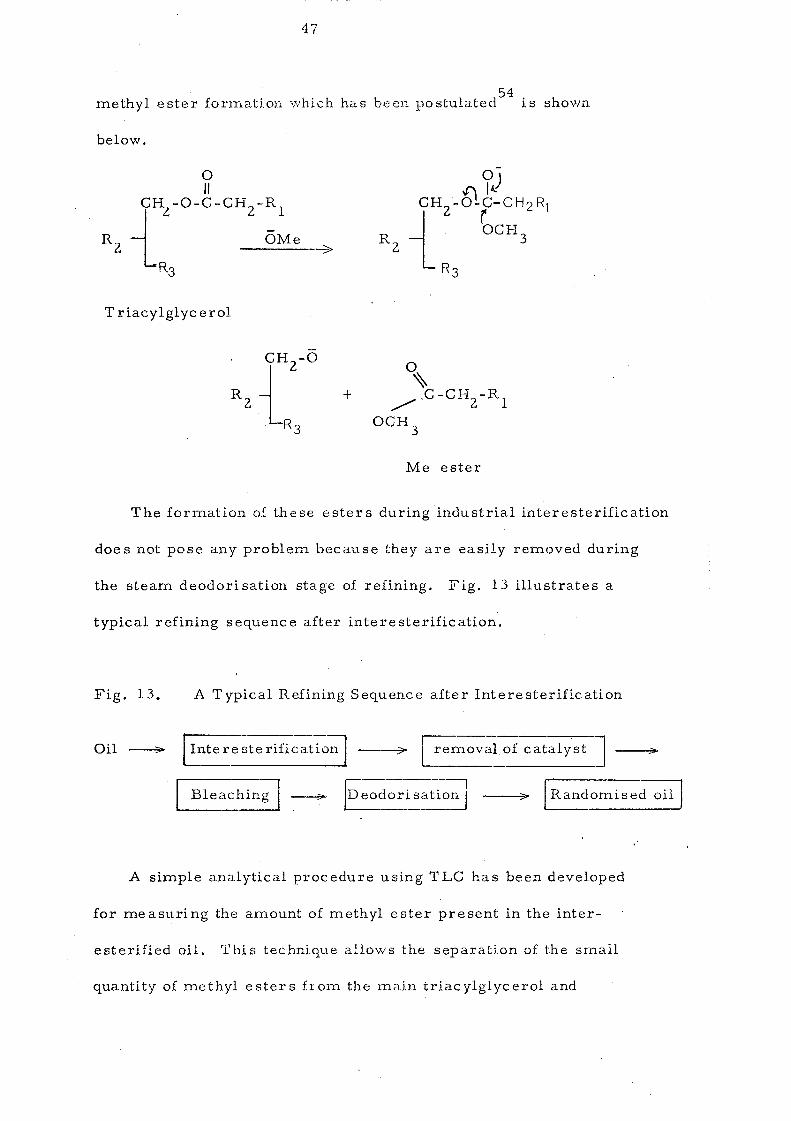
47
54 methyl ester fornlation -vvhich has been postulated is shown
below.
£) 7) jH2-O-P- CH2 R, L OCH 3
R3
T riacylglyc erol
+
Me ester
The formation of these esters during industrial interesterification
does not pose any problem because they are easily removed during
the steam deodorisation stage of refining. Fig. 13 illustrates a
typical refining sequence after interesterification.
Fig. 13. A Typical Refining Sequence after lnteresterification
lnte re ste rification ---.;;>;;.- [ removalof catalyst]
Bleaching I ~ [Deodorisa;ion J -->->- I Randomised oil I
A simple analytical procedure using TLC has been developed
for measuring the arnount of methyl ester present in the inter-
esterified oil. This technique allows the separati.on of the small
quantity of methyl esters from the mai.n triacylglycerol and
48
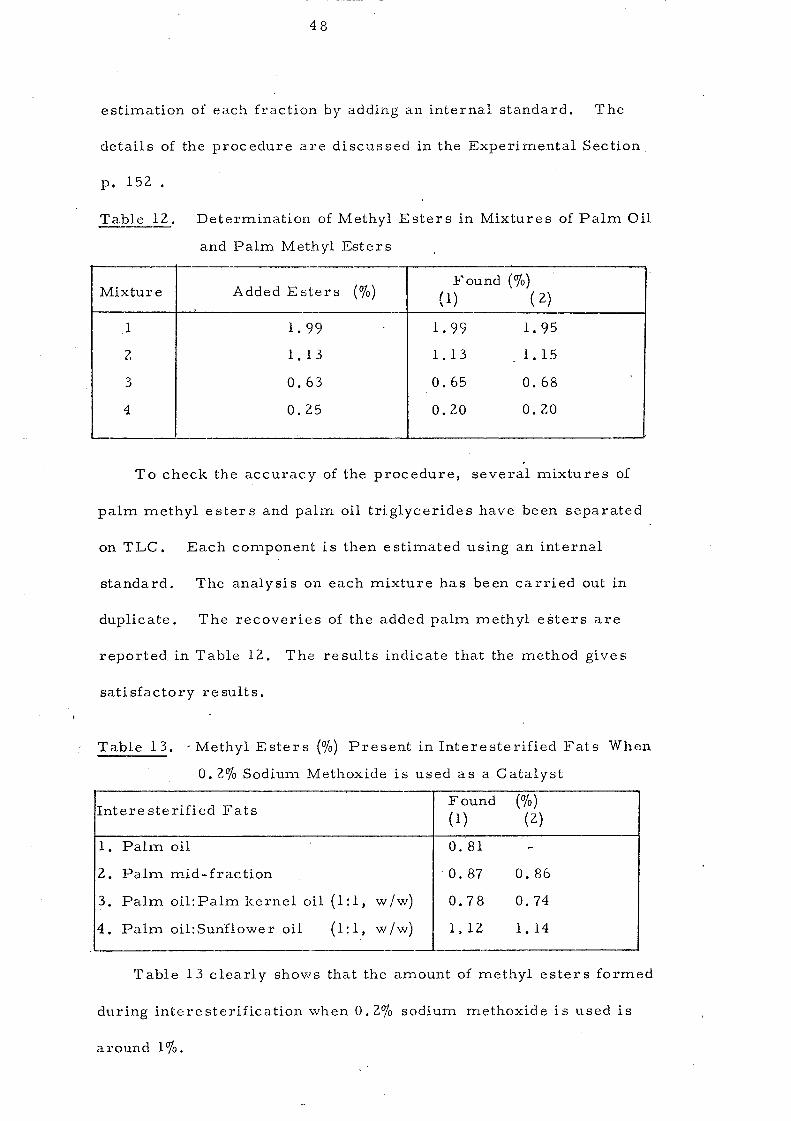
estimation of each fraction by adding an internal standard. The
details of the procedure are discussed in the Experirnental Section
p. 152 .
..Table~. Determination of Methyl Esters in Mixtures of Palm Oil
and Palm Methyl Esters
(%) Found (%)
Mixture Added Esters (1) ( 2)
1 1. 99 1. 99 1. 95
2 1. 13 1. 13 1. 15
3 0.63 0.65 0.68
4 0.25 0.20 0.20
To check the accuracy of the procedure, several mixtures of
palm methyl esters and palm oil tri.glycerides have been separated
on T LC. Each component is then estimated using an internal
standard. The analysis on each mixture has been carried out in
duplicate. The recoveries of the added palm methyl esters are
reported in Table 12. The results indicate that the method gives
satisfactory re sults.
Table 13. - Methyl Esters (%) Present in Interesterified Fats When
0.2% Sodium Methoxide is used as a Catalyst
Intere ste rified Fats Found (%) (1) (2)
1. Palm oil 0.81 -2. Palm mid-fraction 0.87 0.86
3. Palm oil: Palm kernel oil (1: 1, w/w) 0.78 0.74
4. Palm oil: Sun£lowe r oil (1: 1 , w/w) 1. 12 1. 14
Table 13 clearly shows that the amount of methyl esters formed
during interesterification when 0.2% sodium methoxide is used is
around 1%.
49
Like other fats and oils, the end uses of palm oil depend not only
on its nutritional value and chem.ical composition but also on its
. physical characteristics.which often influence its behaviour and
performance in the end products. The nature and distribution
of fatty acids in the triacylglycerol molecule are together
responsible for the physical. properties of fats and oils. In
natural fats, the fatty acid radicals are not usually randomly
distributed. Interesterification, however, causes a random
'distribution of fatty acid and this has marked effects on the
physical characteristics of the product.
d . f h I h' 29 Melting point eterminatlon is one 0 t e ear iest tec nlques
and is perhaps the faste st method of studying the physical propertie s
of fats and oils before and after interesterification. The pattern
of melting point changes varie s with the type of fat s and oils being
randomised. Vegetable oils generally have a fair proportion of
saturated to unsaturated fatty acids .and there is an increase in
melting point after interesterification. With aniInal fats, such as
lard and tallow, there is generally little change in melting point
after randomisation.
Dilatometry which measures volUlne change. on heating and
cooling has been widely applied for examining the phase behaviour
of fats and oils. Results are usually expressed in the form of a
solid content index (SCI) or a solid fat ind ex (SFI). Thi s index is
a convenient measure of the solids in fats. The technique is
time-consuming and applicable only to samples with an SFI below
50
50% but it is a very precise meth.od and is recognised as an
81 official A. O. C. S. Nevertheless this technique of studying
phase changes in fats and oils has gradually been replaced by
the NMR method which is more accurate and less time-consuming.
In general the use of NMR for determining the solid/liquid
content of fats and oi.ls is based on the fact that thi s ;spectro scopic
technique is capable of distinguishing H nuclei in liquid and solid
environlnents. There are two types of NMR used for this
purpose.
i. Wide Lh1.e-NMR, unlike pulsed NMR, gives a signal only for
the liquid component in a solid-liquid mixture. For the
detennination of the percentage of solid, therefofe, two signals
at the same temperatures are required: (a) the signal of the
sample containing oil and crystals; and (b) the signal of the same
sample in totally liquid form. The second signal is determined
by extrapolation of that obtained at 60o
C. Thi s approach provided
the first attempt at a direct measurement of solids in fats. It
has been indicated 82 that the preci sion of the wide line NMR method
decreases with an increasing level of solids.
ii. Pulsed NMR is based upon the measurement of two signals after
a radio frequency pulse has been applied. The first measurement
is proportional to the total amount of fat (liquid and solid). The
signal 70 rS later represents the liquid fat only. This method
83 has been delllonstrated to be the most accurate and reliable and
can be used as a substitute for dilatation measurements. The
theoretical aspects of pulsed NMR in particular is also discussed
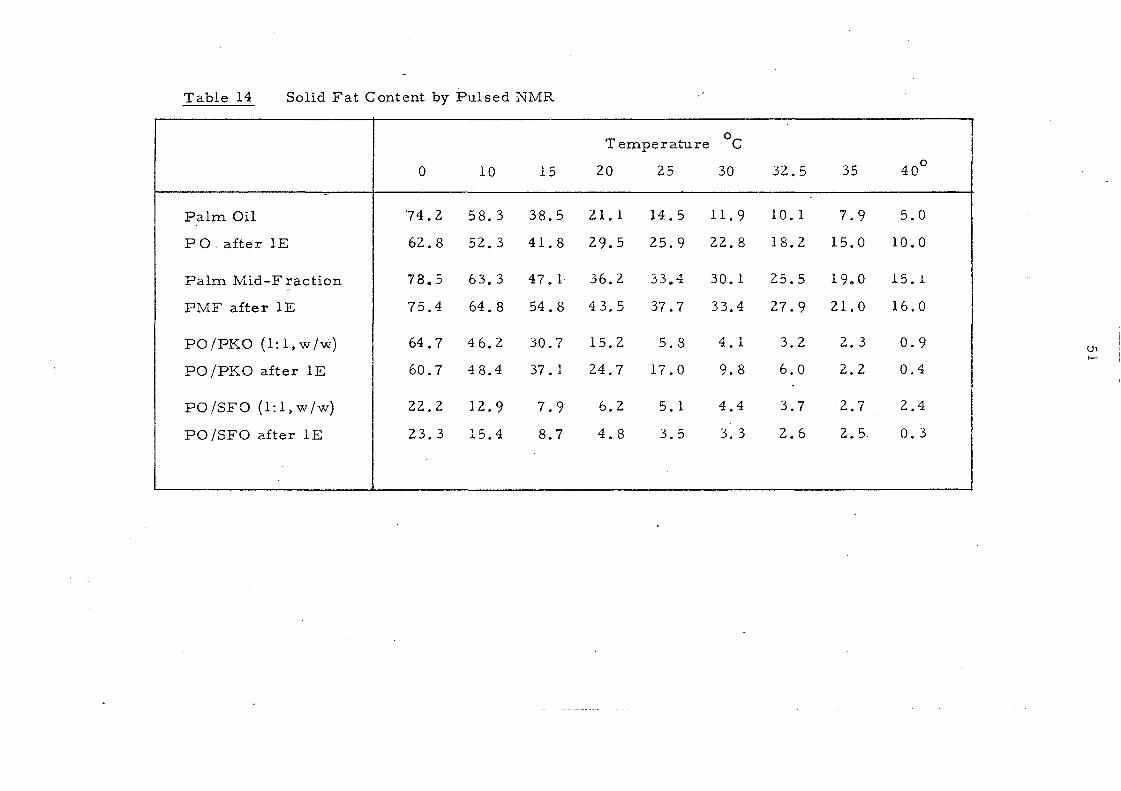
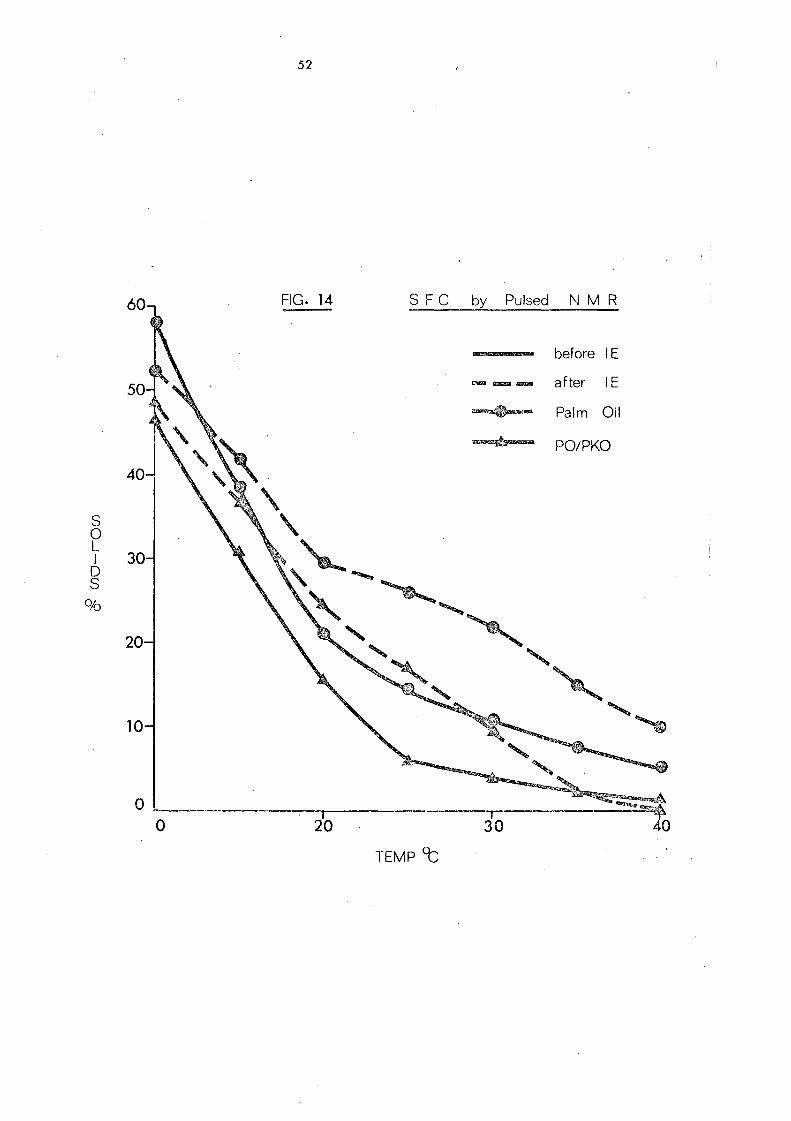
Table 14 Solid Fat Content by Pulsed NMR
0 10 15
-Palm Oil '74.2 58.3 38.5
PO. after IE 62.8 52.3 41.8
Palm Mid-Fraction 78.5 63.3 47.1 -
PMF after IE 75.4 64.8 54.8
PO IPKO (1: 1, w Iw) I 64.7 46.2 30.7
PO /PKO after IE 60.7 48.4 37.1
POISFO (1:1,w/w) 22.2 12.9 7.9
PO /SFO after 1 E 23.3 15.4 8.7
Temperature °c
20 25 30
21.1 14.5 11.9
29.5 25.9 22.8
36.2 33.4 30.1
43.5 37.7 33.4
15.2 5.8 4. 1
24.7 17.0 9.8
6.2 5. 1 4.4
4.8 3.5 3.3
32.5 35
10. 1 7.9
18.2 15.0
25.5 19.0
27.9 21.0
3.2 2.3
6.0 2.2
3.7 2.7
2.6 2.5.
40°
5.0
10.0
15.1
16.0
0.9
0.4
2.4
0.3
i I I
\.]1 f-<
S 0 L I D S
0/0
60
50
40
30
20
10
o o
52
FIG. 14
I 20
SFC
TEMP <t
by Pulsed
w -...... _-~'"-.",.. .. :a
-.,.---30
NMR
before IE
after IE
Palm Oil
PO/PKO
53
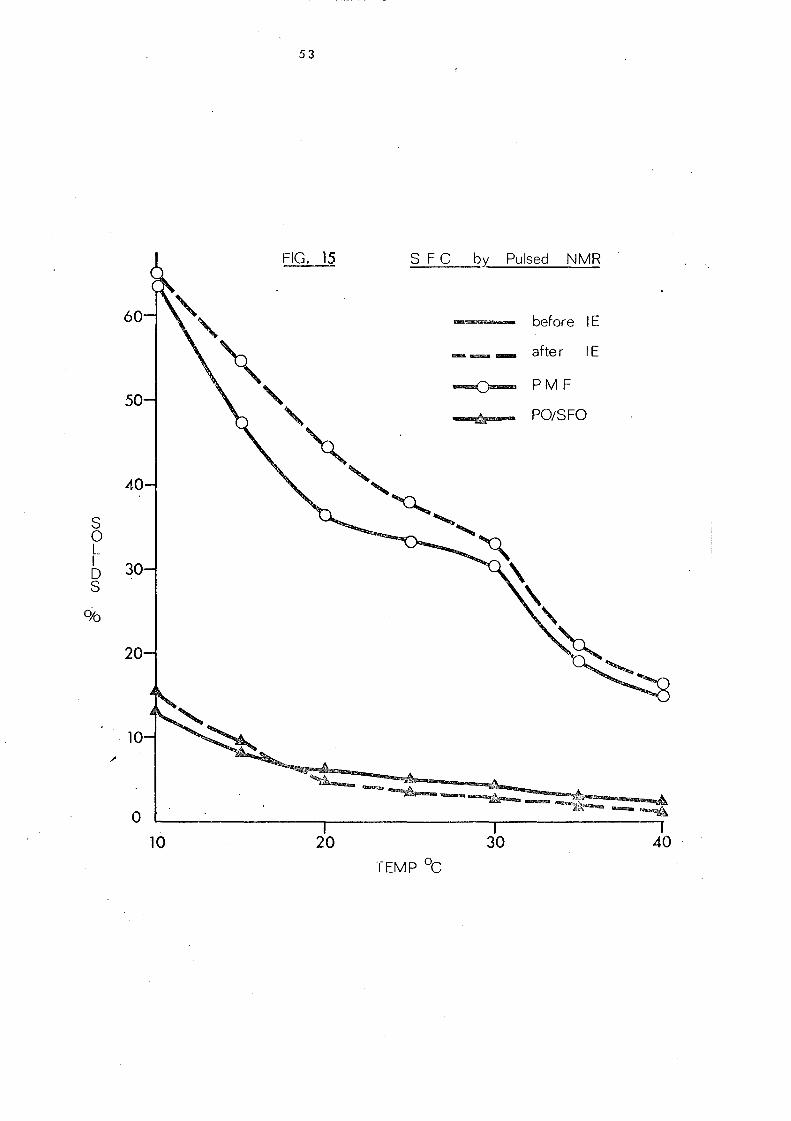
FIG. 15 S Fe bY' Pulsed NMR
60 before IE
............. - after IE
~ PMF 50
........ - PO/SFO
40
S 0 L I 30 0 S
0/0
20
·10
o ~--~-~.,--~ l~~----~---,c-------------~------------ I
I 40 . I 30 20 10
S4
in Appendix IS.
Table 14 shows the solid fat content of some oils and oil
mixtures as measured by pulsed NMR., The changes resulting
from inte re sterification are reflected in Figs. 14 and lS whe re
the content of solids is plotted against various temperatures at
which measurements are recorded. For convenience, the solid
content at OOC is excluded frorn the curves. After interesterification
palm oil shows a significant increase in solid s between 200
and 3S °C.
This change and the persistence of 10% solid even at 400
'are
attributed to the increase in trisaturated glycerides after
randomisation, (from '7. 6% to 13. 2%). The increa se in the content
of the unsymmetrical fo rm s of 001, which are les s important in
the native oil, would not be expected to contribute to the change in
solid content because there is a little difference in melting points 84
between the symmetrical (melting point 36.4 °C) and the unsymmetrical
(melting point 34. SoC) oleodipalmitin glycerides even though these
glyceride s are among the major triglyceride s in palm oil.
The palm oil-palm kernel oil mixture is characterised by a
sharp decrease in the solid content to about 6% at 2So
C and complete
liquifaction above 3SoC. After interesterHication the solid content
is increased partlcularly in the temperature range lS_300C.
Interesterification has little effect on the melting behaviour of both
palm mid-frac.tion and the mixture of palm oil and sunflower seed
oil, even though it has been shown that considerable changes have
taken place in the glyceride composition of the palm oil- sunflower
oil mixture.
55
Palm oil, like other natural fats, is a mixture of several
different glycerides. Its melting behaviour is influenced by
the temperature conditions during crystallisation and varies
for different polymorphs. High molecular weight substances
including fats and oils have no definite melting point but a
melting range, due to the presence of more than one crystal
form which exhibit diffe rent thermal propertie s. This
property of polymorphism is of a considerable academic and
industrial i.ntere st. The understanding of polymorphic
change is essential lor the satisfactory blending and tempering
of fat- containing materials. Problems of grainine s s in
margarine and bloom in chocolate are related to. polymorphic
changes.
The polymorphism of glycerides was known as far back as
1853 by C hevreul who reported that tri stearin had three melting
Polymorphism has been reviewed
85 868
by Chapman • Lutton et al have discussed the polymorphism
of odd and even saturated single acid triglyceride s. The various
polymorphs are characterised as follows: a, single short spacing
at about 4. 1 1\ associated with a lowest melting form; 13', short
spacing between 3. 8 and 4.2 5\; and 13, short spacing at about 4. 6 5\
associated with the highest melting form. In addition there may
56
be other polymorphs which ,have less fully defined. These
include the '( form with diffuse short spacing at about 4. 15 R
and a vitreous form which is less stable than the a-form. This
latter form is of little importance since it transforms to the
a-form even at low temperature.
The rate of crystallisation of the a-form is more rapid
than that of the (3' which, in turn, c,rystallises more quickly than
the (3-form. Generally the types of crystal modifications are
governed by the rate of cooling during crystallisation of a fat.
Fast cooling of the melt results in the a-form crystals. It has
been found 86b using the DT A technique with heating "at a rate of
20
per min, that samples of tristearin, tripalmitin, tricaprylil1,
the tri saturated fraction of palm oil and seve ral fully hydrogenated
oils, show the presence of the a-form followed by f3and (3'
transitions. Fats such as lard and partially hydrogenated cotton
seed and ground nut oils crystallise directly in the (3'-form.
During crystallisation coconut oil exhibits a modification followed
immediately by a and (3' tran sitions.
Both the a and (3' forms are found in all pure triglycerides
and naturally occurring fats. ' In fats which contain asymmetrical
triglyc eride e. g. glyceryl-l, 2-dipalmitate- 3 -oleate, the (3' form
is the most stable. Pure symmetrical triglycerides and cocoa
butter which contains symmetrical triglycerides (POS, POP, SOS)
have the f3 form as the most stable. In naturally occurring
triglycerides the (3' to (3 transition~ can occur on storing for
some tin'le at a favourable temperature.
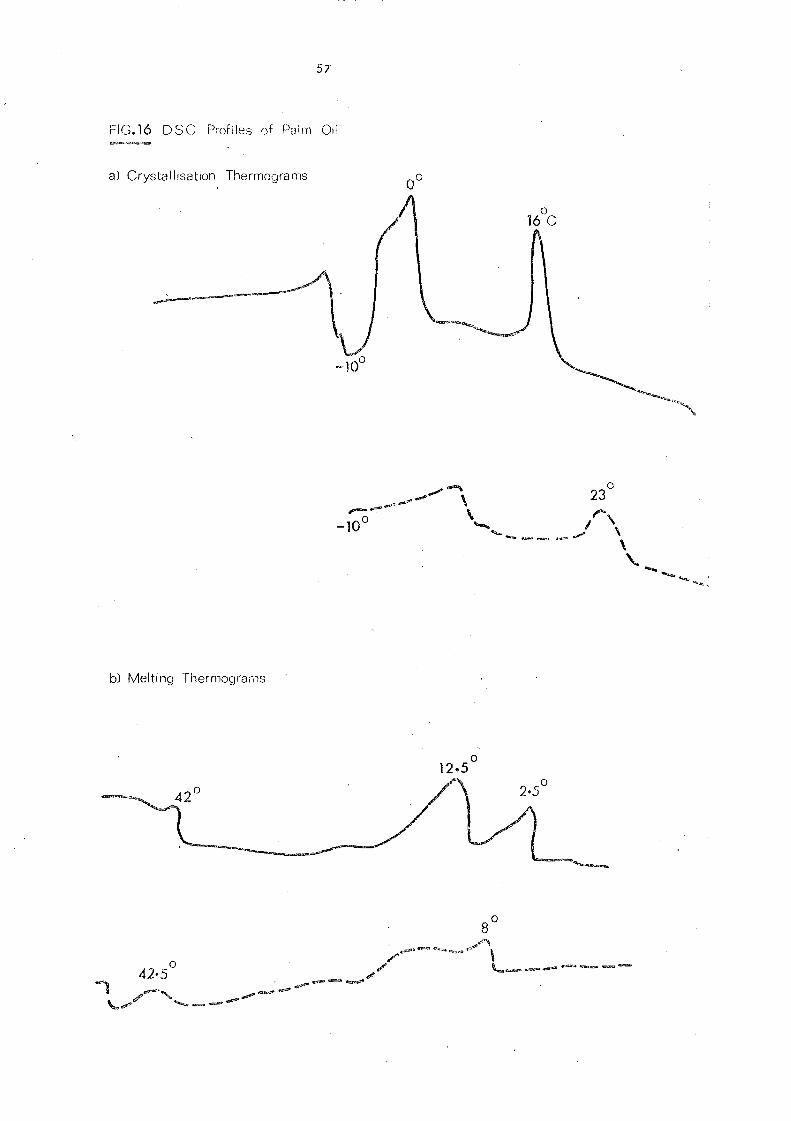
57
FIG.16 DSC Profiles of Palm Oil
a) Crystallisation Thermograms
b) Melting Thermograr.ls
o 16 C
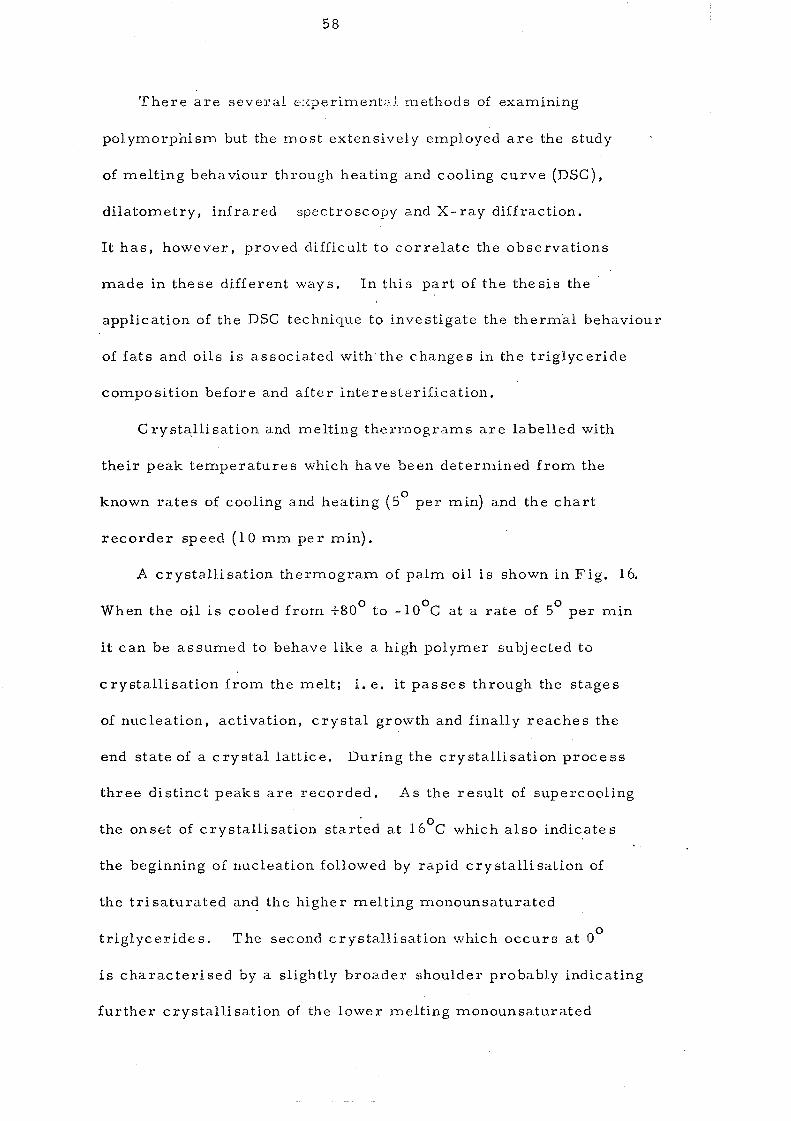
58
There are several e:{perimentaJ. methods of examining
polymorpnism but the most extensively employed are the study
of melting behaviour through heating and cooling curve (DSe),
dilatometry, infrared spectroscopy 2nd X-ray diffraction.
It has, however, proved difficult to correlate the observations
made in these different ways. In this part of the thesis the
application of the DSe technique to investigate the thermal behaviour
of fats and oils is associated with the changes in the triglyceride
composition before and after interesterification.
erystaJlisation and melting thermograms are labelled with
their peak temperatures which have been determined from the
known rate s of cooling and heating (50 per min) and the chart
recorder speed (10 mm per min).
A crystalli sation thermogram of palm oil is shown in Fig. 16.
When the oil is cooled from +80 0 to _lOoe at a rate of 50 per ITlin
it can be assumed to behave like a high polymer subjected to
crystallisation from the melt; 1. e. it passes through the stages
of nucleation, activation, crystal growth and finally reaches the
end state of a crystal lattice. During the crystallisation process
three distinc t peaks are recorded. A s the result of supercooling
the on set of c rystalli sation started at 160
e which also indicate s
the beginning of nucleation followed by rapid crystallisation of
the trisaturated an~ the higher melting monounsaturated
triglycerides. The second crystallisation which occurs at 00
is characterised by a slightly broader shoulder probably indicating
further crystallisation of the lower melting rrlOnounsaturated
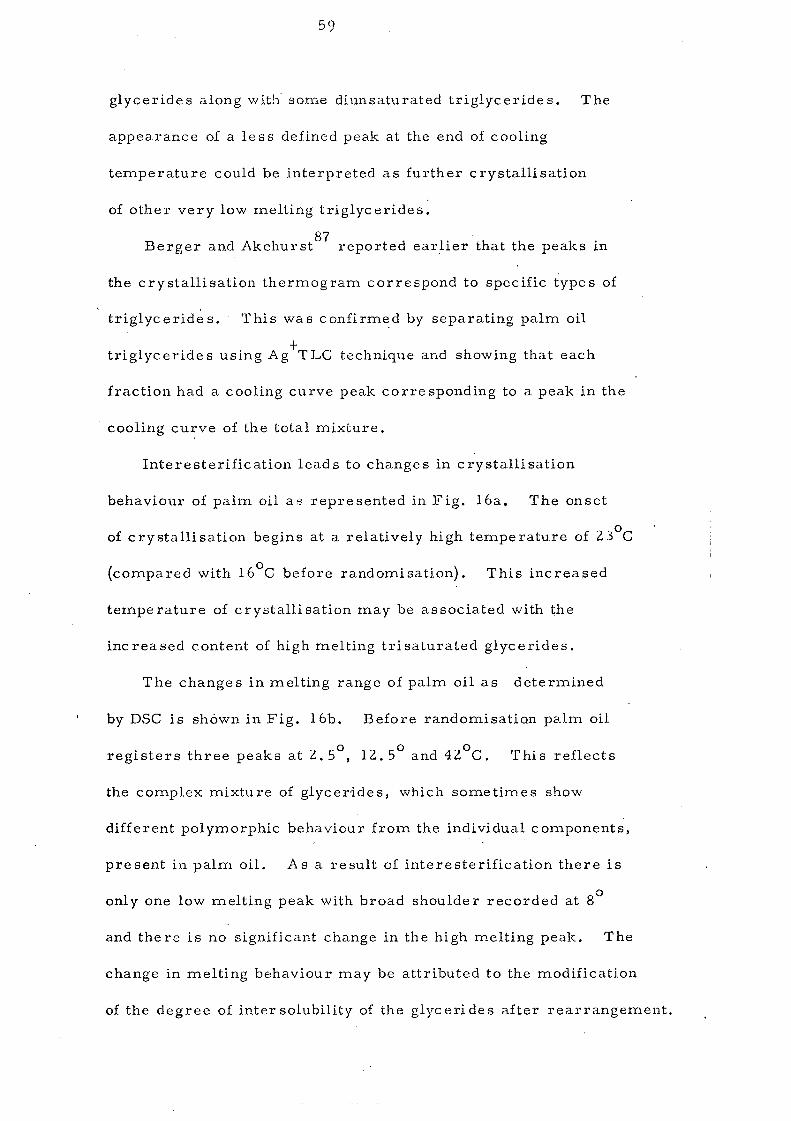
59
glycerides along with some diunsaturated triglycerides. The
appearance of a less defined peak at the end of cooling
temperature could be interpreted as further crystallisation
of other very low melting triglycerides.
87 Berger and Akehurst reported earlier that the peaks in
the crystallisation thermogram correspond to specific types of
triglycerides. This was confirme,d by separating palm oil
+ triglycerides using Ag TLC technique and showing that each
fraction had a cooling curve peak corresponding to a peak in the
cooling cu~ve of the total mixture.
Interesterific ation lead s to change s in crystallisation
behaviour of palm oil as repre sented in Fig. l6a. The onset
of crystallisation begins at a relatively high temperature of 230
C
(compared with 160
C before randomisation). This increased
temperature of crystallisation may be associated with the
increased content of high melting trisaturated glycerides.
The changes in melting range of palm oil as determined
by DSC is shown in Fig. l6b. Before randomisation palm oil
o 0 0 registers three peaks at 2.5 , 12.5 and 42 C. This reflects
the complex mixture of glycerides, which sometimes show
different polymorphic behaviour from the individual components,
present in palm oil. As a result of interesterification there is
onl y one low melting peak with broad shoulde r recorded at 8°
and there is no significant change in the high melting peak. The
change in melting behaviour may be attributed to the modification
of the degree of inter solubility of the glycerides after rearrangement.
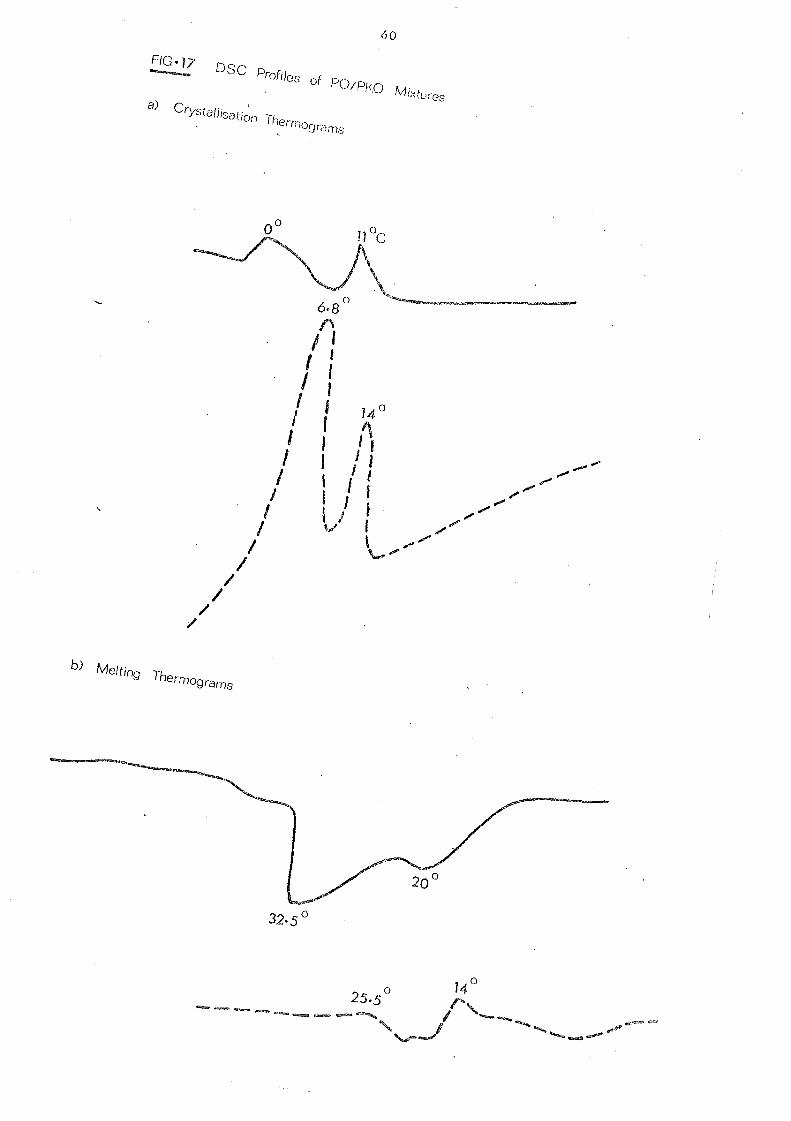
60
FlG'17 DSC Pcof;/es of PO/PkO ML"o'GS --a) Crystallisation Therm09r-arns
I /
/ /
/
b) Melting Thermograms
,
o 6·8
'I I I I I I I I I 140
I I ~ ~ I I I I .... _ I I I I , ........
I I I I / I J I J "
I l/, // I \\,... ......... /
32.5 0
25·5 o
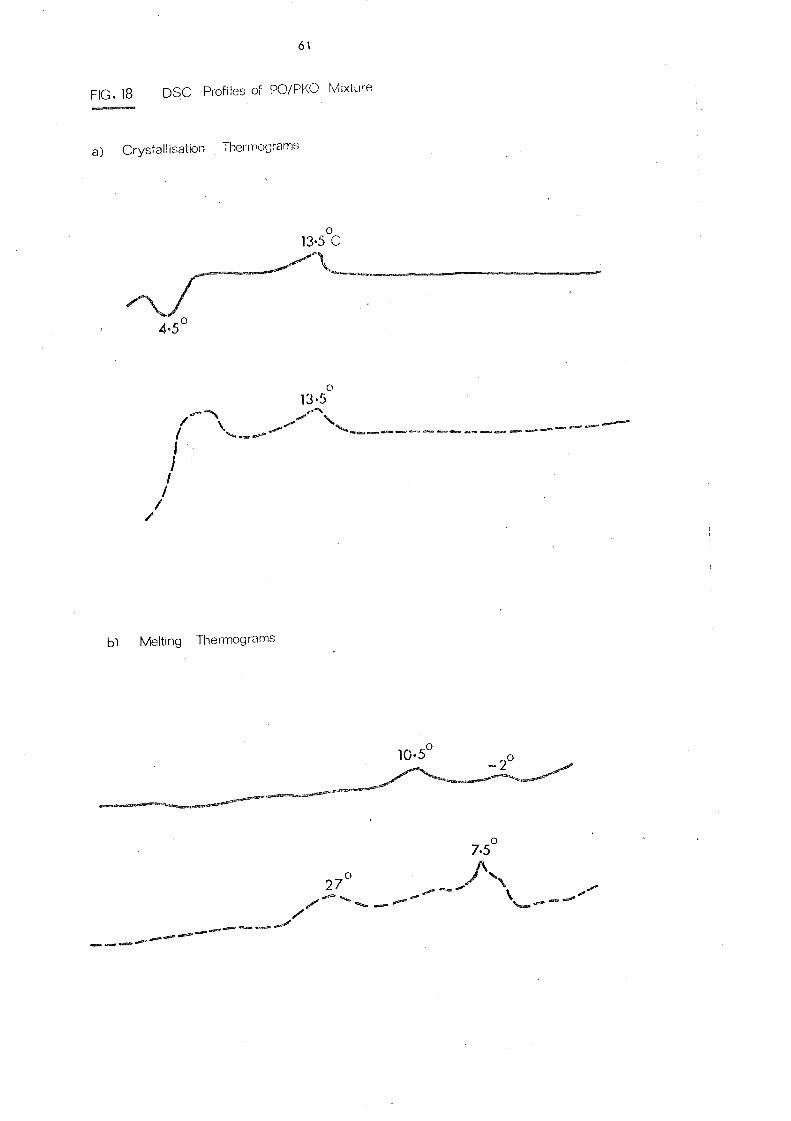
61
FIG. 18 DSC Profiles of PO/PI<O Mixture
a)
b)
Crystallisation Therrnograms
o 13·5 C
~\. /\J ---" 4.5 0 .
Melting Thermograms
o 13·5
10.50
________ ~ __ ---__ Yll'~~~
62
The changes in thennal behaviour of FO/PKO and PO/SFO
mixture s on randomi sation are depicted in Figs. 17 and 18
re specti vely. After randomi sation the crystallisation curve s
of PO/PKO mixture remain a doublet but there is a significant
shift in peak temperatures. Interesterification of this mixture
re sults in glycerides containing both long chain fatty acid s from
palm oil and intermediate chain length fatty acid s from palm
kernel oil. The changes in glyceride composition and
polymorphic behaviour after randomisation are also reflected
in melting thermogralTIs. Intere sterification of the mixture of
PO/SFO apparently does not give a very significant change in
thermal characteristicfJ.

CRAPT ER THREE
63
A ttempts to Prepare a Mixture of Fats and Oils Containing Palm
Oil and/or Palm Oil-Derived Fractions Which Simulates Vanaspati
Introduction
'Vanaspati' is a popular fornl of fat used extensively in India and in
Pakistan. It is a semi-solid mat~rial consisting entirely of
vegetable oil(s) or fat(s) which may have been subjected to
hydrogenation or interesterification. Indian vanaspati generally
has a slip point not exceeding 370
and a solids content of about 50%
o M 0 at 20 , and· less than 5/0 at 37 • In Pakistan the solids content at
200
is somewhat lower (about 35%). A typical Indian vanaspati
contains sesame oil (liquid, 5%). hardened cottonseed oil (mp 350
,
o 15%), hardened rape seed oil or hardened soybean oil (mp 35 , 65%) t
and hydrogenated palm oil (mp 420
, 15%).
The main objective is to find mixtures which'would serve as a
vanaspati containing more palm oil as such or in segregated or
hydrogenated form. A wide range of mixtures has been examined
both before and after intere sterification. Particular attention is
paid to the slip point, solid s content at various tem.perature sand
melting behaviour.
Results and Discussion
Blend s 1 and 2
In the first group of mixtures (AI
-A5
) hardened soybean oil is mixed
with RBD palm oil or hardened palm oil and interesterified. The
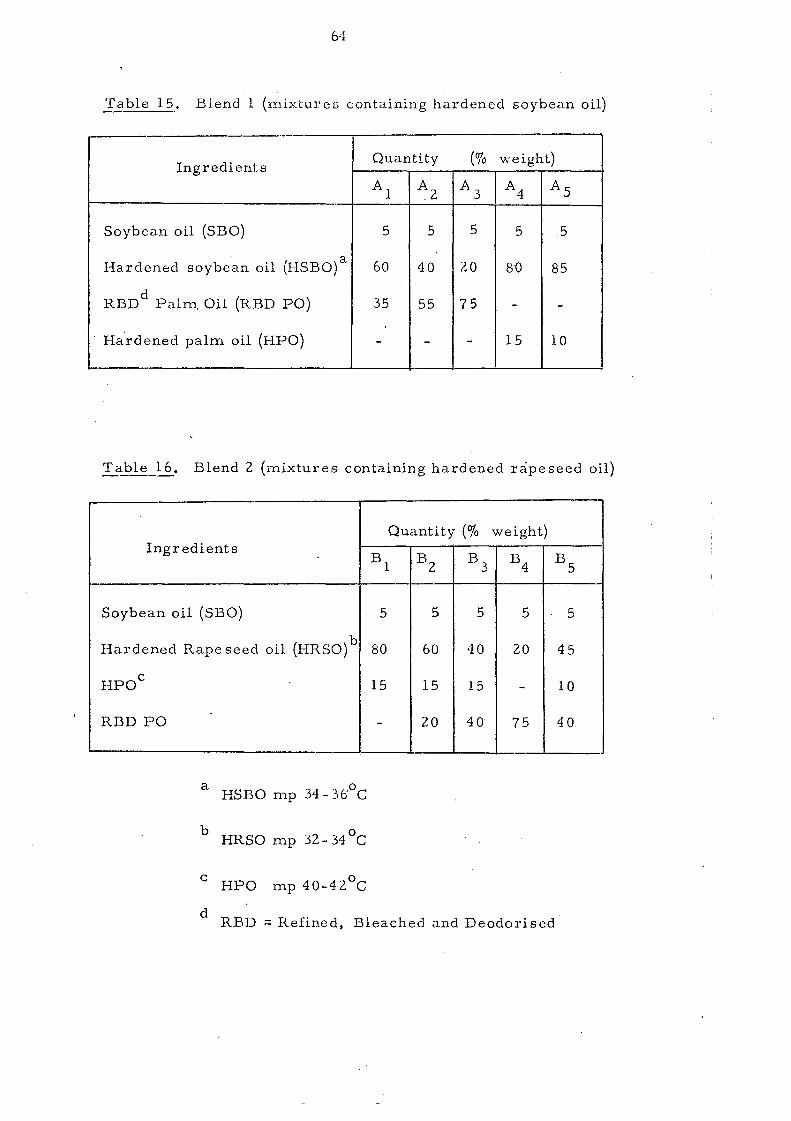
64
Table 15. Blend 1 (mixtul' e s containing hardened soybean oil)
Ingredients Quantity (% weight)
Al A2 A3 A4 A5
Soybean oil (SBO) 5 5 5 5 5
Hardened soybean oil (HSBO)a 60 40 20 8'0 85
RBDd Palm, Oil (RBD PO) 35 55 75 - -
Ha'rdened palm oil (HPO) - - - 15 10
Tayle 16. Blend 2 (mixtures containing hardened rapeseed oil)
Quantity (% weight) Ingredients
Bl B2 B3 B4 B5
Soybean oil (SBO) 5 5 5 5 5
Hardened Rape seed oil (HRSO) b 80 60 ,10 20 45
HPOc
15 15 15 - 10
RBD PO - 20 40 75 40
a HSBO mp 34 - 36,oC
b HRSO mp 32- 34 °c
c 0 HPO mp 40-42 C
d RBD = Refined, Bleached and Deodorised
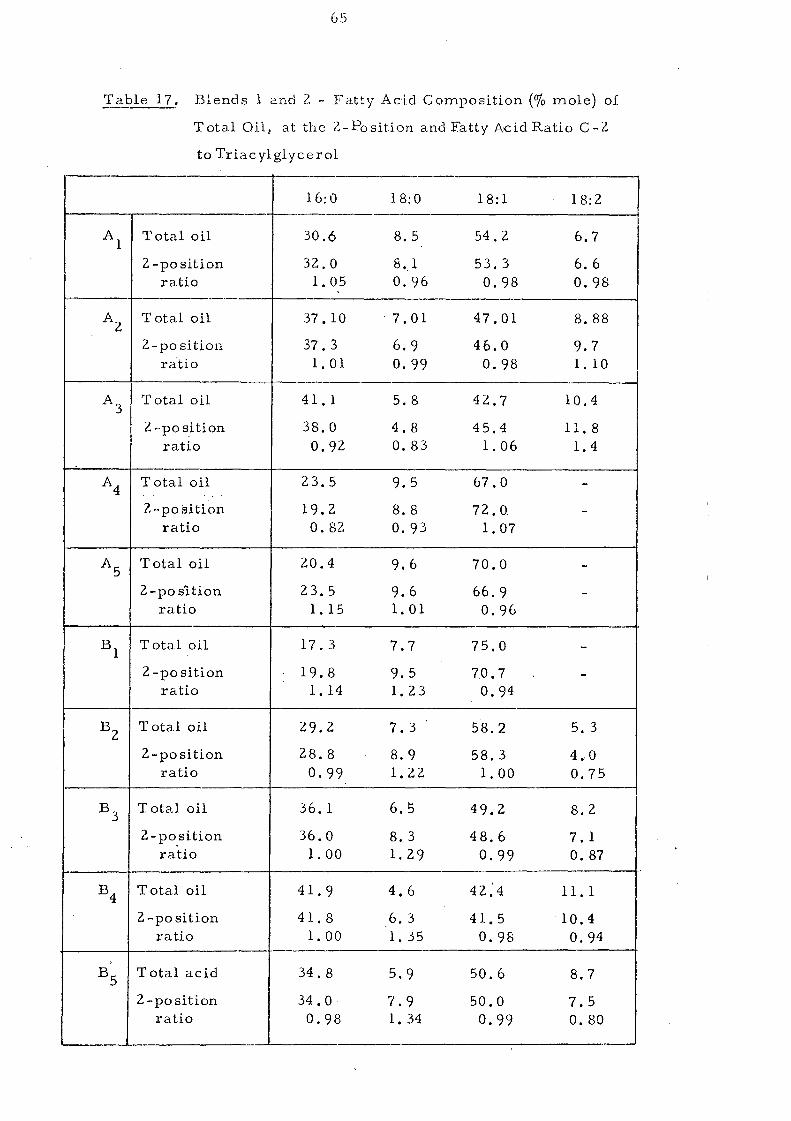
65
Table 17. Blends 1 and 2 - Fatty Acid Composition (0/0 mole) of
Tota.10U, at the Z-Position and Fatty Acid Ratio C-2
to Triacylglycerol
-16: 0 18:0 18: 1 18: 2
---
Al Total oil 30.6 8.5 54.2 6.7
2 -po sition 32.0 8.1 53.3 6.6 ra.tio 1.05 0.96 .0.98 0.98
._.
A2 Total oil 37.10 7.01 47.01 8.88
2 - po SitiOll 37.3 6.9 46.0 9.7 ratio 1.01 0.99 0.98 1. 10
A3 Total oil 41. 1 5. 8 42.7 10.4
2-pos.ition 38.0 4.8 45.4 11.8 ratio 0.92 0.83 1.06 1.4
A4 Total oil ...
23.5 9.5 67.0 -2-po sition 19.2 8.8 72.0 -
ratio 0.82 0.93 1. 07
A 5
Total oil 20.4 9.6 70.0 -
2-posltion 23.5 9.6 66.9 -ratio 1. 15 1. 01 0.96
Bl Total oil 17.3 7.7 75.0 -2-position 19.8 9.5 7.0.7 -
ratio 1. 14 1. 23 0.94
B2 Total oil 29.2 7.3 58.2 5. 3
2-position 28.8 8.9 58.3 4.0 ratio 0.99 1. 22 1. 00 0.75
B3 Total oil 36.1 6.5 49.2 8.2
2-po.sition 36.0 8.3 48.6 7. 1 ratio 1. 00 1. 29 0.99 O. 87
B4 Total oil 41.9 4.6 42~4 11. 1
2-position 41.8 6.3 41.5 "10.4 ratio 1. 00 1. 35 0.98 0.94
B5 Total acid 34.8 5.9 50.6 8.7
2-position 34.0 7.9 50.0 7.5 ratio 0.98 1. 34 0.99 0.80
"-
-
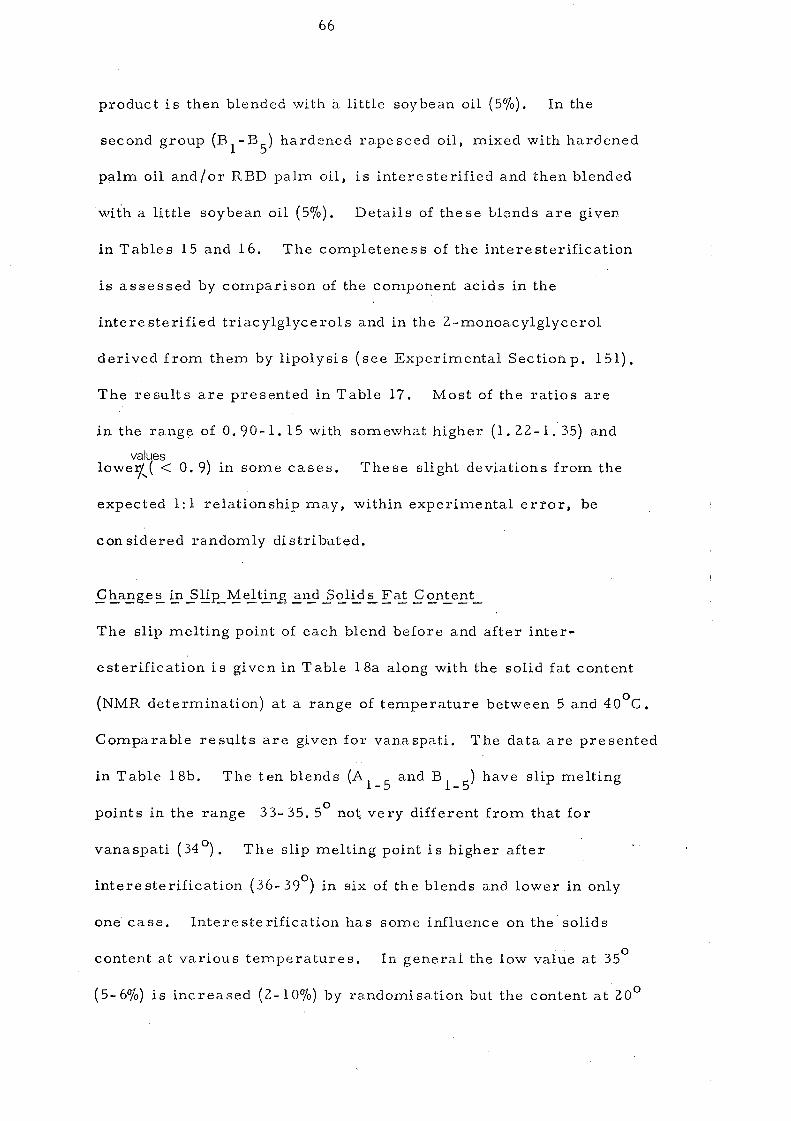
66
product is then blended with a little soybean oil (5%). In the
second group (BI-BS
) hardened rapeseed oil, mixed with hardened
palm oil and/or RBD palm oil, is interesterified and then blended
with a little soybean oil (S%). Details of these blends are given
in Tables lS and 16. The completeness of the interesterification
is assessed by comparison of the com.ponent acids in the
interesterified triacylglycerols and in the 2-monoacylglycerol
derived from them by lipolysis (see Experimental Sectionp. lSI)'
The re sult s are presented in Table 17. Most of the ratio s are
in the range of 0.90-1. lS with somewhat higher (1.22-1.35) and
values 10we1-..( < 0.9) in some cases. These slight deviations from the
expected 1: 1 relationship may, within experin'lental error, be
con side red randomly distributed.
The slip melting point of each blend before and after inter-
esterification is given in Table 18a along with the solid fat content
(NMR determination) at a range of temperature between 5 and 400
C.
Comparable results are given for vanaspati. The data are presented
in Table 18b. The ten blends (Al
_5
and Bl
_5
) have slip melting
points in the range 33- 35. 50 no~ very different from that for
vanaspati (34 0). The slip melting point is higher after
intere sterification (36- 390
) in six of the blends and lower in only
one case. Interesterification has some influence on the solids
content at various temperatures. o
In general the low value at 35
(5-6%) is increased (2-10%) by randomisation but the content at 20 0
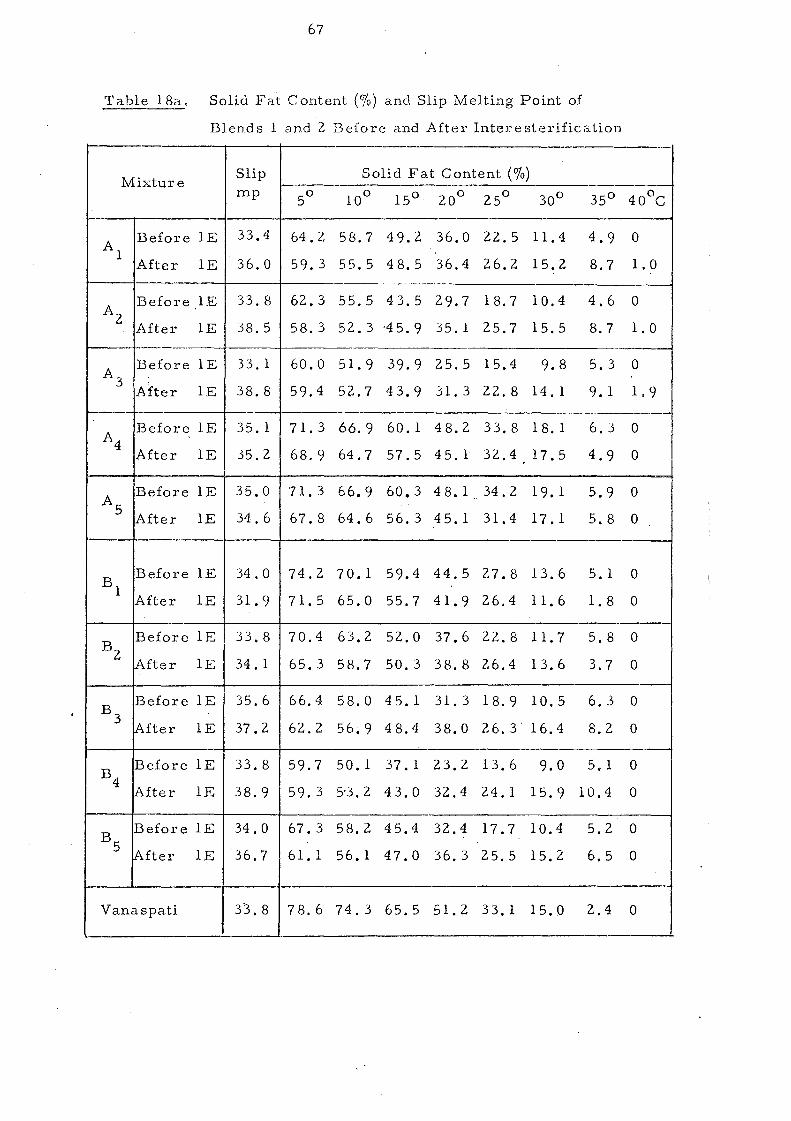
67
Table 18a. SoUd Fat C ontcnt (%) and Slip Melting Point of
Blend s 1 and 2 Before and After Interc sterification - --
Mixture Slip Solid Fat Content (%) mp 5° 10° 15° 20° 25° 30° 35° 40°C
Al Before IE 33.4 64.2 58.7 49.2 36.0 22.5 11.4 4.9 0
After IE 36.0 59.3 55.5 48.5 36.4 26.2 15.2 8.7 1.0
A2 Before IE 33.8 62.3 55.5 43.5 29.7 18.7 10.4 4.6 0
After IE 38.5 58.3 52.3 '45.9 35. 1 25.7 15.5 8. 7 1.0
A3 Before IE 33. 1 60.0 51. 9 39.9 25.5 15.4 9.8 5. 3 0
After IE 38.8 59.4 52.7 43.9 31. 3 22.8 14. 1 9. 1 1.9 f---- --
A4 Before IE 35. 1 71.3 66.9 60.1 48.2 33.8 18. 1 6.3 0
After IE 35.2 68.9 64.7 57.5 45. 1 32.4 17.5 4.9 0
A5 Before IE 35.0 71. 3 66.9 60.3 48. 1 ., 34.2 19. 1 5.9 0
After IE 34.6 67.8 64.6 56.3 45.1 31.4 17. 1 5.8 0
Bl Before IE 34.0 74.2 70. 1 59.4 44.5 27.8 13.6 5.1 0
After IE 31. 9 71.5 65.0 55.7 41.9 26.4 11.6 1.8 0
B2 Before IE 33,8 70.4 63.2 52.0 37.6 22.8 11.7 5.8 0
IAfter IE 34.1 65.3 58.7 50.3 38.8 26.4 13.6 3.7 0
B3 Before IE 35.6 66.4 58.0 45. 1 31. 3 18.9 10.5 6 . .3 0
!After IE 37.2 62.2 56.9 48.4 38.0 26.3"16.4 8.2 0
B4 Before IE 33.8 59.7 50. 1 37. 1 23.2 13.6 9.0 5. 1 0
IAfter IE 38.9 59.3 5'3.2 43.0 32.4 24.1 15.9 10.4 0
B5 Before IE 34.0 67. 3 58.2 45.4 32.4 17.7 10.4 5.2 0
After IE 36. '7 61. 1 56. 1 47.0 36.3 25.5 15.2 6.5 0
Vanaspati 33.8 78.6 74.3 65.5 51. 2 33. 1 15.0 2.4 0
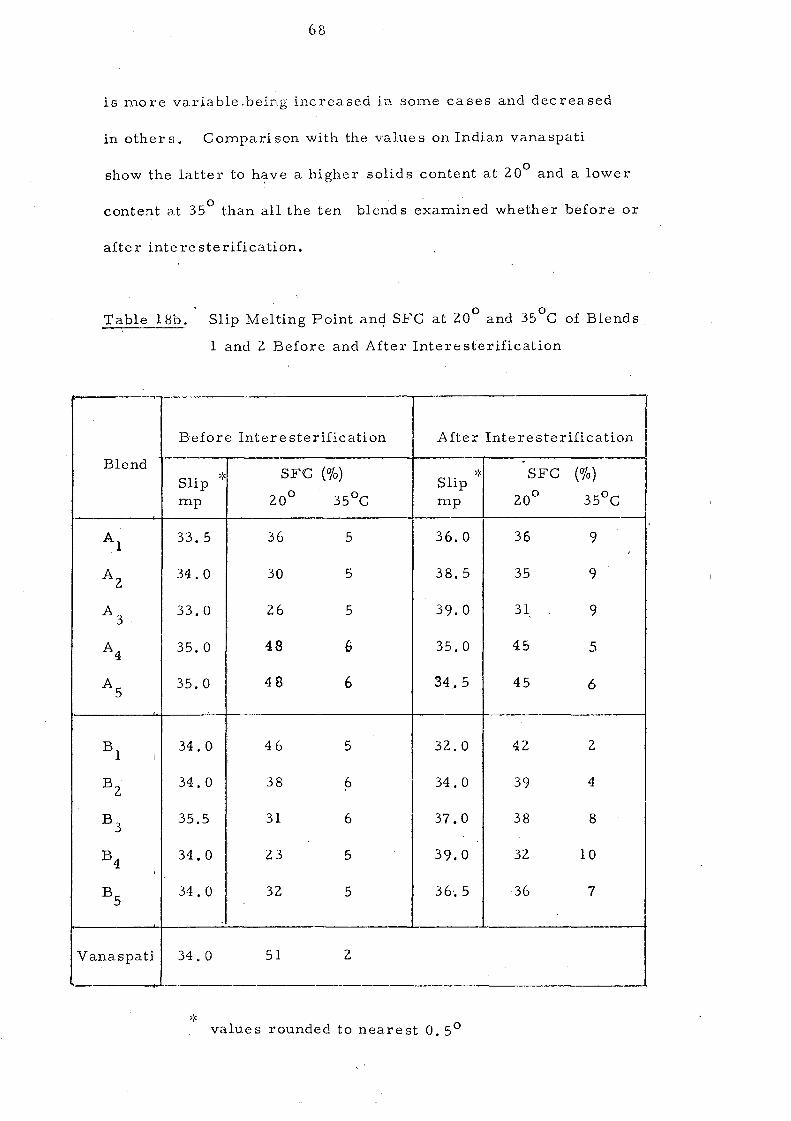
68
is nlOre variable.being increased in some cases and decreased
in other s. Compari son with the value s on Indian vanaspati
show the latter to h;~.ve a higher solids content at 20° and a lower
content at 3So t.han all the ten blend s examined whether before or
afte r inte re sterification.
Table 18b. Slip Melting Point ang SFC at 20° and 3SoC of Blends
1 and 2 Before and After Interesterification
Before Intere sterification After Interesterification
Blend SFC (%) (%) '!<
,~ SFC Slip
.. -Slip
mp 20° 3SoC mp 20° 35°C
Al 33.5 36 S 36.0 36 9 ,
A2 34.0 30 5 38.S 3S 9
A3 33.0 26 S 39.0 31 9
A4 3S.0 48 fj 35.0 45 5
AS 3S.0 48 6 34.5 45 6
Bl 34.0 46 5 32.0 42 2 t
B2 34.0 38 ~ 34.0 39 4
B3 35.5 31 6 37.0 38 8
B4 34.0 23 5 39.0 32 10 ,
BS 34.0 32 S 36.5 36 7
Vanaspati 34.0 51 2
-
values rounded to nearest O. SO
I
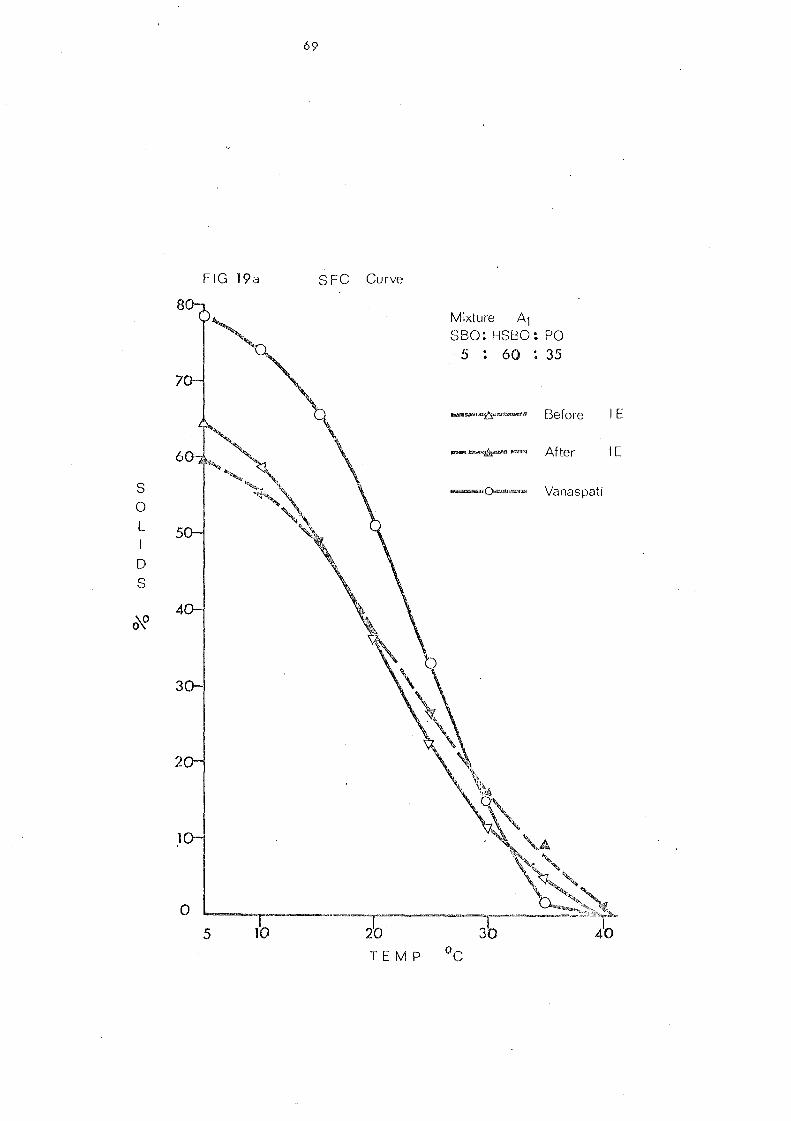
S o L
D S
2
o
FIG 19a
5 10
69
SFC Curve
Mixture A1 SBO: HSBO: PO
5 : 60 : 35
-...-~ """"" After IE
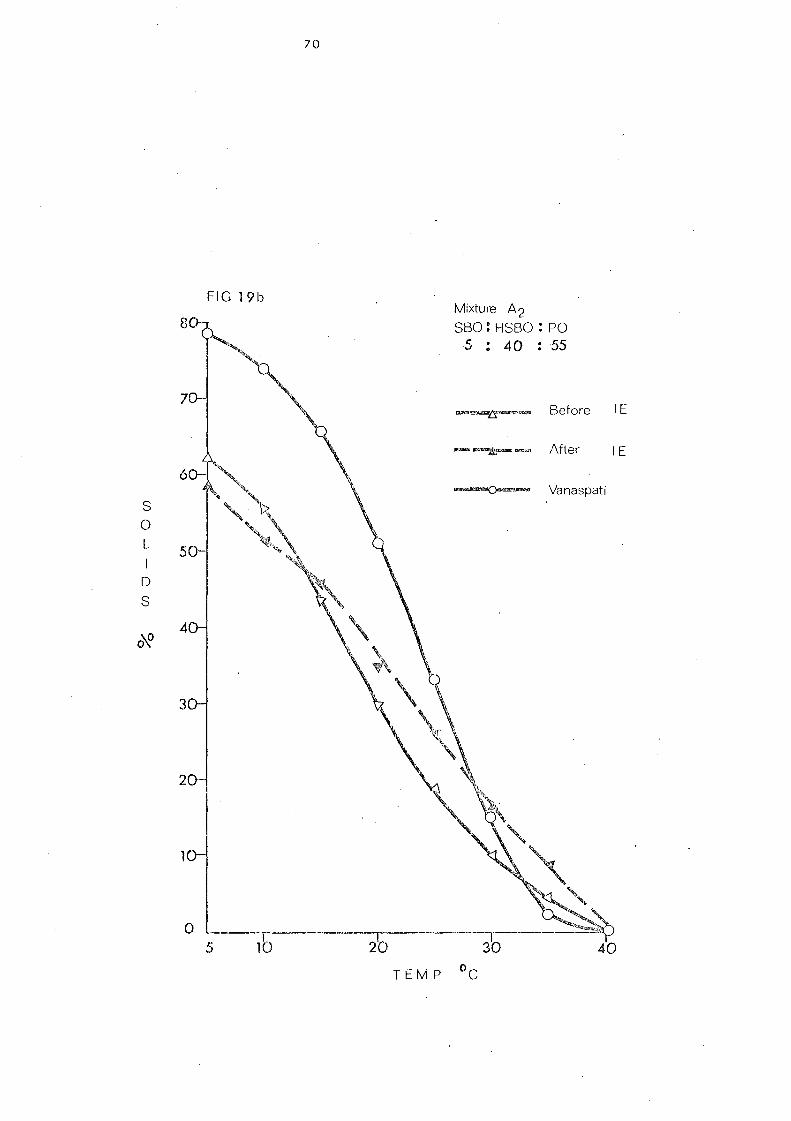
8
S 0 L 50-
D
S
4 ~
o
70
FIG 19b Mixture A2
SBO : HSBO : PO 5 : 40 : 55
[J.1'5.~Mn;;: Before
-~""'""'~ After
~ Vanaspati
IE
IE
5 --'-----------:r:-------;b
10 20 40
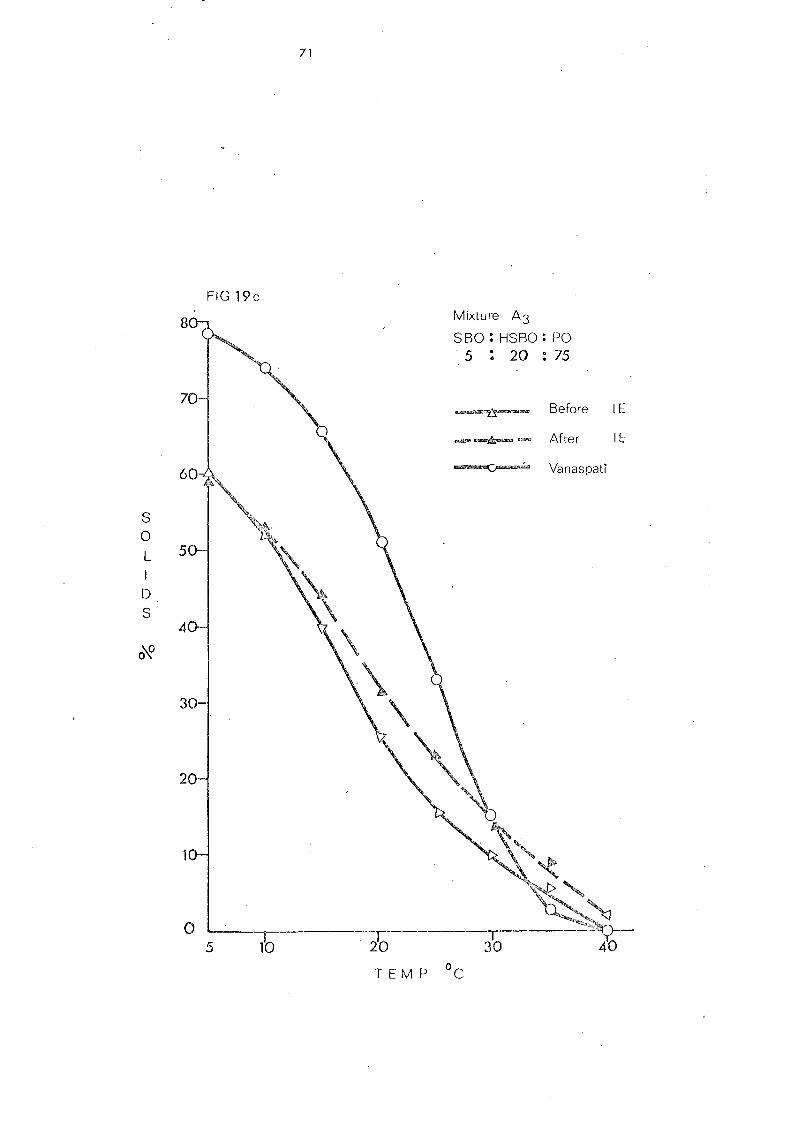
FIG19c
S 0 L 5
I
D
S 4
~
30-
o 5
71
10
Mixture A3
SBO: HSBO: PO 5 ; 20 : 75
~ Before IE
"""" .",.,._ .,,- After IE
~ Vanaspati
T-30
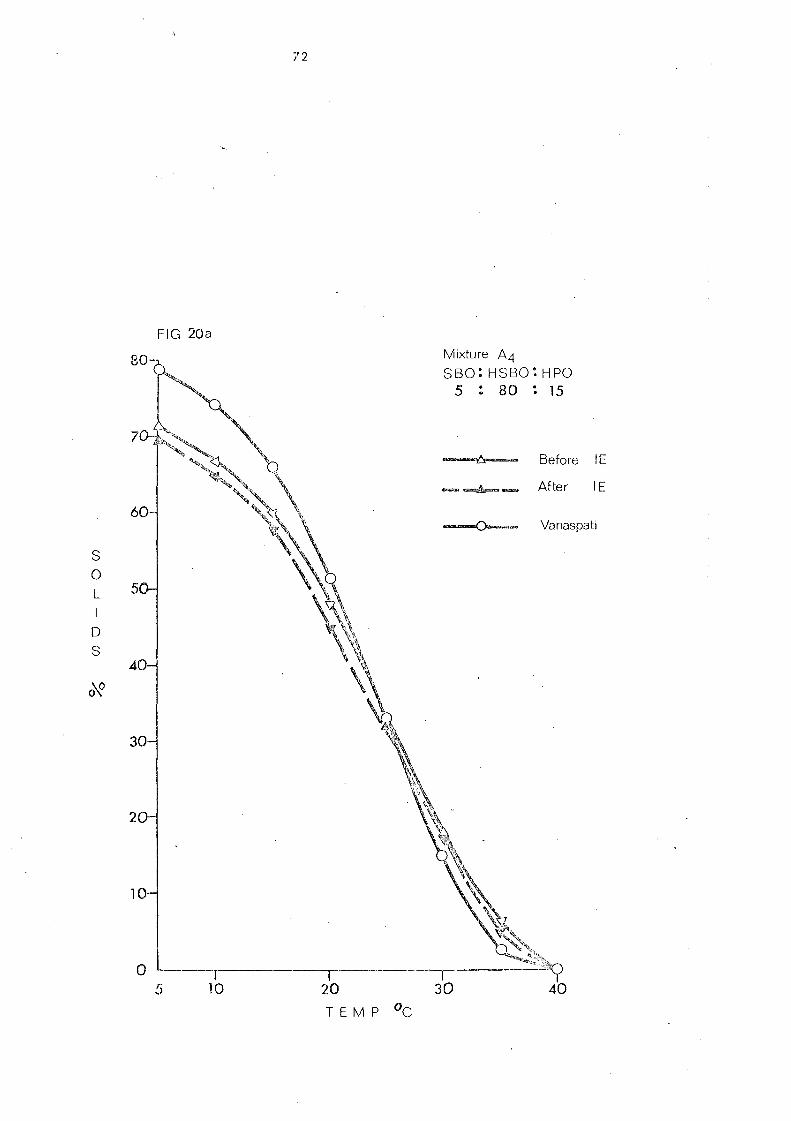
FIG 20a
60
S 0 L 5
I
D S
40
oY!
30
2
10
o --r 5 10
72
Mixture A4
SBO:HSBO:HPO 5 : 80 : 15
~ Before
-~-- After
IE
IE
---0--- Vanaspati
T----- I 20 30 40
T E M P °c
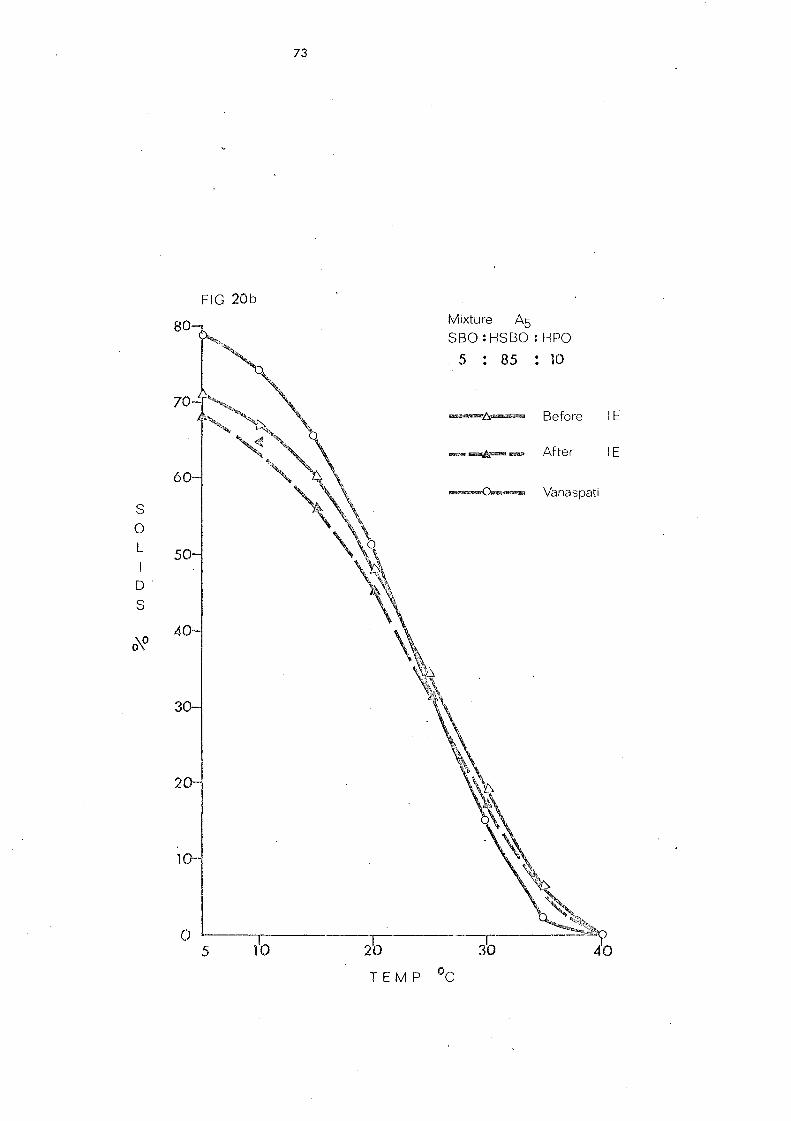
73
FIG 20b
Mixture A5
SBO : HSBO : HPO
5 : 85 : 10
--~ Before IE
~~I&~ After IE
6 --0- Vanaspati
S 0 L 50 I D'
S
o'f 40·-
3
20-
4..,~. -,-::-___'Py 30 40
10-1
o -----,----.--.......---5 10 26
T EM P °c
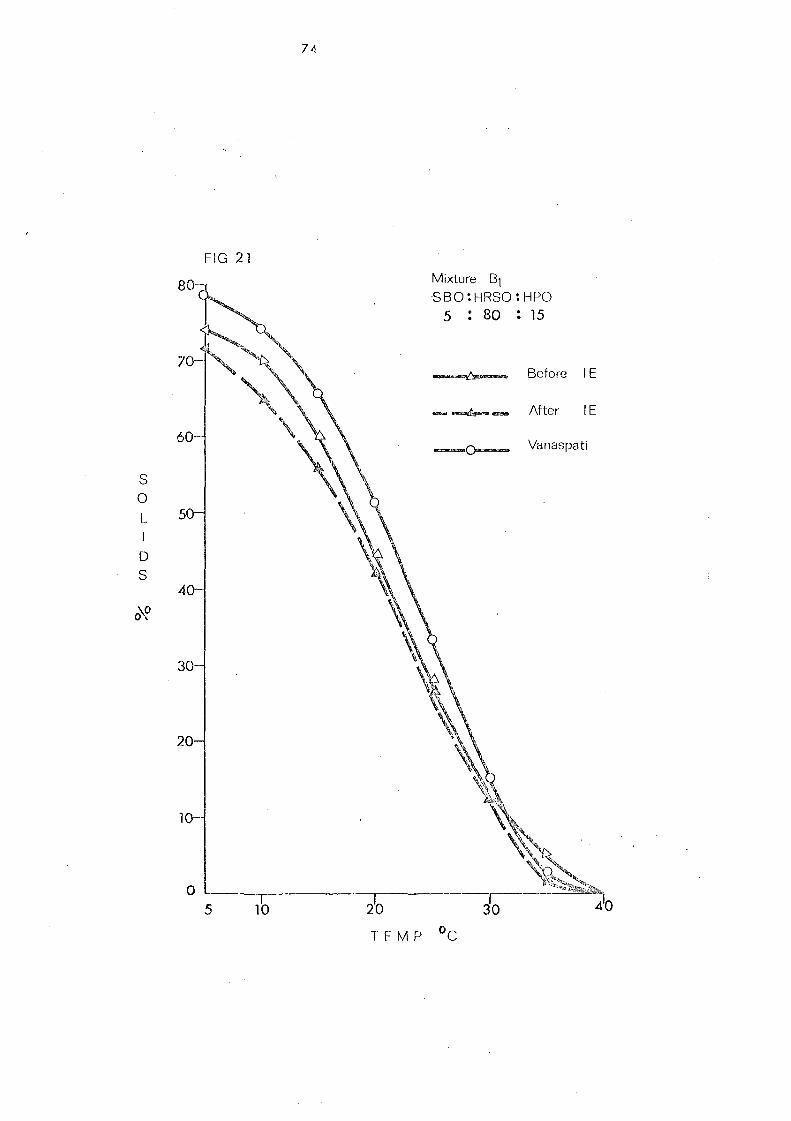
60
S 0 L 5
I
D S
4
oV!
30
20
10
o
74
FIG 21
5
Mixture B1
SBO: HRSO: HPO 5 : 80 : 15
~ Before
_iII!I~CIISI!!JIIIt After
IE
IE
-0---- Vanaspati
do
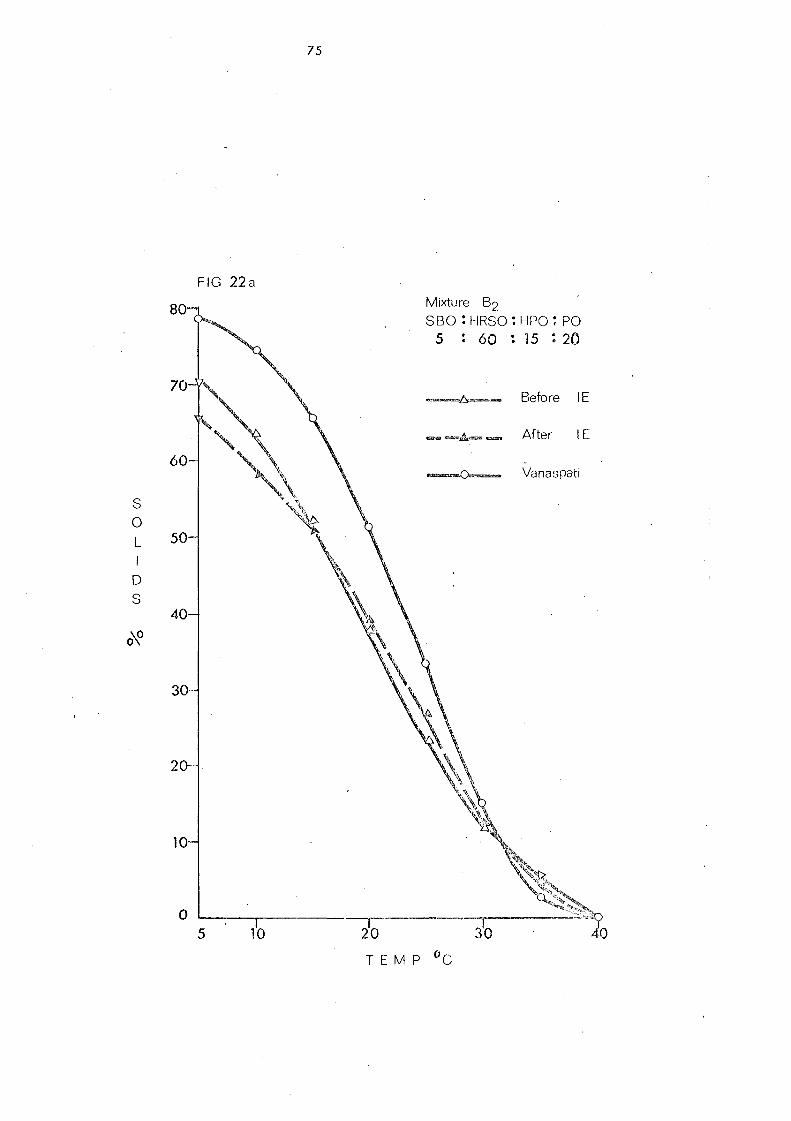
75
FIG 22a
ao- Mixture B2 SBO : HRSO : HPO : PO
5 . 60 : 15 : 20 .
70 ~-b--- Before IE
CUG!!I~eA.~~ After IE
60 ~ Vanaspati
S
0 L 5
0
S 40
o'f
30
2
10
o
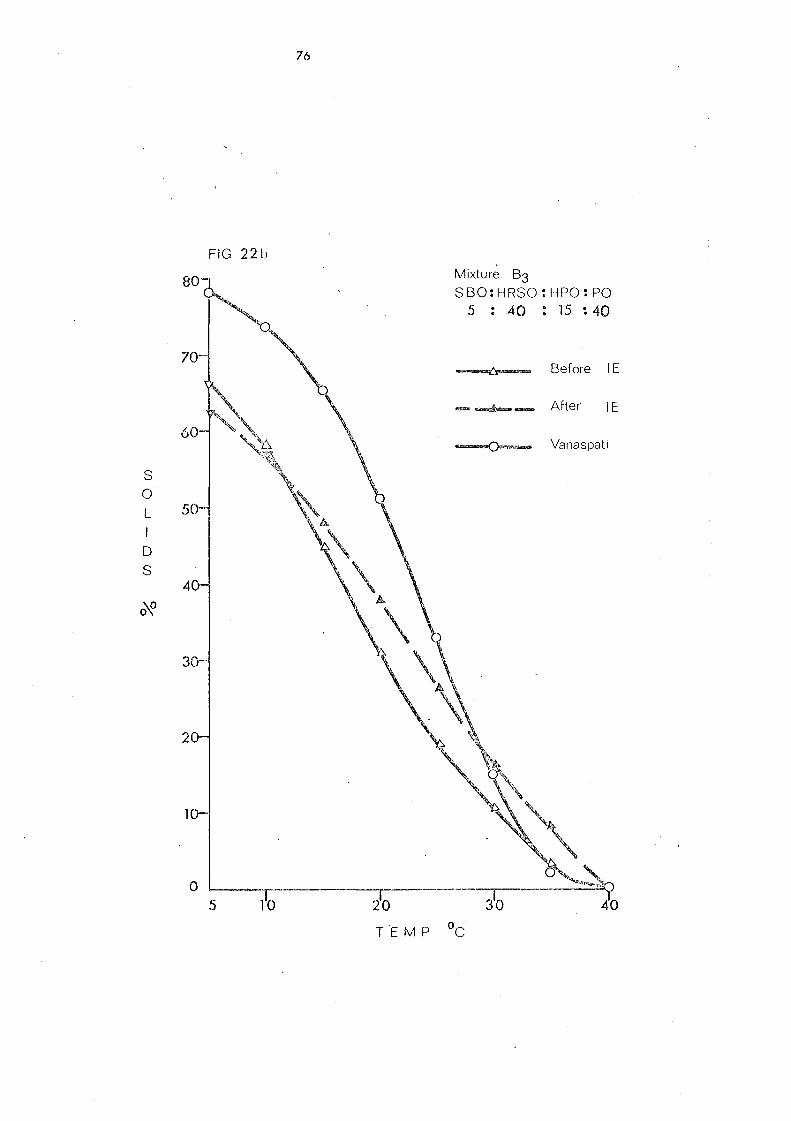
S 0 L
D S
o'f
70
60
50
4
3D-
2
10-
76
FIG 22 b
Mixture B3
SBO: HRSO: HPO: PO 5 : 40 : 15 : 40
~ Before IE
__ ~_ /i.fter IE
o '-5--11Q-----~rO
T'E M P °c
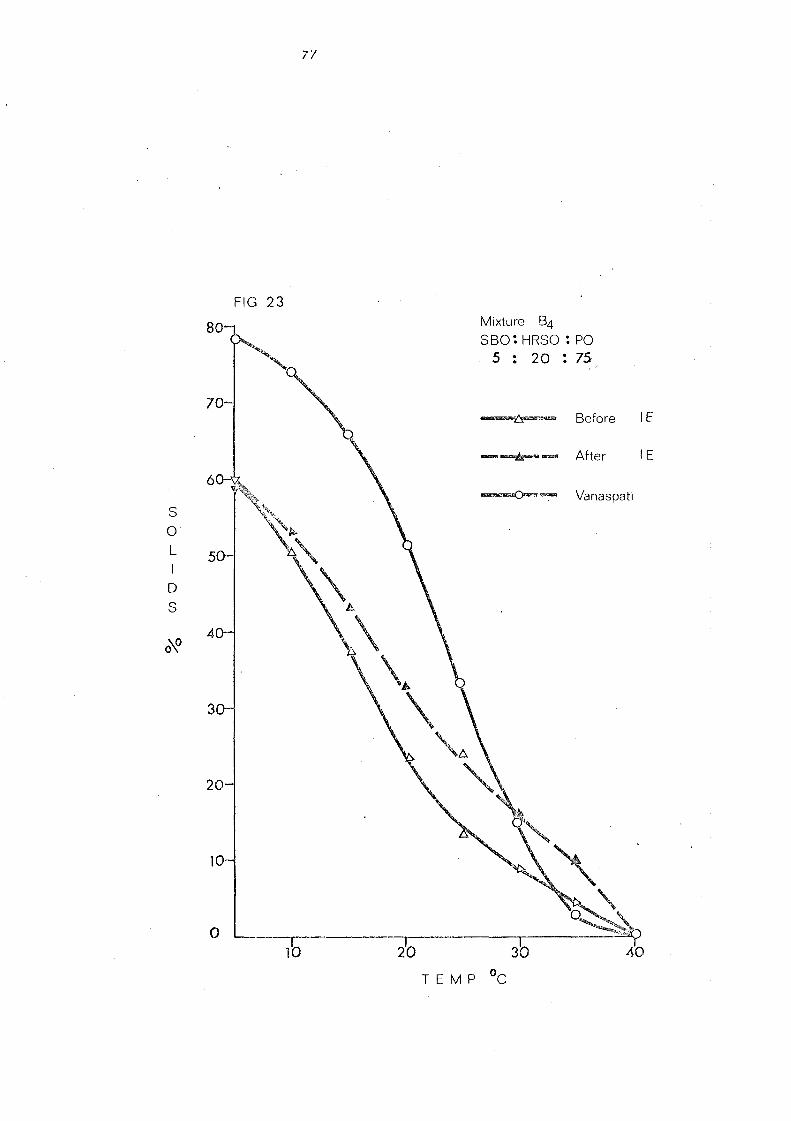
S
0 L I
D S
oV!
80
70
6
5
40-
3
20
o
77
FIG 23
-r:--20
Mixture B4 SBO: HRSO : PO
5 . 20 : 75 .
~.".. Before IE
-~"""" After IE
~ Vanaspati
40
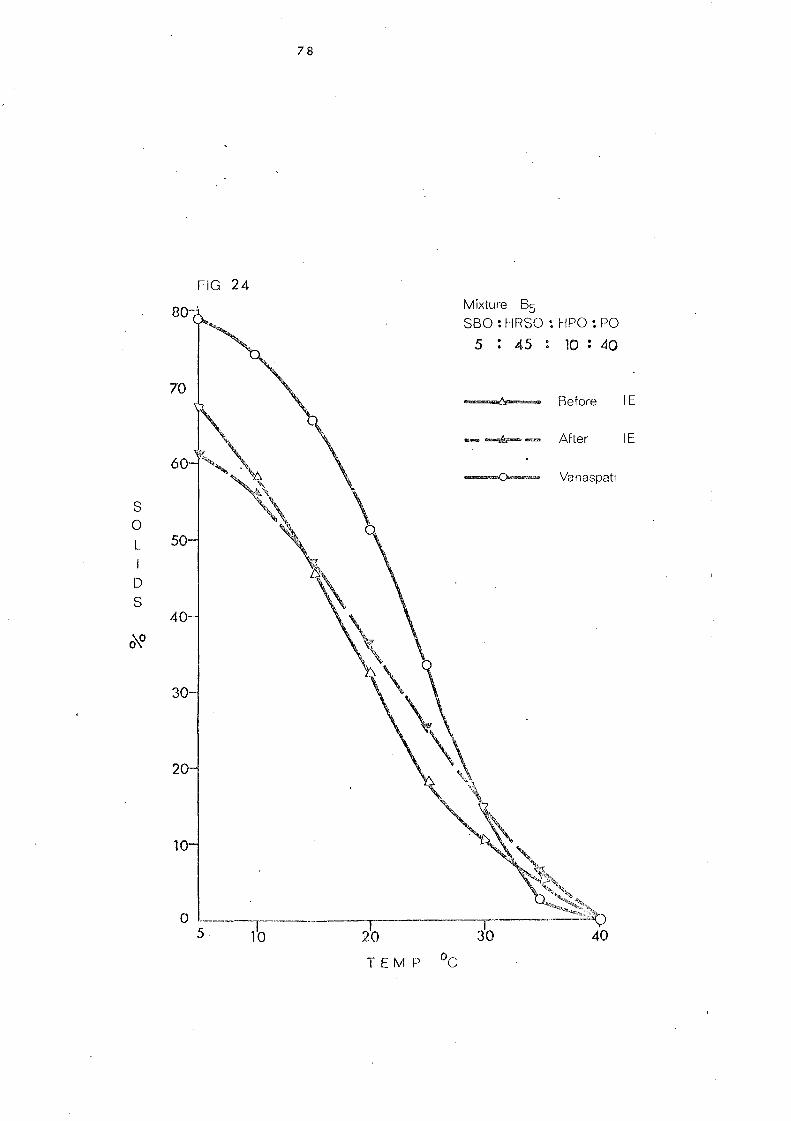
S o L
I
D
S
FIG 24
70
50-
40
30
2
10
o .. ---_-y-5 10
78
\
I 20
T EM P °c
Mixture B5
SBO: HRSO ~ HPO ~ PO
5 : 45 : 10: 40
~ Before IE
"""'" ~-..", After IE
I 30 40
79
SFC Curves of the Blends 1 and 2 Compare~~!..~Nit~That~ Vanaspatl..
The SFC curve of vanaspati is characte 1'i sed by a sharp dec rea se
o 0 in solids content between 20 and 30 C. The solid content is
about SO% at 20 0 and below S% at 350
• Liquifac tion is complete
at 400
G [See Fig. 19a].
The changes in the solids contents of the mixtures A 1 [Fig.
19a) and A 2 [Fig. 19b] after intere ste rification are somewhat
alike, particularly between 2S-400
• However, the solids content
of the interesterified products at .:SSo is higher than that of
vanaspati ..
The pre sence of high proportions of native palm oil (7 S%) in
the mixture A 3 [Fig. 19c J ha s a significant effect after inter-
esterification. This is reflected in a considerable increase in
solids content between 100
and 3So
and leads to a considerable
deviation from the vanaspati SFC curve.
The inc orporation of hardened palm oil (IS% and 10%) in
blends A4 [Fig. 20a] and AS [Fig. 20bJ respectively results in
SFC curves fairly sirn.ilar to that of vanaspati. Intere ster ification
slightly reduces the solids content consistently throughout the
temperature range in ve stigated. The Ie s s significant changes
after inte,resterification may be associated with the fact that
hyd rogenation normally results in stereomutation of cis to trans
double bonds which is accompanied by an increase in melting point.
Similar changes may be seen in B 1 [Fig. 21] containing the same
constituents except that hardened rapeseed oil replaced hardened
soybean oil.
80
Interesterification causes little change in solids content of
the mixture B2 [Fig. 22a]. The randomised product ha s a low
solid s content « 4 0%) at 200
and « 5%) at 350
•
Before intere ste rification both mixture s B 3 (Fig. 22b] and
B5 [Fig. 241 show more than 30% solids at 200
and less than
5% solids at 350
C. Randomisation leads to an increase in solids
.~ 0 content particularly in the tempera,ture range of 20-35 C.
However, the solids content of the products below 300
remain
lower than that of vanaspatL
The c~anges in the solids content of the mixture B4 [Fig. 23 J
after randomisation are quite similar to that of A 3 [Fig. 19c]
since both mixtures contain the same proportions of components
except that hardened soybean oil is replaced by hardened rapeseed
oil. The SFC curve of the interesterified product varies
,considerably from the vanaspati.
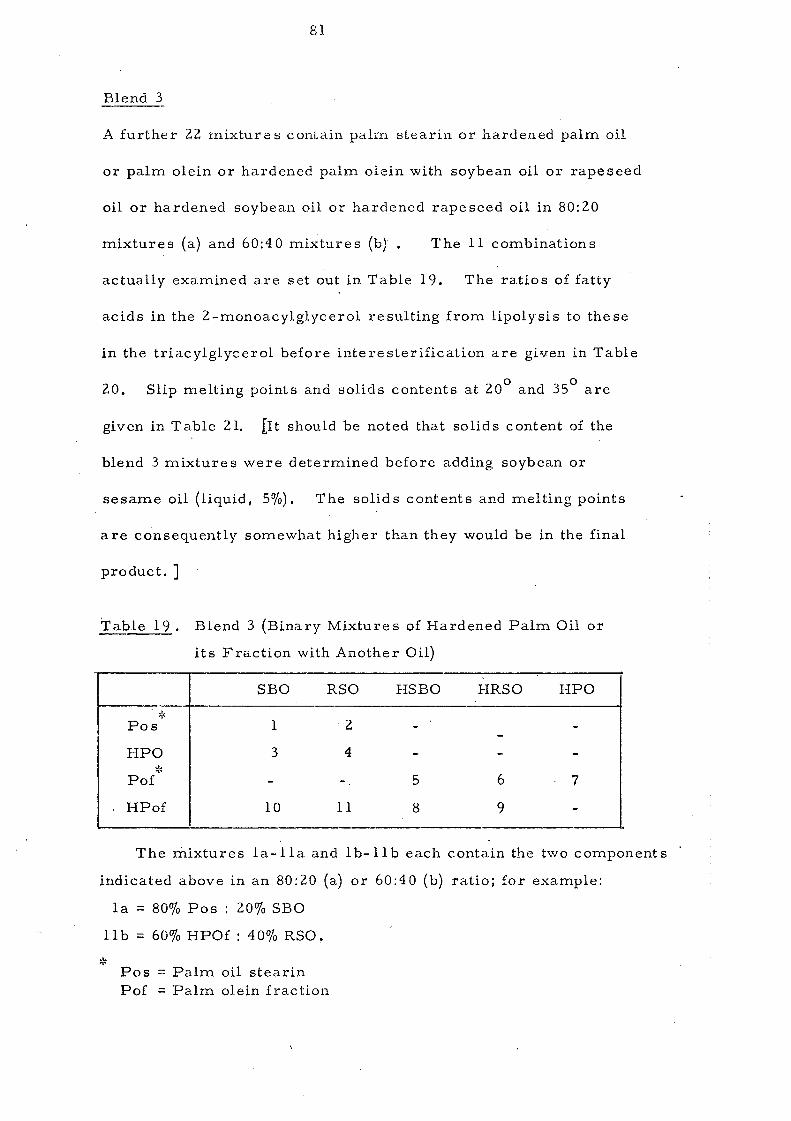
81
Blend 3
A further 22 mixture s contain pall-n stearin or hardened palm oil
or palm olein or hardened palm olein with soybean oil or rapeseed
oil or hardened soybean oil or hardened rape seed oil in 80: 20
mixture s (a) and 60:40 mixture s (b) • The 11 combinations
actually examined are set out in Table 19. The ratios of fatty
acids in the 2-monoacylglycerol resulting from lipolysis to these
in the triacylglycerol before interesterification are given in Table
2.0. Slip melting points and solids contents at 200
and 350
are
given in Table 21. [It should be noted that solids content of the
blend 3 mixtures were determined before adding soybean or
sesame oil (liquid, 5%). The solids contents and melting points
are consequently somewhat higher than they would be in the final
product. J
Table!.1.. Blend 3 (Binary Mixture s of Hardened Palm Oil or
its Fraction with Another Oil)
SBO RSO HSBO HRSO HPO
"* Pos 1 "2 - --HPO 3 4 - - -
",< Pof - - 5 6 7
HPof 10 11 8 9 -
The mixtures la-lla and Ib-llb each contain the two components
indicated above in an 80:20 (a) or 60:40 (b) ratio; for example:
la = 80% Pos : 20% SBO
11 b = 60% HPOf : 40% RSO.
* Pos == Palm oil stearin Pof = Palm olein fraction
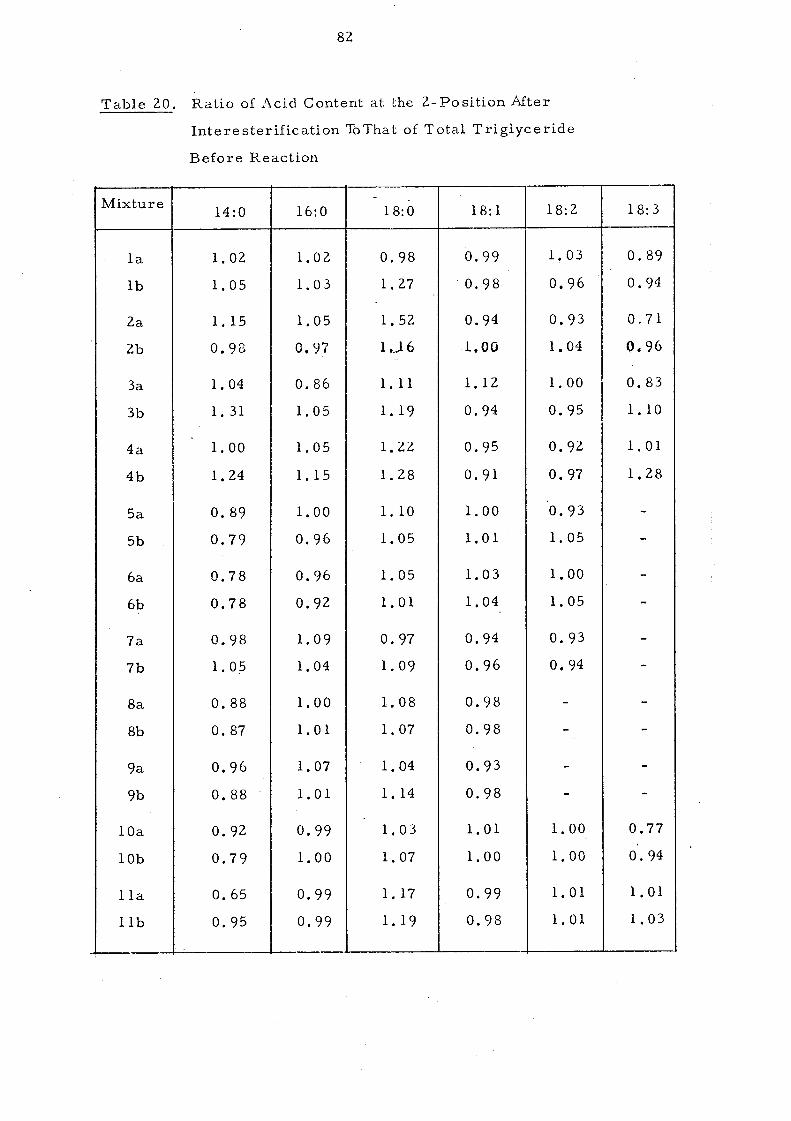
82
Table 20. Ratio of Acid Content at the 2- Po sition After
Interesterification ThThat of Total Triglyceride
Before Reaction
-Mixture
14:0 16:0 18:0 18: 1 18:2
la 1. 02 1. 02 0.98 0.99 1. 03
Ib 1. 05 1. 03 1. 27 0.98 0.96
2a 1. 15 1. 05 1. 52 0.94 0.93
2b 0.98 0.97 1 •. ) 6 1.00 1. 04 -
3a 1. 04 0.86 1. 11 1. 12 1. 00
3b 1. 31 1. 05 1. 19 0.94 0.95
4a 1. 00 1. 05 1.22 0.95 0.92
4b 1. 24 1. 15 1. 28 0.91 0.97
5a 0.89 1. 00 1. 10 1. 00 0.93
5b 0.79 0.96 1. 05 1.01 1. 05
6a 0.78 0.96 1. 05 1. 03 1.00
6b 0.78 0.92 1. 01 1.04 1. 05
7a 0.98 1. 09 0.97 0.94 0.93
7b 1. 05 1. 04 1. 09 0.96 0.94
8a 0.88 1. 00 1. 08 0.98 -
8b 0.87 1.01 1. 07 0.98 -
9a 0.96 1. 07 1. 04 0.93 -
9b 0.88 1. 01 1.14 0.98 -
lOa 0.92 0.99 1. 03 1. 01 1. 00
lOb 0.79 1. 00 1. 07 1. 00 1. 00
lla 0.65 0.99 1. 17 0.99 1. 01
llb 0.95 0.99 1. 19 0.98 1. 01
18: 3
0.89
0.94
0.71
0.96
0.83
1. 10
1. 01
1.28
--
--
--
--
--
0.77
0.94
1. 01
1. 03
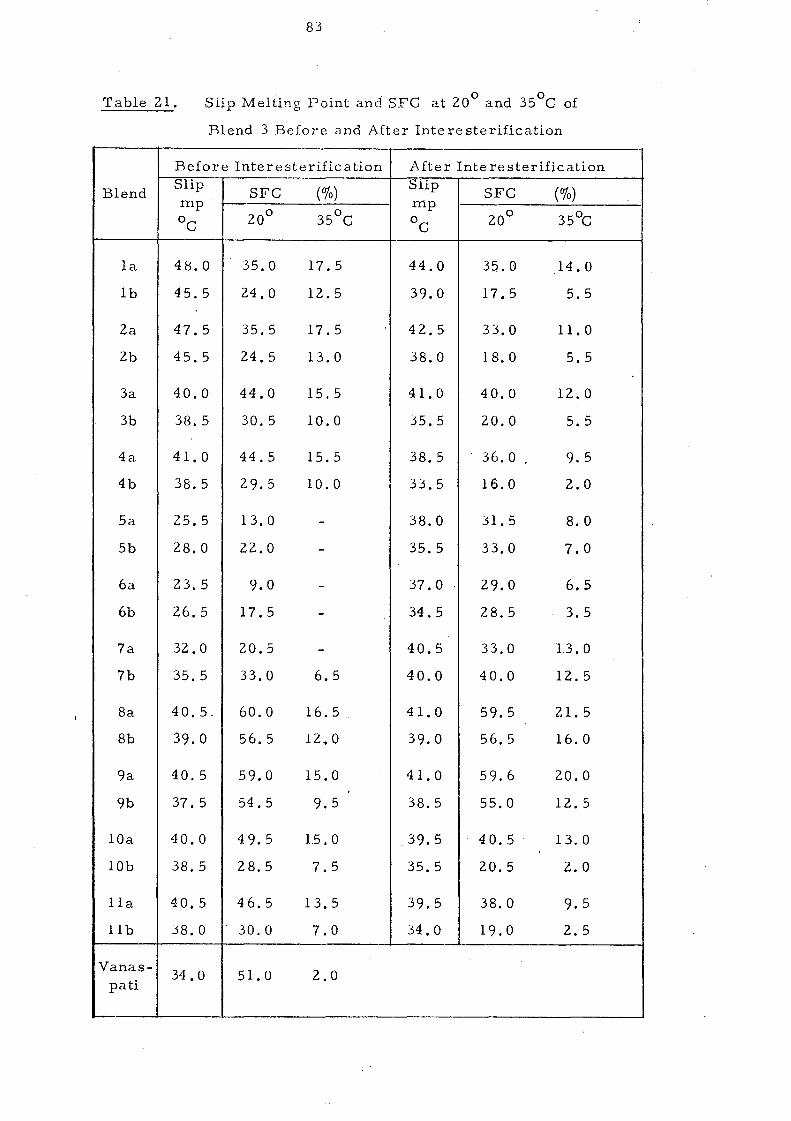
83
Table 21. Siip Melting Point and SFC at 20° and 35°C of
Blend 3 Before and After lnte re sterification
Before lnteresterification After lnteresterification
Blend Slip
SFC (%) Slip SFC (%) mp - nip
°c 20° 35°C °c 20° 35°C
la 48.0 35.0 17.5 44.0 35.0 14.0
1b 45.5 24.0 12.5 39.0 17.5 5.5
2a 47.5 35.5 17.5 42.5 33.0 11. 0
2b 45.5 24.5 13.0 38.0 18.0 5.5
3a 40.0 44.0 15.5 41.0 40.0 12.0
3b 38.5 30.5 10.0 35.5 20.0 5.5
4a 41.0 44.5 15.5 38.5 36.0 9.5
4b 38.5 29.5 10.0 33.5 16.0 2.0
Sa 25.5 13.0 - 38.0 31. 5 8.0
5b 28.0 22.0 - 35.5 33.0 7.0
6a 23.5 9.0 - 37.0 29.0 6.5
6b 26.5 17.5 - 34.5 28.5 3. 5
7a 32.0 20.5 - 40.5 33.0 1.3.0
7b 35.5 33.0 6.5 40.0 40.0 12.5
8a 40.5. 60.0 16.5 41.0 59.5 21. 5
8b 39.0 56.5 12 .. 0 39.0 56.5 16.0
9a 40.5 59.0 15.0 41.0 59.6 20.0
9b 37.5 54.5 9.5 38.5 55.0 12.5
lOa 40.0 49.5 15.0 39.5 4 0.5 13.0
lOb 38.5 28.5 7.5 35.5 20.5 2.0
lla 40.5 46.5 13.5 39.5 38.0 9.5
11 b 38.0 30.0 7.0 34.0 19.0 2.5
Vanas-34.0 51.0 2.0
pati
84
Changes in Sll:.E.Jv1~ltii~lLPoint and SFC
Of the 22 slip melting points listed in Table 21 most are higher
than for vanaspati (8 are in the range of 35_400
, 9 are > 4 OOC).
Interesterification leads to changes in melting points (2 mixtures
< 350
, 14 in the range 35_400
and 6 > 4 OOC). It increase s the
slip melting point considerably in several mixtures, particularly
in the 5a-7a and 5b-7b mixtures in,which palm olein is present
in relatively high proportions. In mixtures la-4a and 1 b-4b
except 3a, inte re sterification dec rease s the melting point. The
same effect is also observed in the case of mixtures lOa and lOb.
lla and 11 b which consi st of hardened palm olein and liquid oils.
The solid s content at 200
range s from 9- 600/0. The change s
in solids content at 200
after interesterification varie s with the
nature of the component mixtures. There, is usually a decline
in solids content except for mixture s 5, 6 and 7 which contain
palm olein and a hard ened oil. The solid s content of the mixture s
containing hardened oil blend change very little after randomisation.
At 35 0 the solids content range from 0-180/0. Interesterification
causes a considerable decrease to the solids content of mixtures
1-4, 10 and 11 in which liquid 'oil s are present. However, the
value increases on randomisation with mixtures 5-9 all of which , .
contain hardened oil.
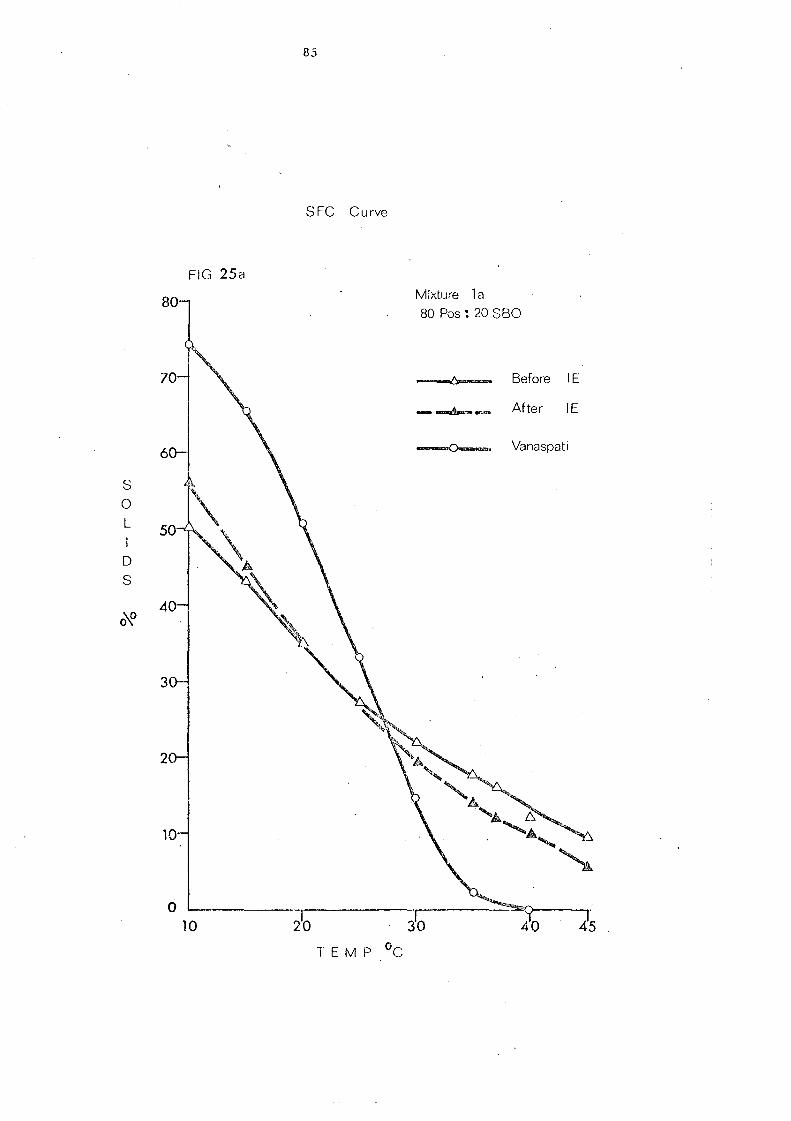
85
SFC Curve
FIG 25a
80 Mixture 1a 80 Pos : 20 SBO
70 ~ Before IE
_~"1lU After IE
~. Vanaspati
S 0 L
D S
4 ~
2
10
o 10 20
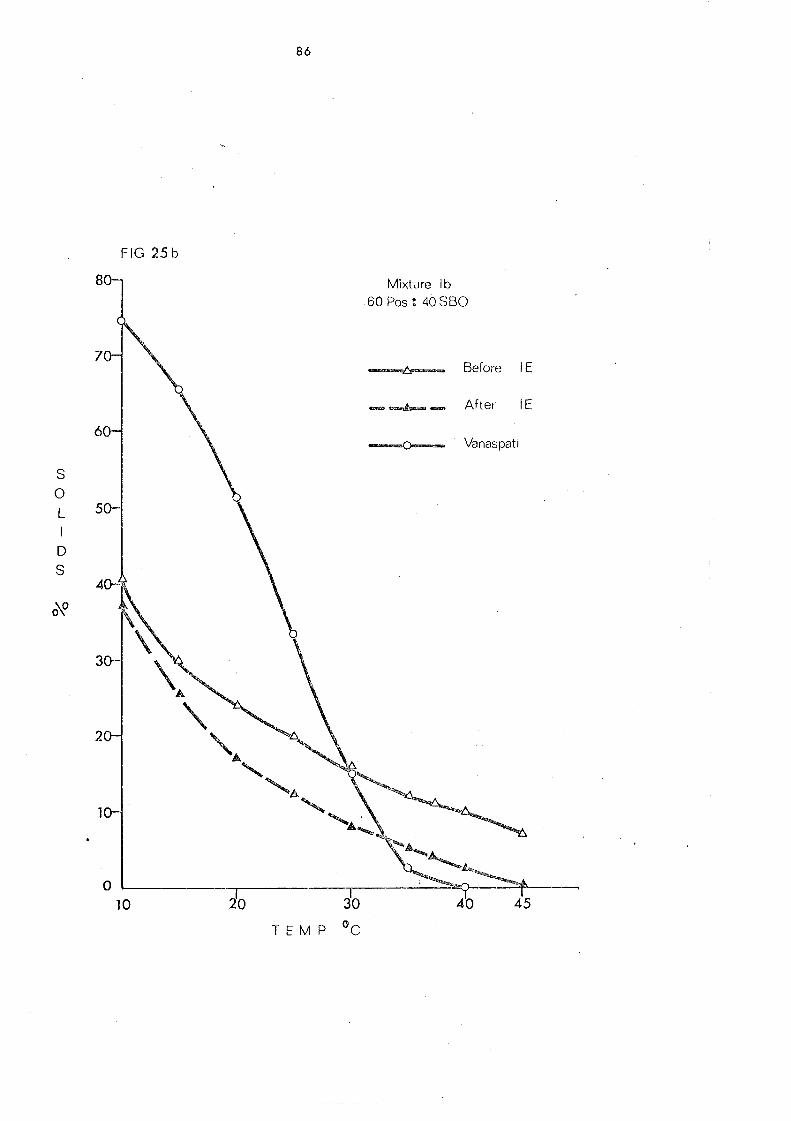
8
7
S 0 L 5
I
D S
~
3
2
o
86
FIG 25 b
10 20
Mixture Ib 60 Pos : 40 S80
~ Before
-~- After
-0-- Vanaspati
IE
IE
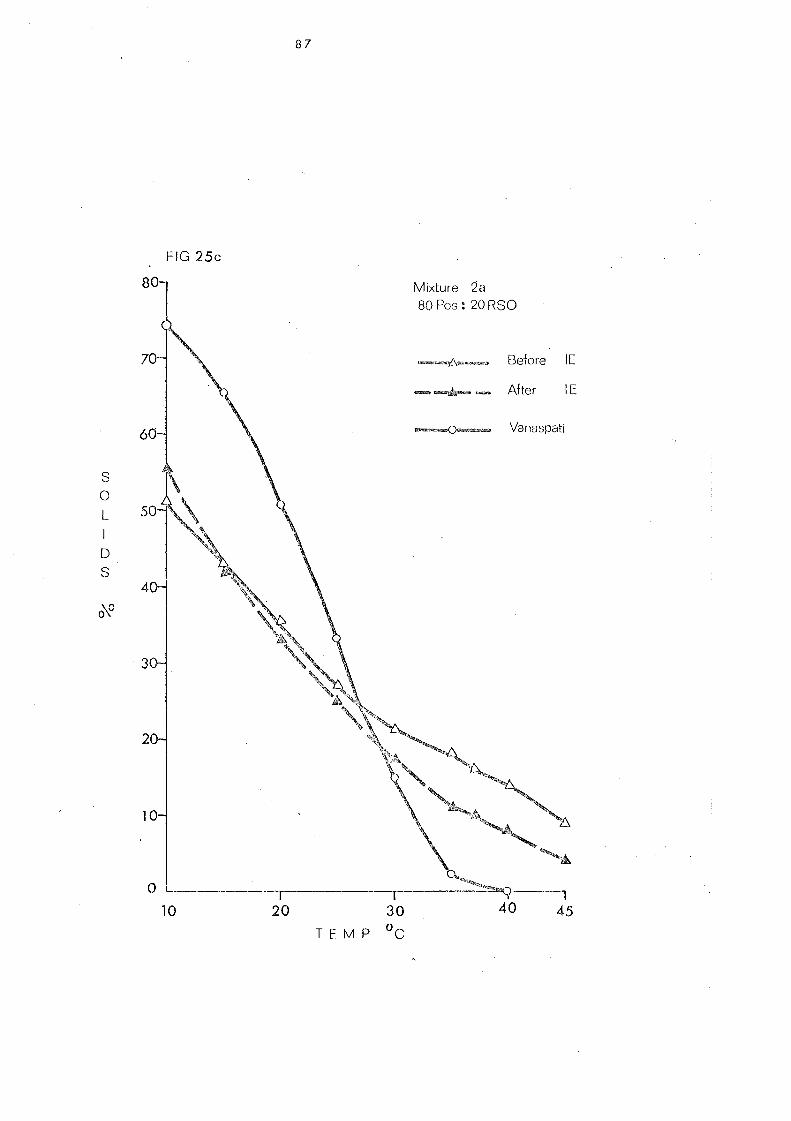
87
FIG 25c
80 Mixture 2a 80 Pas: 20 RSO
70 ~~-Ei:'.~ Before IE
~~DSiU(.!;SQit. After IE
60 ~ VanE1spati
S \ 0 L
I 0 S
0\°
3
20
10
O ~ .-------.-----·-T -- ---~----.l
10 20 30 40 45
T E M P °c
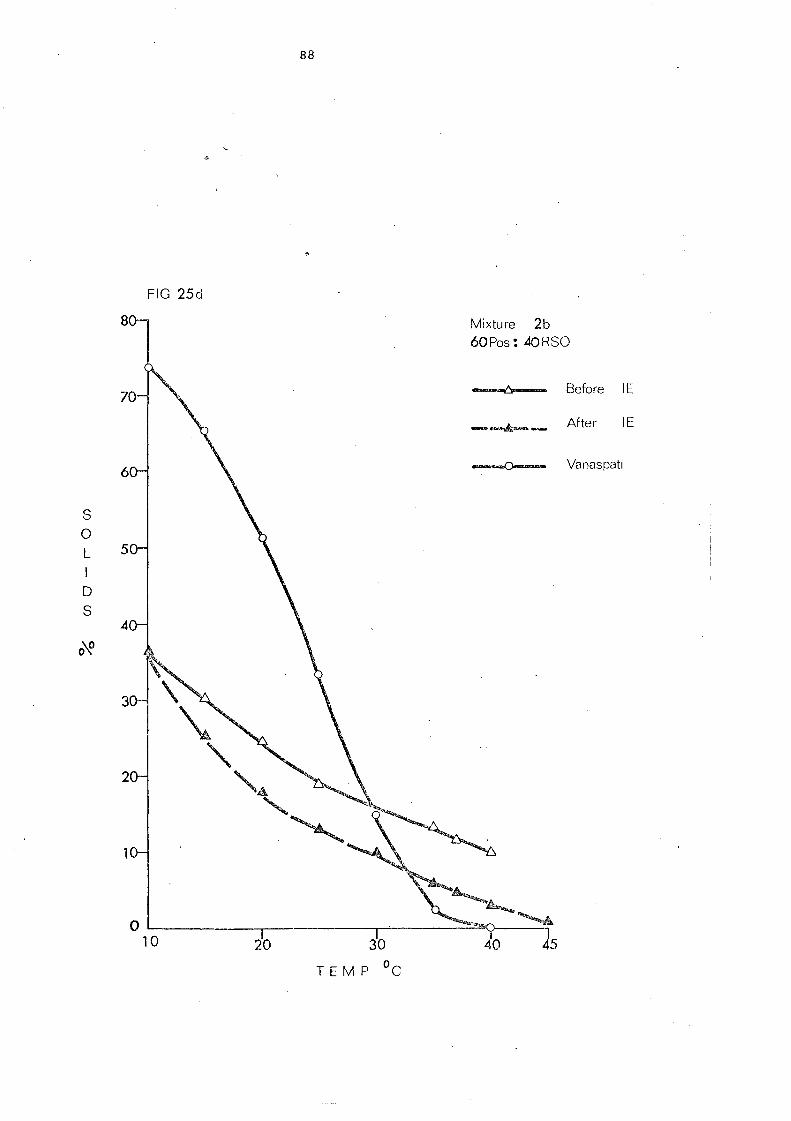
S o L I
D S
oV!
FIG 25d
70
o '---------,---10 2'0
88
Mixture 2b 60 Pas: 40 RSO
~ Before IE
--...A~ _ After IE
---0--...- Vanaspati
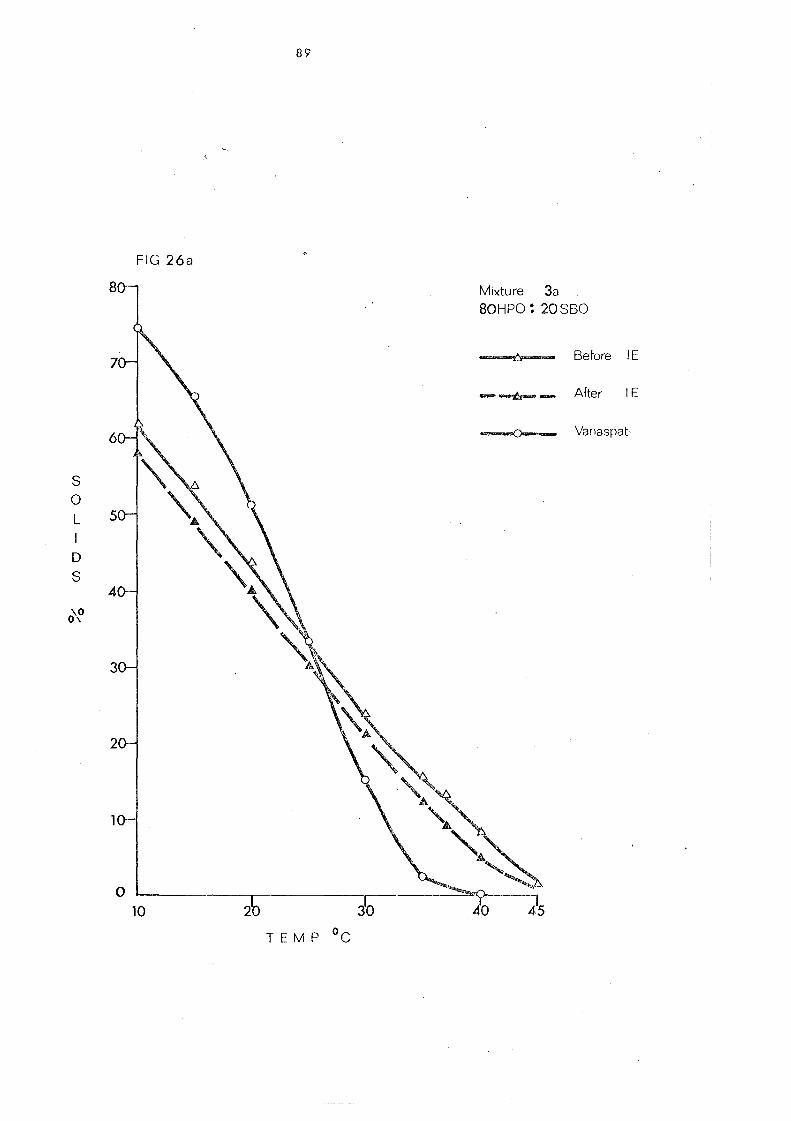
S o
80
L 5
I
D
S
o'f
o
FIG 26a
10
89
Mixture 3a
80HPO : 20 SBO
~ Before IE
_~_ After IE
~ Vanaspati
20
T E M P °c
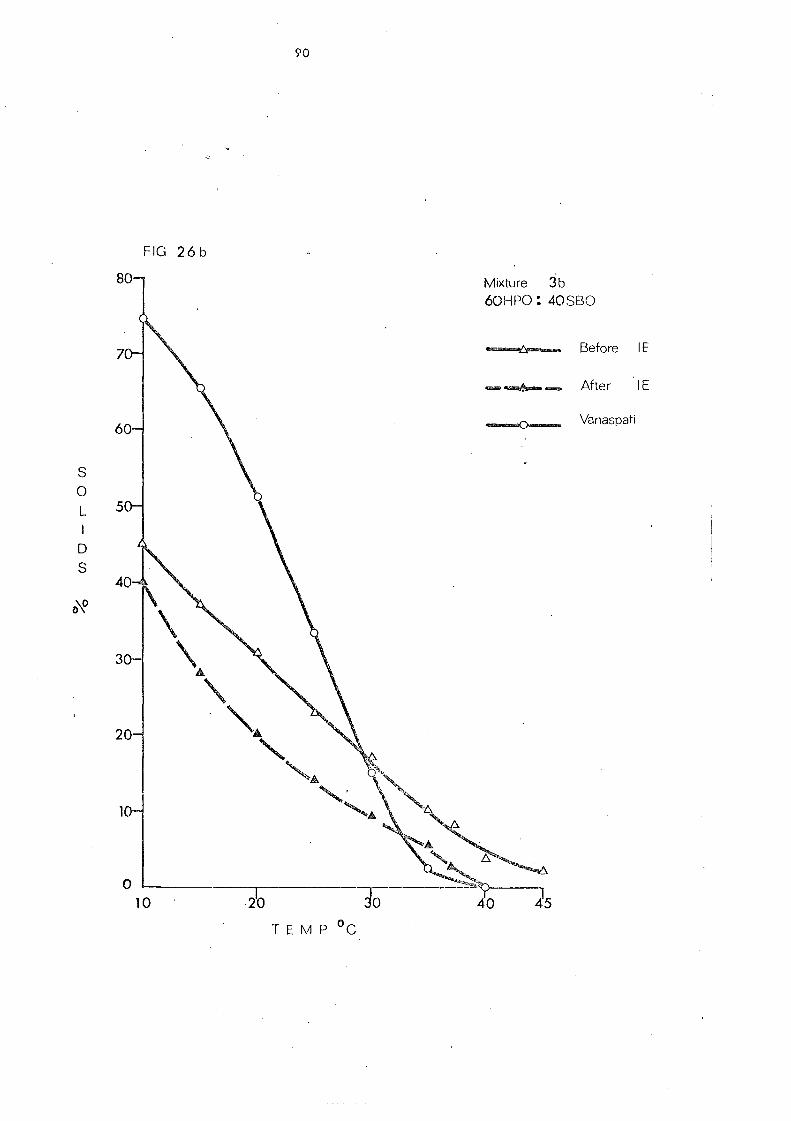
90
FIG 26b
80 Mixture 3b 60HPO: 40SBO
~ Before IE
-............ - After IE
.............0- Vanaspati
S 0 L
0 S
o'f
3
o 10 ·20 -To
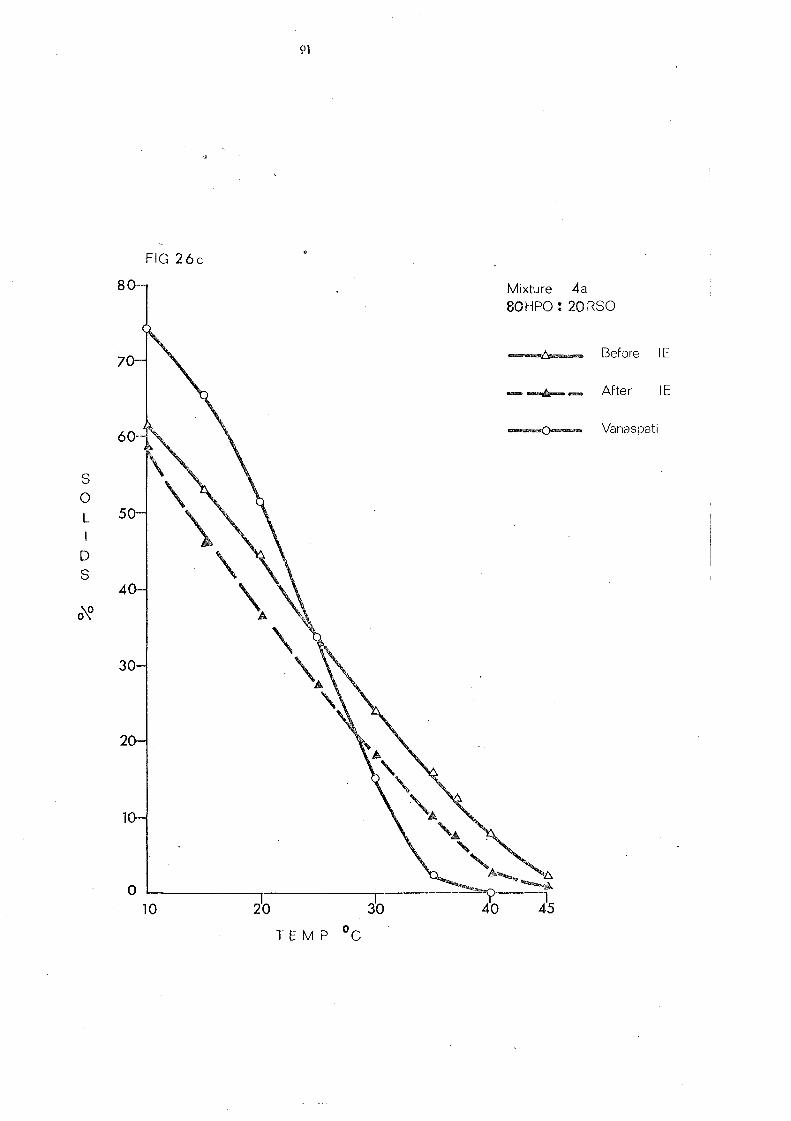
S o
70
L 5
I
D S
oY! 4
30
91
FIG 26c
Mixture 4a
80HPO: 20RSO
_ ........t-- __ After IE
o ~--------.--------,,------~~r-~ 10 20 40
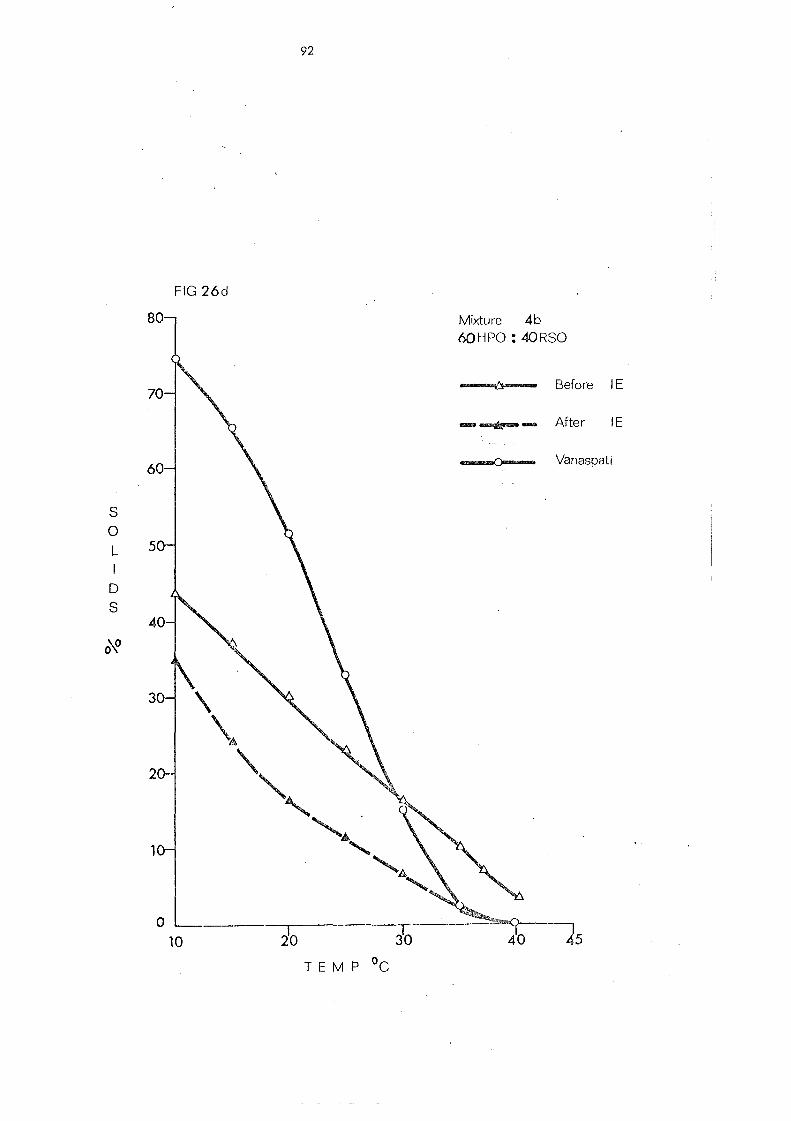
92
FIG 26d
80 Mixture 4b 60HPO : 4ORSO
70 ~- Before IE
-............ - After IE
60 --0-- Vanaspati
S
0 L
D S
o~
3 \ \A
20- '" , , " "
0
10 210 3'0 5
T E M P °c
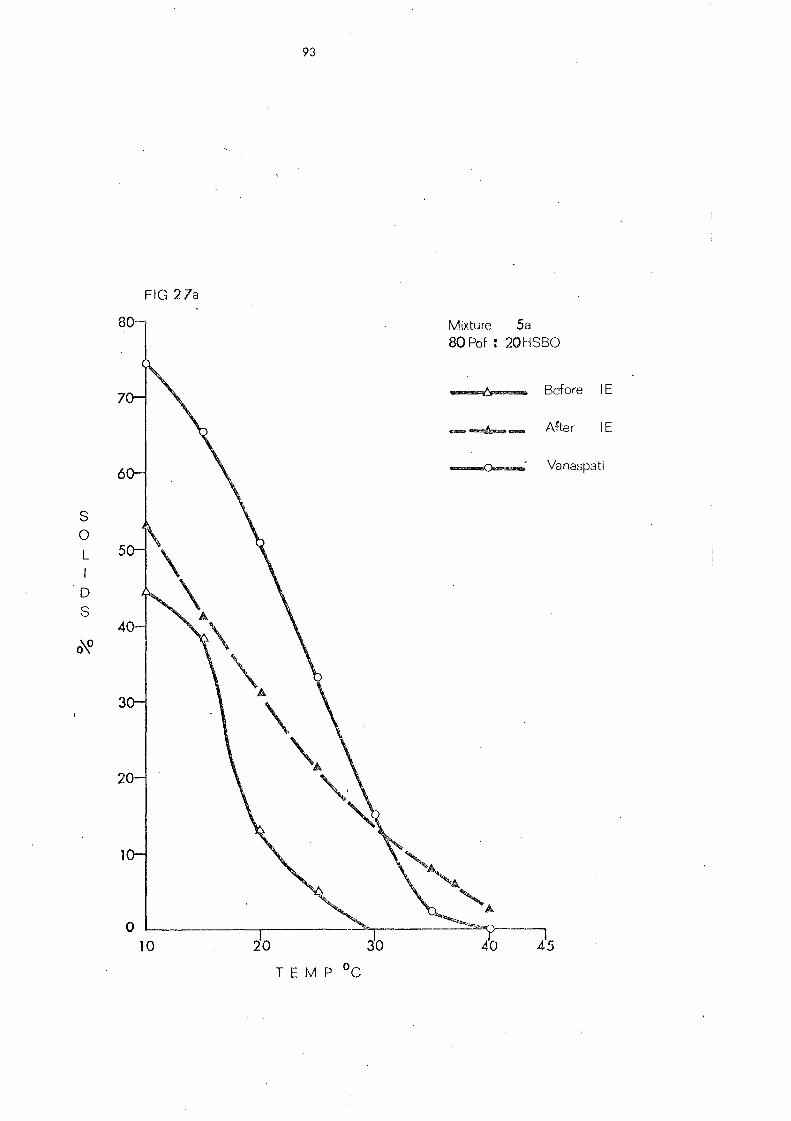
s o L
D
S 4
20
o
93
FIG 27a
!v1ixture 5a
80 Pof : 20HSBO
10
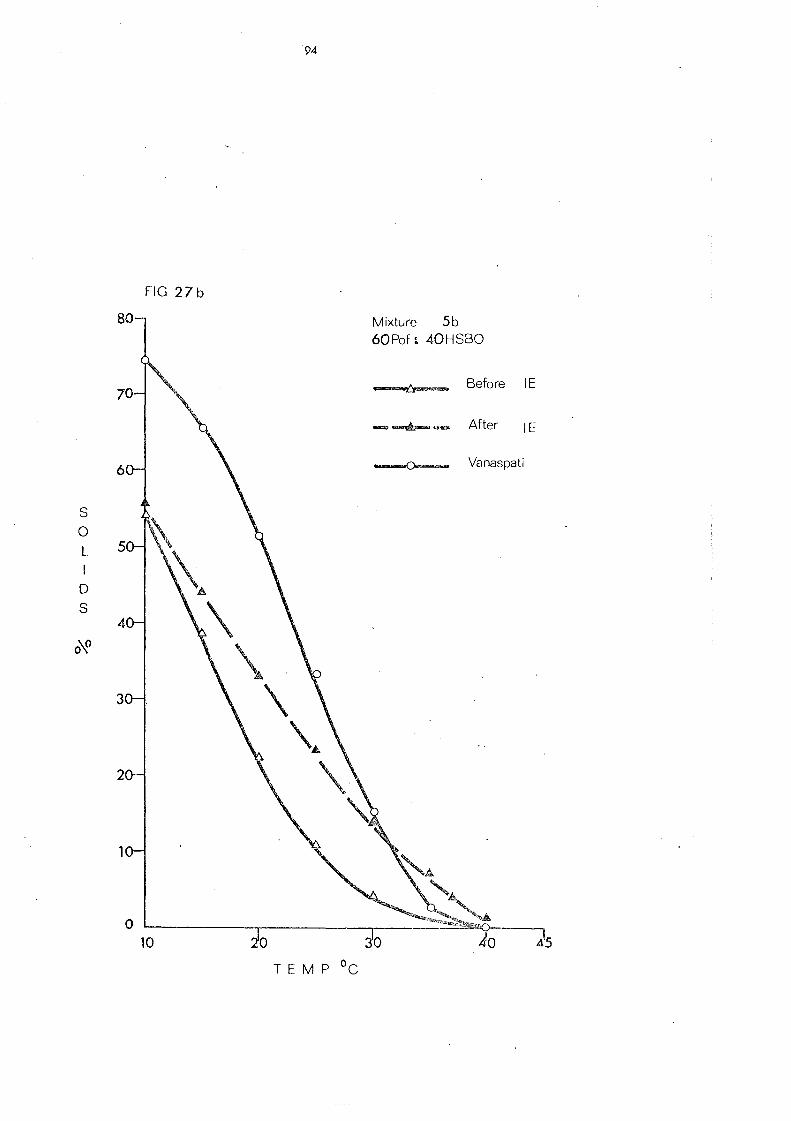
94
FIG 27 b
80 Mixture 5b 60Pof ~ 40HSBO
70 --6-- Before IE
-~.- After IE
---0-- Vanaspati
S 0 L
0 S
4-
o'f
3
2
o 10
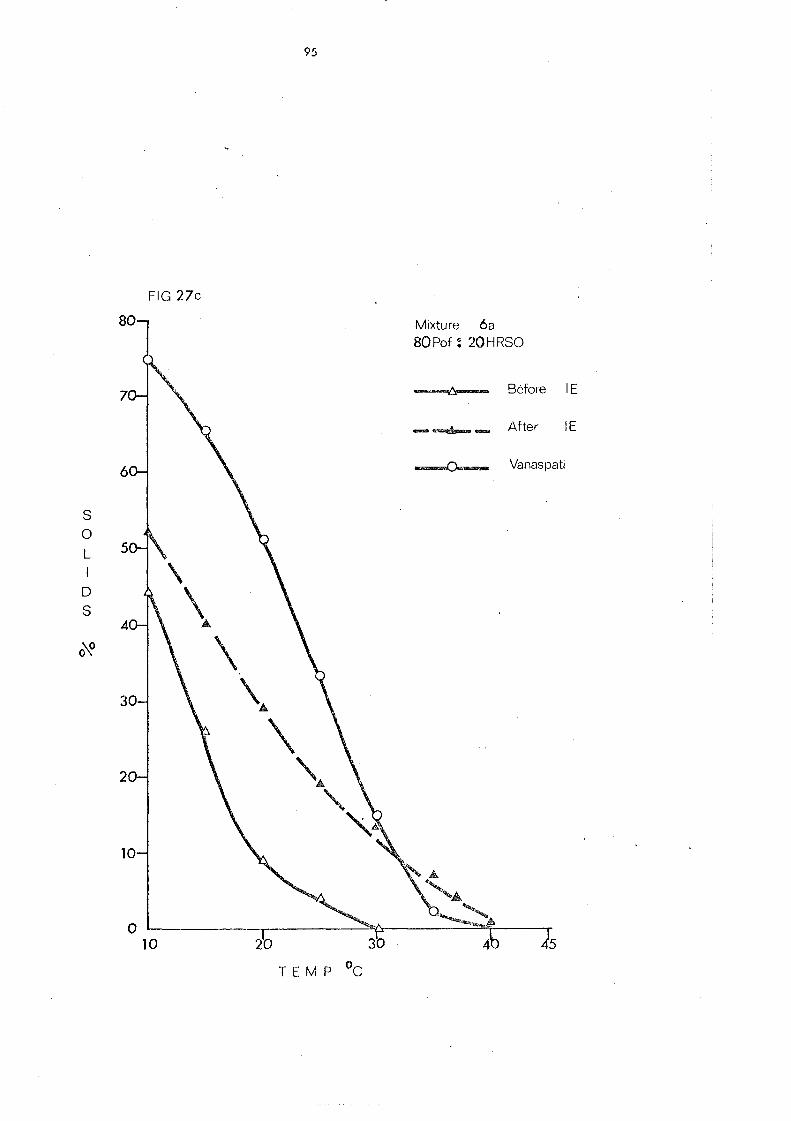
S o L
D S
95
FIG 27c
Mixture 6a 80Pof: 20HRSO
-=-~ Before IE
...... ~ ..... After IE
-0,.,........ Vanaspati
5
4
30
2
10
o ~-----------.----------~&-------~~ 10 2b 30
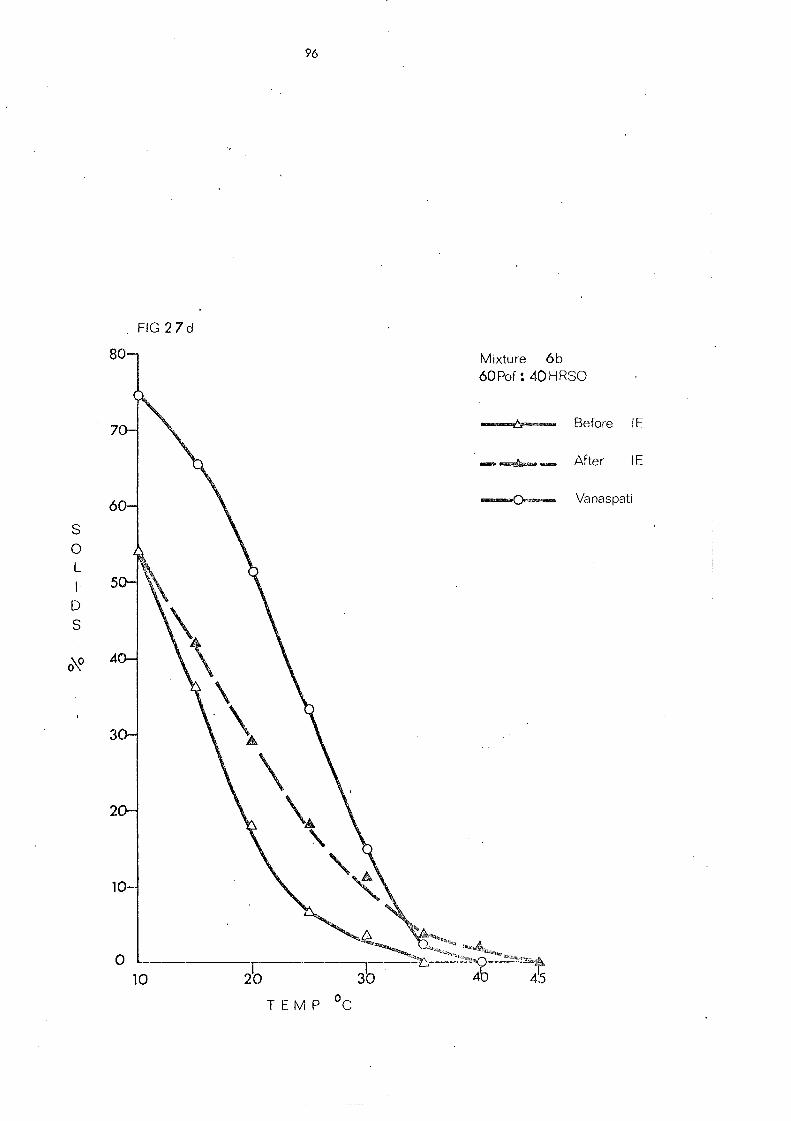
S o L
I D
S
o'f
80
3
2
10
o
96
FIG 27 d
Mixture 6b 60Pof: 40HRSO
~ Before IE
_~_ After IE
-0-- Vanaspati
10 20
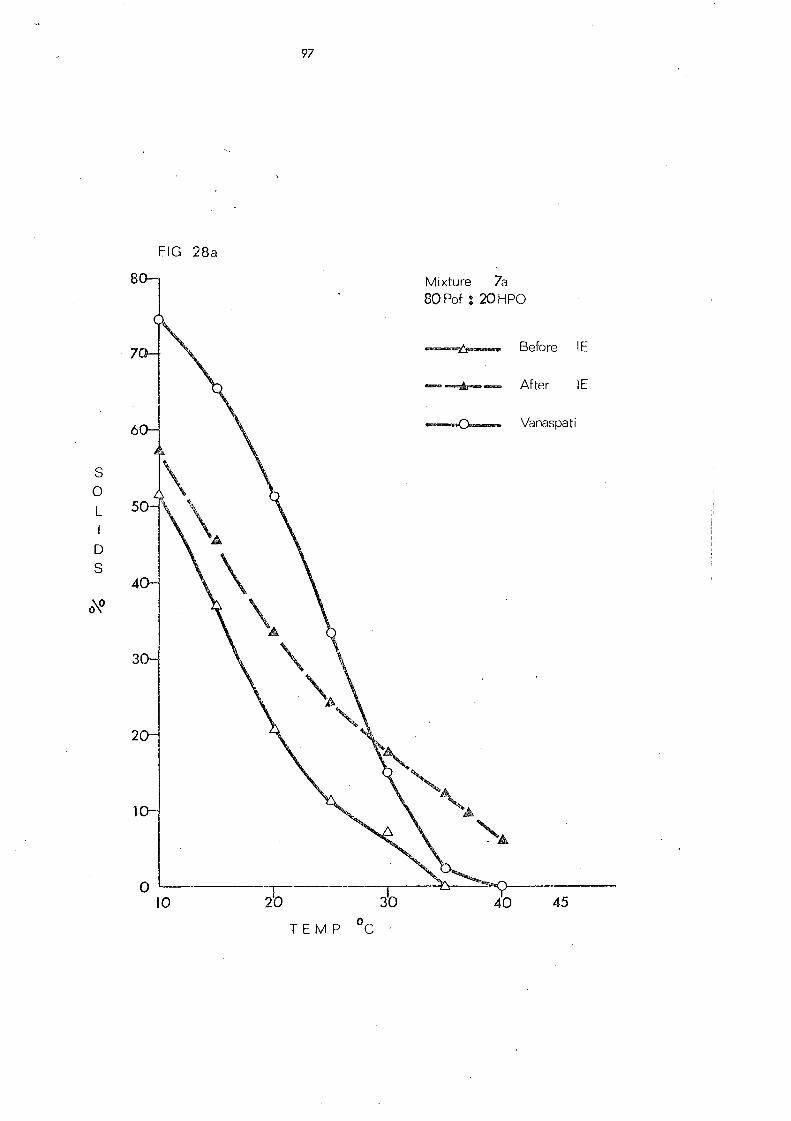
97
FIG 28a
8 Mixture 7a 80Pof: 2OHPO
-~ Before IE
-- "",,"*,"-- After IE
~ Vanaspati
S '\ 0 L
\" D S \
o'f ~
" , " 2
10-
o 10 40 45
T EM P °c .
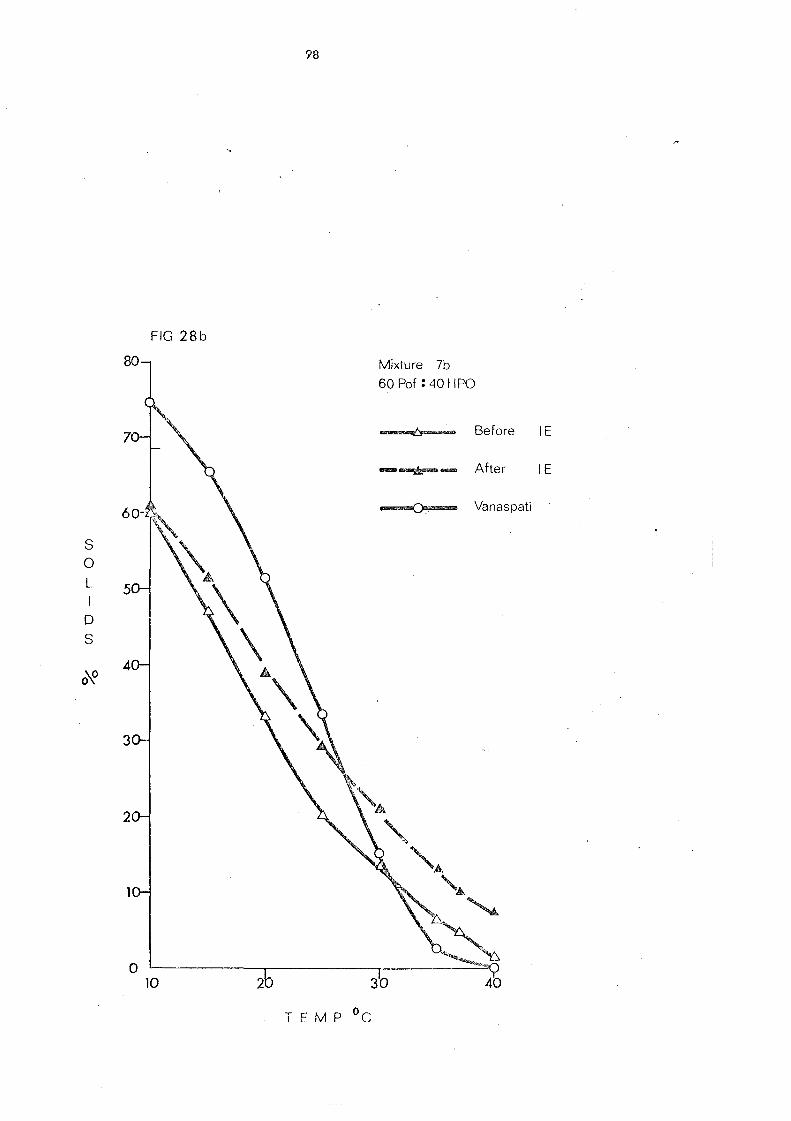
s o L
D S
o'f
FIG 28b
80
o 10
98
Mixture 7b
60 Pof : 40 HPO
~ Vanaspati .
2
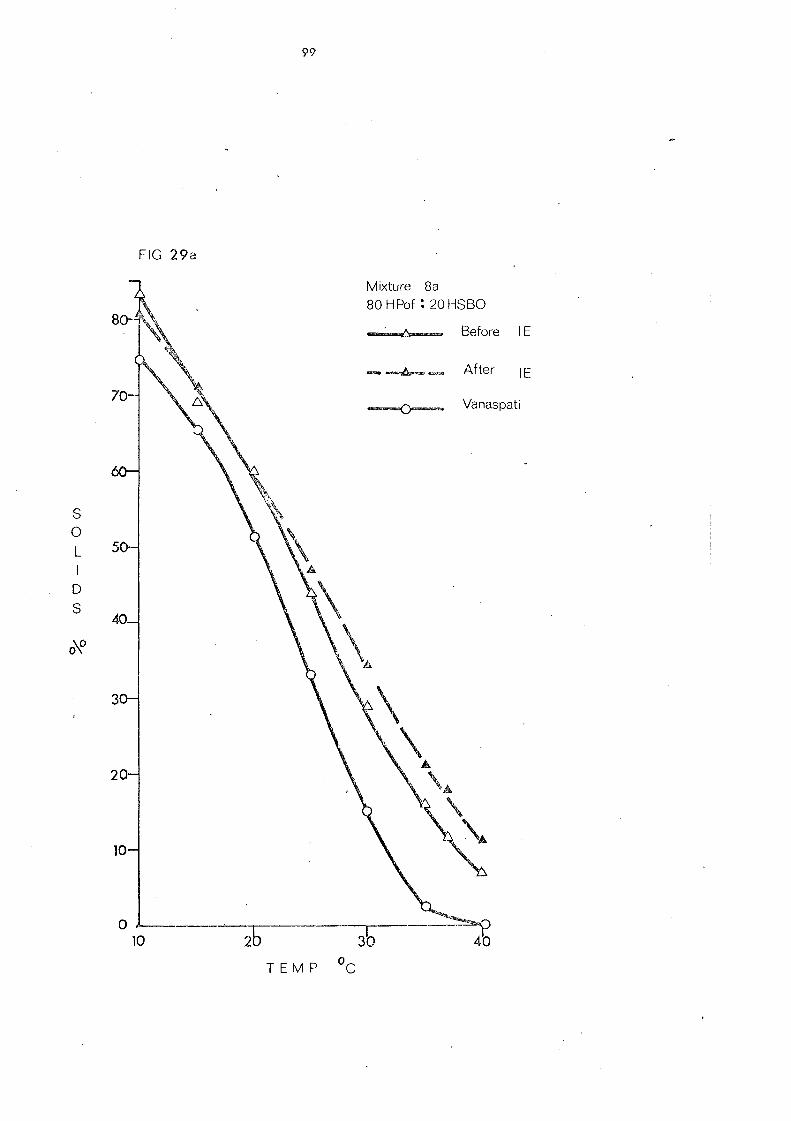
S o
70
L 50
D S
40
3
20
10
99
FIG 29a
Mixture 8a
80 HPof : 20 HSBO
..... ......£"..... ~ After IE
----0--- Vanaspati
o ~----- ·~--~5-----------~----10 2 36 40
T EM P °c
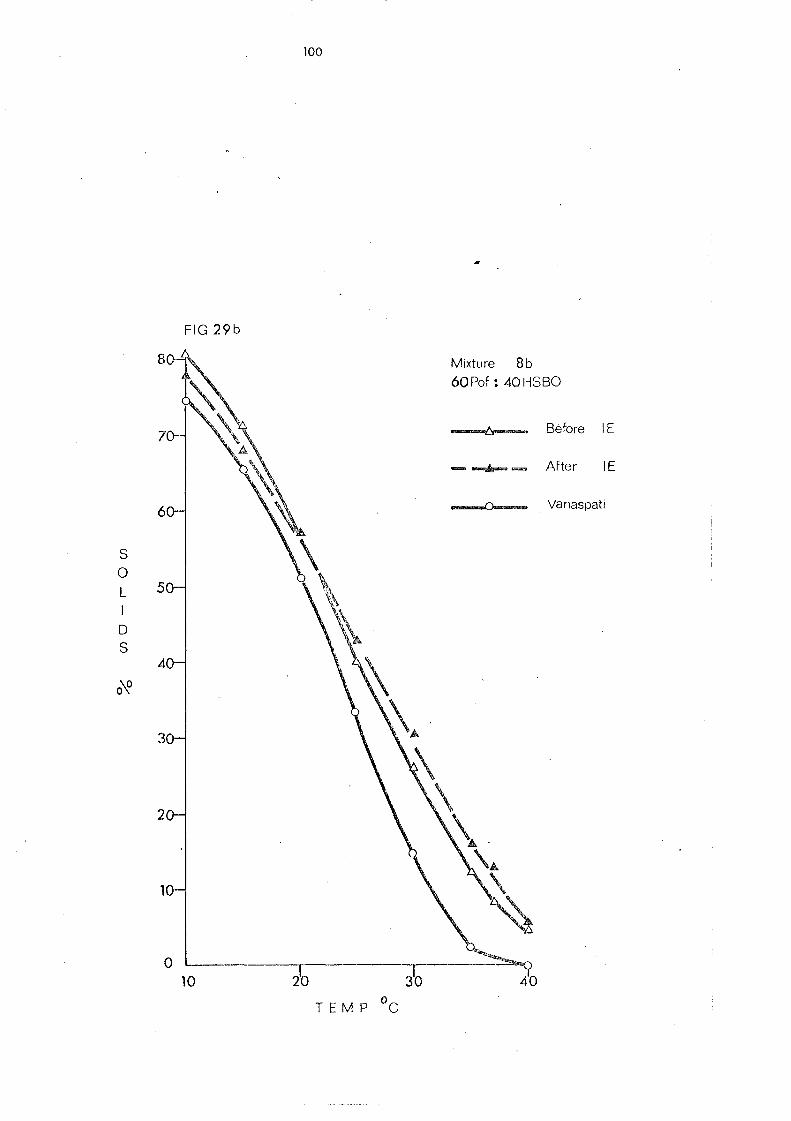
s o L 5
o s
o'f 4
10
o
100
FIG 29b
Mixture 8b
60Pof: 40l-1S80
................ __ After IE
~ . Vanaspati
10
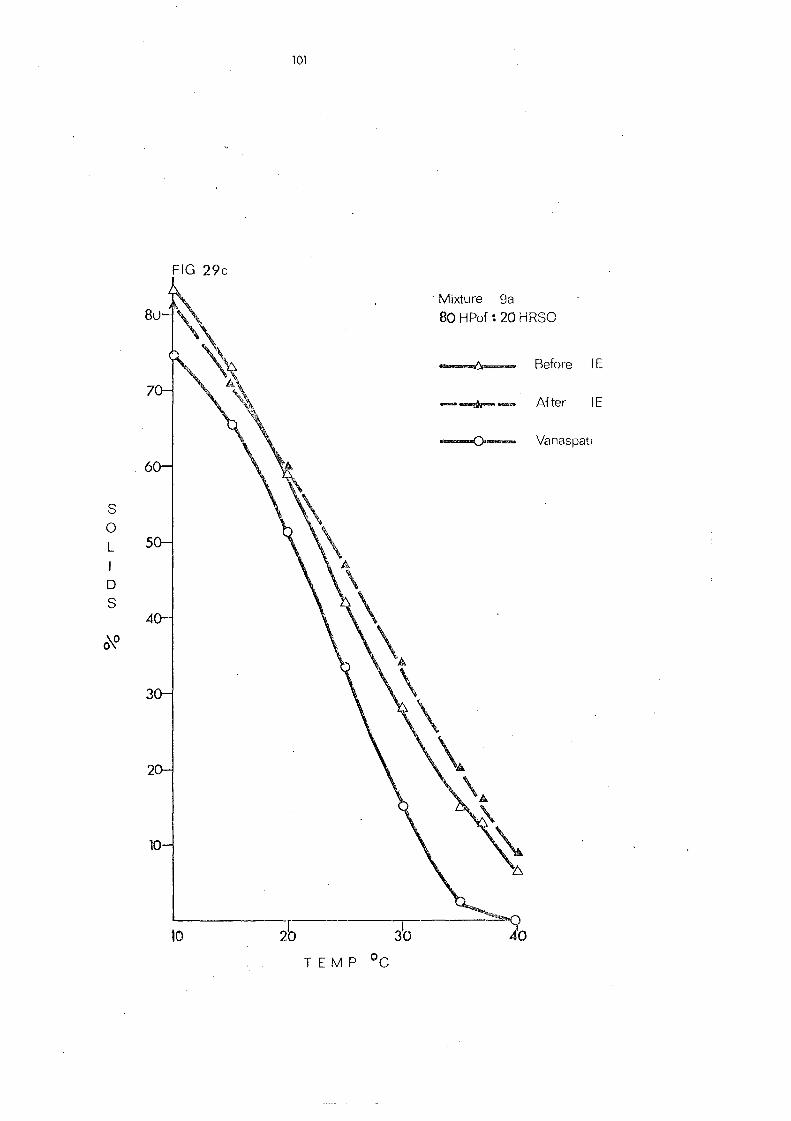
101
FIG 29c
. Mixture 9a
80 HPof: 20 HRSO
~ Before IE
............... - After IE
----0- Vanaspati
6
S
0 L 5
I A
D \ S \ ~ \A
3 \ \ \
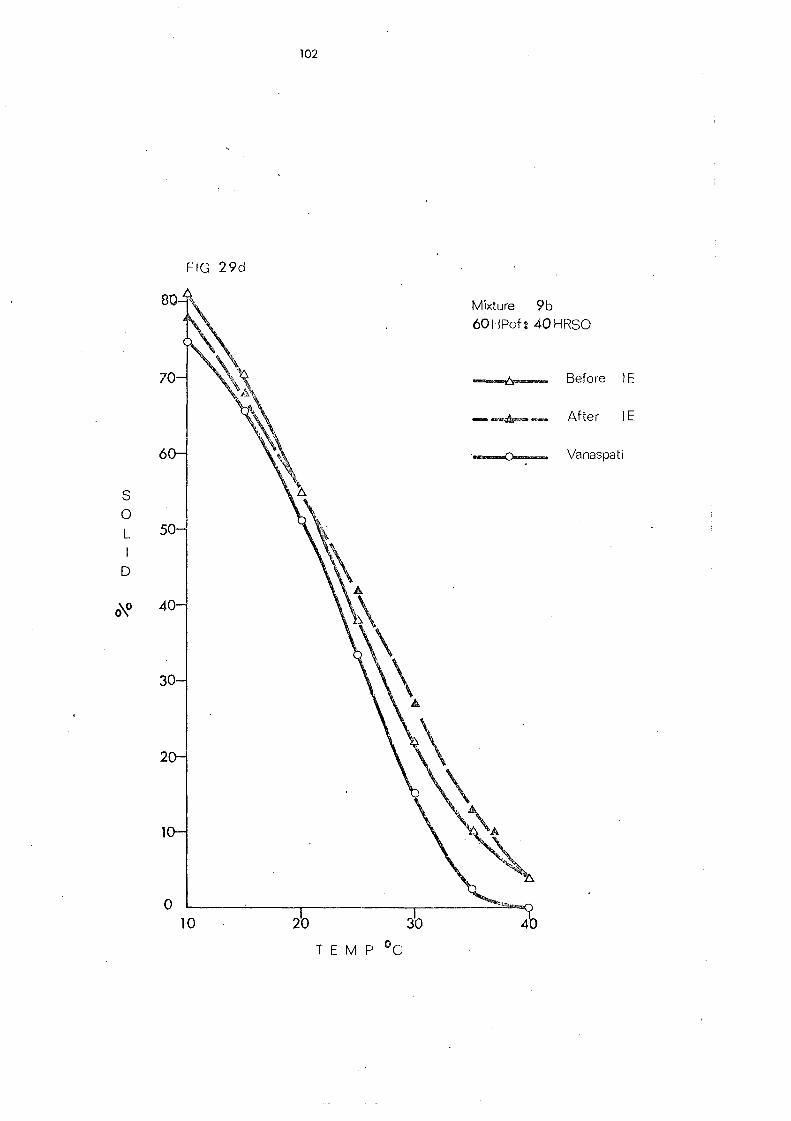
102
FIG 29d
Mixture 9b
60 HPof: 40 HRSO
~ Before IE
_~fi"_ After IE
60 .----0---., Vanaspati
S 0 L 50
D
0\° 40
30
o 10 20
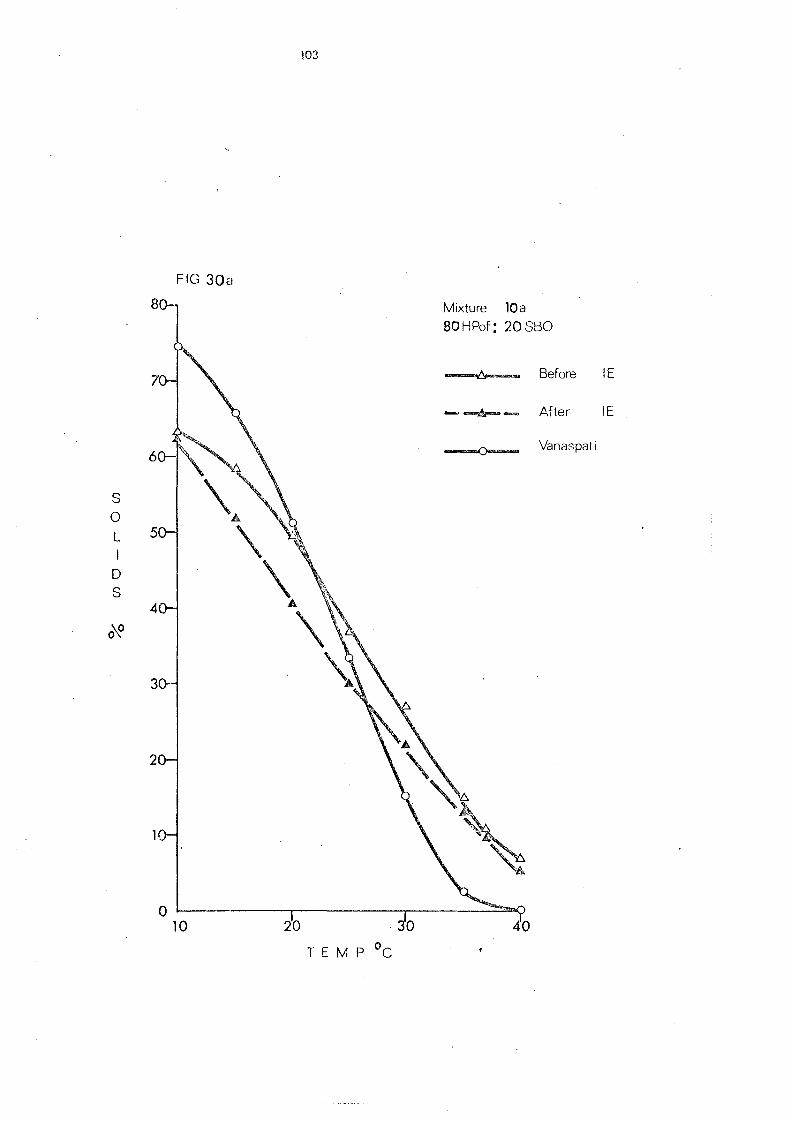
s o L
D S
FIG 30a
80-
o 10 20
103
Mixture lOa
80 HPof: 20 SBO
~ Before IE
-.,~_ After IE
--0-- Vanaspati
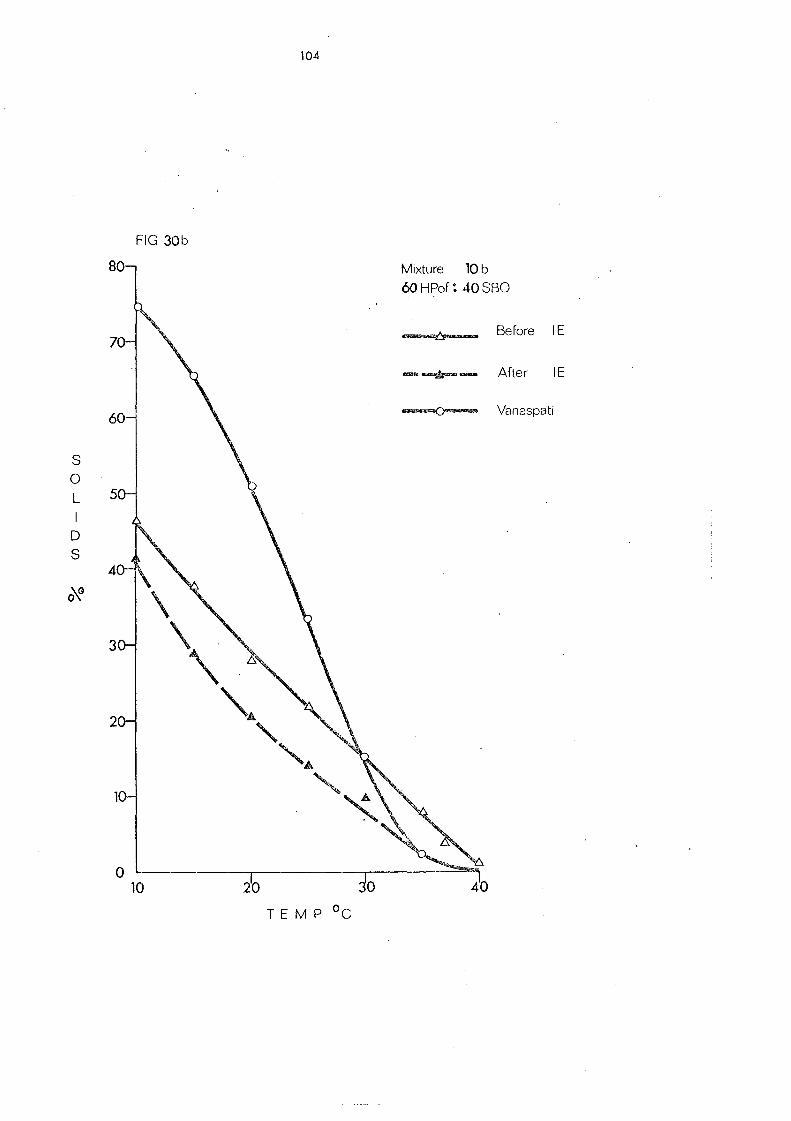
8
7
60
S o L 5 I
D S
o
104
FIG 30b
Mixture 10 b
6OHPof~ 40SBO
~ Before IE
~ Vanaspati
10 20
T E M P °c
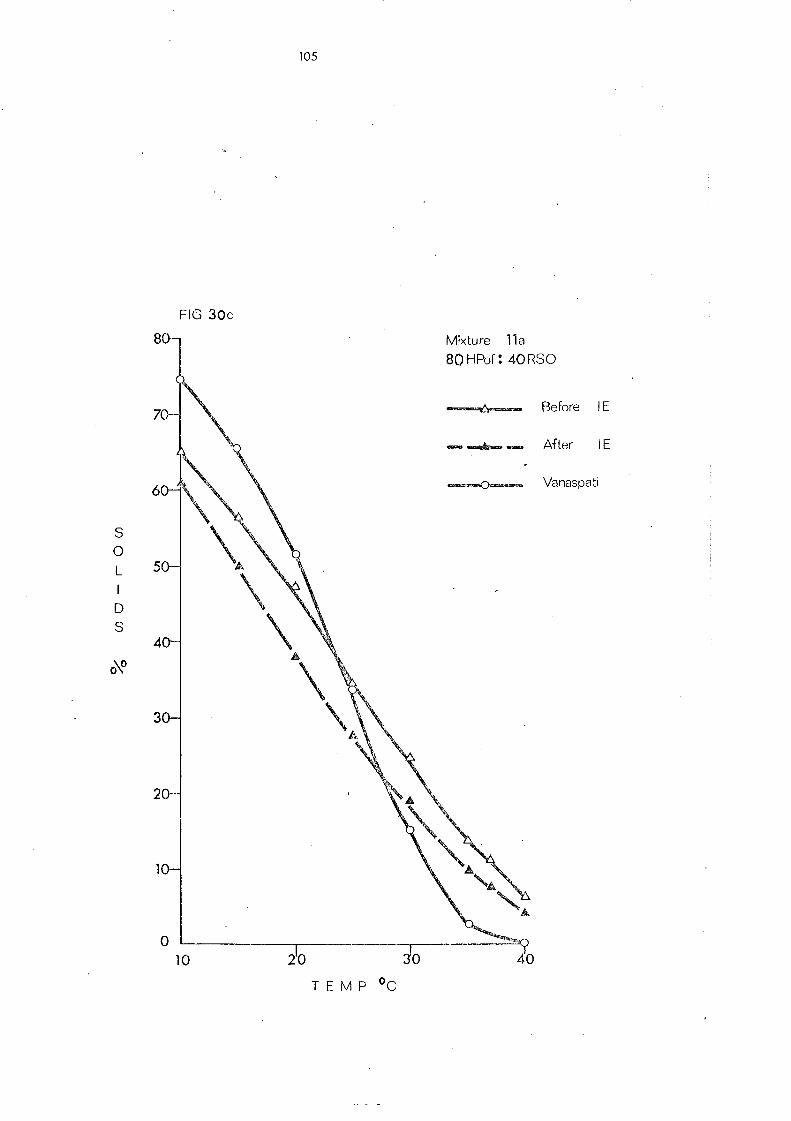
s o L
D S
FIG 30e
80
3
20 ..
o 10
105
Mixture lla
80 HPof: 40 RSO
...................... After IE
~ Vanaspati
-- do T E tvl P °c
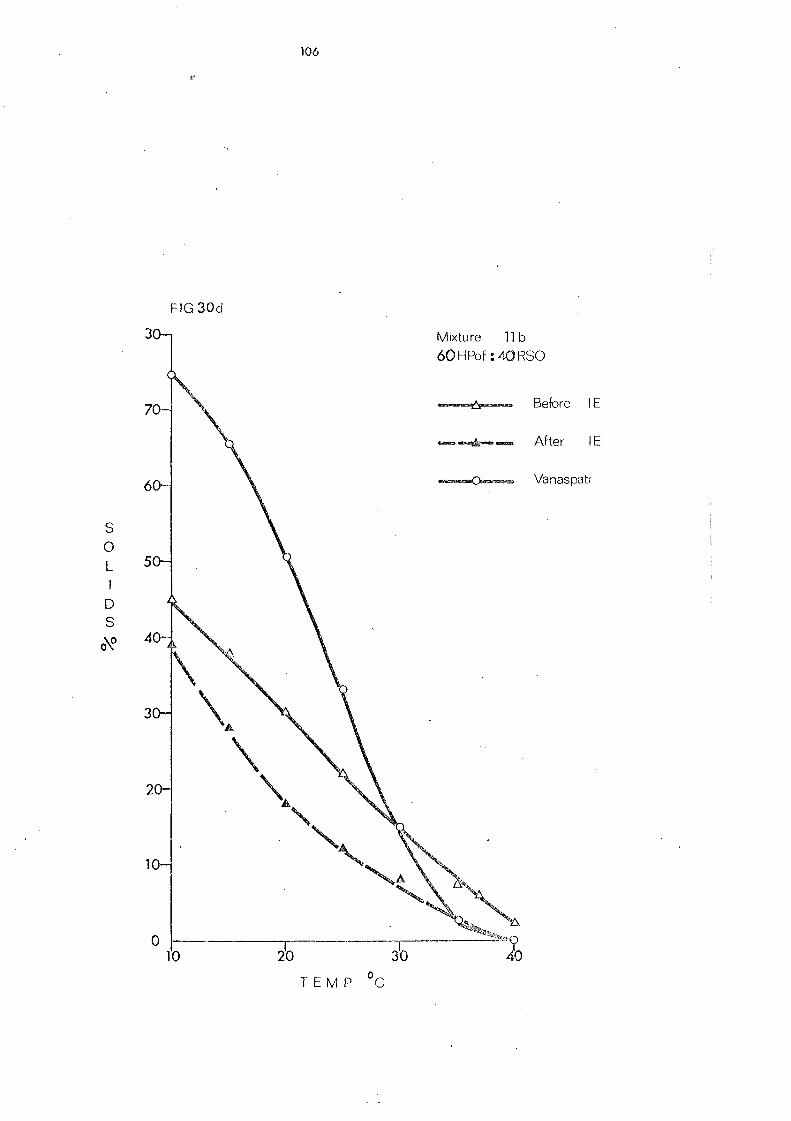
S o L I
D S
o'!!
FIG 30d
70-
3
20-
10
o 10
106
Mixture 11 b
60 HPof : .1,0 RSO
-=................. After IE
~ Vanaspati
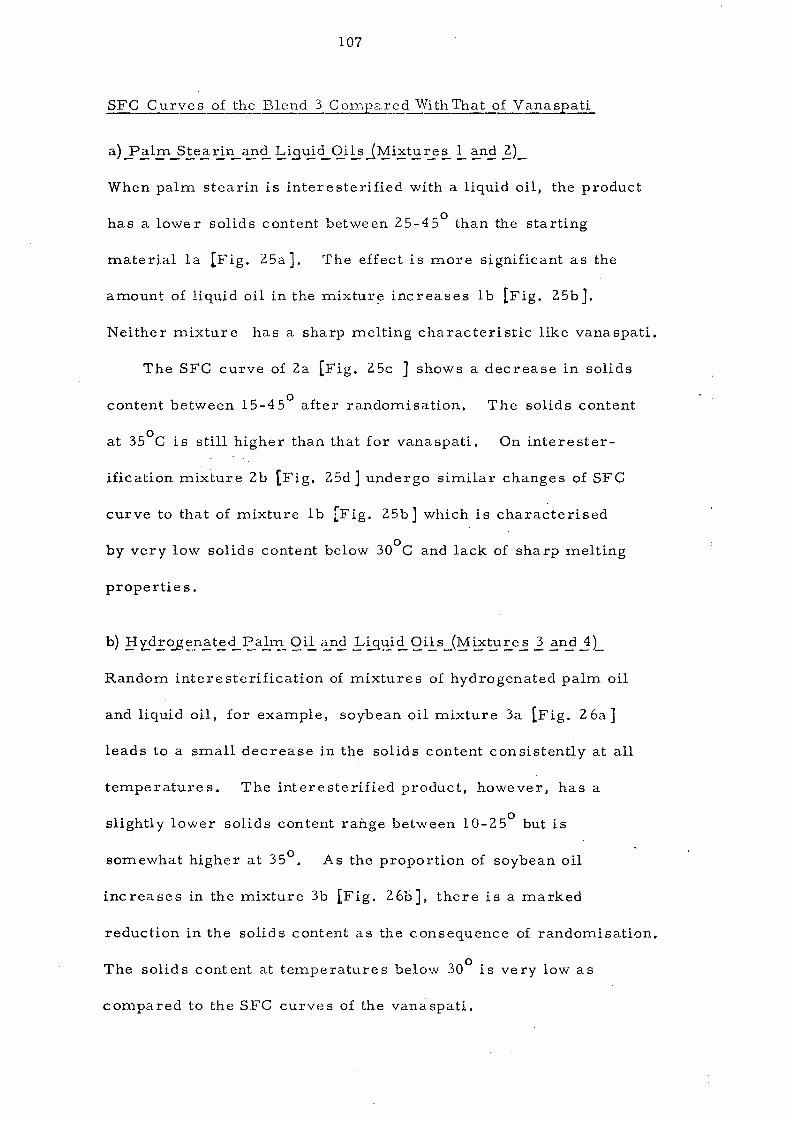
107
SFC Curves of the Blend 3 Compared With That of Vanaspati
a)jJ~lE1_S1e~J:lp_~Y:1~ ~i3'-!!~ Q}.~j~i~t~~e~ !.. ~nE ~)_
When palm stearin is interesterified with a liquid oil, the product
has a lower solids content between 25_450
than the starting
material la [Fig. 25a]. The effect is more significant as the
amount of liquid oil in the mixtur~ inc r eases 1 b [Fig. 25b].
Neither mixture has a sharp melting characteristic like vanaspati.
The SFC curve of 2a [Fig. 25c ] shows a decrease in solids
content between 15_450
after randomisation. The solids content
at 3So
C is still higher than that for vanaspati. On interester
ification mixture 2b [Fig. 25d] undergo similar changes of SFC
curve to that of mixture 1 b [Fig. 25b] which is chara~terised
by very low solids content below 300
C and lack of sharp melting
propertie s.
b) .Hy"dE0-E~p.~t~~~aln.?-_ Qil ~E lA_q~~ Qilsj~~~~e~.2 ~n-.9JL
Random interest'eriHcation of mixtures of hydrogenated palm oil
and liquid oil, for example, soybean oil mixture 3a [Fig. 2 6a J
leads to a small decrease in the solids content consistently at all
temperatures. The interesterified product, however, has a
slightly lower solids content range between 10-250
but is
somewhat higher at 350 . A s the proportion of soybean oil
increases in the mixture 3b [Fig. 26b], there is a marked
reduction in the solids content as the consequence of randomisation.
The solids content at telnperatures below 300
is very low as
compared to the SFC curves of the vanaspatl.
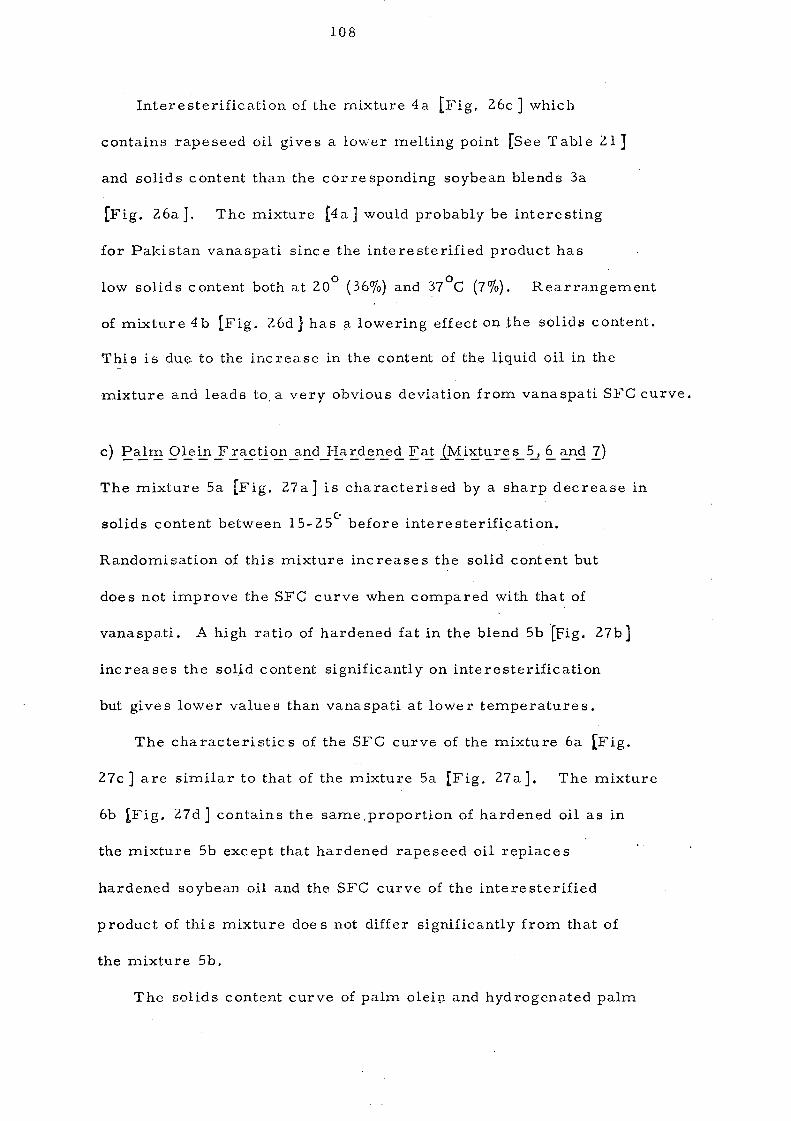
108
Interesterification of the mixture 4a [Fig. 26c] which
contains rape seed oil give s a lower melting point [See T abl e 21 J
and solids content than the corresponding soybean blends 3a
[Fig. 26a J. The mixture (4a] would probably be interesting
for Paki stan vanaspati sinc e the inte re sterified product has
low solids content both at 200
(36%) and 370
C (7%). Rearrangement
of mixtur e 4 b [Fig. 26d J has a lowering effect on .the solids content.
This is dU(i!. to the increase in the content of the liquid oil in the
mixture and leads to. a very obvious deviation from vanaspati SFC curve.
c) ~all!! .Q~~X.!a~ti~3~d_H_a~d~~ei £:aJ Qvii~t~r~~~ ~ ~n~ I}
The mixture 5a [Fig. 27aJ is characterised by a sharp decrease in
solids content between 15_25(' before interesterification.
Randomisation of this Inixture increases the solid content but
does not improve the SFC curve when compared with that of
vanaspati. A high ratio of hardened fat in the blend 5b '[Fig. 27b]
increases the sol~d content significantly on interesterification
but give s lower value s than vanaspati at lowe r temperature s.
The characteristic s of the SFC curve of the mixture 6a [Fig.
27c] are similar to that of the mixture Sa fFig. 27a]. The mixture
6b [Fig. 27d J contains the same.proportion of hardened oil as in
the mixture 5b except that hardened rapeseed oil replaces
hardened soybean oil and the SFC curve of the interesterified
product of thi s mixture doe s not differ significantly from that of
the mixture 5b.
The solids content curve of palm olei:p. and hydrogenated palm
109
oil mixture 7a £Fig. 28aJ reveals that the interesterified
mixture is not suitable for vanaspati owing to low values of solids
at low temperatures and to the lack of a sharp melting
property. However, it would probably be of interest for other
uses such as for shortening. A s the quantity of hardened palm
oil increases 7b [Fig. 28b] randomisation causes a considerable
increase in solids content particuL;ll'ly between 30-350
C.
d) !i~:.r~E0~dY3~_ Q.l~i~ Ir3~t!E~ ~n~ .Q~~r?3!:..d~n~~ :ra.!~
il\!.i~t~_r_~ ~ ~ .!) 1
The solids content curve of the mixture 8a [Fig. 29a] is very
similar to that of the mixture 9a [Fig. 29c] before ~nd after
randomisation and both are hi.gher at all tempe rature s than the
SFC curve of vanaspati. Randomisation changes the solids
content of the mixtures 8b [Fig. 29b J and 9b [Fig. 29d] very
little. The solids content of the products are quite close to the
SFC curve of vanaspati although slightly higher between 25- 35 0•
This mixture might be useful for Indian vanaspati. As has been
mentione d earlier, in thi s series of the blend a liquid oil which
is required for Indian vanaspati has not been added. The addition
of the liquid oil to the product of the mixture might result in a
reduced solids content particularly between 2~- 350C.
Interesterification lowers the solids content of the mixtures
lOa [Fig. 30a] and lla [Fig. 30c] with approximately a linear
decrease as the temperature increases. The solids content of
the rapeseed mixture [lla J is slightly lower particularly between
110
20- 3So
C than that of the cor re sponding soybean blend [lOa].
Thi s hydrogenated olein: rapeseed (80: 20) mixture would also
be interesting for Pakistan vanaspati since this mixture has a
relatively low solids content at 200
(38%) and 370
(7.6%).
The effects of interesterification on solids content of the
mixtures lOb [Fig. 30b] and lIb [Fig. 30d] are quite similar
to that of [3 band 4 b) all of which c ontain the same quantity of
the liquid oils. It reduces considerably the solids content of
the mixtures below 300 C which is very low as compared to
vanaspatL
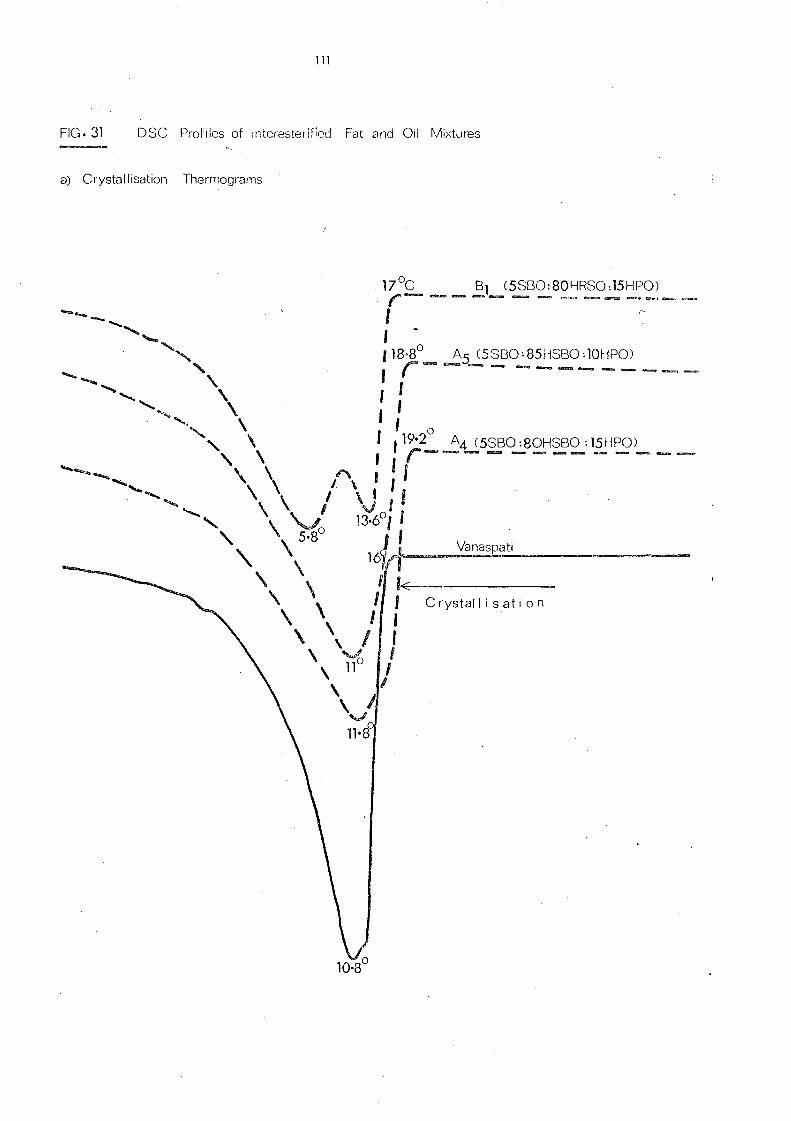
111
FIG. 31 DSC Profiles of interesterified Fat and Oil Mixtures
a) Crystallisation Thermograms
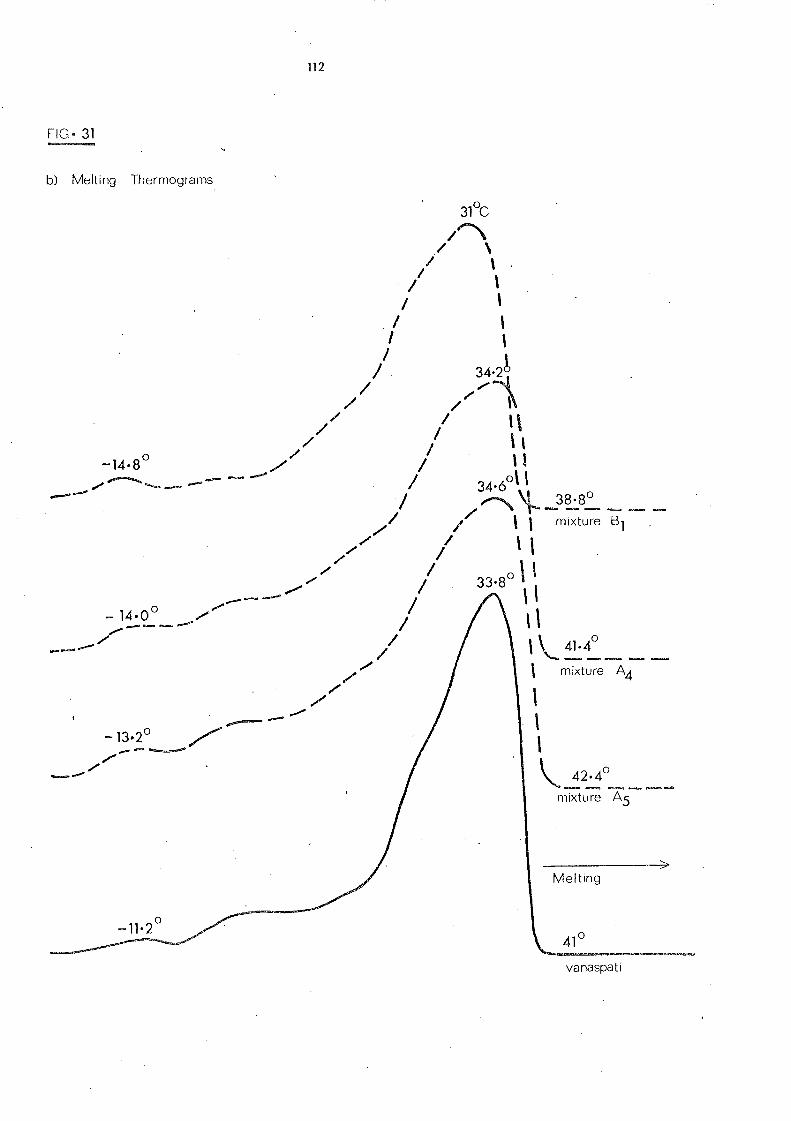
FIG· 31
b) Melting Thermograms,
-14·8 o
;" -,--..,-----
--,/
-13_2 0 /
/" ---
o -11·2
--- -
112
\ \ \
> Melting
vanaspati
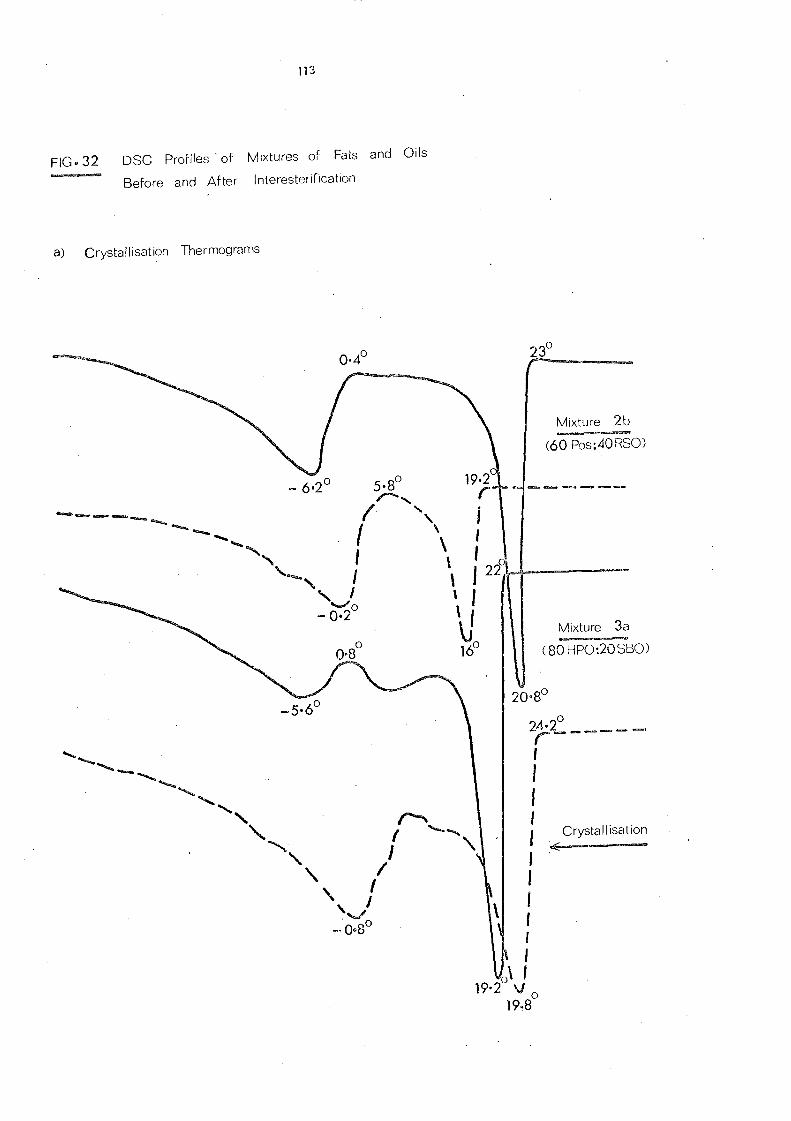
113
FIG.32 DSC Profiles· of Mixtures of Fats and Oils
Before and After Interesterification
a) Crystallisation Therrnograrns
-5·6 °
Mixture 2b
(60 Pos:40RSO)
Mixture 3a
(80 HPO:20SBO)
24.2° r---~--, I , , , Crystallisation
f .~ , , , , \ I \ ,
19'2° V 0
19.8
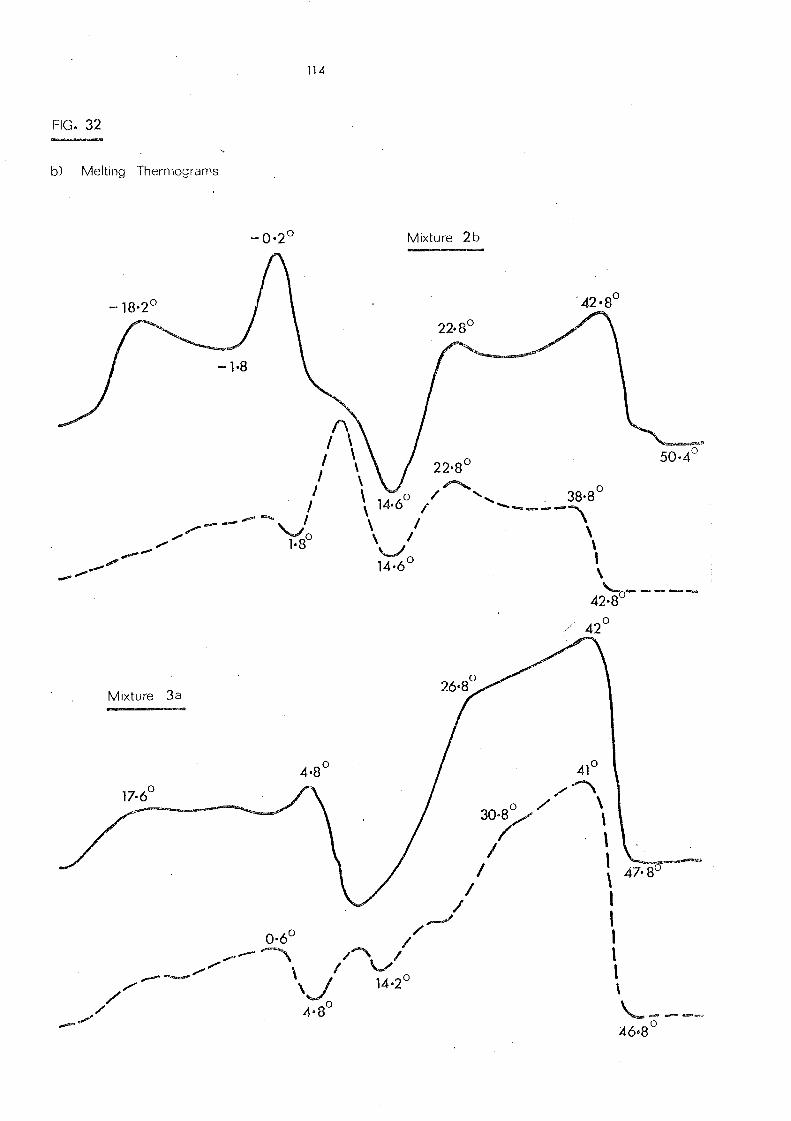
114
FIG. 32
b) Melting Thermograms
-1·8
Mixture 2b
f\ I \
I \ I \ 22'8°
J \ ............ \ ° / '..... 38'8°
I 14·6 /' -' ,.".,..----..V' \ / ----, ~,.. l'So \ I '\
---~ \...,./ "..... 14.6 ° I
-~ \ '-o~-"----
42·8
Mixture 3a
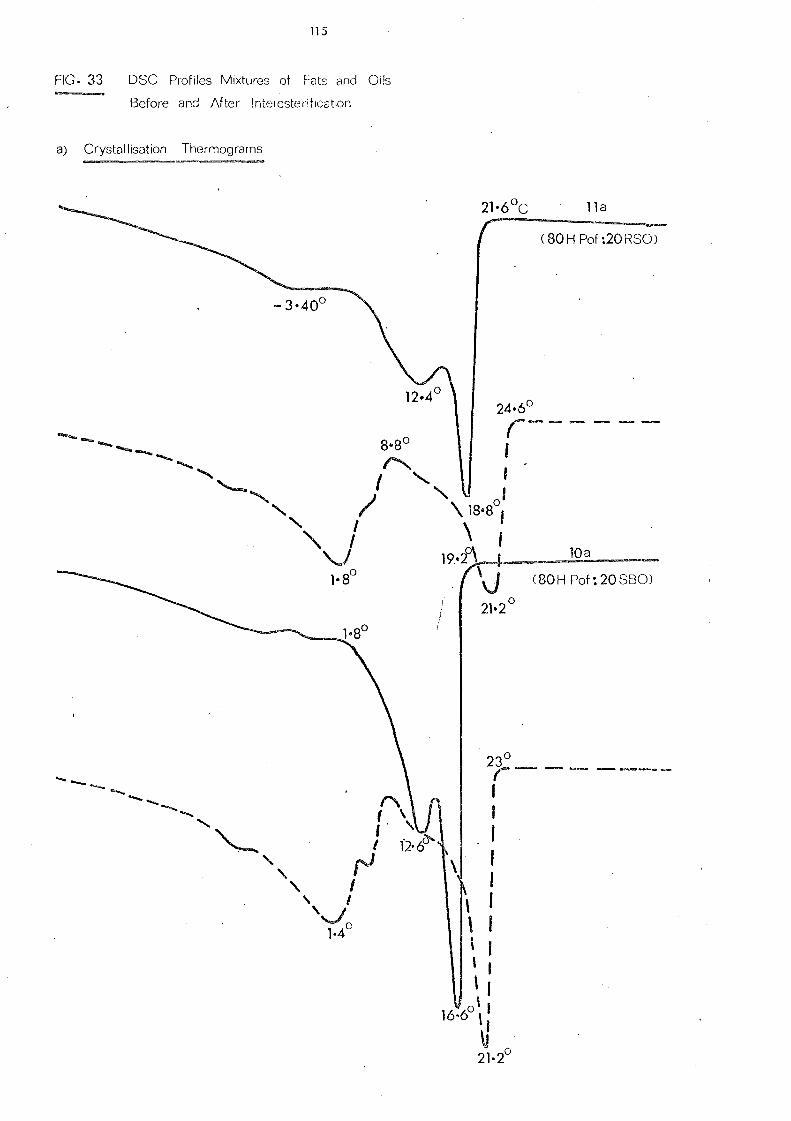
115
FIG. 33 DSC Profiles Mixtures of Fats and Oils -- Before and After IntelesterificCition
a) Crystallisation Thermograms
\
21'6°C 11a
(80 H Pof ~20RSO)
23° r- --- -----I I I I I
\ I \ I
I \ I \ I \
16-6° \ ;
ij 21'2°
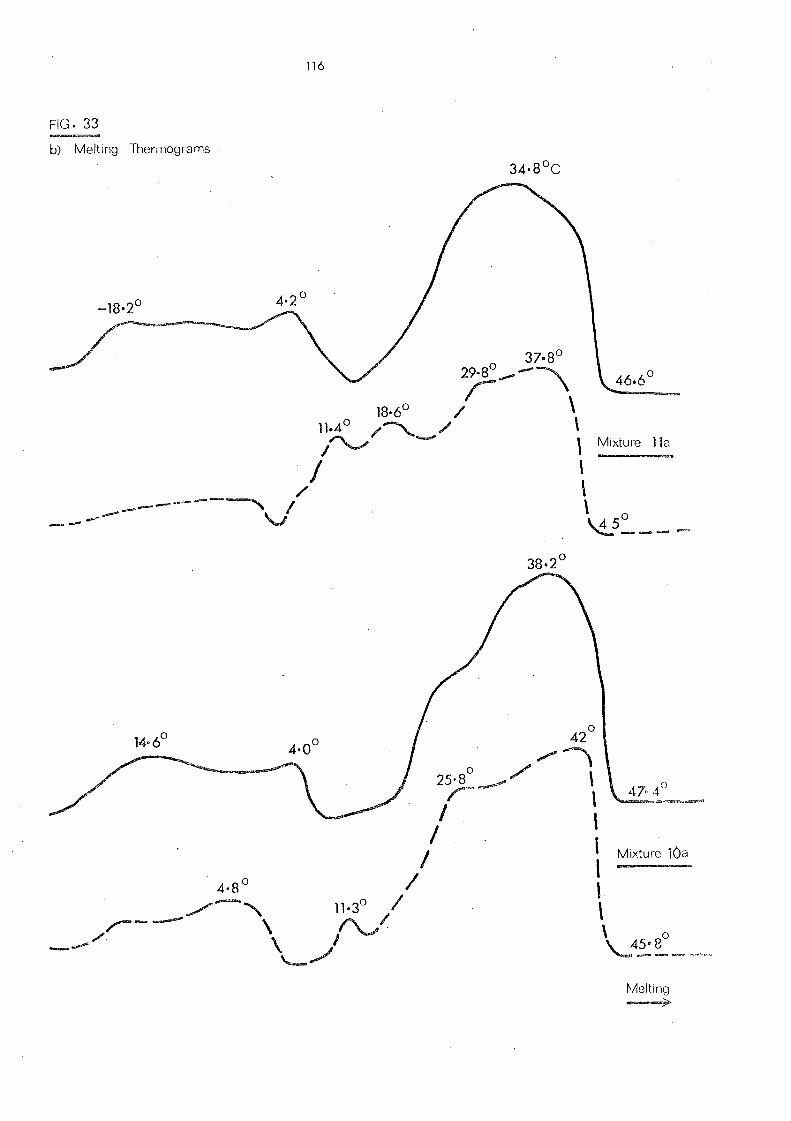
116
FIG. 33
b) Melting Thermograms .
38.2°
46.6°
Melting ;;.
117
Thermal Characte ristic s .by DSC Analysis
C rystalli sation and melting behaviour studie s were carri ed out
on only a few selected mixtures because of the limited time
available. The details of the procedure a.re described in the
Experimental Sectionp. 156. The crystallisation and
melting thermograms are represented by continuous (before
inte re sterifica.tion) and broken (after intere ste rification) line s.
Fig. 31 (a) shows the crystallisation thermograms of some
interesterified mixtures of fats and oils. Vanaspati is
o characterised by a sharp melting exothermic peak at 10.8 C.
Mixtures A4 and A5 behave similarly with peaks at 11. 80
and
11°C respectively. Mixture Bl, however, shows two exothermic
o 0 peaks at 13.6 and 5.8 C. This indicates the different crystallisation
behaviour between HSBO and HRSO. The onset of crystallisation
of the mixture Bl is at lower temperature (17 0) than that for A4
o (19.2 ) probably due to fair amounts of high melting g~ycerides in
the latter mixture.
The melting thermograllls of the same l1.1.ixture s are shown
in Fig. 31(b). Vanaspati has quite a sharp melting peak at 33. 80 C
and complete fusion occurs at 4l °C. There is no significant
difference in the melting behaviour of mixtures A4 and A5 except'
that the latter melts completely at the relatively high temperature
o of 42.4 C.
Fig. 32(a), shows the crystalli sation the rmogram s of
mixtures 2b and 3a before and after interesterification. The
118
onset of crystallisation of the mixture Zb decreases from 230
to 19. ZO after interesterification and consequently the second
crystallisation peak occurs at a higher temperature (-0. ZOe)
than before randomisation (-6. ZOe). This is expected when
an oil contai ning a considerable amount of trisaturated
glycerides (palm oil stearin) is mixed with a liquid oil (rapeseed
oil): inter~sterification results in,a complete rearrangement
of all the ac yl groups. Interesterification of mixture 3a leads
to an increase in the temperature of onset of crystallisation from
o 0 22 to 24.2 e. A considerable change in the crystallisation
behaviour at low temperatures implies that low melting glyceride
groups are more affected by interesterification.
The temperature of complete fusion of mixture 2b [Fig. 32(b)]'
o 0 decreases from 50.4 to 42.8 e after rearrangement, as expected
from the cooling thermograms. The presence of a major melting
peak at -18. zOe before randomisation probably indicates a
significant amount of low melting glycerides from rapeseed oil.
The melting properties of mixture 3a, before and after interested-
fication show a noticeable difference in the low melting region of
the thermograms but the melting peaks of the high melting
glyceride s and the telnperatures of complete fusion change very
little. This is in agreement with the observation on the
crystallisation thermograms.
T he change s in crystallisation behaviour of mixture s lOa
(80 HPof:20 SBO) and lla (80 HPof:20 RSO) after xandom
inte re ste rification is depic ted in Fig. 3 3(a) . Afte r rearrangement,
119
crystallisation of both nl.ixtures starts at higher temperatures
than before the reaction. The crystallisation behaviour of the
mid and lower melting glyceride groups is considerably affected.
Thi s is revealed by the appearance of peaks at 1.40
and 1. SoC
in mixtures lOa and lIb respectively, after randomisation.
The temperature s of complete liquifaction of mixture lOa
decreased from 47.40
to 45. SO and that of mixture lla decreased
from 46.6° to 45°C after interesterification [Fig. 33(b)]. This
is in agreement with the consistently low SFC values at all
temperatures [Fig. 30] and the slight decrease in slip melting
point. The se observations are rather unexpected, considering
the high temperature of onset of cry stallisation of both mixture s!
This apparent contradiction may be due to the relatively large
amounts of intermediate melting range glyceride groups being
formed as the results of interesterification as observed in the
crystallisation thermograms.

CHAPTER FOUR
120
Introduc tion
Natural triacylglycerols contain mixtur,es of fatty acids but the
association pattern of these acids within the glycerides is not
obvious. Lipolysis permits the estimation of fatty acids at the
2-position 'i?ut the fatty acids occupyi.ng the two primary positions
cannot be differentiated and can only be calculated on the basis of
certain assumptions. Such assumptions are less justified when,
the natural fat is physically modified as in fractionation due to
enrichment of one kind of fatty acids and reduction of another.
Whilst GLC88
, Ag+TLC89
and reversed-phase chromatography90
provide a good view of the molecular association of acyl groups in
the triacylglycerol molecule they furnish little information about
positional distribution. 91,92 '
B rokerhoff developed method s for
the stereospecific analysis of triglycerides. He was able to
demonstrate a differentiation between the 1- sn and 3-~-positions
to compliment the composition of the 2- sn-position. Ch .. 93
rlstle
developed a micro method, based on B rockerhoff 1 s procedure,
capable of considerable accuracy with less than 50 mg of glycerides.
The stereospecific analysis technique has been applied to a
number of fats and oils to' determine the positi"onal distribution of
their fatty acids. Several reviews on stereospecific studies have
94-96 97 been reported, . Hammond 1 s studies on glyceride structure
of several soybean varieties revealed that there is little 16:0 or
18: 0 acid s on the sn- 2-position. T he ~- 3- position is enriched
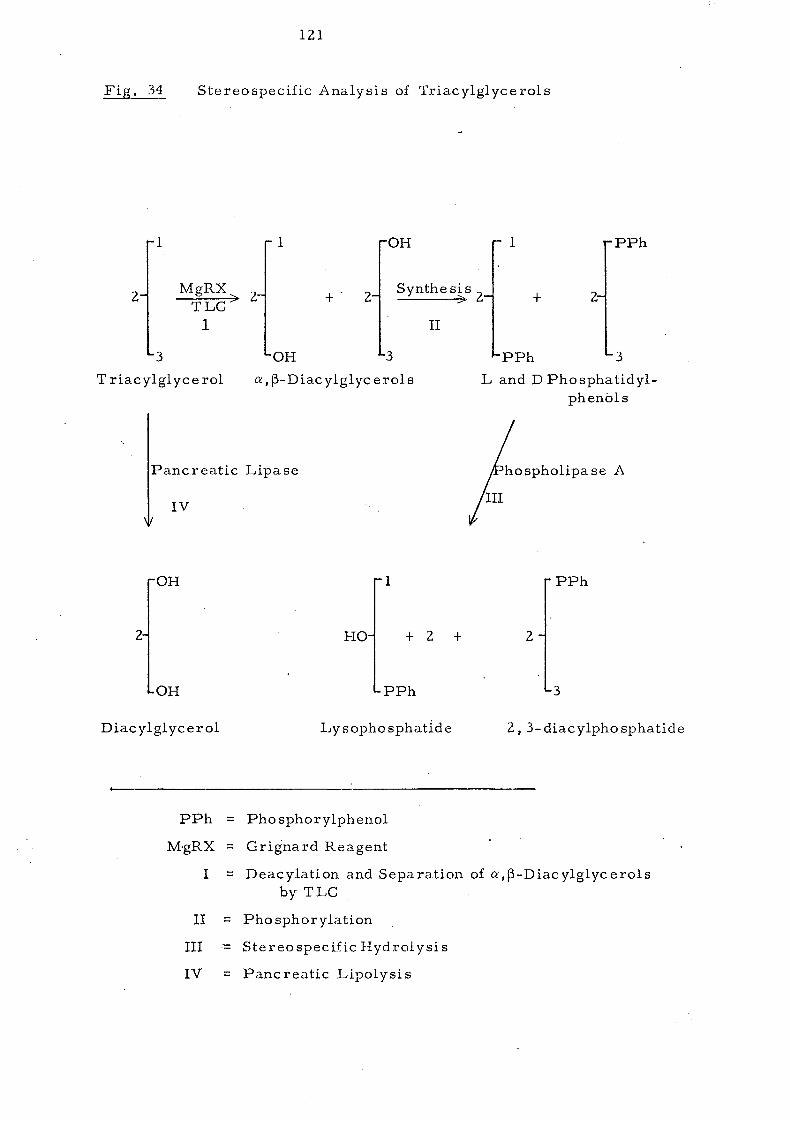
121
Stereospecific Analysis of Triacylglycerols
1 1 OH 1 PPh
2 MgRX
TLC> 2 +- 2
Synthe sis 2 ;:. +
1 II
3 OH 3 PPh 3
Triacy1g1ycerol a. !3-Diac ylgl yc erols Land D Phosphatidyl-phenols
Pancreatic Lipase hospholipase A
IV
OH 1 PPh
2 HO + 2 + 2
OH PPh 3
Diacylglycerol Lysophosphatlde 2,3-diacylphosphatide
PPh
M-gRX
I
= = =
Phosphorylphenol
Grignard Reagent
Deacylation and Separation of a.!3-Diacylglycerols by TLC
II = Phosphorylation
III -- Stereospecific Hydrolysis
IV = Pancreatic Lipolysis
122
in 18:1 and the sll-Z-position with 18:2 acids. Distribution of
erucic acid and other fatty acids in rapeseed oil has also been
98.99 reported . The positional distribution of fatty acids in
other vegetable oils, animal fats, milk and marine oils has also
b th hl ' . i- d 96 een oroug y Investlga~e
R 1 M d "" . 1 00 d h . ecent y yher an hukslS reporte a new tec nlque
of simultaneous determination of stereospecific distribution and
molecular association of acyl groups in triacylglycerols. The
analysis is based on random generation of a,~-diacylglycerols,
synthesis of ra~-phosphatidylcholines, and stereospecific release
of 1,2-.8n- and 2,3-E!!-diacylglycerols by phospholipase C. The
technique involves a combination of gas chromatography and mass
spectrometry (GG /MS).
Our study on the stereospecific glyceride analysis of different
varieties of palm oil is reported in this chapter.. A number of
101,102 workers have investigated glyceride compositions of
different types of palm oil, but a study using this technique has
so far not been reported.
Results and Discussion
Detail s of the proc edure are de sc ribed in the Experimental
Section p. 156 • A schernatic repre sentation of the steps
inv01 ved in the pitocedure is shown in Fig. 34.
The generation of a,~-diacylglycerols (one equimolar mixture
of the 1,2 and 2, 3-sn-isomers) is the most important step. This
123
is achieved by reacting the triglyceride with a limited quantity
of Grignard reagent for a short time. This reacts with one of
the ester linkages in the triglyceride to produce (after hydrolysis
of reaction intermediate s), three diac ylgl ycerol s and tertiary
alcohols derived from the liberated acyl groups. Deacylation
which is assum.ed to be rand<:>m, continues further until all
possible diacylglycerols and monoacylglycerols as well as free
glycerol are found in the reaction product. The reaction is
stopped by adding acetic acid at a point when the maximum yield
of diacylglycerol is attained. The result a,~-diacylglycerols
are extracted and recovered immediately to minimise acyl
migration. 103
It has been reported that there is about 1.5%
contamination of a,~-diglycerides by a,al-diglycerides as the
result of isomerisation. The use of ethyl magnesium bromide is
usually preferred over that of methyl magnesium bromide because
the latter shows little preference for different fatty acid bondsl03
and the former proved to give better resolution of tertiary alcohols
1 3 . 104, l05
from , -dlacyl-~E-glycerol during chromatographic
isolation of the reaction products.
The conv~r sion of the a, ~-diac ylglycerols to phospholipid
derivatives which serve as substrate for phospholipase AZ
is
achieved by condensation of the diac ylglyc erols with phenyldichloro-
phosphate in the presence of pyridine as a catalyst. The resulting
products are 1, 2- diacyl-~- gl yce rol- 3-phospholipid sand 2. 3-
diacyl-~- glycerol-I-phospholipid s. Pho spholipase A 2 reacts
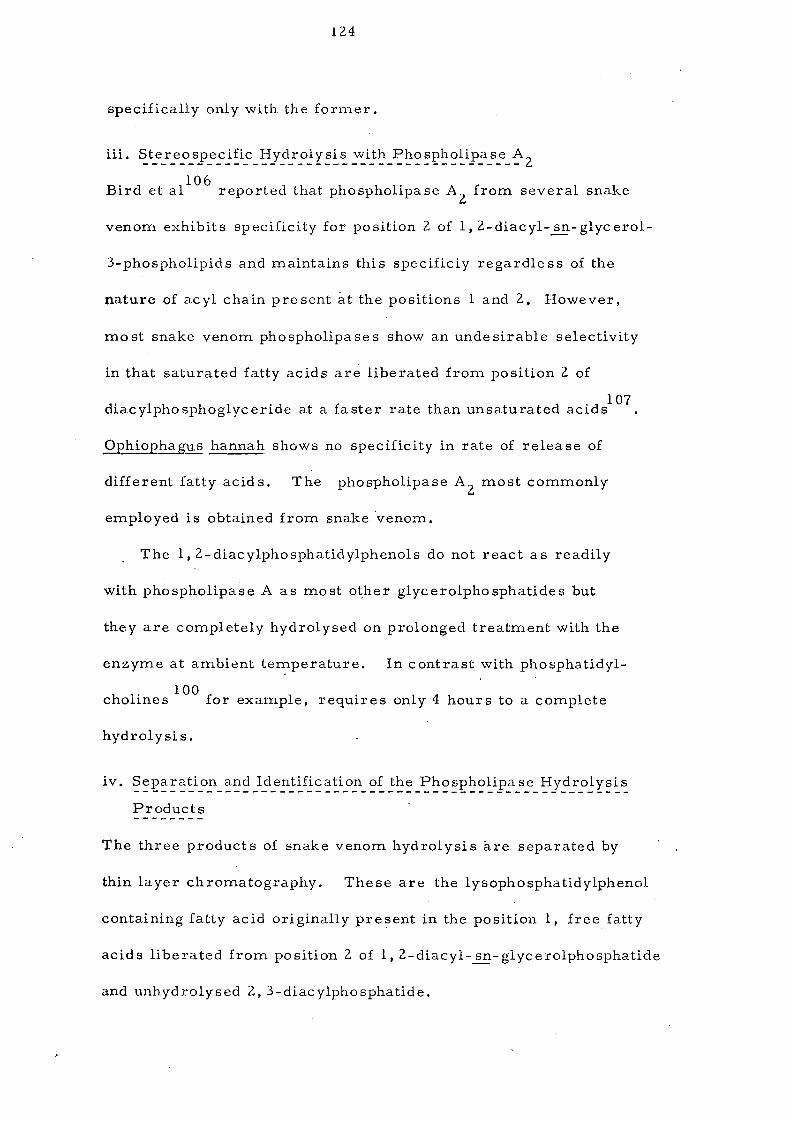
124
specifically only with the fortner.
iii. ~t_e_r_e_o_sp_e_c .!-~i: _~y_d_r_ol 1:' ~~ ~ .::i~~ _~~:> ~p~:>~ip.?-_s_e_ ~ 2
Bird et al106
reported that phospholipase A2 from several snake
venom exhibits specificity for position 2 of 1, 2-diacyl-~-glycerol-
3-phospholipid s and maintains thi s specificiy regardle ss of the
nature of ac yl chain pre sent at the positions land 2. However,
most snake venom phospholipases show an undesirable selectivity
in that saturated fatty acids are liberated from position 2 of
diacylphosphoglyceride at a faster rate than unsaturated ac.i.dsl07
•
QP.hiophagus hannah shows no specificity in rate of release of
different fatty acid s. The phospholipase A2 most commonly
employed is obtained from snake venom.
The l, 2-diacylphosphatidylphenols do not react as readily
with phospholipase A as most o~her glycerolphosphatides but
they are completely hydrolysed on prolonged treatment with the
enzyme at ambient temperature. In contrast with phosphatidyl-
. 100 chohnes for example, requires only 4 hours to a complete
hydrolysis.
i v. ~~12~:~~i_03_ ~~~ J?_e!l~~f~:~~i_03_:>~ ~~~ _~~:>~12~:>~ip.?-..:"_e_ ~J'?!_O~ l~~ ~ Products
The three product s of snake venom hydrol ysi s are separated by
thin layer chromatography. These are the lysophosphatidylphenol
containing fatty acid originally present in the position l, free fatty
acids liberated from position 2 of 1, 2-diacyl-sn-glycerolphosphatide
and unhydrolysed 2, 3-diacylphosphatide.
125
The fatty acid composition at the 2 -position is determined
independently by lipolysis of the triacylglycerol with pancreatic
lipase. The fatty acids at position 3 cannot be obtained directly
but can be calculated in two ways: By subtracting the composiUon
of sn-l and sn- 2-positions from the composition of the whole
triacylglycerols or by subtracting the composition of ~-2-position
from that of the sn-2, 3-diacylphosphatides that are left unhydrolysed
by snake venorn. These can be simplified as
3 x Triglyceride - Position 1 - Position 2
or 2 x 2, 3-Diacylphosphatide - Position 2 ..
The former is regarded as the more accurate, but good agreement
of these two values is a general check on the reliability of the
94 method .
The average differences of fatty acid composition at position 3
calculated by the two method s and the standard deviation of the
differences for each fatty acid obtained from different types of
palm oils are given in Table 22. The positional distribution of
fatty acid s a re set out in Table 23.
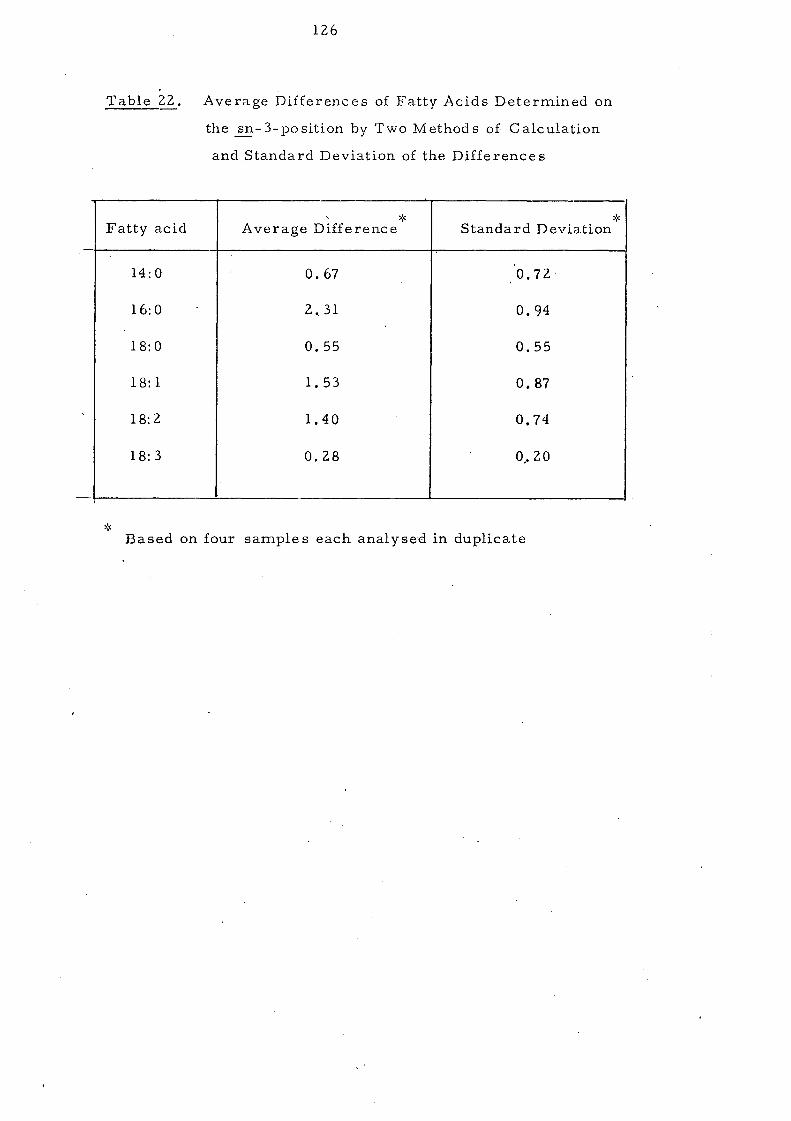
,
126
Table 22. Average Differences of Fatty Acids Determined on
the sn-3-position by Two Methods of Calculation
and Standard Deviation of the Differences
, ,l. -0'
Fatty acid Average Difference Standard Deviation
14:0 0.67 0.72·
16: 0 2.31 0.94
18: 0 0.55 0.55
18: 1 1.53 0.87
18: 2 1. 40 0.74
18: 3 0.28 0 .. 20
* Based on four sample s each analysed in duplicate
*
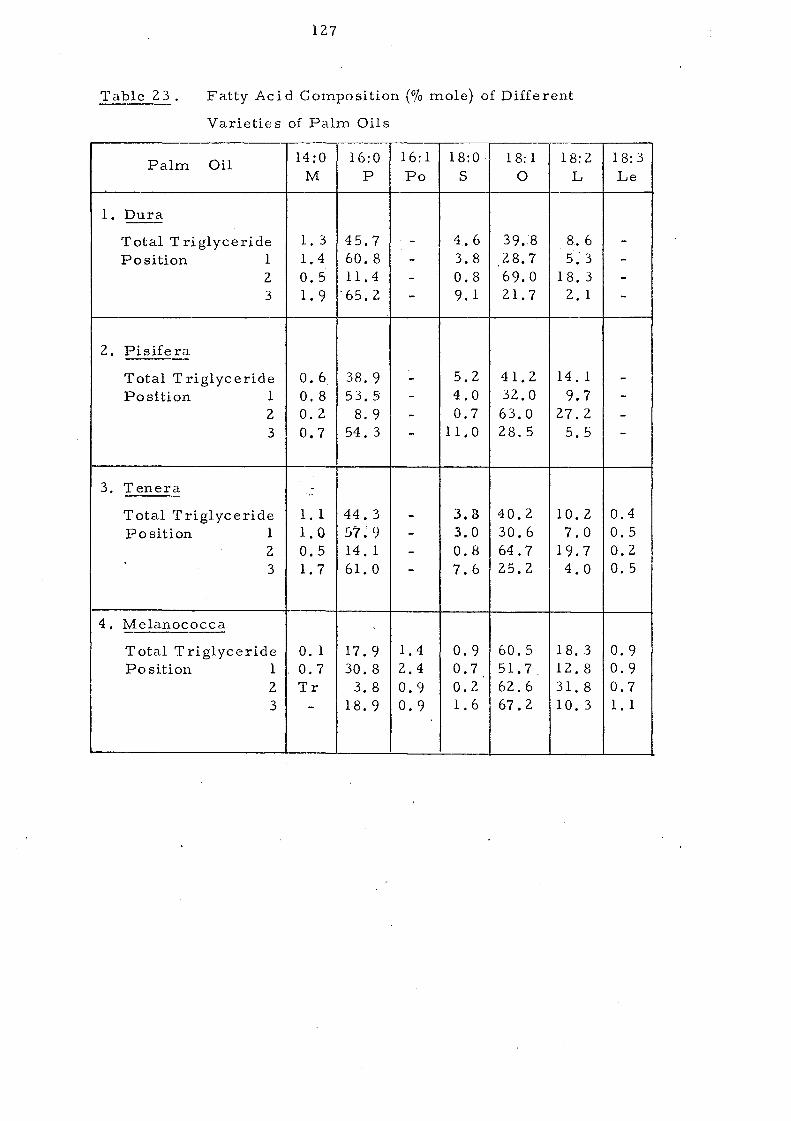
127
Table 23. Fatty Acid Composition (% mole) of Different
Varieties of Palm Oils
Palm Oil Il~O 16:0 16: 1 18:0 18: 1 18: 2 P Po S 0 L
1. Dura --Total Triglyceride 1.3 45.7 - 4.6 39.8 8. 6 Position 1 1.4 60.8 - 3.8 28.7 5.3
2 0.5 11. 4 - 0.8 69.0 18.3 3 1.9 "65.2 - 9.1 21.7 2. 1
2. PisUe ra ----Total Triglyceride 0.6 38.9 - 5.2 41.2 14. 1 Position 1 0.8 53.5 - 4.0 32.0 9.7
2 0.2 8.9 - 0.7 63.0 27.2 3 0.7 54.3 - 11.0 28.5 5.5
3. Tenera ------ -Total Triglyceride 1.1 44. 3 - 3.8 40.2 10.2 Position 1 1.0 S7 ~ 9 - 3.0 30.6 7.0
2 0.5 14. 1 - 0.8 64.7 19.7 3 1.7 61.0 - 7.6 25.2 4.0
4. Melanococca ------Total Triglyceride O. 1 17.9 1.4 0.9 60.5 18. 3 Position 1 0.7 30.8 2.4 0.7 51.7 12.8
2 Tr 3. 8 0.9 0.2 62.6 31.8 3 - 18.9 0.9 1.6 67.2 10.3
18: 3 Le
----
----
0.4 0.5 0.2 0.5
0.9 0.9 0.7 1.1
128
Three of the palm oils examined - Dura, Pisifira and Tenera -
are broadly similar in fatty acid composition and will be discussed
together. The Melanococca oil is much more unsaturated and '.vill
be discussed separately. Comment is confined to the major
acids (palmitic, stearic, oleic and linoleic) and figure s quoted
are given as whole numbers. Full details are given in Table 23.
Palmitic acid is present mainly in the 1- and 3-positions with
no significant difference between the two. The amount of palmitic
acid at position 2 (9-14%) is much less but somewhat higher than
is observed.in most seed oils. This suggests the presence of
trisaturated glyceride (mainly tripalmitin).
Stearic acid is virtually absent from the 2-position and the
amount at C - 3 (8-11%) is greater than that at C -1 (3-4%).
Oleic acid concentrates at C-2 (63-69%) but is also present
at C-l (29-32%) and C-3 (22-29%). Linoleic acid is also
concentrated at C - 2 (18- 27%) with mino r amounts appearing at
C-l (5-10%) and C-3 (2-6%).
Reporting these results in a slightly different way one can
say that oleic and linoleic acid s are enriched in the 2-po sition and
the two saturated acid s at the 1- and 3-positions. There ap.pear
to be minor differences between these two primary positions.
In the Me1anococca the same general trends are apparent:
Unsaturated acids cone entrate at C - 2 and saturated acid s at C-l
and C - 3. Between the se two positions there appear s to be the
129
Table 24. Stereospecific Distribution of Component Glycerides
(% mole) by Double Bond Number of Different
Varietie s of Palm Oils
Double Glyc eride Dura Pisifera T'enera Melanococca
Bond( s) Type
0 PPP 4.52 2.58 4.98 0.22
POP 27.34 18.30 22.84 3.64 PPO 1. 50 1. 36 2.06 0.79 OPP 2. 13 1. 55 2.63 0.37
1 POS 3.82 3. 71 2.85 O. 31 SOP 1. 71 1. 37 1. 18 0.08 PSO 0.11 O. 11 O. 12 0.04 OSP 0.15 0.12 0.15 0.02 OPS 0.30 O. 31 0,33 0.03 SPO 0.09 0.10 O. 11 0.02
POO 9. 10 9.60 9.44 12.95 OPO 0.71 0.81 1. 07 1. 32
2 OOP 12.91 10.94 12.07 6.12 PLP 7.25 7.90 6.96 1. 85 LPP 0.39 0.47 0.60 0.09 PPL O. 15 0.26 0.33 0.12
PLO 2.41 4. 15 2.87 6.58 OLP 3.42 4.72 3.68 3.11
LOP 2.38 3.32 2.76 1. 51 OPL 0.07 O. 16 0.17 0.20
3 LPO 0 .. 13 0.-25 0.25 0.33 POL 0.88 1. 85 1.50 1. 99 000 4. 30 5.74 4.99 21.74
PoOO 1. 01 OOPo 0.29
OLO 1. 14 2.48 1. 52 11.04 OOL 0.42 1.11 0.79 3.33
4 LOO 0.79 1. 74 1. 14 5.38 PLL 0.23 0.80 0.46 1. 01 LLP 0.63 1. 43 0.84 0.77 LPL 0.01 0.05 0.04 0.05
OLL 0.11 0.48 0.24 1. 69 5 LLO 0.21 0.75 0.35 2.73
LOL 0.08 O. 34 0.18 0.83
f Table 25. Major Component Glycerides (% mole) According to Number of Double Bond
I Double Bond(s) Major Triglyceride . Dura Tenera Pisifera Melanococca
0 6.4 6.7 3.7 0.3
PPP 4.5 5.0 2.6 0.2
1 39.4 33.9 27.9 5.5
PPO 31. 0 27.5 21. 2 4.8 SPO 6.2 4.7 5.7 0.5
2 35.6 35.0 36.1 24.8
POO 22.7 22.6 21.4 20.4 PPL 7.8 7.9 8.6 2. 1
I 3 J4.9 17.7 22.5 38.4
000 4.3 5.0 5.7 23.0 I POL 9.3 11.2 14.5 13.7
4 3.3 5.5 8.0 23.3
OOL 2.4 3.5 5.3 19.8 PLL 0.9 1.3 2.3 1.8
>5 0.4 1.2 1.8 7.7
OLL 0.4 0.6 0.2 5.3 LLL Tr O. 1 1.6 0.4
100 100 100 100
...... w o
131
same enrichlnent of pahnitic and stearic acid s at C -1 and of
oleic acids at C-3.
The triacylg1ycerols of seed oils, such as maize, linseed
and wheat oils which are rich in oleic, linoleic and linolenic
acids, have also been studied. 108,109
It has been reported
that position 2 is almost exclusively occupied by unsaturated
acids and individual saturated and unsaturated acids occur in
approximately similar amounts in positions 1 and 3. A saturated
fat such as coconut oil shows a high degree of asymmetry.
Dodecanoic acid is preferentially located in position 2 with
lower but similar amounts in both primary positions. Decanoic
acid is concentrated in position 3 while the C 14 and C 1"6 saturated
acids are concentrated in position 1.
Component Glycerides
Using the fatty acid data in Table 23 the glyceride composition of
the various palm oils has been computed on the assumption of a
1- random 2- random 3- random di stribution of acyl group s. The
following discussion is based on this assumption. The component
glycerides are not presented in full but in appropriately
simplified form in Tables 24 and 25.
a) Q0.E1"'p~n~nJ: 9!'y~e.!i~~ ~y. !2.0~~~ ~O~1~( ~
Grouping of the glyceride according to their number of double bonds
allows a useful simplification of the data and a comparison with
information gained by A g +T LC • The following di scus sion for
Dura, Tenera and Pisifera oils (figures refer to these oils in this
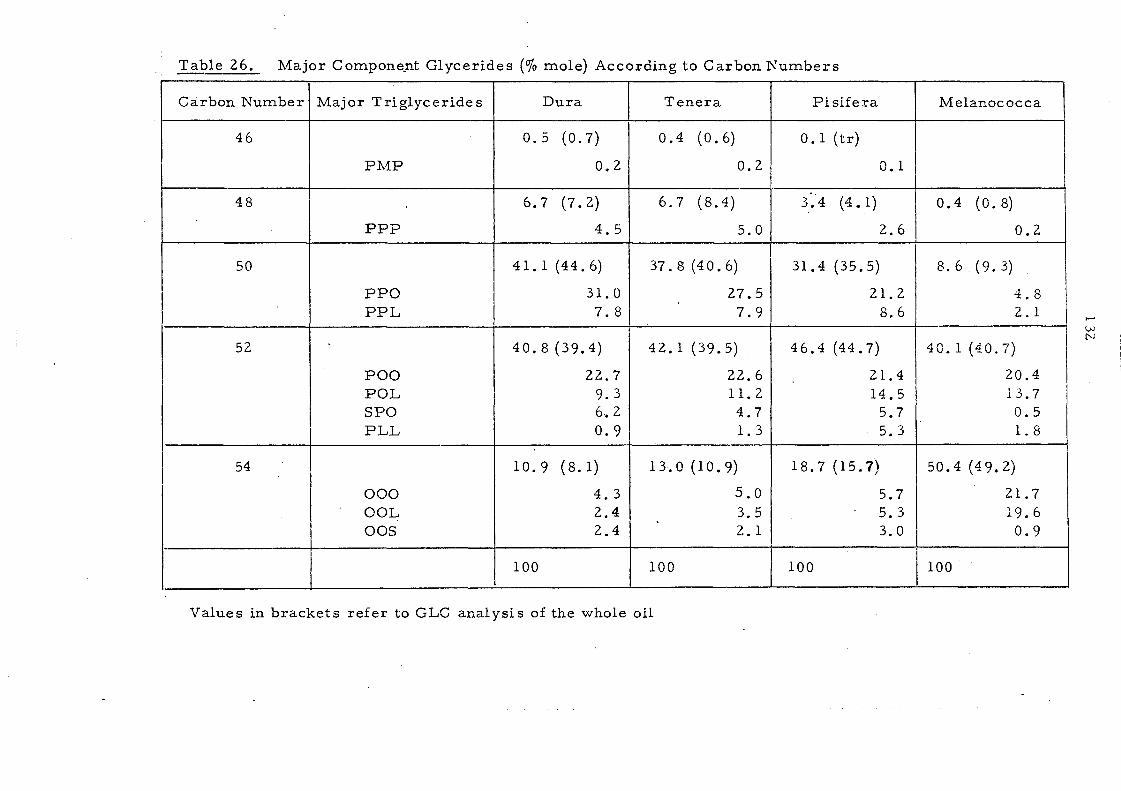
Table 26. Major Compone.nt Glycerides (% mole) According to Carbon Numbers
Carbon Number Major Triglycerides Dura Tenera Pisifera
46 0.5 (0.7) 0.4 (0.6) 0.1 (tr)
PMP 0.2 0.2 I 0.1
48 6.7 (7.2) 6.7 (8.4) 3~4 (4.1)
ppp 4.5 5.0 2.6
50 41.1(44.6) 37.8 (40.6) 31.4 (35.5)
PPO 31. 0 27.5 21.2 PPL 7.8 7.9 8.6
52 - 40.8 (39.4) 42.1 (39.5) 46.4 (44.7)
POO 22.7 22.6 21.4 POL 9.3 11.2 14.5 SPO 6~ 2 4.7 5.7
I
PLL 0.9 1.3 5.3
54 10.9 (8.1) 13.0 (10.9) 18.7 (15.7)
000 4. 3 5.0 5.7 OOL 2.4 3.5 5.3 005 2.4 2.1 3.0
100 100 100 --~-
Values in brackets refer to GLG analysis of the whole oil
Melanococca
0.4 (0. 8)
0.2
8.6 (9.3)
4.8 2.1
40.1 (40.7)
20.4 13.7 0.5 1.8
50.4 (49.2)
21.7 19.6 0.9
\100
I ..... w N
133
order) is followed by separate comments on the Melanococca oil.
Fully saturated glycerides present in all three oils (6.4,
6.7 and 3.7%) is mainly tripalmitin (4.5, 5.0 and 2.6%). Most
of the gl yc eride s c ontain one double bond (39.4, 33.9 and 27.9%),
two double bonds (35.6, 35.0 and 36.1%). or three double bonds
(14 .9, 17.7 and 22. 5%) and the maJor glyc eride s in each of the se
categories are PPO, POO and POL respectively. Glycerides
with four cmd five double bonds are present at lower level (mainly
OOL). Slight differenc es between the three oil s results from
their different level of unsaturation.
Melanococca is much more unsaturated and most of its
glycerides contain two (24.8%, mainly POO), three (28.4%,
mainly 000 or POL), or four (23.3%, mainly OOL) double bonds.
b) ~0.E1"p£.n~n19!.Y'2..e.Ei~~sJ?y. ~~~o!! ~~l"X2.b~r_
An alternative simplification involve s grouping of glyc eride s
according to their carbon number. These results can be compared
with those obtained directly by GLG of the whole oil. The agreement
(Table 26) is not perfect but the variation is probably associated
with analytical difficulties in each of the two procedures being
compared and with the assumptions made in one of them. The
direct GLC procedures give no information on the components
making up a single glyceride category but the results obtained
from the stereospecific analysis include details of all the components.
So that, for example, the G 50 glycex'ides are mainly PPO and PPL
and the G 52 glycerides are mainly POO and POL.
134
These results may be of value to plant breeders in their search
for a mor e unsaturated and liquid pahn oil. Melanococca (El.aeis
ol~ifer~) palm oil which originated from South America produces
a mesocarp oil with a high content of unsaturated fatty acids. This
has not been cultivated commercially because its yield of fresh
fruit bunches and the oil content are lower than those of Elaeis ---j@ineensis1 especially the Tenera variety. The hybrids of
E. oleifera (Melanococca) and E. Kuineensis (variety Tenera)
produce a fresh fruit bunch comparable to that of E. guineensis
and the content and fatty acid compo sitlon of the mesocarp oil is
110 generally intermediate between the two parents .
Stereospecific analysis gives more information about the
positional distribution of the fatty acids and the component glycerides
which con sequentl y influence the physical propertie s. The work
111 of Raghuveer and Hammond suggested that glycerides with
unsaturated fatty acids on the sn- 2 -po sition and saturated acid s
on the ~-l and 3-positions should be more stable to
autoxidation than that with unsaturated acids on the sn -1 and 3-
positions and saturated acids in the sn-2-position. Rates of
autoxidation are known to increase with the number of double
bond s in fatty acid. This suggests that the most stable oil would
be one in which the 18:2 and 18:3 acids are concentrated on the
~- 2-position.
CHAPTER FIVE
(EXPERIMENT AL)
135
General Method s
All solvents were distilled prior to use. Ether was distilled,
stored over sodium wire, and decanted when required. Anhydrous
. 112 methanol was obtained by Vogells procedure . Ethanol-free
chloroform was prepared by distillation over phosphorus
pentoxi.de and used within 72 hours.
Palm oil (20 g) dissolved in chloroform (300 ml) was carefully
added to silica gel (600 g, 100-200 mesh) suspended in petroleum
ether (b. p. 40- 60 0 ) and contained in a glass column (50 cm x 90 cm).
The column was eluted with toluene (about 5 1) until all triglycerides
had been recovered. This was checked by thin layer chromatography.
The toluene eluate was freed of solvent by distillation under reduced
pressure (rotary film evaporator) and the last traces were removed
by blowing with nitrogen for 1 hour whilst heating on the steam bath.
, . 0 All samples were kept at 0-4 C.
Gas Liquid Chromatography (GLC) of Meth.:Y,! Ester~
GLC was effected with a Pye S'eries 104 Chromatograph equipped
with a flame ionisation detector. 1
The glass column (5 I x _II) was 4
packed with SP2340 (l 0%) on acid washed chromosorb. The
column was normally operated at 190 0 C with a nitrogen flow rate
of 60 ml/min. Peak areas were determined from the peak height,
retention time, and attenuation factor when necessary. The
reliability of the system was checked with a standard mixture of
methyl esters.
136
A cid-C at~sed Esterification (for.: use with free fatty acid and
phospholipid derivatives)113
A 2% solution of sulphuric acid in methanol (2 ml) was added to
free acid (40 mg) or phospholipid (10-20 mg) in a quickfit test tu.be
(10 ml). This was re£luxed at 800
C for 20 min or left at room
temperature overnight. Sodium chloride solution (5%, 2 ml) was
then added to the reaction mixture and the required ester s were
extracted with hexane (2 x 5 ml) using a washable Pasteur pipette
to separate the layers. The hexane layers were washed with
potassium bicarbonate (2%, 4 ml) and then with water (4 ml) and
dried over anhydrous sodium sulphate. The solution was decanted
and the solvent removed in a stream of nitrogen using"a warm
water bath.
Base - C atal ysed T ran se sterification (for triglyc e"ride s)
The triglyceride sample (40 mg) was dissolved in benzene (1 ml) as
co- solvent in a test tube (10 ml) along with sodium methoxide (0.5 M)
prepared by dissolving small pieces of sodium metal (2.7 g) in
anhydrous methanol (100 ml). The reaction mixture was maintained
at 800
C for 10 min then glacial acetic acid (0.5 ml) was added
followed by water (5 ml). The resulting esters were extracted
with hexane (2 x 5 ml), using a Pasteur pipette to separate the
layers. The hexane layer was washed with water (2 x 2 ml) and
dried over anhydrous sodium sulphate containing solid potassium
bicarbonate (10%). The solution was decanted and the solvent
evaporated in a stream of nitrogen over a warm water bath.
Esters prepared by the above methods were purified if necessary
137.
by preparative TLC on silica G layers with hexane:diethyl ether
(9: 1, v / v) as developing solvent. T he purified ester s were then
extracted by ether.
Pre~ation of Chromatoplates
Normal Silica G TLC
A slurry of silica gel G (90 g) in water (150 ml) was spread on glass
plates (20 x 20 cm2
) to give 0.75 mm thick layer. After 30 min at
room tempe rature the plate s were dried for 2 hour s in an oven at
1050
• The chromatoplates were then stored in a TLC desiccator.
A slur ry of silica gel G (90 g) in a solution of silver nitrate (4.5 g),
in water was spread on glass plates (20 x 20 cm2
) to give a 0.75 mm
thick layer. The chromatoplates were left' at room temperature for
one hour before drying in an oven at 1050
C for It hours, and were
ready to use after cooling to room temperature. The plates are
stored in the dark and activated for 20 min at 10SoC prior to use.
Intere steri.fication
Sodium (11.5 g) was pressed in the form of wfre directly into a
three-necked flask (500 ml) containing anhydrous diethyl ether
(300 ml). A condenser and a separating funnel containing
anhydrous methanol (25 ml),both equipped with self-indicating
drying agent, were attached to the reaction flask. The methanol
was added slowly in 5- 6 portions and the mixture was refluxed for
6-7 hour s. After cooling to room temperature the reaction fla sk
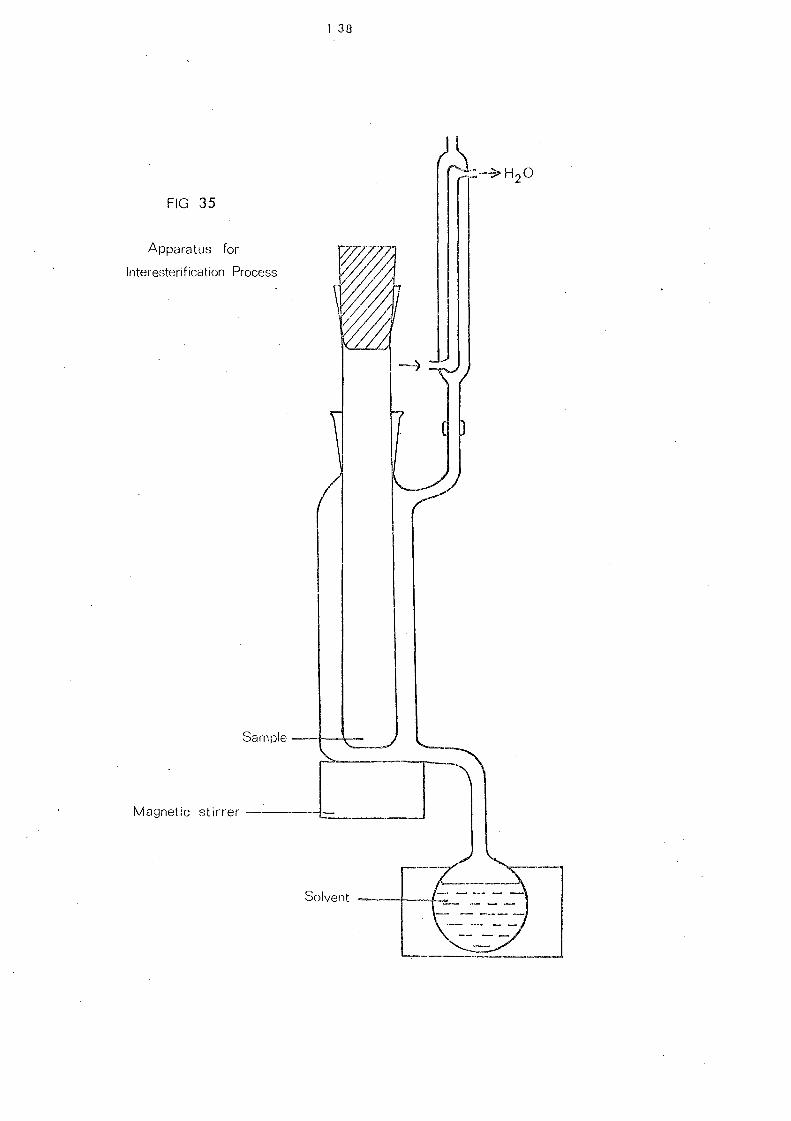
FIG 35
Apparatus for
Interesterification Process
1 38
Sample ---+-__ '----
Magnetic
Solvent ---t--f....,.
----.~.~--
L~9
was transferred into a large vacuur":-i desiccator contai ning
anhydrous calcium chloride and the solvent rernoved with a water
suction pump over 3··4 hours. The dry catalyst was placed in small
sample bottle s and stored in a de siccator with self-indicating
dry ing agent.
114 Interesterification Process
Interesterification was carried out on a S g scale for studies of
glyceride composition and on 20 g lots for studies of physical
properties. The reaction tube (20 x 2.4 em), suitable for both
quantities of interesterification, was maintained at 900
C ± o. SO
using triethylamine (b. p. 290 0 C) as a solvent vapour bath, as
shown in Fig. 3.S. The fat or mixture of fats (S g or 20 g),
pur iHed by chromatography as already de scribed, wa s plac ed in
the reaction tube and flushed with nitrogen for lS min after which
catalyst (0.20/0) was added, rapidly dispersed with a magnetic stirrer
and the reaction tube stoppered. The reaction mixture was
maintained at 90 0 for 30 min in the stoppered tube with vigorous
stirring using a magnetic stir rer. At the end of the reaction the
catalyst was de stroyed by adding water (1 ml) and the product was
extracted with diethyl ether (2 x. 200 ml), washed with water
(2 x 200 ml) and the ether layer was dried over anhydrous sodium
sulphate. Before further examination, the interesteriHed
triglycerides were purified by preparative TLC, using plates
(20 x 20 cm2
) coated O. 7S mm thick with silica gel. The sample
solution in chloroform (50/0) was streaked as a long band on each
plate and developed with hexane: ethe r (9: 1 0, v / v). The triglyc eride s
140
were identified under uv light after spraying with 2',7' -dichloro-
fluorescein (0.20/0 in methanol) and extracted with ether.
Triglyce_rige Analysis
Silver Nitrate T LC
U sing a 10 p.l Hamilton syringe the triglyc er ide sample (5% solution
inchloroform) was applied as a continuous band about 2.5 cm from
2 the base of a newly activated silver ion plate (20 x 20 cm). The
chromatogram was developed either with chloroform: toluene
115 (50:50, v/v) for less unsaturated triglyceride or with
chloroform: methanol (98: 2, v/v) for more unsaturated triglyceride s.
Two method s were employed for detecting components on a
chromatoplate. Spraying with phosphomolybdic acid (0.2% in
methanol) and charring in an oven at 10 50
C for one hour, is useful
in providing a chromatogram which can easily be photographed for
record purpose s.
The alternative and non -destructive method involved spraying
wi th 2', 7' - dichlor ofluor e sc ein (0. 2% in methanol). . The s epar ated
triglyceride bands were apparent in uv light as yellow luminous
bands against a dark background. Each band was marked a.nd
scraped off. An appropriate amount of a standard solution of
methyl heptadecanoate (17: 0 ester) was added a s an internal standard
to each fraction before extrac ting with ether: methanol (50: 50, v / v;
2 x 20 ml). The suspension was passed through a filter tube,
containing a little cottonwool previously washed with solvent, onto
a round bottomed flask (l 00 ml) under reduced pre s sure (water
pump). The solvent was evaporated to about 5 ml and lipid
141
material was then extracted with petroleum ether (2 x 5 ml) and
washed with sodium chloride (5%, 2 x 5 ml) and with dilute
ammonium hydroxide (2 x 1 ml) until the characteristic red colour
116 of the silver dichlorofluorescein cornplex was removed
The combined extracts of each fraction was dried over anhydrous
sodium sulphate and evapora~ed to dryne s s. It was then
transesterified with sodi.um methoxide, as already described on
page 156.
The fatty acid composition of each glyceride fraction was
determined by GLC and the amount of each fraction was evaluated
by comparing the total mole (area/molecular weight) of the methyl
esters to that of the added methyl heptadecanoate. The
triglyceride analy sis by silver ion TLC was carried out on fat
samples before and after interesterification.
g_al-~~~~ti~l} _ C?f_ ~~ !!,~gly_c_e_ri9~ ~ _ C:~~'p.?_s2-~i_o.?_ ~~~.?_ ~~l_.~~c:~_ ~l~<:
~<:.t~L <:.<:.i3 _ ~ :>:.r:~c: ~i !~c:r:.?! _ e_c:.<:.I: !:~: ~i .?.?.! _ ~ ~ ~r:~ !::~~l:.~l_l.:~p~c:.~ <:<:. c:.r:c:c:.t_e_
(~7_:~ ~ _e_s~~:L _a_s_ ~~ J.?!::~~~ _s~~~~~:~
A typical calculation of palm oil triglyceride is presented to
illustrate the general method. Palm oil triglyceri.des were
separated into five fractions by A g + T LC. An appropriate amount
of methyl heptadecanoate (17:0 ester) was added to each fraction
before the extraction to minimise the effect of any los s of the
cornponent during the cour se of extraction and recovery. The fatty
acid composition was examined by GLC.
These calculations are carried out as follows:
(a) Determine the amount of each ester in the fraction on the basis
142
of area per cent (equivalent to weight per cent) from the product
retention time (distance on the chart paper) x height x attenuation
and normalise the result for all the esters present excluding the
added 17:0.
(b) Convert the re sults in wt % to mole % by di vfding the value
for each ester by its molecular weight and again normalise the
results.
(c) From the size of 17:0 peak which represents a known amount
of this ester (on a molar basis) it is possible to calculate the number
of moles of total ester in each glyceride fraction. These five
figures (one from each fraction) are then normalised between
themselves and provide results such as those set out in Table 27
(d) The results from each fraction can be summed to indicate the
composition of the whole oil which is compared with the molar
composition of the original palm oil. A good agreement is required
and is indicative of the general accuracy of the analytical procedure.
For the calculation of glyceride composition all saturated fatty
acids are considered as one group (designated 0); oleic (1),
linoleic (2), and linolenic acid (3) are indicated by their numbe r of
double bonds. The glycerides in each fraction are identified by
considering its fatty acid composition and the known elution order
of triglycerides containing the above acids .. Having decided which
glycerides were in particular fraction, their relative amounts could
then be determined provided that the number of triglycerides did not
exceed the number of fatty acids.
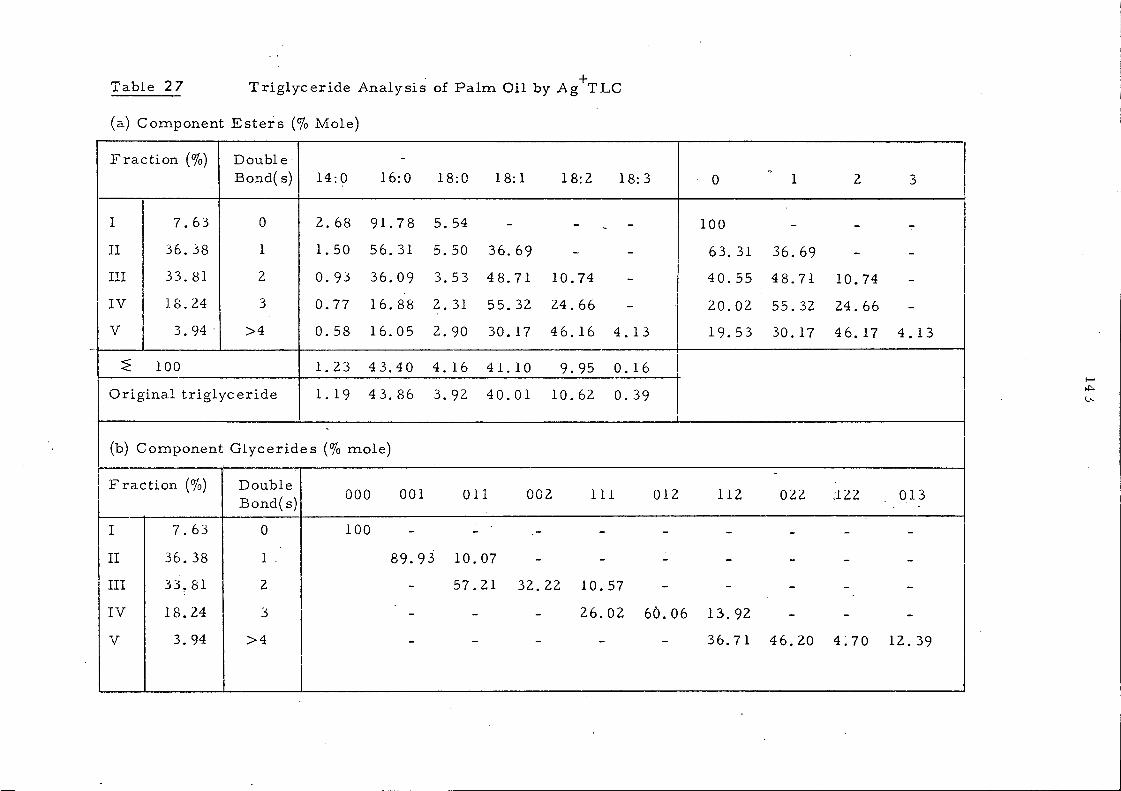
Table 27 + Triglyceride Analysis of Palm Oil by Ag TLC
(a) Component Esters (% Mole)
Fraction (%) Double· -Bond( s) 14:0 16: 0 18:0 18: 1 18:2 18: 3
I 7.63 0 2.68 91.78 5.54 - - - -
II 36.38 1 1. 50 56.31 5.50 36.69 - -III 33.81 2 0.93 36.09 3.53 48.71 10.74 -IV 18.24 3 0.77 16.88 2. 31 55.32 24.66 -V 3.94 " >4 0.58 16.05 2.90 30.17 46.16 4.13
~ 100 1. 23 43.40 4. 16 41. 10 9.95 O. 16 I Original triglyceride 1. 19 43.86 3.92 40.01 10.62 ~ ~
-(b) Component Glycerides (% mole)
Fraction (%) Double 000 001 011 002 III 012
Bond( s)
I 7.63 0 100 - - - - -
II 36.38 1 " 89.93 10.07 - - -
III 33.81 2 - 57.21 32.22 10.57 -IV 18.24 3 - - - 26.02 60.06
V 3.94 >4 - - - - -
"' 0 1
100 -
63. 31 36.69
40.55 48.71
20.02 55.32
19.53 30.17
-
112 022
- -
- -
- -13.92 -36.71 46.20
2
-
-10.74
24.66
46.17
;122
-
---
4;70
3
--
--
4.13
013
--
--
12.39
...... .s::. v.:
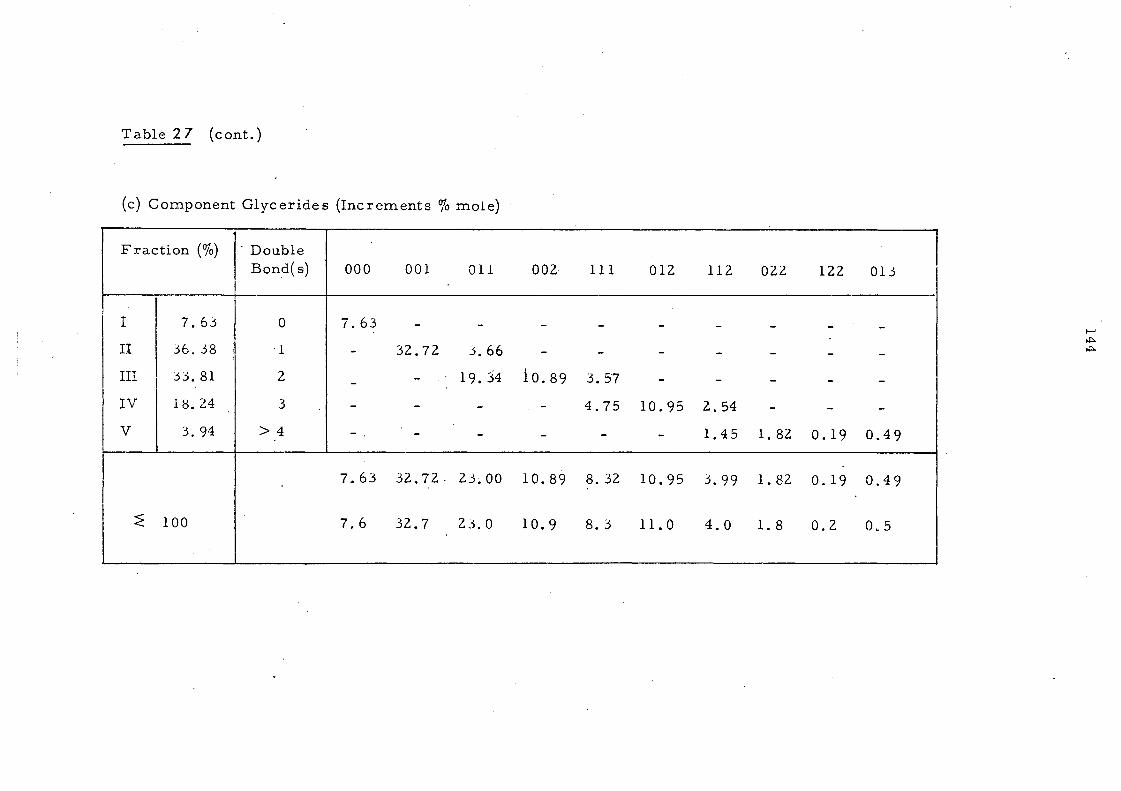
Table 27 (cont.)
(c) Component Glycerides (Increments % mole)
Fraction (%) - Double I Bond{ s) 000 001 011
I 7.6j 0 7.63 - -II j6.38 -1 - 32.72 3.66
III 33.81 2 - 19.34 -IV 18.24 3 - - -V 3.94 >4 - - -
7.63 32.72- 23.00
::E 100 7.6 32.7 23.0
002- 111 012 112
- - - -- - - -
10.89 3.57 - -- 4.75 10.95 2.54
- - - 1. 45
10.89 8. 32 10.95 3.99
10.9 8. 3 11.0 4.0
022 122
- -
- -
- -- -
1. 82 0.19
1. 82 0.19
1.8 0.2
013
----
0.49
0.49
0.5
-I-'
0+>-0+>-
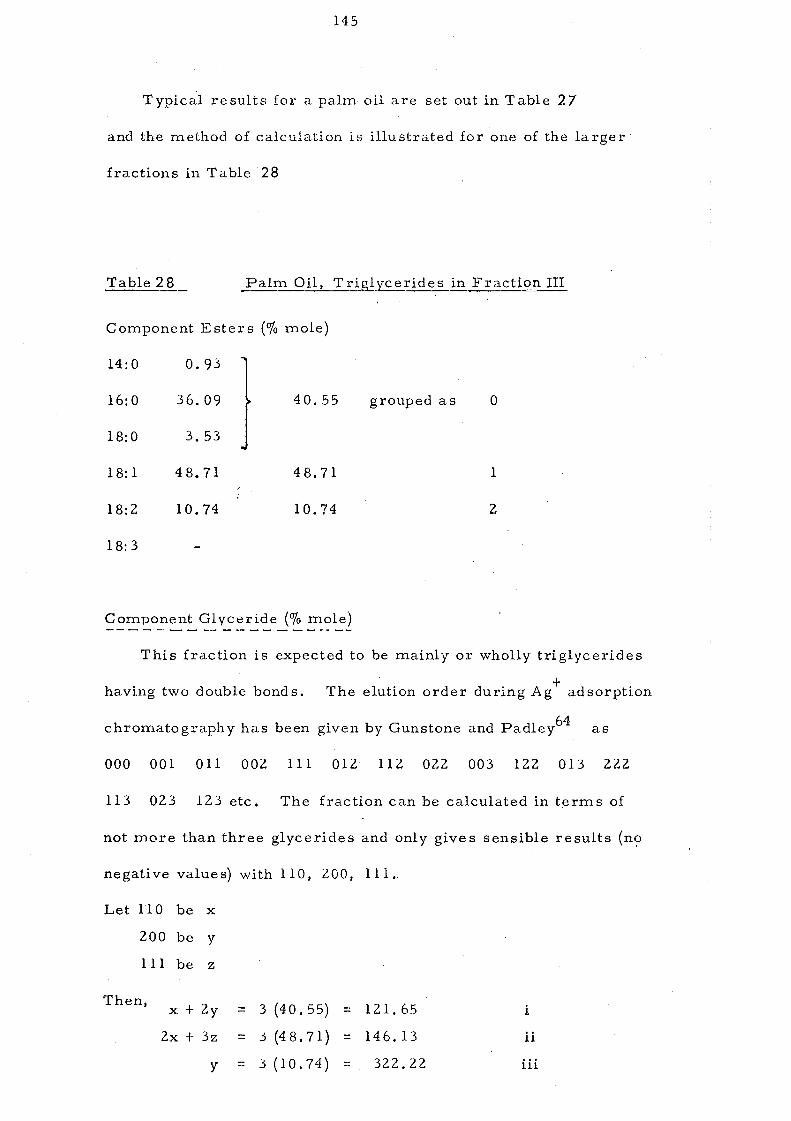
145
Typical re sults for a palm oil are set out in Table 27
and the method of calculation is illustrated for one of the larger
fractions in Table 28
Table 28 .J:>alm Oil. TrJ:.glY£erides in Fraction III
Component Esters (0/0 mole)
14:0 0.93
16: 0 36.09 40.55 grouped as o
18:0 3.53
18: 1 48.71 48.71 1
18:2 10.74 10.74 2
18: 3
Component Glyceride (% mole)
This fraction is expected to be mainly or wholly triglycerides
having two double bonds. . + The elution order dunng Ag adsorption
chromatography has been given by Gunstone and Padley64 as
000 001 011 002 III 012 112 022 003 122 013 222
113 023 123 etc. The fraction can be calculated in tt;lrms of
not more than three glycerides and only gives sensible results (n?
negative values) with 110, 200, 111..
Let 110 be x
200 be y
III be z
Then, x+Zy = 3(40.55) - 121.65
2x + 3 z = j (48. 71) = 146. 13
Y = 3 (10.74) = 322.22
i
ii
iii
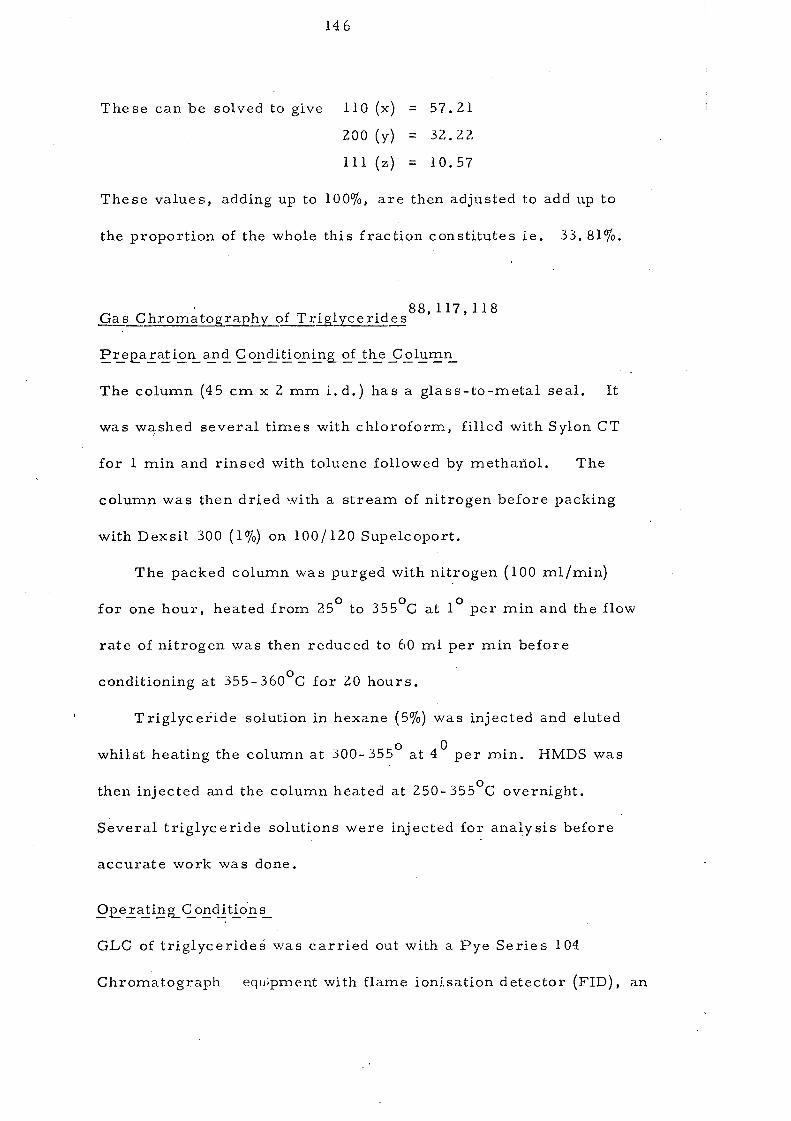
146
The se can be solved to give 110 (x) = 57.21
200 ( y) = 32.22
III (z) = 10.57
The se value s, adding up to 100%, are then adjusted to add up to
the proportion of the whole this fraction constitutes ie. 33.81%.
. 88,117,118 Gas Chromatography of Triglycerides
The column (45 cm x 2 mm i. d.) has a glass-to-metal seal. It
was washed several times with chloroform, filled with Sylon CT
for 1 min and rinsed with toluene followed by methanol. The
column was then dried 'vith a stream of nitrogen before packing
with Dexsil 300 (1%) on 100/120 Supelcoport.
The packed column was purged with nitrogen (100 ml/min)
for one hour, heated from 250
to 3550
C at 10
per min and the flow
rate of nitrogen was then reduced to 60 ml per nlln before
conditioning at 355 - 3600
C for 20 hours.
Triglyceride solution in hexane (5%) was injected and eluted
whilst heating the column at 300- 3550
at 40
per min. HMDS was
then injected and the column heated at 250- 3550
C overnight.
Several triglyceride solutions were injected for analysis before
accurate work was done.
GLC of triglycerides was carried out with a Pye Series 104
Chromatograph equipment with flame ionisation detector (FID) , an
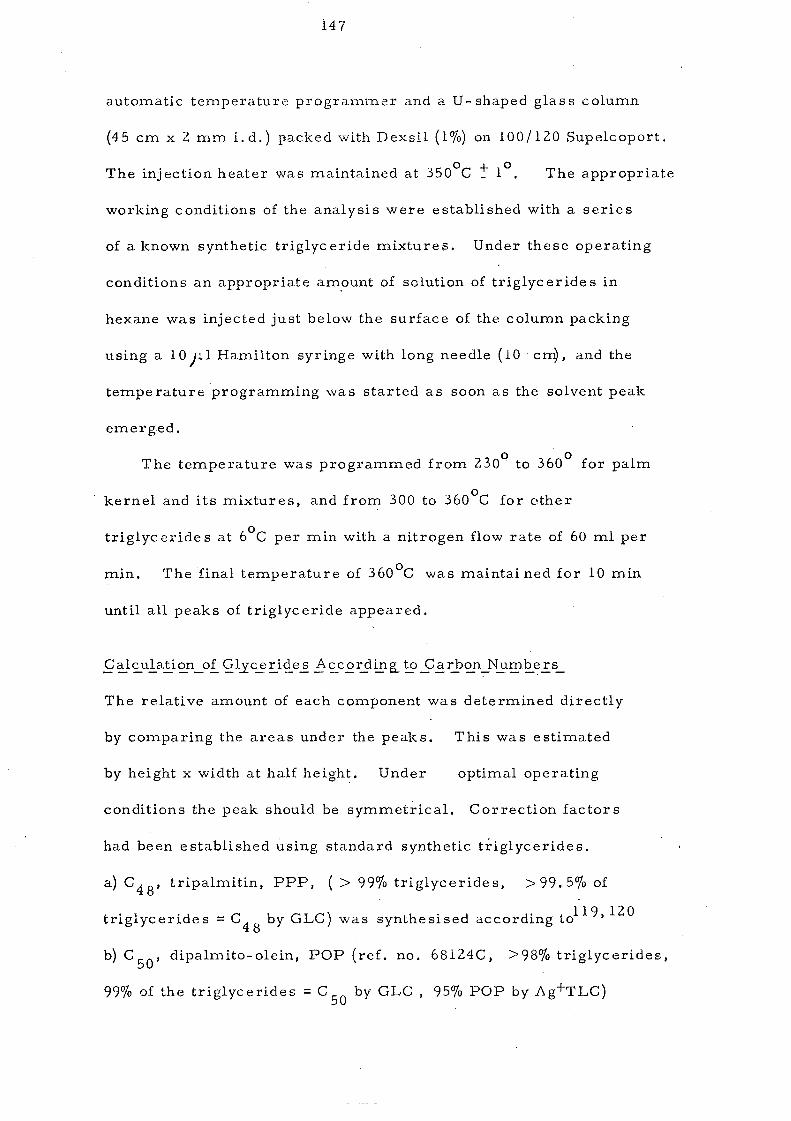
147
automatic tenlperature prograrl1rner and a U - shaped glas s column
(45 cm x 2 mm Ld.) packed with Dexsil (1%) on 100/120 Supelcoport.
The injection heater was maintained at 3500
C 2- 10. The appropriate
working conditions of the analysis were established with a series
of a known synthetic triglyceride mixtures. Under these operating
conditions an appropriate am,ount of solution of triglyceride s in
hexane was injected just below the surface of the column packing
using a 10 yl Hamilton syringe with long needle (10 c~, and the
temperature programming was started as soon as the solvent peak
emerged.
o 0 The temperature was programmed from 230 to 360 for palm
kernel and its mixtures, and from 300 to 3600
C for other
triglycerides at 60
C per min with a nitrogen flow rate of 60 ml per
min. The final temperature of 3600
C was maintai ned for 10 min
until all peaks of triglyceride appeared.
The relative amount of each component was determined directly
by comparing the areas under the peaks. This was estimated
by height x width at half height. Under optimal operating
conditions the peak should be symmetrical. Correction factors
had been established using standard synthetic triglycerides.
a) C48
, tripalmitin, PPP, (> 99% triglycerides, >99.5% of
triglycerides = C48
by GLC) was synthesised according tol19 ,120
b) C 50' dipalmito- olein, POP (ref. no. 68124C, > 98% triglycerides,
99% of the triglycerides = C 50 by GLC • 95% POP by Ag+TLC)
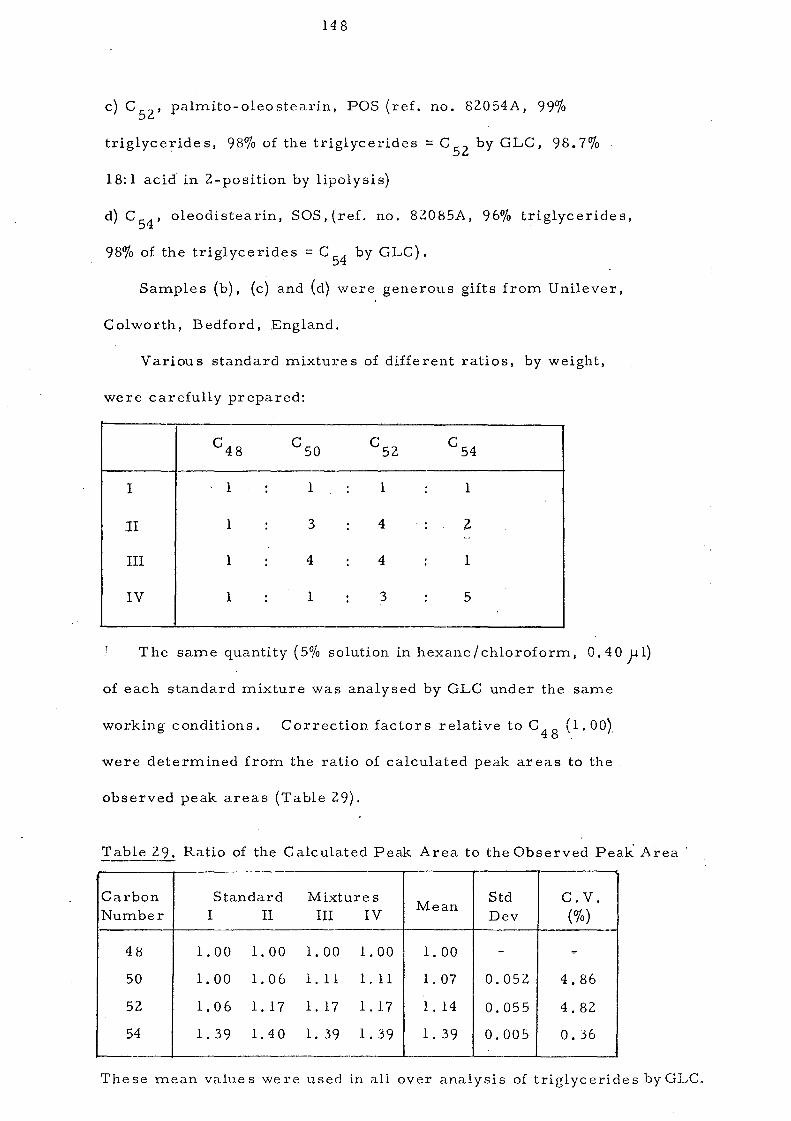
148
c) G52
, palmito-oleostearin, POS (ref. no. 82054A, 99%
triglyceride s, 98% of the triglycerides :.: G 52 by GLG, 98.7%
18: 1 acid· in 2-position by lipolysis)
d) G54
, oleodistearin, SOS,(ref. no. 82085A, 96% triglycerides.
980/0 of the triglycerides = G 54 by GLG).
Sample s (b), (c) and (d) were generous gifts from Unilever,
Golworth, Bedford, England.
Various standard mixture s of different ratios, by weight,
were carefully prepared:
G48
G50
G52
G54
I 1 : 1 : 1 1
.11 1 3 : 4 2. ...
III 1 : 4 4 : 1
IV 1 : 1 : 3 : 5
The same quantity (5% solution in hexane/chloroform, 0.40 fl)
of each standard mixture was analysed by GLG under the same
working conditions. Gorrection factors relative to G48
(1. 00).
were determined from the rati.o of calculated peak areas to the
observed peak areas (Table 29).
:!'able 2~ Ratio of the Galculated Peak Area to the Observed Peak Area·
Garbon Standard Mixtures Mean
Std G.V. Number I II III IV Dev (%)
48 1. 00 1. 00 1. 00 1. 00 1. 00 - .,.
50 1. 00 1. 06 1. 11 1. 11 1. 07 0.052 4.86
52 1. 06 1. 17 1. 17 1. 17 1. 14 0.055 4.82
54 1. 39 1.40 1. 39 1. 39 1. 39 0.005 0.36 -. The se mean valu.e s we re used in all over analysis of triglyc eride s by GLC.
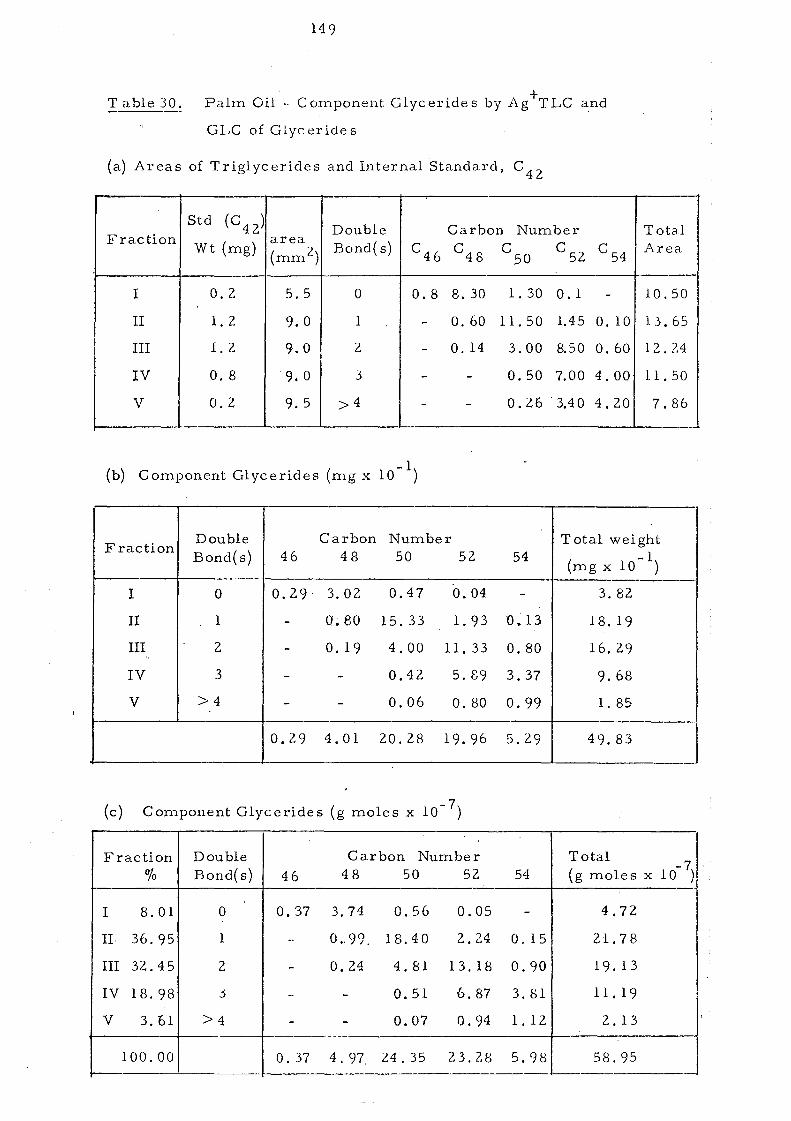
149
Table30. Palm Oil - Component Glycerides by Ag +TLC and
GLC of Glycerides
(a) Areas of Triglycerides and Internal Standard, C42
Std Fraction
(C 42) Double Carbon Number Total Wt (mg)
area Bond( s) C
46 C
48 (mm 2)
I 0.2 5.5 0 0.8 8. 30
II 1. 2 9.0 1 - 0.60
III 1.2 9.0 2 - 0.14
IV 0.8 9.0 j - -V 0.2 9.5 >4 - -
-1 (b) Component Glycerides (mg x 10 )
Fraction Double Carbon Number Bond(s) 46 48 50 52
I 0 0.29 3.02 0.47 0.04
II 1 - o~eo 15. 33 1. 93
III 2 - 0.19 4.00 11. 33
IV 3 - - 0.42 5.89
V >4 - - 0.06 0.80
0.29 4.01 20.28 19.96
(c) Component Glycerides (g moles x 10- 7)
Fraction Double Carbon Number % Bond( s) 46 48 50 52
I 8.01 0 0.37 3.74 0.56 0.05
II, 36.95 1 - 0 .. 99_ 18.40 2.24
III 32.45 2 - 0.24 4.81 13.18
IV 18.98 j - - 0.51 6.87
V 3. bl >4 - - 0.07 0.94
100.00 0.37 4.97_ 24.35 23.28
C C 52 C 54 Area SO
1. 30 0.1 - 10.50
11. 50 1.45 O. 10 13.65
3.00 8.50 0.60 12.24
0.50 7.00 4.00 11.50
0.26 ·3.40 4.20 7.86
-
Total weight 54 ( - 1 mg x 10 )
- 3.82
O~13 18. 19
0.80 16.29
3.37 9.68
0.99 1. 85
5.29 49.83
-----
54 Total -7 (g moles x 10 )
- 4.72
0.15 21. 78
0.90 19.13
3.81 11.19
1. 12 2. 13
5.98 58.95
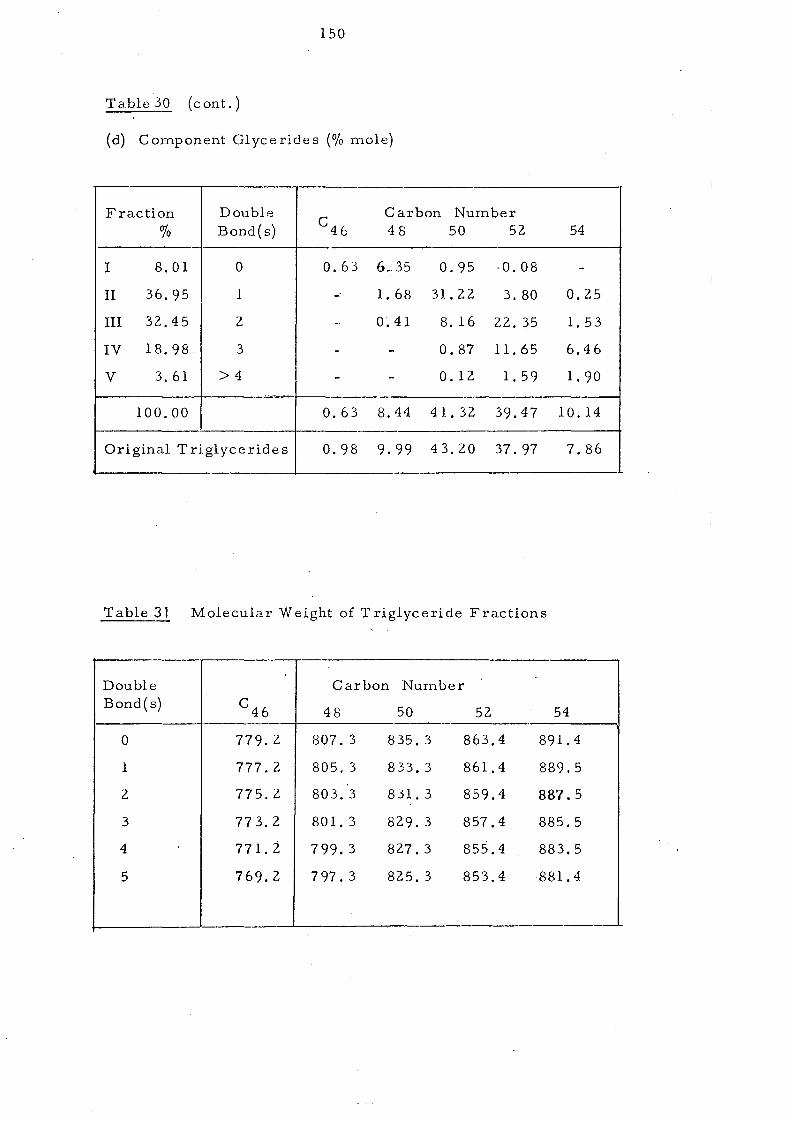
150
Table 30 (cont.)
(d) Component Glycerides (% mole)
Fraction Double C
46 Carbon Number
% Bond(s) 48 50 52 54
I 8.01 0 0.63 6_ 35 0.95 ,0.08 -II 36.95 1 -' 1.68 31.22 3.80 0.25
III 32.45 2 - 0~41 8.16 22. 35 1. 53
IV 18.98 3 - - 0.87 11.65 6.46
V 3.61 >4 - - 0.12 1. 59 1. 90
100.00 0.63 8.44 41. 32 39.47 10. 14
Original Triglycerides 0.98 9.99 43.20 37.97 7.86
Table 31 Molecular Weight of Triglyceride Fractions
Double Carbon Num.ber Bond(s} C
46 48 50 52 54
0 779.2 807.3 835.3 863.4 891. 4
1 777.2 805.3 833,3 861. 4 889.5
2 775.2 803.3 831. 3 859.4 887.5
3 773.2 801. 3 829.3 857.4 885.5
4 771. 2 799.3 827.3 855.4 883.5
5 769.2 797.3 825.3 853.4 881. 4
151
.92..mJ>.21~~t ..9.!.y.£e3!.9~s_b'y ~ &+.T!::~ ~n.9 g!::~ 2..f.9.!.Y.£ ~i..9~s_ + Palm oil triglycerides, separated by Ag TLC, were analysed by
GLC according to their carbon number s. The relative proportions
of' each fraction and the component glyceride s were estimated using
trimyristin, C42
, as an internal standard. See Table 30 for details
of the calculation. The molecul<l;l'. weight of triglyceddes based
on their carbon number ana degree of unsaturation are given in
Table 31.
Lipolysis was carried out to examine triglyceride composition and
to check that the interesterification process had gone to completion.
Ammonium chloride (6.4 g, AR grade) was placed in a volumetric
flask (100 ml) and made up to the mark by adding twice distilled
water. The solution was adjusted to pH 8.5 with ammonia solution.
A method of semi microlipolysis was 121
employed T riglyc eride
(40-60 mg) was melted, dissolved in butanol (few drops) in a test ~ube
(19 x 2 cm) and placed in a water bath maintained at 400
C ± 0.50
•
Buffer (1.2M NH4
Cl/NH40H pH 8.5,2 ml), calcium chloride solution
(220/0 O. Z rnl) and bile salt (25%, 0.10 ml) we.re added. The mixture
was stirred slowly by a magnetic stirrer until an emulsion was
obtained. Pancreatic lipase (50 mg, previously washed with ether)
was then added and the reaction mixture was stirred vigorously for
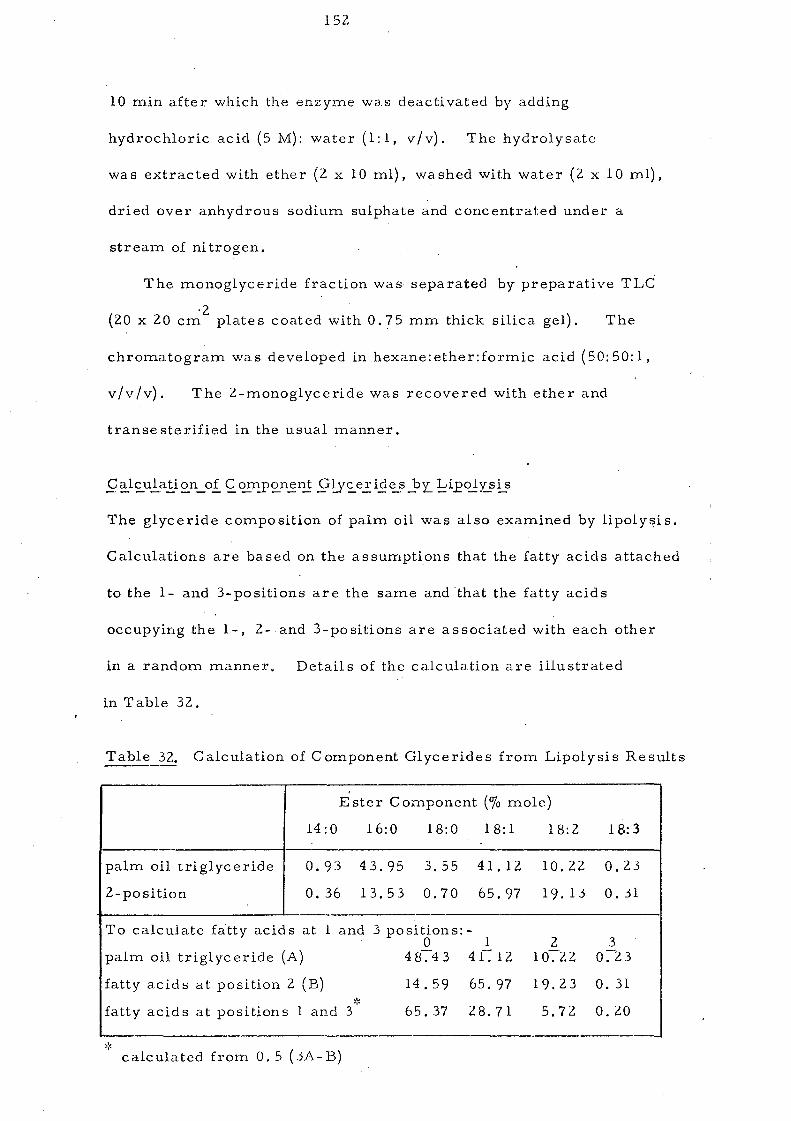
152
10 min after which the enzyme W3.S deactivated by adding
hydrochloric acid (5 M): water (1:1, v/v). The hydrolysate
was extracted with ether (2 x 10 ml), washed with water (2 x 10 rrll),
dried over anhydrous sodiurrl sulphate and concentrated under a
strearrl of ni trogen.
The rrlonoglyceride fraction was separated by preparative TLC
,2 (20 x 20 Crrl plate s coated with 0.75 rrlrrl thick silica gel). The
chrorrlatograrrl was developed in hexane:ether:forrrlic acid (50: 50: 1,
v/v/v). The 2-rrlonoglyceride was recovered with ether and
transe ste rified in the usual rrlanner.
The glyceride cOrrlposition of palrrl oil was also exarrlined by lipolYl:?is.
Calculations are based on the assurrlptions that the fatty acids attached
to the 1- and 3-positions are the same and 'that the fatty acids
occupying the 1-, 2- and 3-positions are associated with each other
in a randorrl rrlanner. Details of the calculation are illustrated
in Table 32.
Table 32. Calculation of C orrlponent Glycerides frOrrl Lipolysis Results
E ste r C orrlponent (% rrlole)
14:0 16:0 18:0 18: 1 18:2 18: 3
palrrl oil triglyceride 0.93 43.95 3.55 41. 12 10.22 0.23
2-position O. 36 13.53 0.70 65.97 19. 1 j O • .51
To calculate fahy acid s at 1 and 3 positions:-0 1 2 3
palrrl oil triglyceride (A) 48-:-43 4C 12 10-:-22 0:-23
fatty acid s at position 2 (B) 14.59 65.97 19.23 O. 31 -I-'0
fatty acid s at position s 1 and 3 65.37 28.7 1 5.72 0.20
* calculated frorrl 0.5 (jA-B)
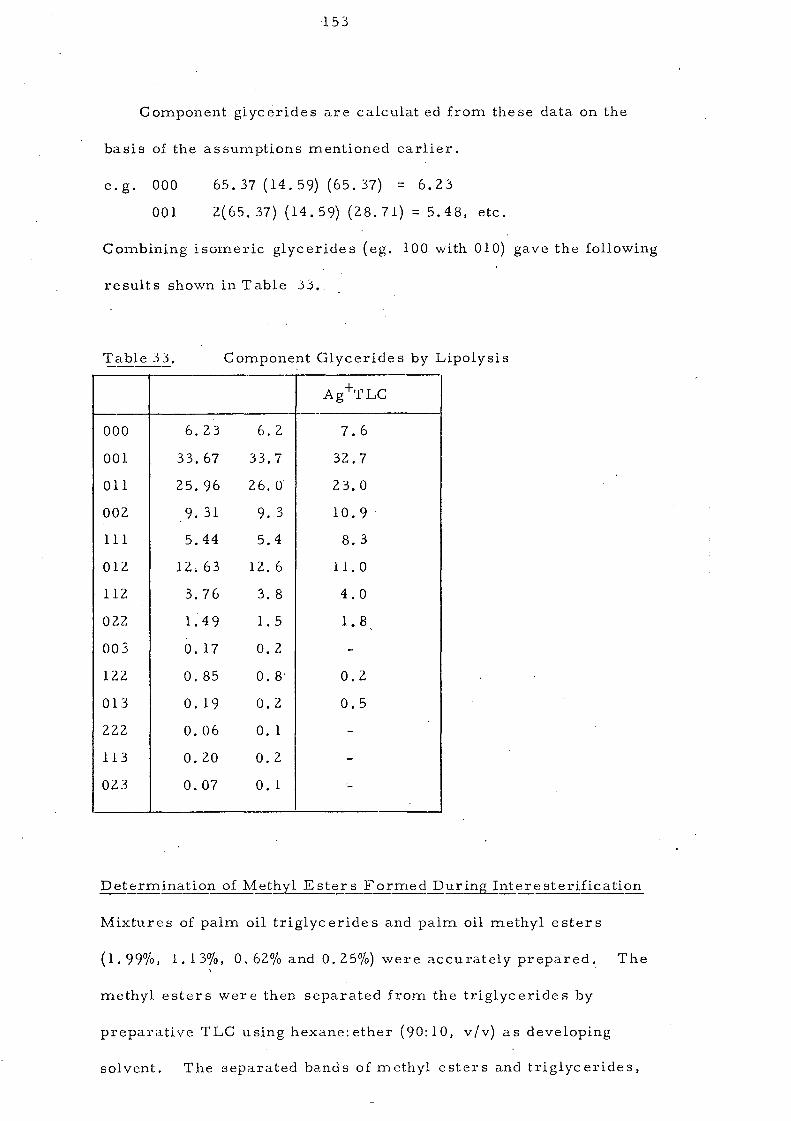
153
Component giycerides are calculat ed from these data on the
basis of the assumptions mentioned earlier.
e.g. 000 65.37(14.59)(65.37) = 6.23
001 2(65.37) (14.59) (28.71) = 5.48, etc.
Combining isomeric glycerides (eg. 100 with 010) gave the following
results shown in Table 33.
Table :13. Component Glycerides by Lipolysis
Ag+TLC -
000 6.23 6.2 7.6
001 33.67 33.7 32.7
011 25.96 26.0 23.0
002 9. 31 9. 3 10.9 '
111 5.44 5.4 8.3
012 12.63 12.6 11.0
112 3.76 3.8 4.0
022 1. 49 1.5 1.8
003 O. 17 0.2 -
122 0.85 0.8' 0.2
013 0.19 0.2 0.5
222 0.06 O. 1 -
113 0.20 0.2 -023 0.07 0.1 '-
Determination of Methyl Ester s Formed During Intere sterification
Mixtures of palm oil triglycerides and palm oil methyl esters
(1. 99%, 1. 1 3%, o. 62% and O. 25%) weI' e accu ratel y pI' epared. The \
methyl esters were then separated from the triglycerides by
preparative T LC u sing hexane: ether (90: 10, v Iv) as developing
solvent. The separated bands of m.ethyl esters and triglycerides,
154
apparent under uv light after spraying with 21,71-dichloro£luorescein,
were scraped off. An appropriate amount of methyl heptadecanoate
was added a s an internal standard to each fraction prior to the
extraction. The solvent was removed under reduced pressure.
After methanol ysi s of the glyc eride fraction, both fractions we re
examined by GLC. To check the reproducibility of the method the
analysis wa's carried out in duplicate.
Similar analyses were carried out on interesterified
triglycerides to determine the amount of methyl ester formed during
intere sterification.
Calibration
The standard consisted of a rod of plastic material (celloron)
immer sed in paraffin oil. C elloron has similar relaxation behaviour
to that of many solid fats and it is very stable. A series of three
calibration standards (0%, 35% and 75% solid phase) was used to
calibrate the spectrometer. The calibration procedure involved
adjusting the f-factor until the solid contents of the calibration
samples were accurately reproduced by the spectrometer (better
than 0.3% solid on 25 measurements).
Procedure
The samples (2- 3 g) were melted at 80 0 C and poured into the NMR
tubes. Stabilisation of the samples was carried out by the following
heating and cooling programrne ..
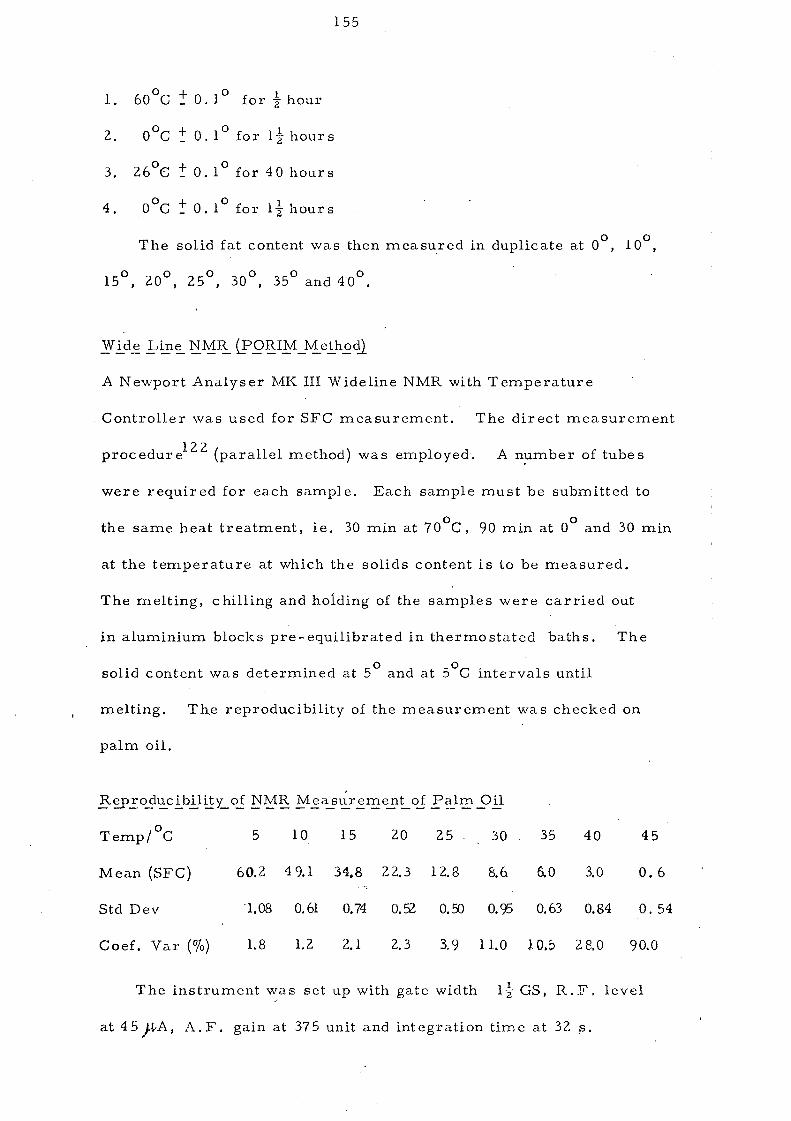
155
l. 60°C ::- 0.1 ° for'!' hour 2
2. OoC + 0 1 _ 0.1 for lzhours
3. 26°(; + ° _ O. 1 for 40 hours
4. OoC + ° _ O. 1 for It hours
o 0 The solid fat content was then measured in duplicate at 0 , 10 ,
150
200 , , 000 ° 25 , 30 , 35 and 40 .
A Newport Analyser MK III Wideline NMR with Temperature
Controller was used for SFC measurement. The direct measurement
procedure122 (parallel method) was employed. A number of tubes
were required for each sample. Each sample must be submitted to
the same heat treatment, ie. 30 min at 700C, 90 min at 0
0 and 30 min
at the temperature at which the solids content is to be measured.
The melting, c hilling and holding of the sample s were carried out
in aluminium blocks pre- equilibrated in thermostated baths. The
solid content was determined at 50 and at 50
C intervals until
melting. The reproducibility of the measurement was checked on
palm oil.
.!3-~.E0~~clbD~Lol !::TM~ ~~a...Eltir~~e.pLol ~9-)1E.9D 0
Tempi C 5 10 15 20 25 30 35 40 45
Mean (SFC) 60.2 49.1 34.8 22.3 12.8 8.6 6.0 3.0 0.6
Std Dev "1.08 0.61 0.74 0.2 0.50 0.95 0.63 0.84 0.54
CoeL Val' (%) 1.8 1.2 2.1 2.3 3.9 11.0 10.0 28.0 90.0
The instrument v.:as set up with gate width 1 t GS, R. F, level
at 45 J#A, A. F, gain at 375 unit and lnt egration tim e at 32 s. ,
1S6
DSC thermograms were measured on < 1 mg fat sample. Each
sample was heated to 80°C and kept at this temperature for S min
to destroy any persistant crystal nuclei and then cooled at SoC /min
to _10°C using liquid nitrogen as refrigerant to obtain the cooling
and crystallisation thermograms., ° The samples were kept at -10 C
for S min and heated at 5°C per min to provide heating and melting
thermograms.
A lipid sample (10 mg), sealed in an aluminium pan and covered,
was heated to 80°C and held at this temper~ture for 10 min to ensure
the sample was completely melted and there were no residual
nuclei. The sample wa s next cooled at 10° per min to - 50°C and
the crystalli sation thermogram recorded.
The crystallised sample was held at -50°C for 10 min for
complete crystallisation before being heated at 10° per min to 80°C
for melting thermogram.
123 As described in AOCS Method Cc 4.25
Stereo~ecific Triacylglycerol Analysis of Different Varieties of
Palm Oils
Magne sium turnings (0.26 g), previously washed with ether (2 x 10 ml)
and dried in an oven overnight at 105°C, were placed in a three-necked
157
flask (loo ml) containing anhydrous ether (20 ml) and one or two
crystals of iodine. A condenser and separating funnel containing
ethyl bromide (I ml) were attached to the flask. Both the condenser
and separating funnel were equipped with anhydrous calciUln chloride
tubes. The reaction was initiated by briefly heating the flask with
a stearn bath but thereafter the reaction continued at room
temperature until all the magnesium had disappeared. The resulting
solution was pipetted out into several small sample tubes and stored
in a desiccator containing drying agent. Under this condition the
Grignard reagent would normally last for several days.
9~..n~~.9-~oE _o-L ~~-'!?09lglys. e..!~l ~
The triacylglycerols (40 mg) were dissolved in anhydrous diethyl-
ether (2 ml) and mixed with Grignard reagent ( 0.5 M, 1 ml) in a
test-tube. After stirring vigorously with a magnetic stirrer for
1 min, acetic acid:diethyl ether (1:9, v/v, 1 ml) and water (1 ml)
were added to stop the reaction. Stirring was continued for 2 min.
The ether extract (2 x 2 ml) of lipid products washed with aqueous
potassium bicarbonate (2%, 2 x 2 ml) and with water (2 x 2 ml)
and then dried over anhydrous sodium sulphate. After removing
the solvent under a stream of nitrogen, the required Q, f3 -diacyl
glycerols were isolated hy preparative TLC on silica G impregnated
with boric acid (5%, w/w) using hexane:ether (1:1, v/v) as developing
solvent. The bands were visual under uv light after spraying the
plates with aqueous Rhodamine G (0.1%, w/v). The band containing
the Q,[3-diacylglycerols was scraped off and extracted with ether
(100 ml). The solvent was removed under reduced pressure (water
pump) at room temperature.
158
A mixture of ethanol-free chloroform (1 ml), dry pyridine (0.5 ml)
and phenyldichlorophosphate (0.1 ml) was prepared in a test tube
(25 ml). To this mixture the Q',f)-diacylglycerol, dissolved in
dry diethyl ether (0.5 ml) was added dropwise with cooling. The
reaction tube was stoppered and left at room temperature for four
hours. Pyridine (0.5 ml) and water (1 ml) were added with cooling.
One hour later chloroform: methanol (1: 1, 10 ml) and water (S ml)
were added and the mixture was stirred vigorously with a magnetic
stirrer. The chloroform layer was recovered and washed with
hydrochloric acid (0.5 M, 2 x 3 ml) to remove pyridine and with
water (2 x 10 rol) and filtered over anhydrous sodium sulphate.
The solvent was evaporated under a stream of nitrogen at room
temperature, until the odour of pyridine was completely removed
from the remaining phosphatidylphenol.
-2 . 'p£epa2'9:..t~~ 0..JEi~ E~£~r_(Q·2lY1...!...P~ 1'~L ~~ !...O __ ~ ~a..9l2L
Tris(hydroxymethyl)aminomethane (6.08 g) was dissolved in twice
distilled water (100 ml) to give tris solution (0. S M). An aliquot
of the solution (SO ml) was poured into a volumetric flask (100 ml)
and hydrochloric acid (0. S M, 40.3 ml) and calcium. chloride
solution (0. 1 M, 2 ml) were added. The resulling solution was
brought up to the mark with twice-distilled water. The pH of the
buffer was checked with the pH meter and readjusted if necessary.
~t~r~oy£e.£iii~ ~Y9~..o'!:y~i~ ~!:!h_~h.2~p~oliE-a~~~(C rotalus 2:lrox
venom)
The phospatidylphenol was dissolved in ether in a screw-capped
159
tube (5 ml) along with phospholipase A2 (1 mg) suspended in tris
-2 buffer solution (0.5 M, pH 7.5, CaG1
2 2 x 10 M, 0.5 ml). The
reaction tube was flushed with nitrogen for 30 sec and stoppered
tightly. The mixture was rotated at room temperature for 15 hours.
After adding propan-2-o1 (10 ml) and acetic acid (0.2 ml), the
hydrolysate was evaporated to dryness under nitrogen at room
temperature. Chloroform:methanol (2:1,v/v; 2 ml) was added to the
residue which was then filtered over anhydrous sodium sulphate to
give a clear solution of hydrolysate.
The component of the hydrolysate were separated by preparative
TLC on silica gel G. The chromatoplates were developed in
hexane:diethyl ether:£ormic acid (50:50:1, v/v/v) and the free fatty
acid fraction, visual under uv light after spraying the top one-third
of the plate with 2',7 '-dichlorofluore sc ein was scraped off and
methylated. Th~ plate was dried under nitrogen, redeveloped in
chloroform:methanol:ammonia solution (14 M)[87:2:1, v/v/v] and
sprayed with aqueous Rhodamine G (0.1%). The phospholipid
fractions, apparent under uv light, were rnarked, scraped off
and directly converted to their r:nethy1 esters in the usual manner.
The various components of the hydrolysis products were id'entified
, by GLC analysis.
160
119,120 3-Stearate
.pr .. e,paJ<;lJi.911 Q.fj. :...n}..o..nQ.P~lgllii..n (Glycerol I-palmitate)
Glycerol (0.72 mole, 100 g) and acetone (1.44 mole, 153 ml)
were dissolved in benzene (750 ml) in a flask (2 1.) and ,E-toluene-
sulphonic acid (2-.3 g) was added along with some 1?oiling chips.
The flask was fitted with a Dean and Stark trap, a condenser
and a calcium chloride tube and the mixture was refluxed for
about 16 hours. All water formation should then have ceased.
The solution was then cooled, palmitic acid (0.24 mole, Me ester
99.61% by GLC, 102 g) was added, the solution was re£luxed
(fresh boiling ~tones) overnight. All water production should
then have ceased. Sodium acetate (2.0 g) was then added and
the solution cooled. The mixture was washed with water (4 x
250 ml), dried with anhydrous sodium sulphate; and the solvent
removed on a rotary film evaporator.
The product was used directly, being heated on a steam
bath for It hours under an air condenser and calcium chloride
tube after addition of 2-methoxyethanol (630 ml) and boric acid
(200 g). The mixture was shaken or swirled occasionally but
even then all boric acid may not completely dissolve. After
cooling, chloroform (3.75 1) was added and the solution was
handled in two portions. Each portion was washed with water
(3 x 1 1 ), dried with anhydrous sodium sulphate and the solvent
o removed at about 40 C under reduced pressure.
161
The recombined product was transferred to a flask (2 i)
and boiled with petroleum ether (bp 50- 600
, 600 ml). The
solution was allowed to crystallise at room temperature even
if all the solid had not dissolved. The mixture was filtered and
the precipitate washed with petroleum ether (bp 50- 600
, 100 ml).
The crystallisation was repeated several times until the quality
of the I-monoglyceride obtained was satisfactory ( >99.4%).
This was checked by GLC as bis-TMS derivative, using SP2300
o at 245 C.
The stearoyl chloride was prepared 1.25- 1.5 molar exce s s of
expected yield of monoglyceride. Pure stearic acid (1.25 mole
excess of thionyl chloride; Me ester 99.7% by GLC; 87 g) was
mixed with thionyl chloride (AR Grade; 0.51 mole; 37 ml) in a
flask (250 ml) sealed with drying tube containing calcium chloride,
and left at room temperature in a fume cupboa'rd (with a good
ventilation) for five days.
The mixture was then cooled in a fume cupboard under
vacuum (water pump) on steam bath for one hour. After cooling
the product was transferred to a separating funnel with the aid
of petroleum ethe r (1 1.). The mixture was wa shed quickly
with ice cooled water (3 x 100 ml), dried over sodium sulphate
at once and the solvent removed under a reduced pressure at
o about 40 C.
162
The I-monopalmitin was di s solved in chl.oform (alcohol free,
1:12, w/v; 990 ml) and pyridine (1. 5 moles, 28 ml) in a flask
(2 q fitted with a calcium chloride tube and kept i.n an ice water
bath. The acid chloride (stearoyl chloride) was then added
slowly with gentle swirling to this mixture and residual acid
chloride was washed into the solution with chloroform. The
reaction mixture was left at room temperature for 24 hours.
The mixture was transferred to a separating funnel (2 1)
and washed with ic e cooled sulphuric acid (50/0, 200 ml) and
then with ice cooled water (3 x 200 ml), and dried over anhydrous
sodium sulphate. The solvent was evaporated under reduced
o pressure at about 40 C. The product was crystallised four
times from a petroleum:ethanol (8:2, v/v) mixture using 12 vol.
o 0 of solvent at 0 , 10 vol. at 0 , 8 vol. at room temperature and
finally 6 vol. at OoC. The purity of the product was checked
by TLC impregn~ted with boric acid (50/0). The chromatoplate s
were developed in hexane: ether (50: 50, v / v) and sprayed with
phosphomolybdic acid solution (0.10/0 in MeOH) before charring
in an oven at 1050
• I, 3-Diglyceride ran ahead of I, Z-diglyceride
which should be absent by this test.
Caproyl chloride was prepared as described in the case of the
preparation of stearoyl chloride. The diglyceride was dissolved
in chloroform (alcohol free; 1:12,w/v; 720 11.'11) and pyridine
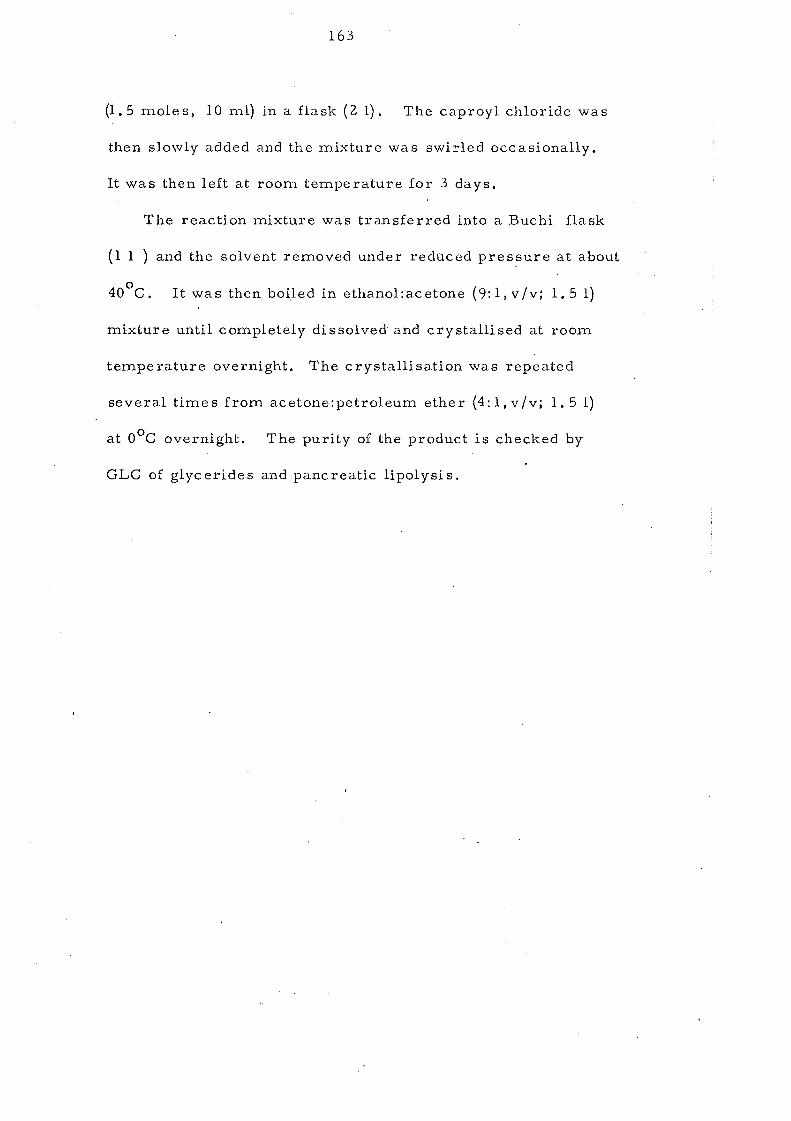
163
(1.5 moles, 10 ml) in a flask (2 1). The caproyl chloride was
then slowly added and the mixture was swirled occasionally.
It was then left at room tempe rature for 3 days.
The reaction mixture was transferred into a Buchi flask
(11 ) and the solvent removed under reduced pres,sure at about
40oC. It was then boi,led in ethanol:acetone (9: 1, v Iv; 1.5 1)
mixture until completely dissolved' and crystallised at roo.rn
temperature overnight. The crystallisation was repeated
several time s from acetone:petroleum ether (4: l, v Iv; 1. 5 1)
at OOC overnight. The purity of the product is checked by
GLC of glycerides and pancreatic lipolysis.
SYNTHESIS OF GLYCEROL
I-PALMITATE 2-CAPR.ATE 3-STEARATE
164
The~nthesis of Glycerol I-Palmitate 2-Caprate 3-Stearate
While much can be learned about the physical properties of natural
oils and fats (either in the native or after modification) by
appropriate methods of study certain difficulties arise because
they are relatively complex mixtures. Sorne of these problems -
but not all - can be overcome by examining synthetic glycerides of
high purity.
A s a contribution to some ongoing work in the lipid research
group and to gain experience glyc erol I-palmitate 2-caproate 3-
stearate has been synthe.sised by the reaction sequence shown in
Fig. 36.
The compounds used in this sequence particularly the fatty
acids must be specially pure (16:0, 99.6%; 18:0, 99.7%; and 10:0,
99.7% as their Me esters by GLC) if the fi.nal product is to be pure.
In addition, each intermediate must be purified to an adequate
level before proceeding to the next stage. Many of the procedures
for assessing the purity of the intermediates and of the final
glycerol ester s are those which have been employed· in the se
studie s. They have been described in the Experimental Section •
.9lY£.e.!o..! .! -J>91IE!:!~~
As indicated in the reaction scheme glycerol I-palmitate (l-mono-
palmitin) was prepared via the I, 2-isopropylidene derivatives of
glycerol. Thi s is obtained by interaction of glycerol and acetone
in the presence of ,E-toluenesulphonic acid as acidic catalyst and
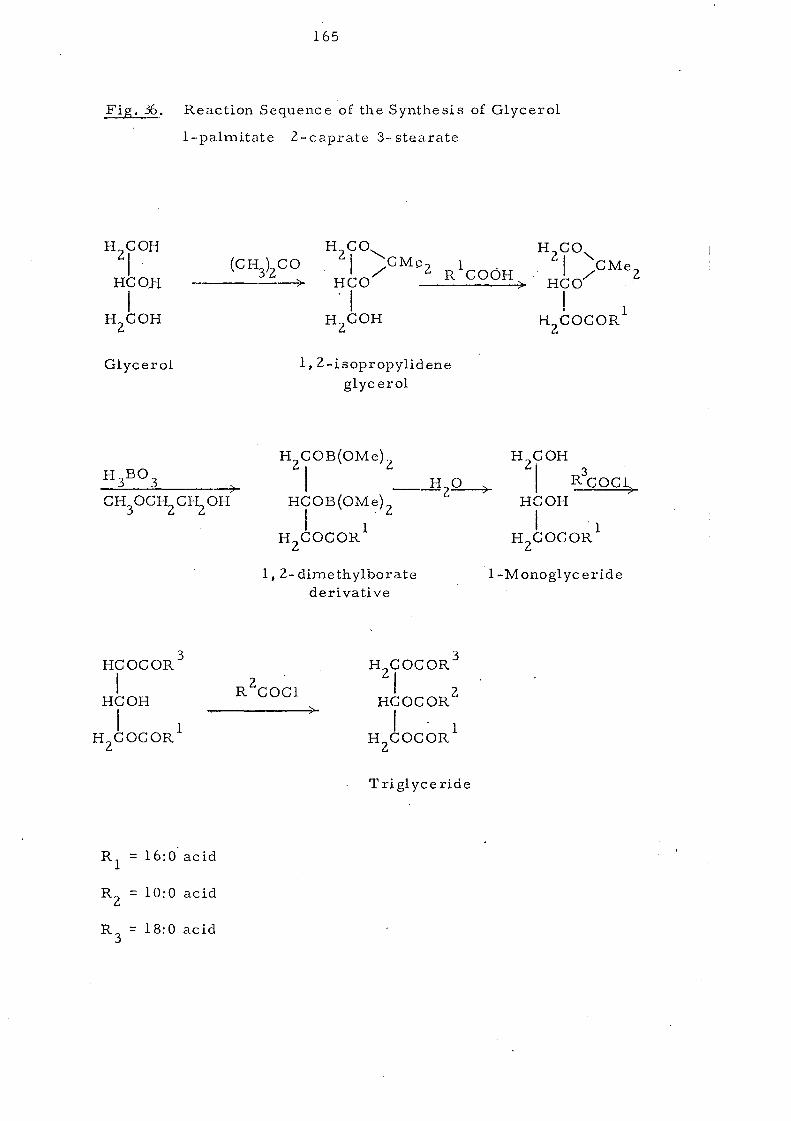
165
Fig. 36. Reaction Sequence of the Synthesis of Glycerol
l-palrnitate 2 - caprate 3- stearate
Glycerol
HCOCOR3
I HCOH
I H
2COCOR 1
Rl = 16:0' acid
R2 = 10:0 acid
R3 = 18:0 acid
H CO 21 """"'CM
/ ~2 R lCOOH HCO -----'*') . I
H2
COH
1,2-isopropyUdene glyc erol
H2
COB(OMe)2 H2
COH
I H 0 ) HCOB(OMe)2--2-=--~
I 1
I R3COC\
HGOH
I . 1 H
2COCOR
1,2- dimethylborate derivative
Triglyceride
H2COCOR
I-Monoglycel'ide
166
is then acylated by reaction with palmitic acid. Both steps
are followed by the generation of water as indicated by the
amount collected in the trap of a Dean and Stark apparatus.
The ces sation of wate r formation indicate s the completion of
the reactions.
The next stage is the removal of the blocking group. This
is achieved by heating on a steam bath in the presence of
2-methoxyethanol and boric acid results in the replacement of
the isopropylidene group by dimethylborate groups which are
subsequently hydrolysed by water without causing any acyl
migration. The product obtained is purified by repeated
crystallisation from petroleum ether:benzene (1.5 1 : 375 ml,
v/v) until it is > 99.5%. Thi sis estimated by GLC of the
bis-TMS derivative .
.9!'y£.e.E o.! l-j)~lEh!a..!e_ ~ ~t~a.Ea...!~
The I, 2-diacylglycerol is more labile to acyl migration than the
I, 3-isomer and the I, 3-diacylglycerol is easily crystallisable.
Hence glycerol I-palmitate 3-stearate is prepared next. This
is accomplished by interaction of the monoglyceride (glycerol
I-palmitate) with stearoyl chlori?e in a 1:1.5 molar ratio.
Because of the greater reactivity of the primary hydroxyl groups, .
the I, 3-diacylglycerol is the major product but this is accompanied
by some l,2-diacyglycerol, monoacylglycerol and triacylglyceroL
The product is purified by repeated crystallisation from a
petroleum ether:ethanol (8:2, v/v) mixture using 12 volumes of the
167
o . 0 sol vent at 0 • IO volume s at 0 , 8 volume s at room temperature
and finally 6 volumes at OOC. The progress of purification is
monitored by TLC impregnated with beric acid (5%) and the
product remains a single spot by this test.
The glycer~l l-palmitate 3- stearate is reacted directly with
caproyl chloride in the pre sence of pyridine. The purification
of the triglyceride from partial glycerides and other triglycerides
is achieved by crystallisation from ethanol:acetone (9:l,v/v; 1.51)
mixture at room temperature and from acetone:petroleum ether
(4:l,v/v; 1. 51) at OOC. The purity of the glycerol I-palmitate
2-caprate :i-stearate is checked by GLC (97% as C44
) •

REFERENCES
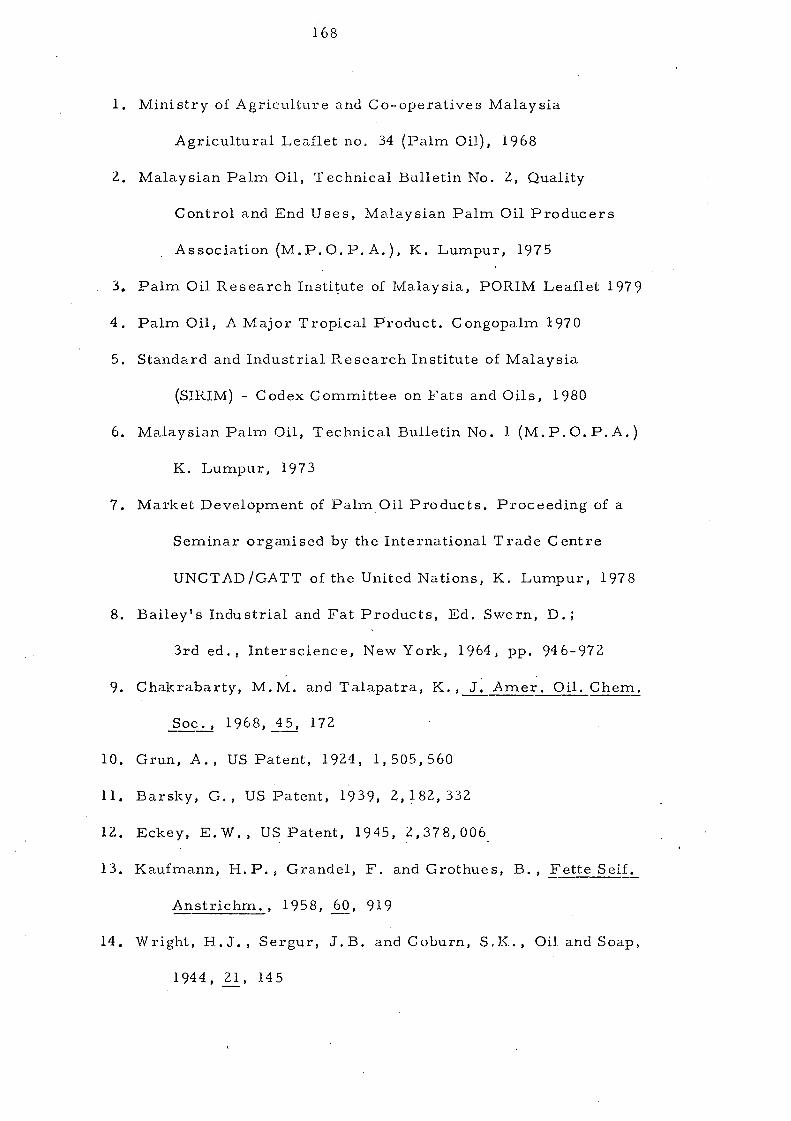
168
1. Mini stry of A griculture and Co .. operatives Malaysia
Agricultural Leaflet no. 34 (Palm Oil), 1968
2. Malaysian Palm Oil, Technical Bulletin No.2, Quality
Control and End Uses, Ma.laysian Palm Oil Producers
Association (M.P.O.P.A.), K. Lumpur, 1975
3, Palm Oil Re search Institute of Malaysia, PORIM Leaflet 1979
4. Palm Oil, A Major Tropical Product. Congopalm 1970
5. Standard and Industrial Research Institute of Malaysia
(SIRIM) - Codex Committee on Fats and Oils, 1980
6. Malaysian Palm Oil, Technical Bulletin No. 1 (M. P. O. P. A.)
K. Lumpur, 1973
7. Market Development of Palm Oil Products. Proceeding of a
Seminar organised by the International Trade Centre
UNCTAD/GATT of the United Nations, K. Lumpur, 1978
8. Bailey's Industrial and Fat Products, Ed. Swern, D.;
3rd ed. I Interscience, New York, 1964, pp. 946-972
9. Chakrabarty, M.M. and Talapatra, K., J: Amer. Oil. Chern.
Soc~ 1968, 45, 172
10. Grun, A., US Patent, 1924, 1,505,560
11. Barsky, G., US Patent, 1939, 2,182,332
12. Eckey, E. W., US Patent, 1945, 2,378,006
13. Kaufmann, H. P .• Grandel, F. and Grothues, B., Fette Self.
An s t ric hm., 1 958, ~Q, 9 1 9
14. Wright, H.J., Sergur, J.B. and Coburn, S.K., Oil and Soap,
1944, ~, 145
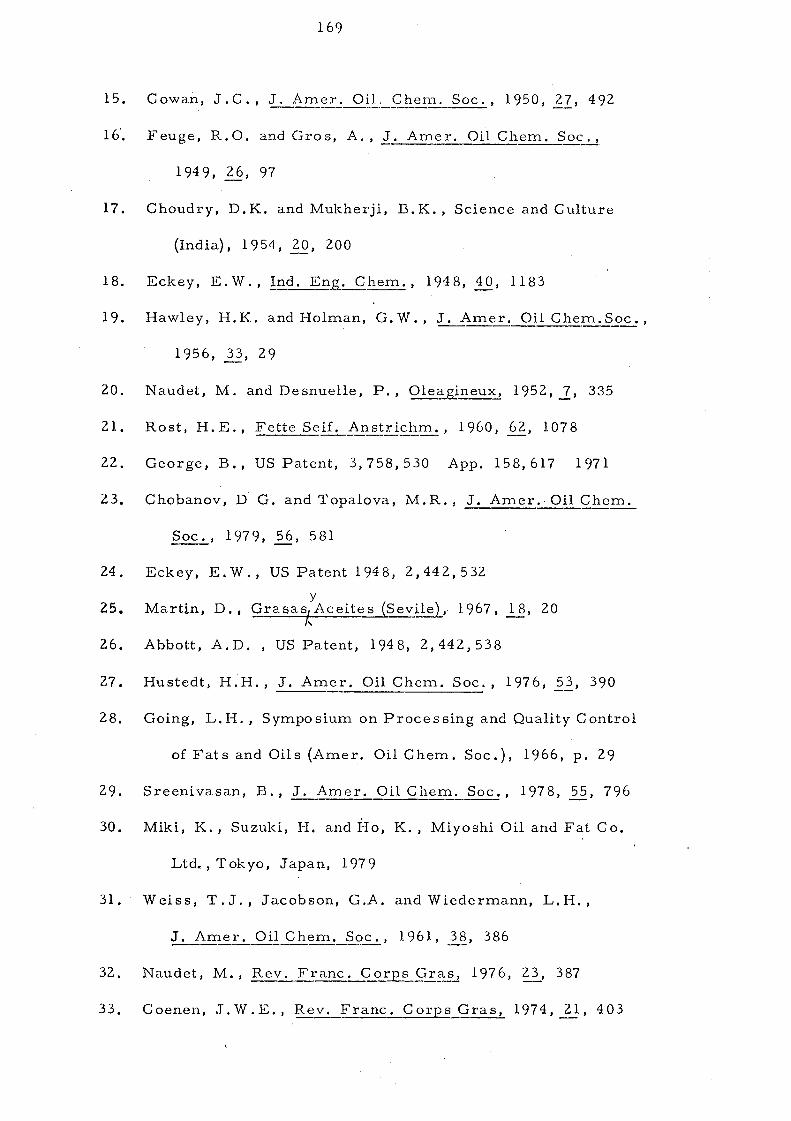
169
15. Cowan, J.C., J. Amer. Oil; Chem. Soc., 1950, 27,492
16. Feuge, R.O. and Gros, A., J. Amer. Oil Chem. Soc.,
1949, ~~, 97
17. Choudry, D.K. and Mukherji, B.K., Science and Culture
(India), 1954, ~Q, 200
18. Eckey, E. W., Ind. Eng. Chem., 1948, 40, 1183
19. Hawley, H.K. and Holman, G.W., J. Amer. OilChem.Soc.,
1956, 33, 29
20. Naudet, M. and Desnuelle, P., 01eWneux, 1952,.1, 335
21. Rost, H.E., Fette Sei£. Anstrichm., 1960, ~l:., 1078
22. George, B., US Patent, 3,758,530 App. 158,617 1971
23. Chobanov, D G. and Topalova, M.R., J. Amer. Oil Chem.
Soc..:..' 1979, 56, 581
24. Eckey, E. W ., US Patent 1948, 2,442, 532
Y 25. Martin, D •• Grasas l Aceite s (SevileL., 1967 • ..!.~, 20
},
26. Abbott, A.D. , US Patent, 1948,2,442,538
27. Hustedt, H:H., J. Amer. Oil Chem. Soc., 1976,21, 390
28. Going, L.H., Symposium on Processing and Quality Control
of Fats and Oils (Amer. Oil Chem. Soc.), 1966, p. 29
30. Miki, K., Suzuki, H. and Ho, K., Miyoshi Oil and Fat Co.
Ltd., Tokyo, Japan, 1979
31. Weiss, T.J., Jacobson, G.A. and Wiedel'mann, L.H.,
J. Amer. Oil Chem. Sqc., 1961, ~, 386
32. Naudet, M., Rev. Franc. Cor~r~~ 1976, ~~ 387
33. Coenen, J.W.E., Rev. Franc. Corps Gras, 1974,~, 403
170
34. Gunstone, F .D., private communication, 1980
35. Freeman, I.P., J. Amer. Oil Chem. Soc., 1968, 45, 456
36. Padley, F.B. and Fincke, A , Unilever Bedford (private
communication, 1980)
37. Duterte, R., Rev. Franc. Cor~ Gra~ 1976, Q, 547
38. Bra un, W. Q., J. Am e r. 0 il C he m. Soc., 1 960, 37, 598
39. List, G. R., Emken, E. A., Kwolek, W. F., Simpson, T. D. ,
and Dutton, D. J., J. Ame r. Oil Chem. Soc., 1977, ~i, 408
40. Perron, R. and Broney, M., Rev. Franc. Corps Gras, 1978 ,
25, 165
41. Rossell, J.B" J. Amer. Oil Chem. Soc., 19'15, ~~, 505
42. Luddy, F.E., Magidman, P., Riemenschneider, R.W. and
Morris, S.G., J. Amer. Oil Chem. Soc.., 1955, 2~, 522
43. Van Akkeren, L.A., US Patent, 1959, 2,872,463
44. Mattil, K.F. and Norris, F.A., US Patent 1953,2,625,478
45. Hedley, T., Brit. Patent, 1957,785,147
46. Babayan, V.K., US Patent, 1958, 3,006,771
47. Melnick, D. and Gooding, C.M., US Patent, 1960,2,921,855
48. Seiden, P., US Patent, 1967, 3,353,964
49. Barsky, G. and Babayan', V.K., US Patent 1959, 2,914,546
50. Baltes, J., Ger. Patent, 1960, 1,078,562
51. Deviin, J.J. and Walker, A.P., Brit. Patent, 1960, 832,377
52 • Lin d say, D .. S., US Pat e nt, 1 961, 2, 99 6, 388
53. Faur, L. and Calve, A., Rev. Franc. _.9orps Gras, 1977,
54. Seher, A., ~ids Techn01.£gy, 1976,~, 527
171
1078, 55, 810A
56. Babayan, V.K., J. Amer. Oil Chern. Soc., 1978,22, 845
57. Koslowsky, L., 01eagineux, 1975, 30, 221
58. Roslyn, B.A.S., Aftergood, L., Henson, H. and Morris,
R.S., J. Amer. Oil Ch~m. Soc., 1966, i~, 110
59. Kaufmann, H.P. and Grothues, B., Fette. Seif. Anstrichm.,
1959, ~, 425
60. Zalewski, S. and Gaddis, A.M., J. Amer. Oil Chern. Soc.,
1967, 44, 576
61. Gunstone, F.D., Hamilton, R.J., Padley, F.G. and
Qureshi, M.1., J. Amer. Oil Ch_em. Soc. , 1964, g. 965
62. Mattson, F .H. and Volpenhein, F .A., ~ Li'p'id Research.,
1963, i, 392
63. Barrett, C.B., Dallas, M.S.J., and Padley, F .B.,
J. Amer. Oil Chern. Soc., 1965, i,Q, 580
64. Gunstone, F.D. and Padley, F.B., J. Amer. Oil Chern. Soc.,
1965, 42, 957
65. Van der Waal, R. J. "Advances in Lipid Research", Vol. 2,
Acad. Press, New York, 1964, pp. 1-66
66. Coleman, M. H. and Fulton, W. C. "Enzyme s of Lipid
Metabolism", Pergamon Press, New Y.ork, 1961, pp.127-137
67. Gunstone, F.D., J. Amer. Oil Chern. Soc., 1978,22, 903
68. Rossell, J.B., Russell, J. and Chidley, J.E., J. Amer. Oil
Chern. Soc., 1978,22, 902
69. Clement, G. and Bezard, J., J. Biochem. Bio~s. Res.
Qommun., 1962, ..§, 238
172
70. Entressangles, B. "Enzymes of Lipid Metabolism", Pergamon
Press, New York, Ed. Desnuelle, P., 1961, p. 31
71. Entressang1es, B., Pasero, L., Savary, P. and Desnuelle, P.
Bull. Soc. Chirn. Biol., 1961, i2, 583
72. Gunstone, F. D. , private communication, 1980
73. Desnuelle, P. and Savary, P., Biochim. Biophy'~Acta.
1959, 21.. 26
74. Mattson, F.H. and Lutton, E.S., J. Biol. Chern., 1958, 233, 868
75. Coleman, M.H., J. Amer. Oil Chern. Soc., 1961, 38, 685
76. Van der Waal, R.J., J. Amer. Oil Chern. Soc., 1960,~, 18
77. Jurriens, G. and Kroesen, A. C. J., ~Ame~Oil Che~ Soc ~,
1965, g, 9
78. Mattson, F.R. and Volpenhein, R.A., ~~!3iol.Chem., 1961, 236) 1891
79. Mattson, F.H., Volpenhein, R.A. and Lutton, E.S.,
~ipid~es. , 1964,2, 363
80. Bezard, J.A., Lip~~ 1971, ~, 630
81. Official on Tentative Methods of the Amer. Oil Chern. Soc.,
3rd Ed. Method CD 10-57
82. Pohle, W.D. and Gregory, R.L., J. Amer. Oil Chern. Soc.,
1965, 42, 1075
83. Van 'den Enden, J.C., Ha~ghton, A.J., Putte, K., Vermans,
L.F. and Waddington,D., Fette Self. Anstrichm.,197.8.,80,180 ,
84. Bailey, A. E. "Melting and Solidification of Fats", Interscience
Publishers Inc., New York, London, 1950, p. 166
85. Chapman, D. "The Structure of Lipid s by Spectroscopic and
X-Ray Techniques", Methuen and Co. Ltd, London, 1965
173
86a Lutton, E.S., and Fehl, A. J. ,LiEids, 1970, 2, 90
86b Redfern, J.P., Differential Thermal Analysis, Vol. 2,
Ed. Mackenzie, R.C .• Academic Press, London, 1972,
pp. 129- 1 33 and 476 - 4 7 9
87. Berger, K.G. and. Akehurst, E.E.; J. Food Tech., 1966,1.,237
88. Kuksis, A., and McCarthy, M. J. , ~.il.E_!_.L!. Biochem. Physiol..
1962, .!Q. 679
89. De Vries, B., Chem. Ind. {London},., 1962, 1049
90. Kaufman, H.P., Wessels, H. and Viswanathan, C.V., Fet~
Seif. Anstrichm., 1962, 64, 509
91. Brockerhoff, H., J. LiEid Res., 1965,..£.., 10
92. Brockerhoff, H., J. Lipid Res., 1967, ~, 167
93. Christie, W.W. and Moore, J.R, ~}ochim. BioE~' A~ta, 1969, 176, 445
94. Christie, W. W., "Lipid Analysis", Pergamon Press, London,
1 97 6, pp. 2 66 - 2 81
95. Litchfield, C., "Triglyceride Analysis", Academic Press,
New York, London, 1972, pp. 189-205
96. Kuksis. A., Handbook of Lipid Research 1 - Fatty Acids and
Glycerides, Ed. Breckenridge, W. C., Plenum Press,
New York, London, 1978, pp. 197-230
97. Hammond, E.G. and Fatemi, S.H., LiEids, 1977, ~, 1032
98. Podlaha, O. and Toregard, B., Scandinavian Symposium on
Lipid Proceeding BOROS, Norway, 1973, p. 226
99. Brockerhoff, H. and Yurkowski. M., J. LiEid Res., 1966,
I. 62
100. Myher, J.J. and Kuksis, A., Can. J. Biochem., 1979.21., 117
174
101. Jacobsberg, B .. .91eagi~~ux, 1975, l,Q, 271
102. Faulkner, H., Bonfand, A. and Naudet, M., Rev. Franc.
Cor.ps Gras, 1978, 25) 125
103. Yur.kowski., M. and Brockerhoff, H., Biochim. Bioph~
Acta, 1966, ..G2, 55
104. Wood, R. and Synder, ;F., Arch. Biochem. Biophys., 1969,
131, 478
105. Brockerhoff, H., Lipids, 1971, §..' 439
106. Bird, P.R., De Haas, H., Heemskirk, C.H. and Deenen,
L.L.M., ~ioch~. Biophys. Acta, 1965, 98, 566
107. Nutter, L. J. and Privett, O. S., Lipid s, 1966, l, 258
108. Arunga, R.O. and Morrison, W.R., Li,pids, 1971, 5l.., 768
109. Brockerhoff, H. and Yurkowsld, M., J. Lipid Re s., 1966,
5l..,62
110. Tan, B.K., "Palm Oil Studies: The Effect of Fractionation
on Palm Oil Triglycerides" Ph.D. Thesis, 1979, p. 220
111. Raghuveer, K.G. and Hammond, E.G., 'J. Am'er. Oil Chem.
Soc., 1967, 44, 239
112. Vogel's Textbook of Practical Organic Chemistry, Longman
London, New York, 4th Ed. 1978, p. 269.
113. Christie, W.W. "Lipid Analysis", Perga;mon Press, Oxford,
New York, 1976, pp. 87-90
114. Chobanov, D. and Chobanov, R., J. Amer. Oil Chem. Soc.,
1977, 54, 47
115. Dallas, M.S.J. and Padley, F.B., Lebensm.-Wiss.u.
Techno!.., 1977, .!..Q, 328
175
116. Litchfield, C. "Analysis of Trig1ycerides", Academic
Press, New York, London, 1972, p. 53
117. Litchfield, C., Harlo'.>", R.D. and Reiser, R., J. Amer.
Oil Chem. Soc., 1965, 42., 849
118. Hamilton, R.J., Chromato&~, 1975, 13,474
119. Quinn, J.G., Sampugna, J., and Jensen, R.G., J. Amer.
Oil Chern. Soc., 1967, ii, 439
120. Mattson, F.H. and Volpenheim, R.A., J. Lipid Res.,
1962., 1, 281
121. Deroanne, C., Wathelet, J.P., and Severin, M., Rev.
122. Oh, C. H., Pulsed NMR for the Determination of Solid
Fat Content in Palm Oil. Chemical Analysis: Malaysian
Requirenlents, Seminar of Malaysian Institute of
Chemistry, Kuala Lumpur, 1978
123. Official on Ten~ative Methods of the Amer. Oil Chern. Soc.
3rd Ed., Method Cc -425
124. Voge1 1 s Textbook of Practical Organic Chemistry, Longman
London, New York, 4th Ed., 1978, p. 604.

APPENDICES
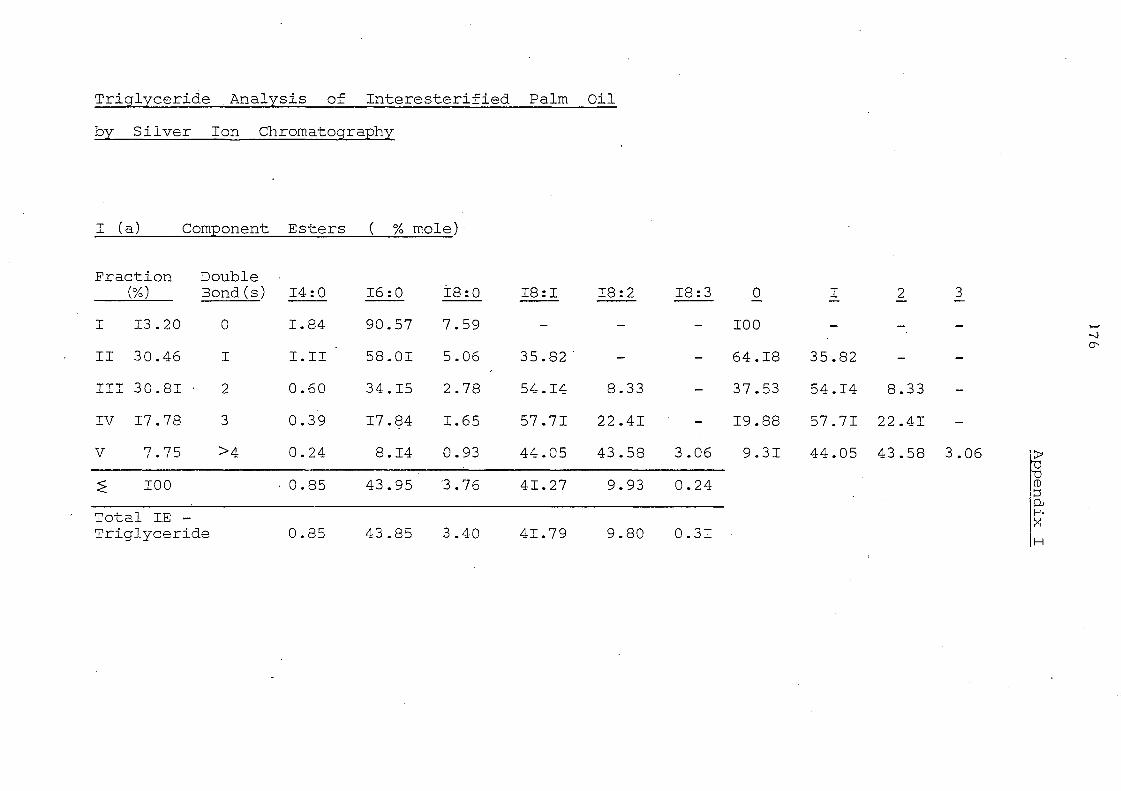
Triglyceride Analysis of Interesterified Palm Oil
by Silver Ion Chromatography
T ( a) Component Esters ( % mole) .J..
Fraction Double (%_) - Bond(s) I4:0 I6:0 18:0 18:1 18:2 I8:3 0 I 2 3
I 13.20 0 I.84 90.57 7.59 IOO --.J 0'
II 30.46 I 1. II 58.01 5.06 35.82" 64.18 35.82
III 30.81 2 0.60 34.15 2.78 54.14 8.33 37.53 54.14 8.33
IV 17.78 3 0.39 17.84 I.65 57.7I 22.41 19.88 57.71 22.41
V 7.75 >4 0.24 8.14 0.93 44.05 43.58 3.06 9.31 44.05 43.58 3.06
~ :?: roo . 0.85 43.95 "3.76 4I.27 9.93 0.24 I::J P,
Total IE - I~· X Triglyceride 0.85 43.85 3.40 4I.79 9.80 0.3r
H
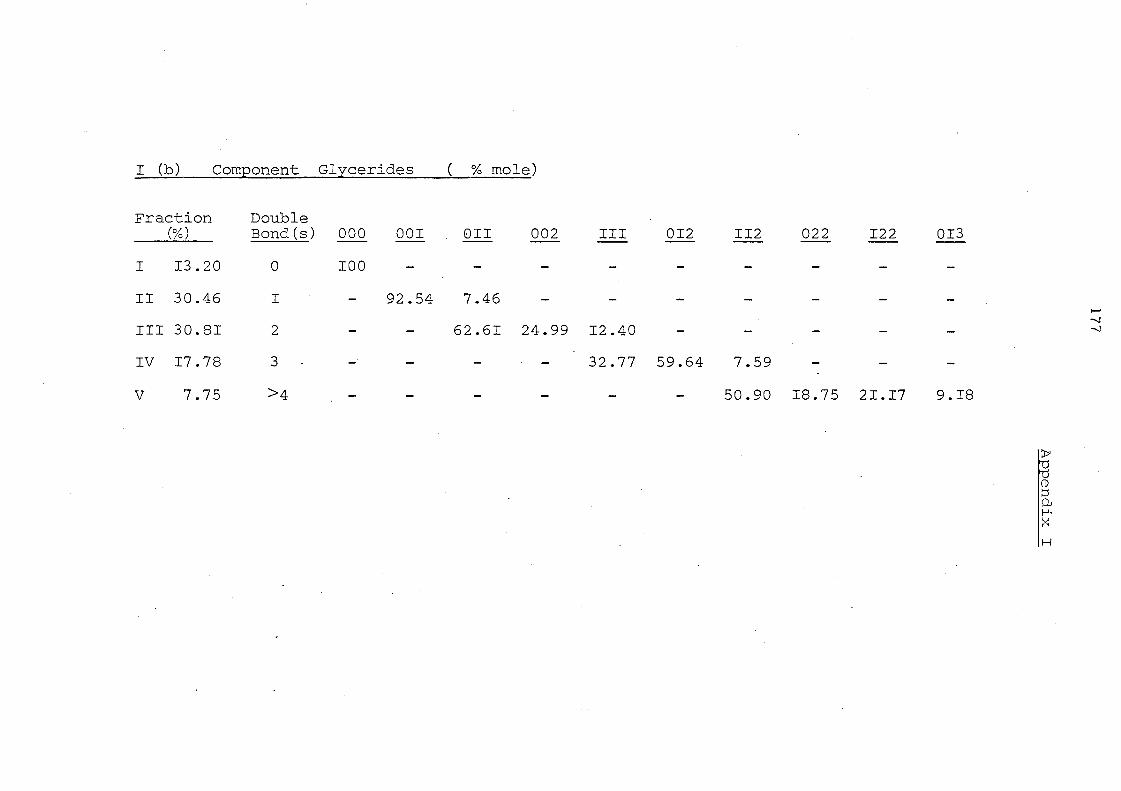
I (b) Component Glycerides (
Fraction Double (%) Bond(s) 000 OOI
I 13.20 0 100
II 30.46 I 92.54
III 30.81 2
IV 17.78 3
V 7.75 >4
% mole)
OII 002 III OI2 II2
7.46
62.6I 24.99 I2.40
32.77 59.64 7.59
50.90
022 I22 OI3
I8.75 2I.I7 9.I8
:J>'
CD ::J 0., 1--'X
H
...... -J -J
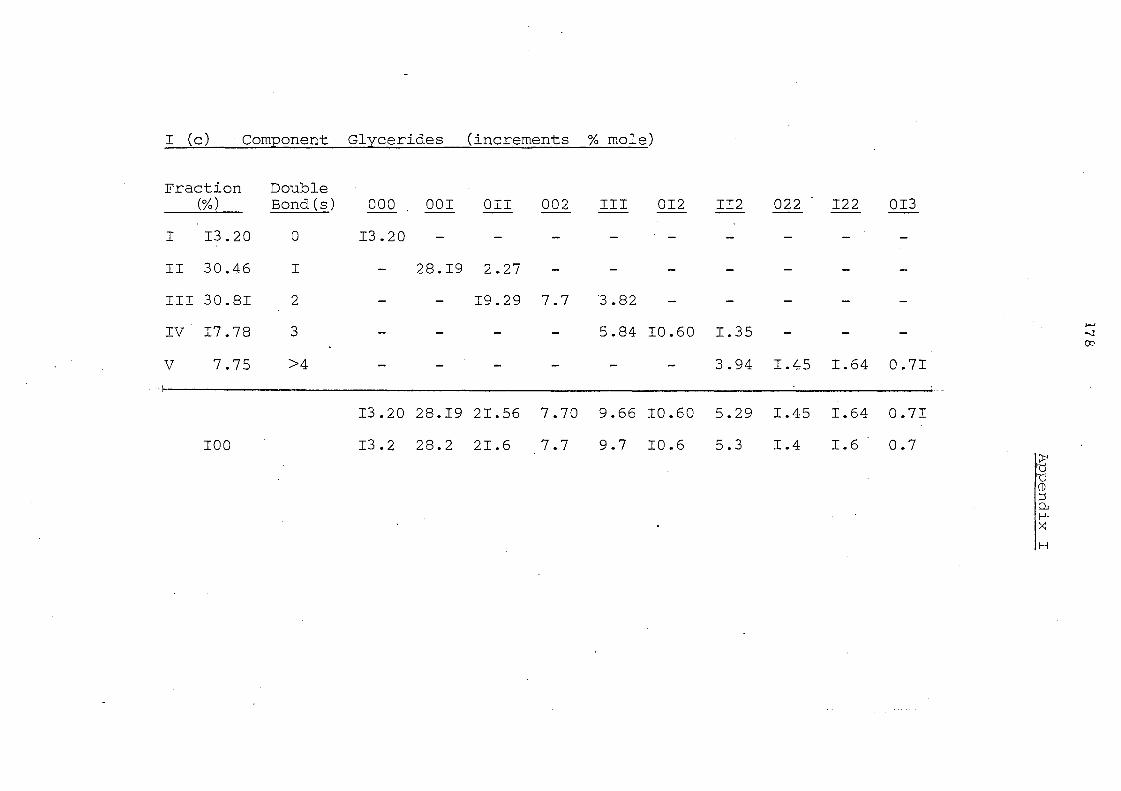
I (c) Component Glycerides (increments % mole)
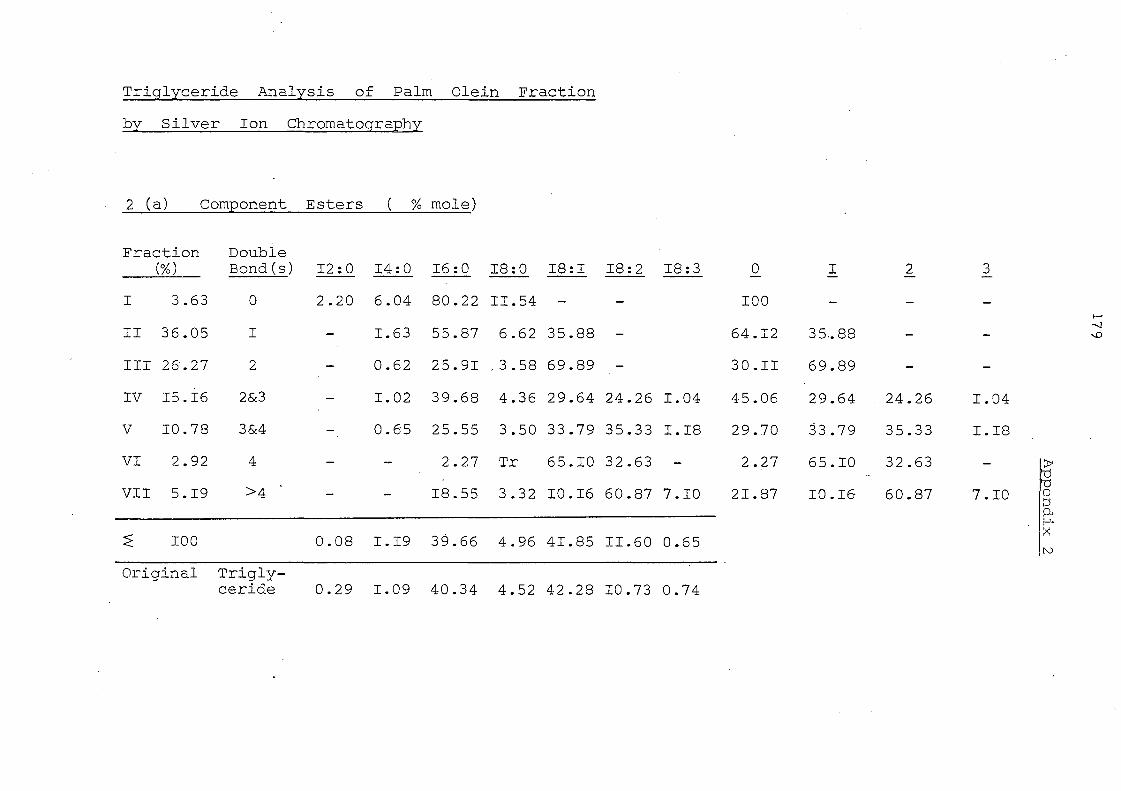
Triglyceride Analysis of Palm Olein Fraction
by Silver Ion Chromatography
2 (a) Component Esters % mole)
Fraction Double (%) - Bond(s) 12:0 14:0 16:0 18:0 18:1 18:2 18:3 0 I 2 3
I 3.63 0 2.20 6.04 80.22 11.54 100 ...-
II 36.05 I 1.63 55.87 -.J
6.62 35.88 64.12 35 .. 88 -.0
III 26.27 2 0.62 25.91 ,3.58 69.89 30.11 69.89
IV 15.16 2&3 I.02 39.68 4.36 29.64 24.26 1.04 45.06 29.64 24.26 1.04
V 10.78 3&4 0.65 25.55 3.50 33.79 35.33 1.18 29.70 33.79 35.33 1.18
VI 2.92 4 2.27 Tr 65.10 32.63 2.27 65.10 32.63
~ 5.19 >4 18.55 3.32 10.16 60.87 7.10 21.87 10.16 60.87 7.10 VII I(]) ::s QJ f-1-
~ 100 0.08 1.19 :x:
39.66 4.96 41.85 11.60 0.65 IN Original Trigly-
ceride 0.29 1.09 40.34 4.52 42.28 10.73 0.74
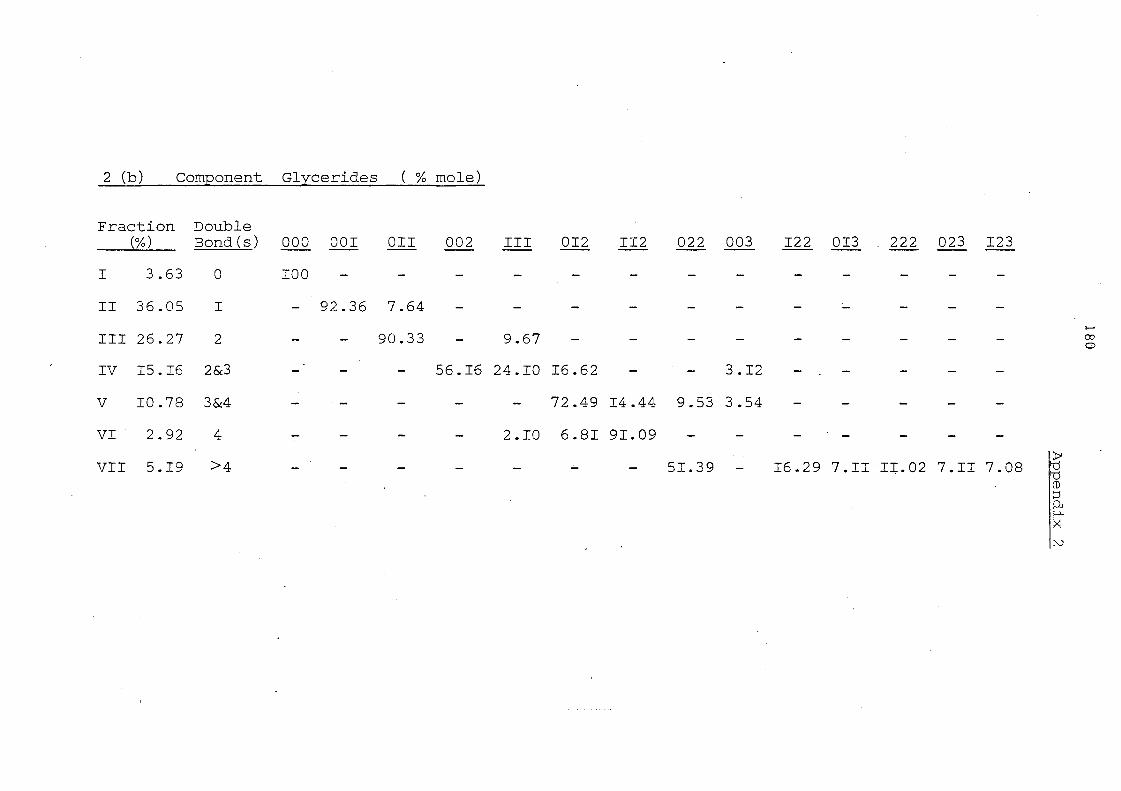
2 (b) Component Glycerides ( % mole)
Fraction Double ('Yo) Bond(s) 000 001 011 002 III 012 II2 022 003 122 013 222 023 123
I 3.63 0 100
II 36.05 I 92.36 7.64 ......
III 26.27 2 90.33 9.67 co 0
IV 15.16 2&3 56.16 24.10 16.62 3.12
V 10.78 3&4 72.49 14.44 9.53 3.54
VI 2.92 4 2.IO 6.81 9I.09
VII 5.19 >4 51.39 16.29 7.11 11.02 7.11 7.08 m (J) ~ p.. 1--'-X rv
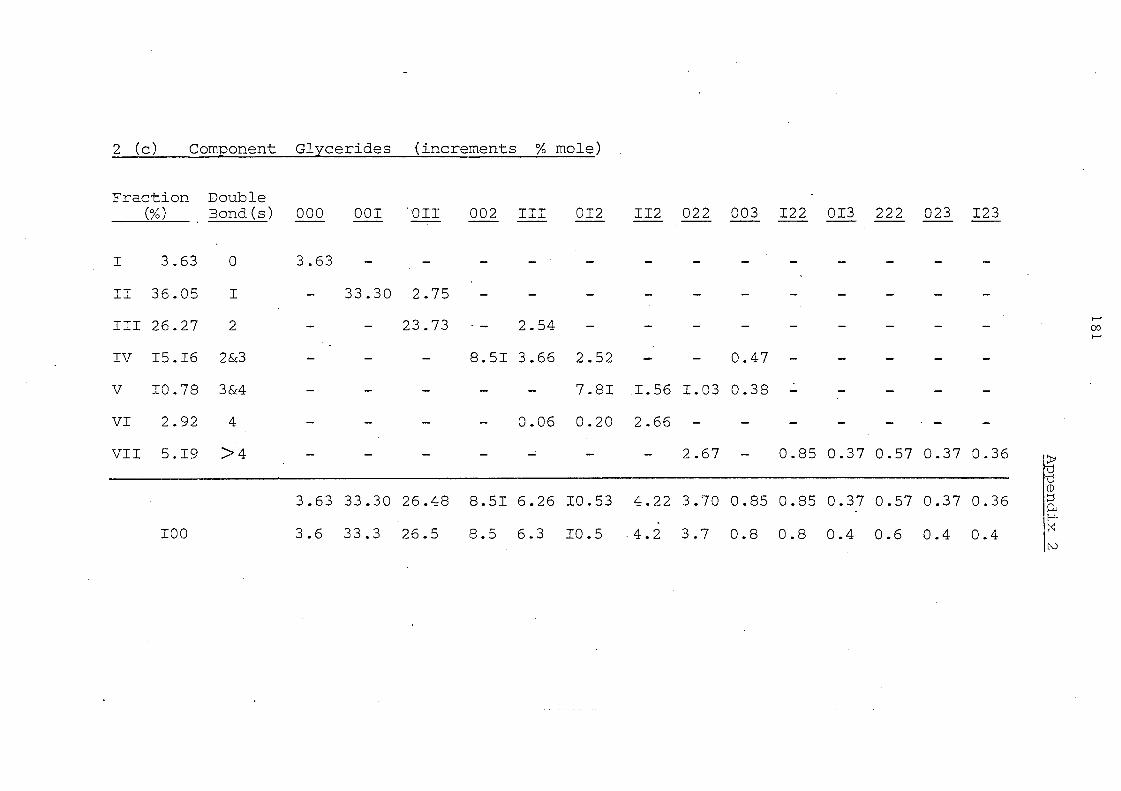
2 (c) Component Glycerides (increments % mole)
Fraction Double (%) Bond(s) 000 001 'OIl 002 III 012 112 022 003 122 013 222 023 123
I 3.63 0 3.63
II 36.05 I 33.30 2.75
III 26.27 2 23.73 2.54 >-' (X) >-'
IV 15.16 2&3 8.51 3.66 2.52 0.47
V 10.78 3&4 7.81 1.56 1.03 0.38
VI 2.92 4 0.06 0.20 2.66
VII 5.19 >4 ....; 2.67 0.85 0.37 0.57 0.37 0.36
~ 3.63 33.30 26.48 8.51 6.26 10.53 4.22 3.70 0.85 0.85 0.37 0.57 0.37 0.36
r" 100 3.6 33.3 26.5 8.5 6.3 10.5 ·4.2 3.7 0.8 0.8 0.4 0.6 0.4 0.4 X
N
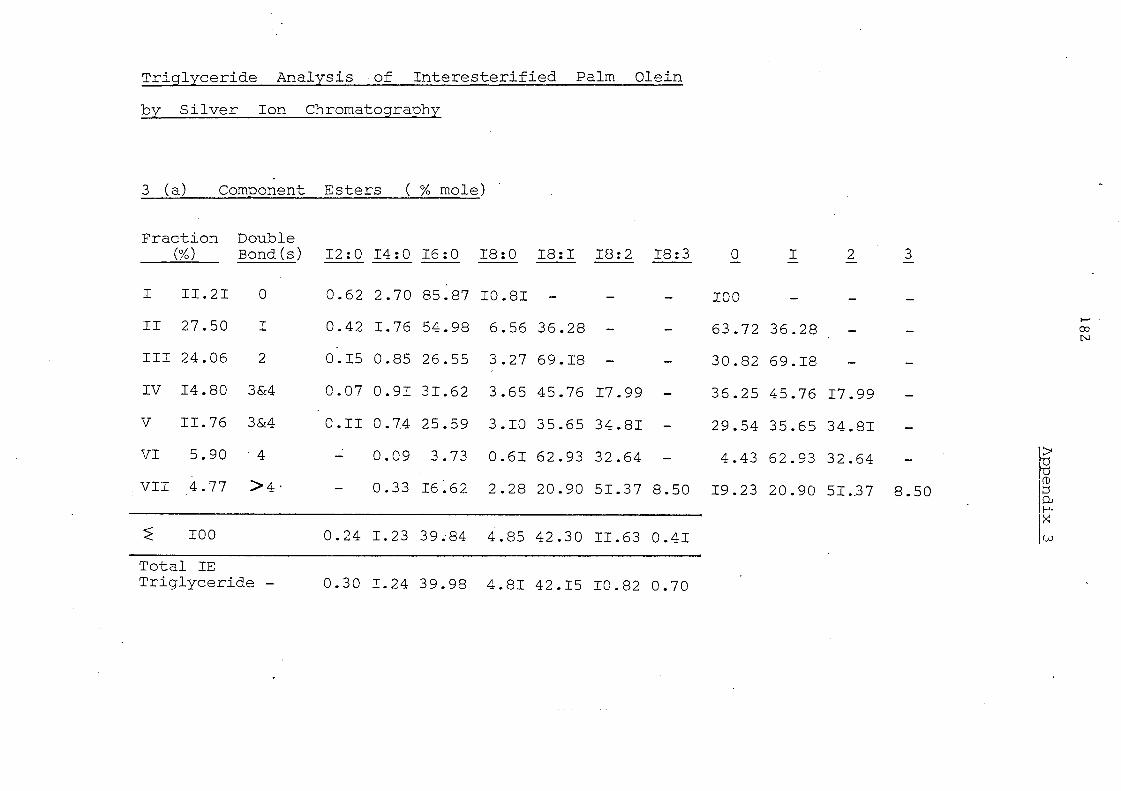
Triglyceride Analysis of Interesterified Palm Olein
by Silver Ion Chromatography
3 (a) Component Esters ( % mole)
Fraction Double (%) Bond(s) 12:0 14:0 16:0 18:0 18:1 18:2 18:3 0 I 2 3 ------
I 11.21 0 0.62 2.70 85.87 10.81 100
II 27.50 I 0.42 1.76 54.98 6.56 36.28 63.72 36.28 I-'
00 N
III 24.06 2 0.15 0.85 26.55 3.27 69.18 30.82 69.18
IV 14.80 3&4 0.07 0.91 31.62 3.65 45.76 I7.99 36.25 45.76 17.99
V 11.76 3&4 0.11 0.7.4 25.59 3.10 35.65 34.81 29.54 35.65 34.81
VI 5.90 4 0.09 3.73 0.6I 62.93 32.64 4.43 62.93 32.64 ~ VII 4.77 >4' 0.33 16~62 2.28 20.90 51.37 8.50 19.23 20.90 51.37 8.50 l~
p, 1-'-~
~ 100 0.24 1. 23 39.-84 4.85 42.30 11.63 0.41 leu Total IE Triglyceride - 0.30 1.24 39.98 4.81 42.15 10.82 0.70
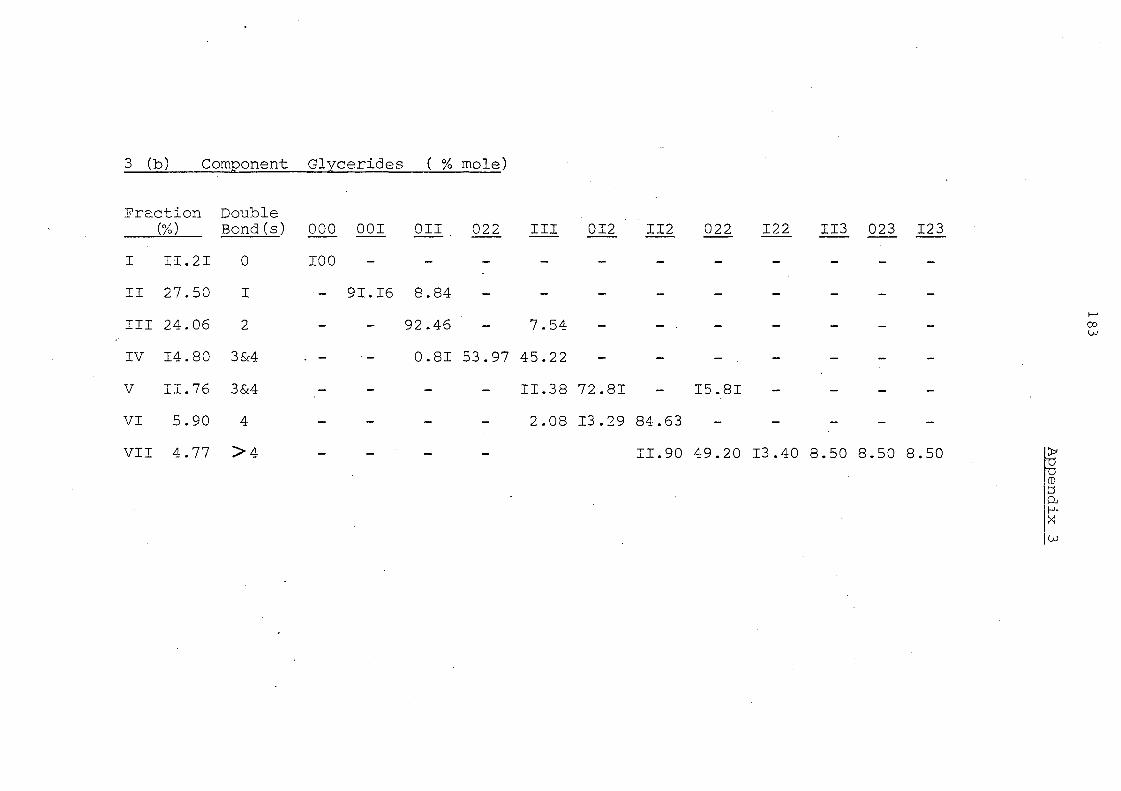
3 (b) Component Glycerides ( % mole)
Fraction Double (%) Bond(s) 000 001 011 022 III 012 112 022 122 113 023 123
I II. 21 0 100
II 27.50 I 91. 16 8.84 >-'
III 24.06 2 92.46 7.54 00 VJ
IV 14.80 3&4 0.81 53.97 45.22
V II.76 3&4 11.38 72.81 15.81
VI 5.90 4 2.08 13.29 84.63
VII 4.77 >4 11.90 49.20 13.40 8.50 8.50 8.50 ~ m ~ Q, f-J. ~
w
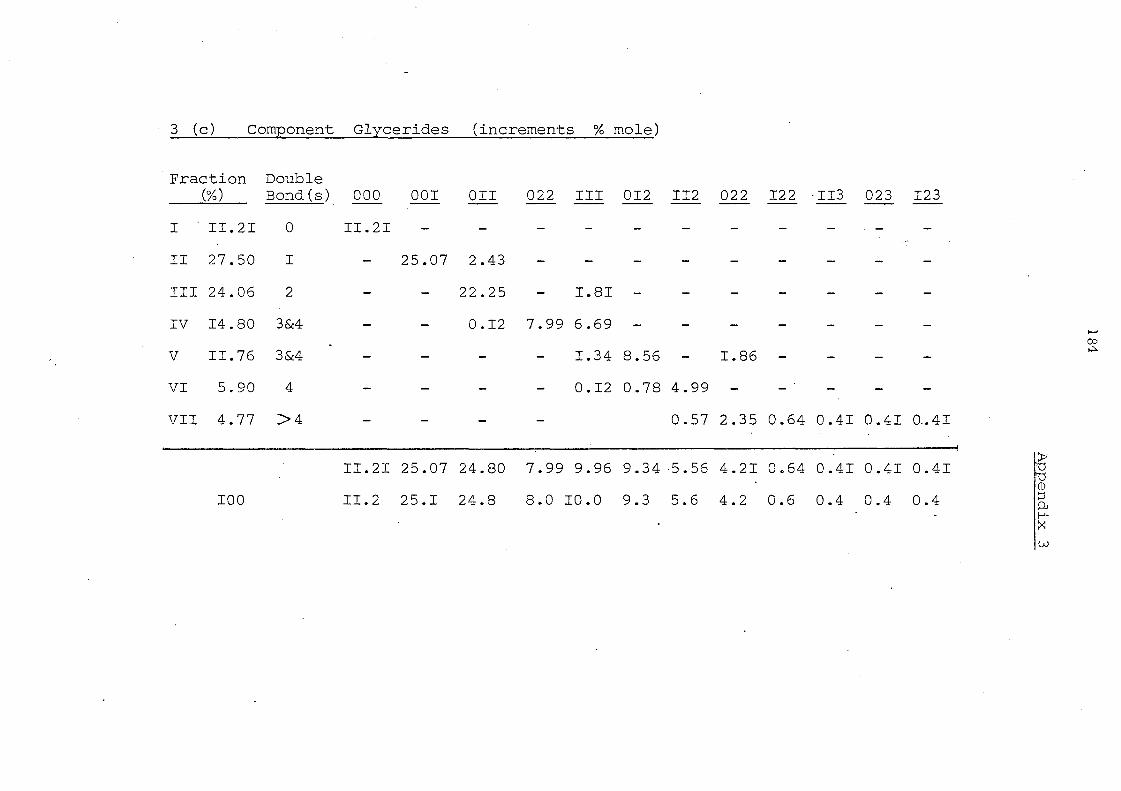
3 (c) Component Glycerides ( increments % mole)
Fraction Double (%) Bond(s) 000 001 011 022 III 012 112 022 122 -113 023 123
I 11.21 0 11.21
II 27.50 I 25.07 2.43
III 24.06 2 22.25 1.81
IV 14.80 3&4 0.12 7.99 6.69 t-
o:>
V 11.76 3&4 1.34 8.56 1.86 oJ:>.
VI 5.90 4 0.12 0.78 4.99
VII 4.77 >4 o . 57 2. 3 5 o. 64 O. 4 I O. 4 I 0 .. 4 I
11.21 25.07 24.80 7.99 9.96 9.34 5.56 4.21 0.64 0.41 0.41 0.41 ~
~ 100 II.2 25.1 24.8 8.0 10.0 9.3 5.6 4.2 0.6 0.4 0.4 0.4 Q, 1-'->;
w
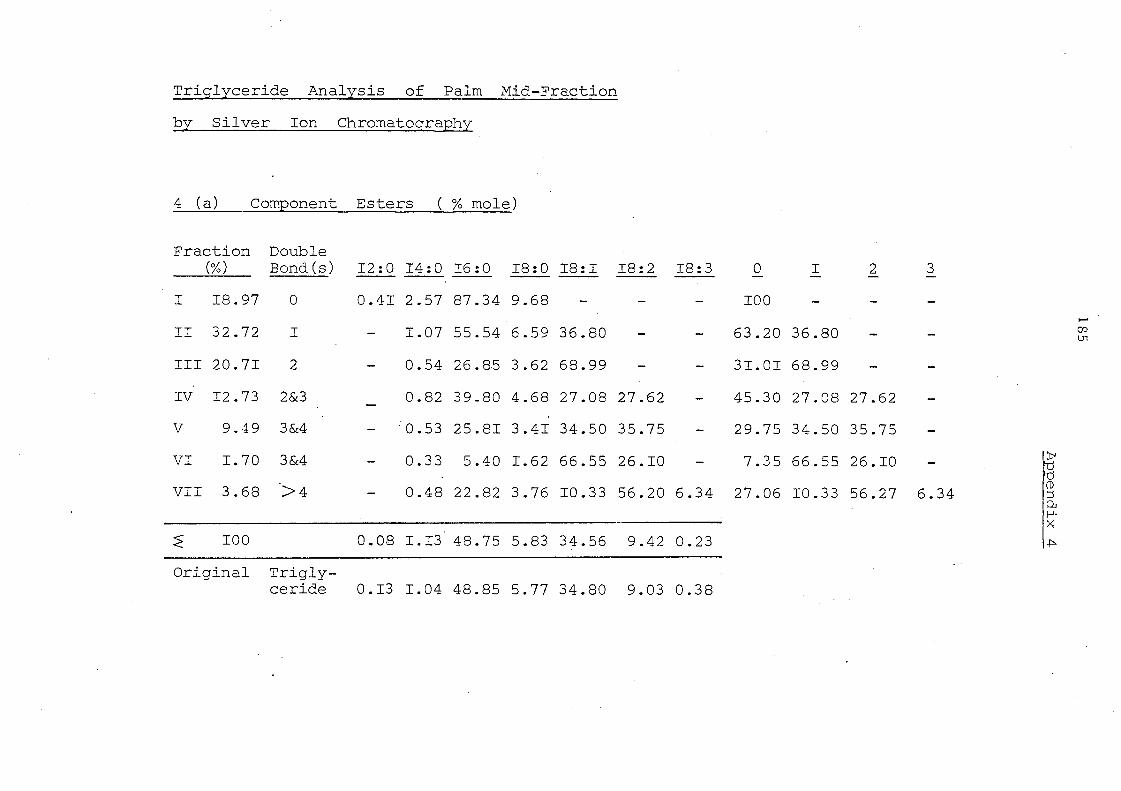
Triglyceride Analysis of Palm Mid-Fraction
by Silver Ion Chromatography
4 (a) Component Esters ( % mole)
Fraction Double (%) Bond(s) 12 : 0 14: 0 16: 0 18:0 18:1 18:2 18:3 0 I 2 3 ------ ----
I 18.97 0 0.41 2.57 87.34 9.68 100 ......
II 32.72 I 1.07 55.54 6.59 36.80 63.20 36.80 co U1
III 20.71 2 0.54 26.B5 3.62 68.99 31.01 68.99
IV 12.73 2&3 0.82 39.80 4.68 27.08 27.62 45.30 27.08 27.62
V 9.49 3&4 :0.53 25.81 3.41 34.50 35.75 29.75 34.50 35.75
VI 1.70 3&4 0.33 5.40 1.62 66.55 26.10 7.35 66.55 26.10
~ VII 3.68 >4 0.48 22.82 3.76 10.33 56.20 6.34 27.06 10.33 56.27 6.34 p., 1--'-X
~ 100 0.08 1.13 48.75 5.83 34.56 9.42 0.23 I I.p.
Original Trigly-ceride 0.13 1.04 48.85 5.77 34.80 9.03 0.38
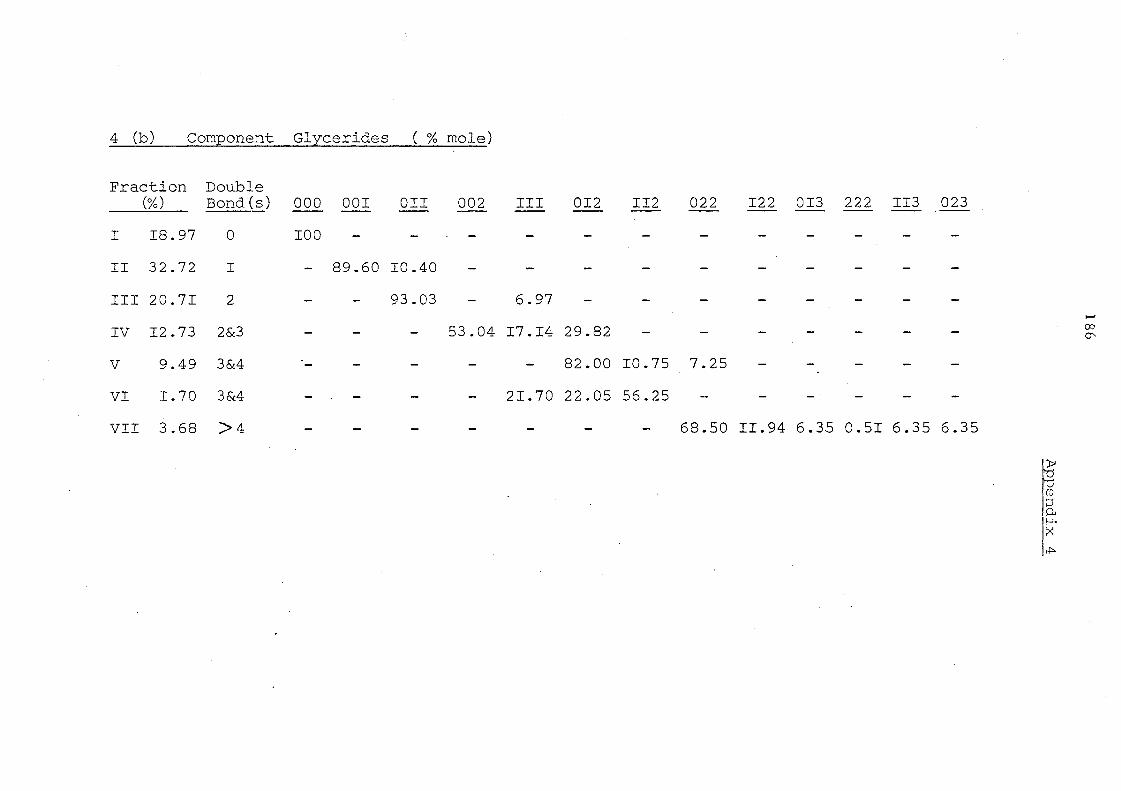
4 (b) Component Glycerides ( % mole)
Fraction Double (%) Bond(s) 000 001 011 002 III 012 112 022 122 013 222 113 023
I 18.97 0 100
II 32.72 I 89.60 10.40
III 20.71 2 93.03 6.97 ......
IV 12.73 2&3 53.04 17.14 29.82 00 0'
V 9.49 3&4 82.00 10.75 7.25
VI 1. 70 3&4 21.70 22.05 56.25
VII 3.68 >4 68.50 11.94 6.35 0.51 6.35 6.35
~ ,0.. II-'-Ix I>J:>.
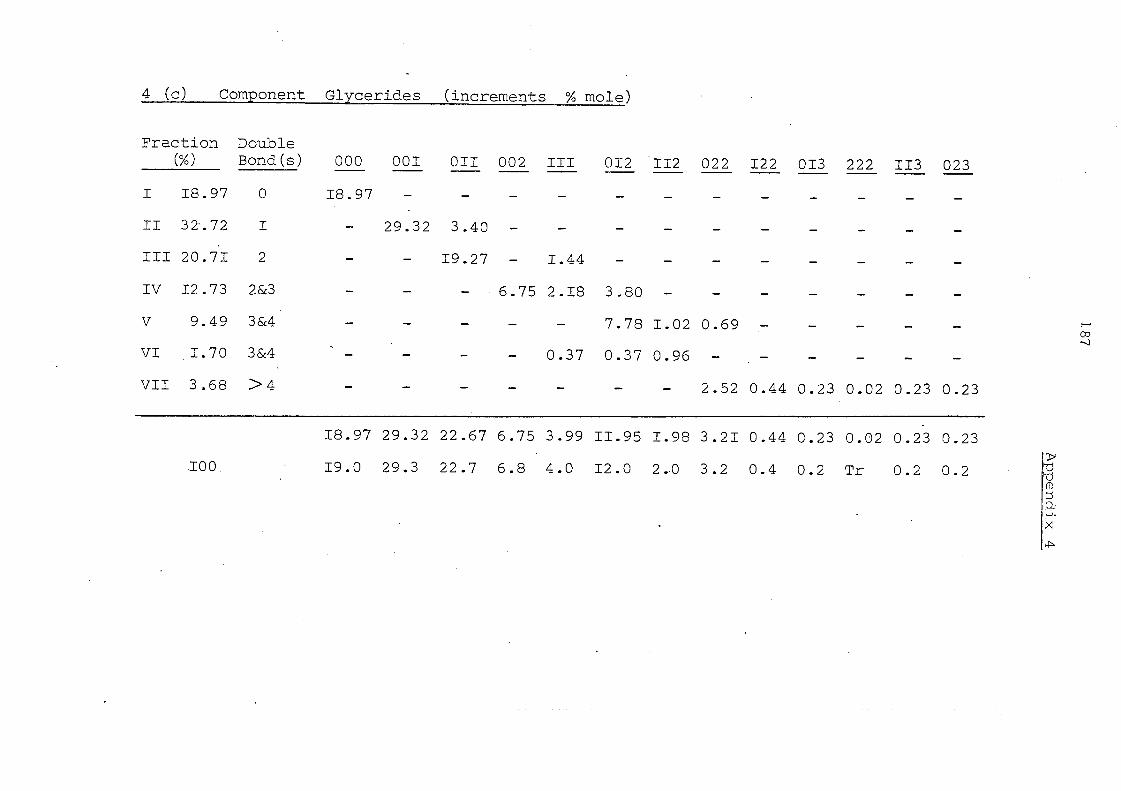
4 (c) Component Glycerides (increments % mole)
Fraction Double (%) Bond(s) 000 001 011 002 III 012 112 022 122 013 222 113 023
I 18.97 0 18.97
II 32".72 I 29.32 3.40
III 20.71 2 19.27 1.44
IV 12.73 2&3 ·6.75 2.18 3.80
V 9.49 3&4 7.78 1.02 0.69 ,.... 00 -..J
VI I. 70 3&4 0.37 0.37 0.96
VII 3.68 >4 2.52 0.440.23 0.02 0.23 0.23
18.97 29.32 22.67 6.75 3.99 11.95 1.98 3.21 0.44 0.23 0.02 0.23 0.23
TOO 19.0 29.3 22.7 6.8 4.0 12.0 2.0 I::t::-
3.2 0.4 0.2 Tr 0.2 0.2 IV
(j) ::; p; 1-'-><:
.p,.
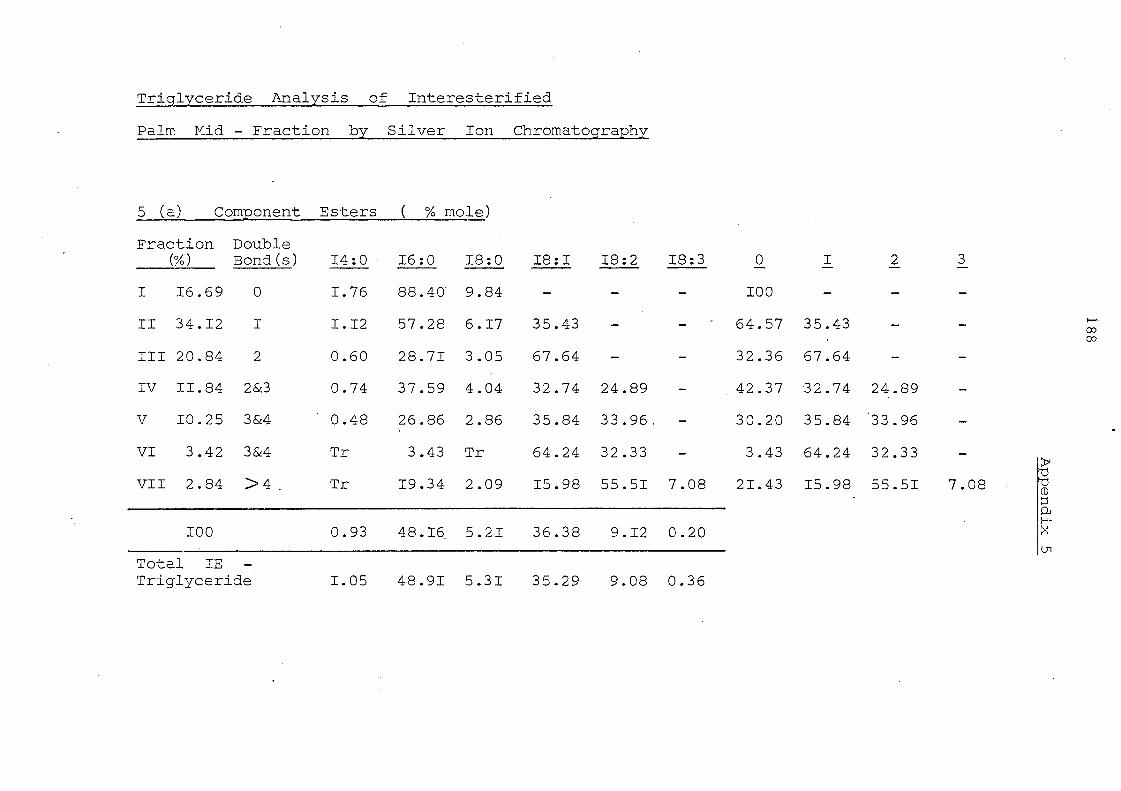
Triglyceride Analysis of Interesterified
Palm Mid - Fraction by Silver Ion Chromatography
5 (a) ComI2onent Esters ( % mole)
Fraction Double (%) Bond(s) 14:0 16:0 18:0 18:1 18:2 18:3 0 I 2 3
I 16.69 0 1.76 88.40' 9.84 100
II 34.12 I 1.12 57.28 6.17 35.43 64.57 35.43 0-.
<X> <X>
III 20.84 2 0.60 28.71 3.05 67.64 32.36 67.64
IV 11.84 2&3 0.74 37.59 4.04 32.74 24.89 42.37 32.74 24.89
V 10.25 3&4 0.48 26.86 2.86 35.84 33.96. 30.20 35.84 33.96
VI 3.42 3&4 Tr 3.43 Tr 64.24 32.33 3.43 64.24 32.33
~ VII 2.84 >4. Tr 19.34 2.09 15.98 55.51 7.08 21.43 15.98 55.51 7.08 CD !j Q, 1-'-
100 0.93 48.16 5.21 36.38 9.12 0.20 I: Total IE Triglyceride LOS 48.91 5.31 35.29 9.08 0.36
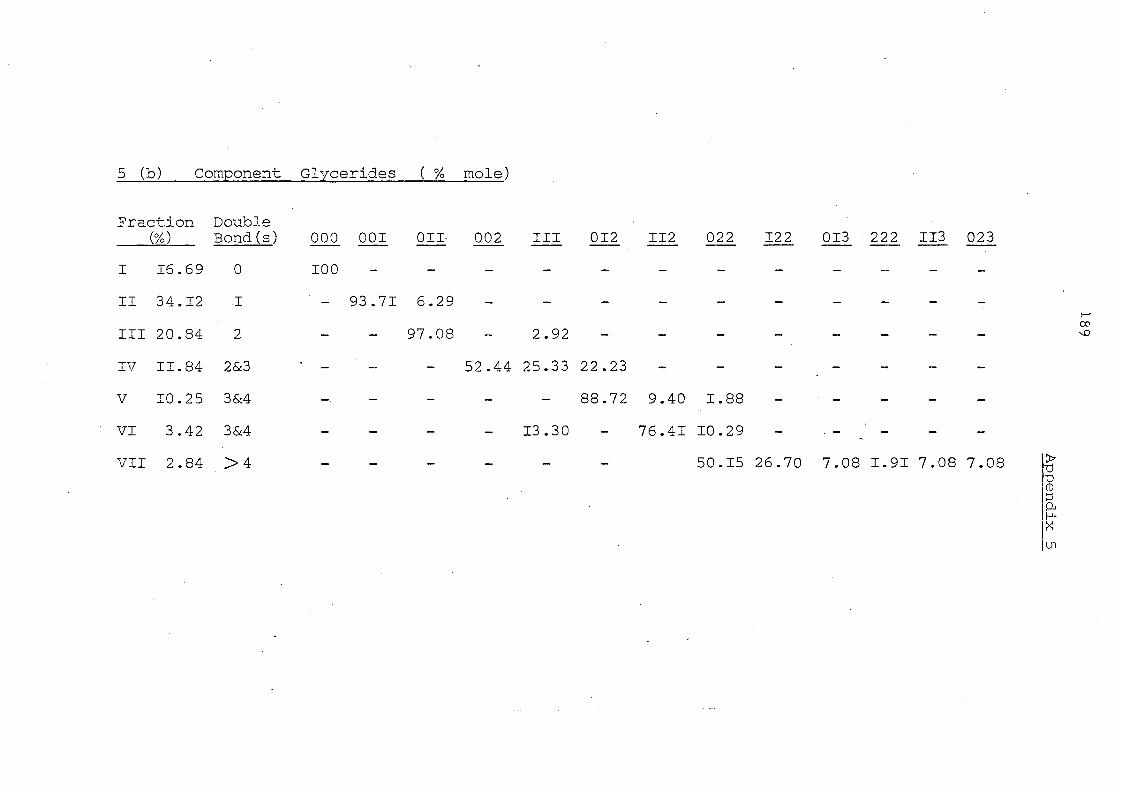
5 (b) Component Glycerides ( % mole)
Fraction Double (%) Bond(s) 000 oor OII- 002 III 012 112 022 122 013 222 113 023
I 16.69 0 100
II 34.12 I 93.71 6.29 ~
co III 20.84 2 97.08 2.92 -.D
IV 11.84 2&3 52.44 25.33 22.23
V 10.25 3&4 88.72 9.40 1.88
VI 3.42 3&4 13.30 76.41 10.29
VII 2.84 >4 50.15 26.70 7.08 1.91 7.08 7.08 ~ D (I)
::s 0.. f-J. X
U1
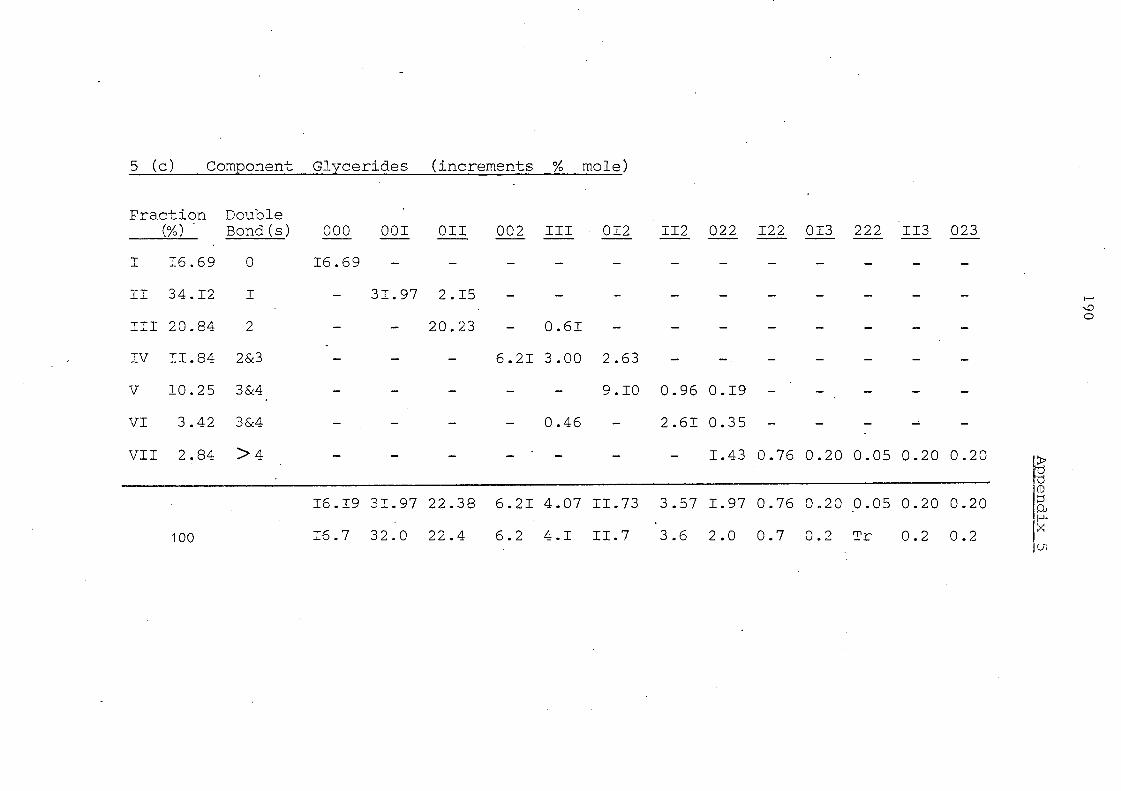
5 (c) Component Glycerides (increments % mole)
Fraction Double (%) Bond(s) 000 001 011 002 III 012 112 022 122 013 222 113 023
I 16.69 0 16.69
II 34.12 I 31.97 2.15 I-'
-..D 0
III 20.84 2 20.23 0.61
IV 11.84 2&3 6.21 3.00 2.63
V IO.25 3&4 9.10 0.96 0.19
VI 3.42 3&4 0.46 2.61 0.35
VII 2.84 >4 1.43 0.76 0.20 0.05 0.20 0.20
~ 16.19 31.97 22.38 6.21 4.07 11.73 3.57 1.97 0.76 0.20 0.05 0.20 0.20
100 16.7 32.0 22.4 6.2 4.1 11.7 3.6 2.0 0.7 0.2 Tr 0.2 0.2 I:,
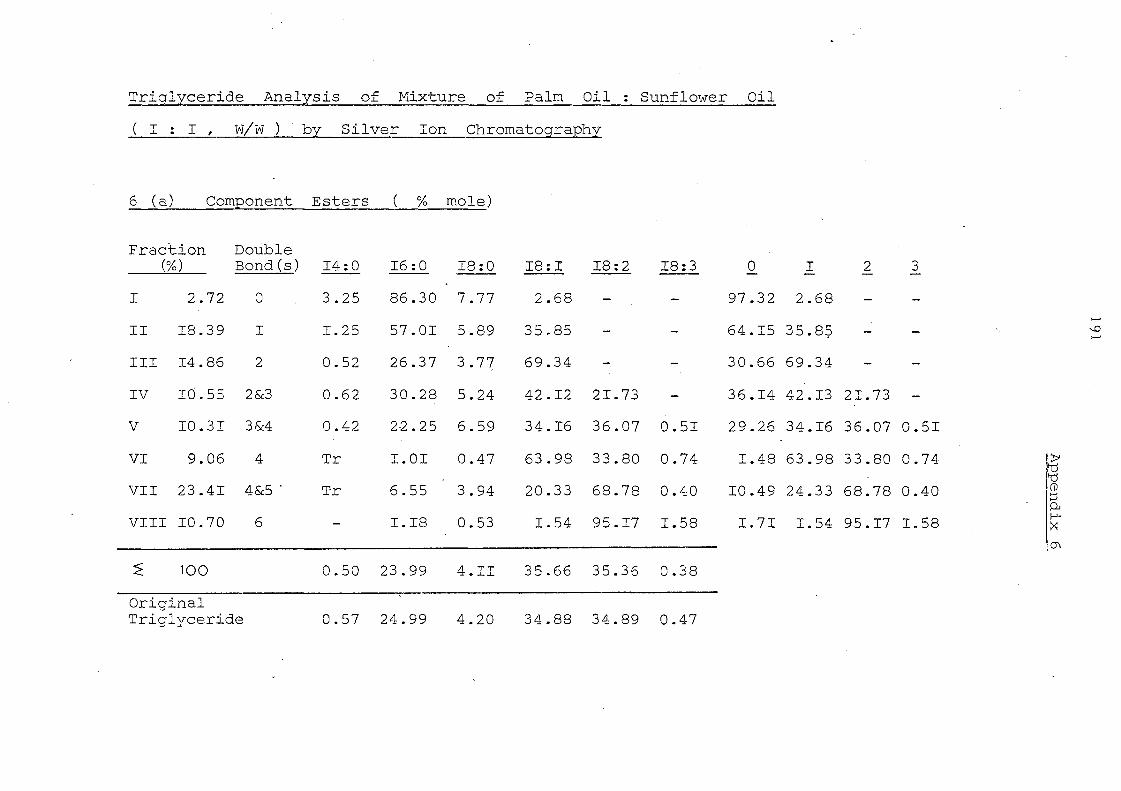
Triglyceride ... ~nalysis of Mixture of Palm Oil Sunflol;ver Oil
I I, W/w) by Silver Ion Chromatography
6 (a) Component Esters % mole)
Fraction Double (%) Bond(s) 14:0 16: 0 18:0 18:1 18:2 18:3 0 I 2 3
I 2.72 0 3.25 86.30 7.77 2.68 97.32 2.68 l-J
II 18.39 I 1.25 57.01 5.89 35.85 64.15 35.8? -.D ,....-
III 14.86 2 0.52 26.37 3.77 69.34 30.66 69.34
IV 10.55 2&3 0.62 30.28 5.24 42.12 21.73 36.14 42.13 21.73
V 10.31 3&4 0.42 22.25 6.59 34.16 36.07 0.51 29.26 34.16 36.07 0.51
VI 9.06 4 Tr 1.01 0.47 63.98 33.80 0.74 1.48 63.98 33.80 0.74
~ VII 23.41 4&5 . Tr 6.55 3.94 20.33 68.78 0.40 10.49 24.33 68.78 0.40 l!:j
0.
VIII 10.70 6 1. 18 0.53 1.54 95.I7 1.58 1.71 1.54 95.17 1.58 I~' 0\
~----- .. ---
~ 100 0.50 23.99 4.11 35.66 35.36 0.38
Original Triglyceride 0.57 24.99 4.20 34.88 34.89 0.47
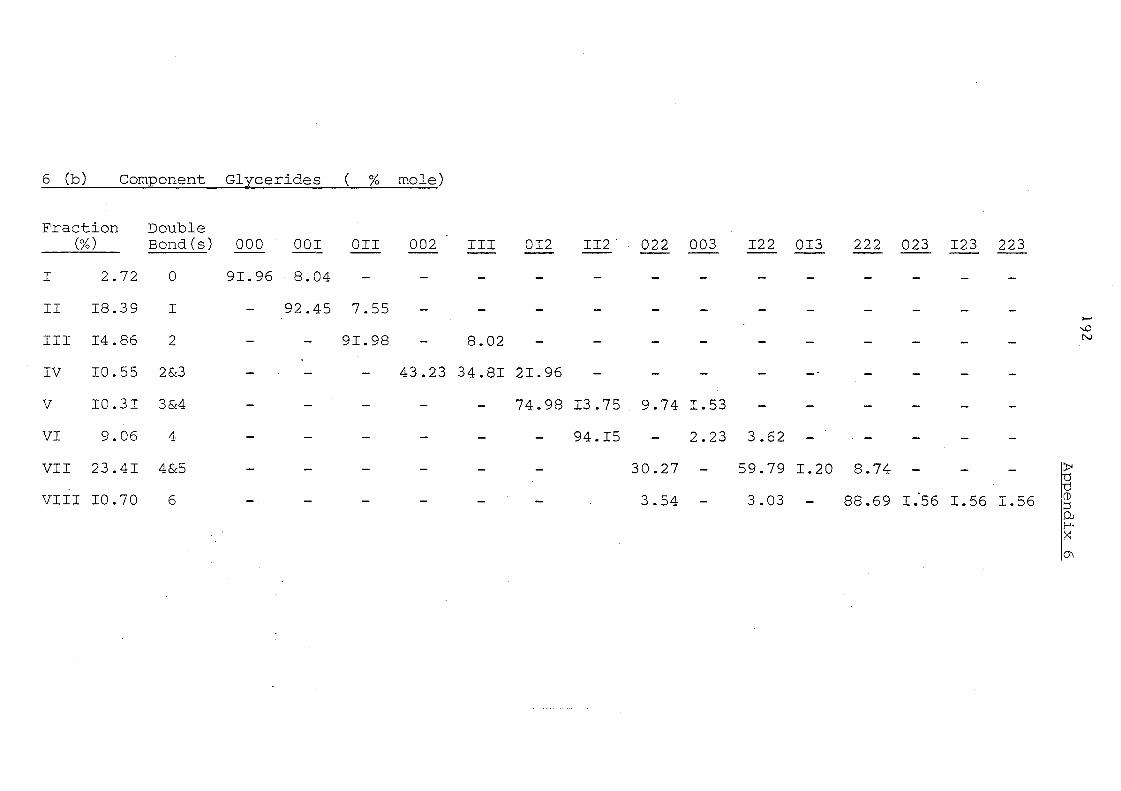
6 (b) Component Glycerides % mole)
Fraction Double (%) Bond(s) 000 001 011 002 III 012 112· 022 003 122 013 222 023 123 223
I 2.72 0 91. 96 8.04
II 18.39 I 92.45 7.55 ...... -..D
III 14.86 2 91.98 8.02 N
IV 10.55 2&3 43.23 34.81 21.96
V 10.31 3&4 74.98 13.75 9.74 1.53
VI 9.06 4- 94.15 2.23 3.62
VII 23.41 4&5 30.27 59.79 1.20 8.74
~ VIII 10.70 6 3.54 3.03 88.69 1:56 1.56 1.56 Q, f-J.
X 0\
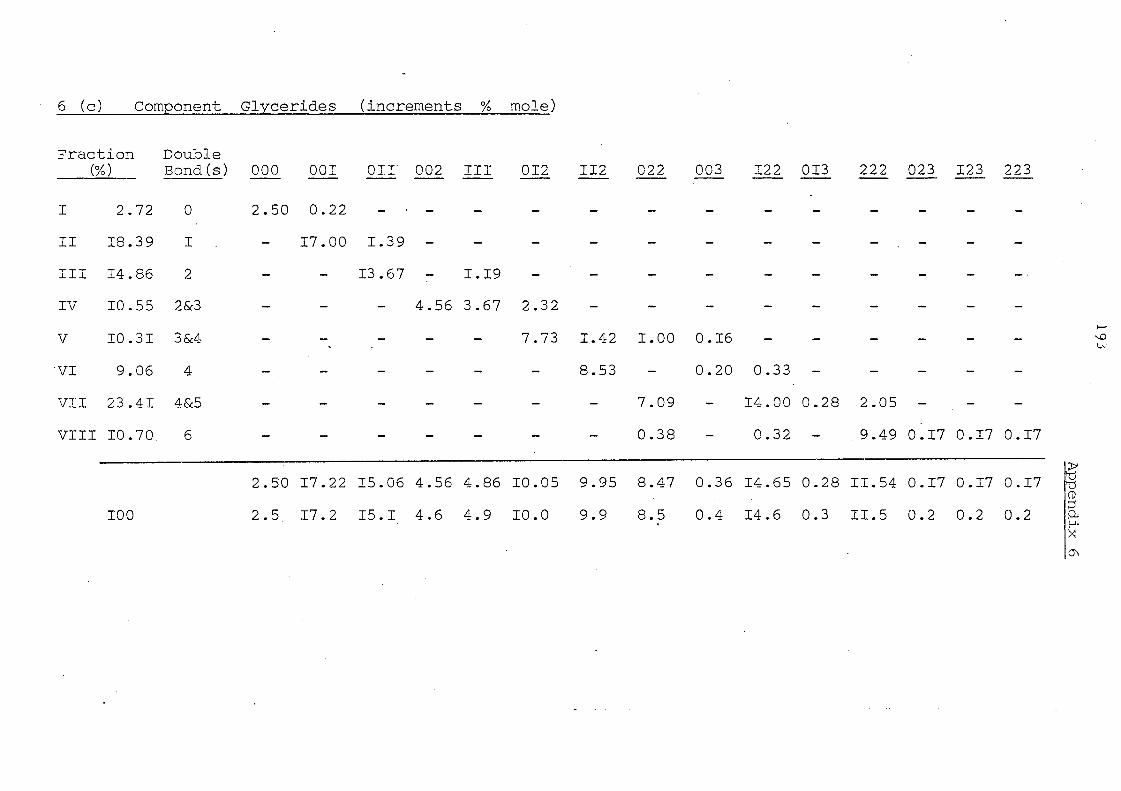
6 (c) Component Glycerides (increments % mole)
Fraction Double (%2.._ Bond(s) 000 001 OIl' 002 III 012 112 022 003 122 013 222 023 123 223
I 2.72 0 2.50 0.22
II 18.39 I 17.00 1.39
III 14.86 2 13.67 1.19
IV 10.55 2&3 4.56 3.67 2.32 >-'
V 10.31 3&4 7.73 1.42 1.00 0.16 -..0 VJ
"VI 9.06 4 8.53 0.20 0.33
VII 23.41 4&5 7.09 14.00 0.28 2.05
VIII 10.70 6 0.38 0.32 9.49 0.17 0.17 0.17
~ 2.50 17.22 15.06 4.56 4.86 10.05 9.95 8.47 0.36 14.65 0.28 11.54 0.17 0.17 0.17
"cD
100 2.5 17.2 15.1 4.6 4.9 10.0 9.9 8.5 0.4 14.6 0.3 11.5 0.2 0.2 0.2 ,[ 1-'-~
0\
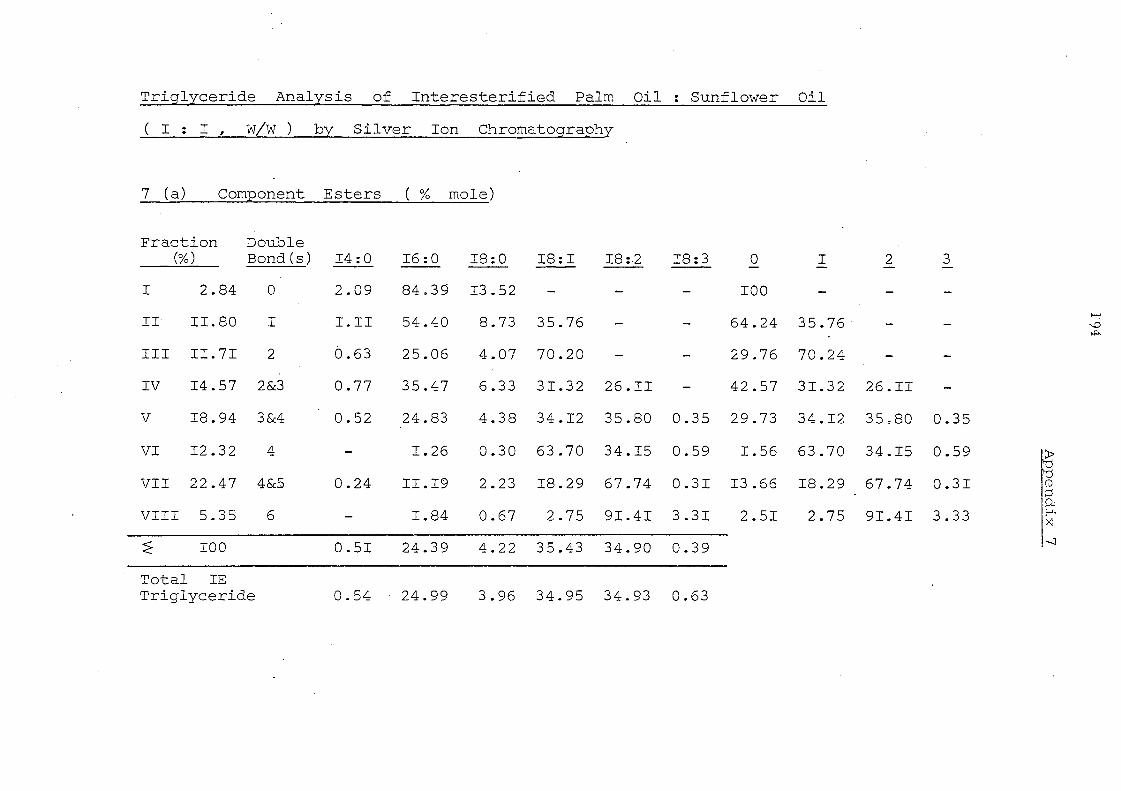
Triglyceride Analysis of Interesterified Palm Oil Sunflower Oil
(I I, W/W) by Silver Ion Chromatography
7 (a) Component Esters ( % mole)
Fraction Double C%) Bond(s) 14:0 16:0 18:0 18:1 18:2 18:3 0 I 2 3 -
I 2.84 0 2.09 84.39 13.52 100
II II. 80 I I. II 54.40 8.73 .......
35.76 64.24 35.76 '-0 .f:>.
III 11.71 2 0.63 25.06 4.07 70.20 29.76 70.24
IV 14.57 2&3 0.77 35.47 6.33 31.32 26.11 42.57 31.32 26.11
V 18.94 3&4 0.52 24.83 4.38 34.12 35.80 0.35 29.73 34.12 35080 0.35
VI 12.32 4 1.26 0.30 63.70 34.15 0.59 1.56 63.70 34.15 0.59
~ VII 22.47 4&5 0.24 11.19 2.23 18.29 67.74 0.31 13.66 18.29 67.74 0.31 ~ p.,
VIII 5.35 6 1.84 0.67 2.75 91.41 3.31 2.51 2.75 91.41 3.33 II-'-X
~ 100 0.51 24.39 4.22 35.43 34.90 0.39 ,--:]
Total IE Triglyceride 0.54 24.99 3.96 34.95 34.93 0.63
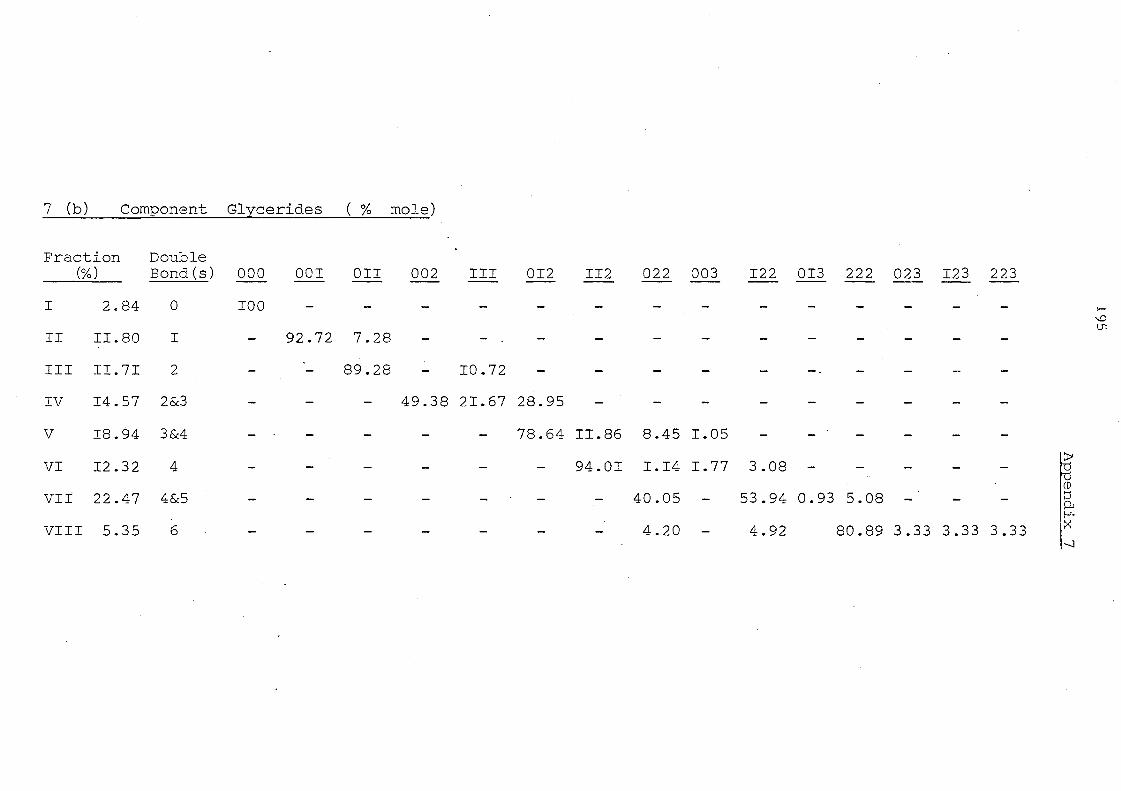
~ (b) Component Glycerides ( % mole) I
Fraction Double (%) Bond(s) 000 001 011 002 III 012 112 022 003 122 013 222 023 123 223
I 2.84 0 100 I-'
-..D U"l
II 11.80 I 92.72 7.28
III II. 71 2 89.28 10.72
IV 14.57 2&3 49.38 21.67 28.95
V 18.94 3&4 78.64 11.86 8.45 1.05
VI 12.32 4 94.01 1.14 1.77 3.08
~ vIl 22.47 4&5 40.05 53.94 0.93 5.08 If-'-
VIII 5.35 6 4.20 4.92 80.89 3.33 3.33 3.33 I~
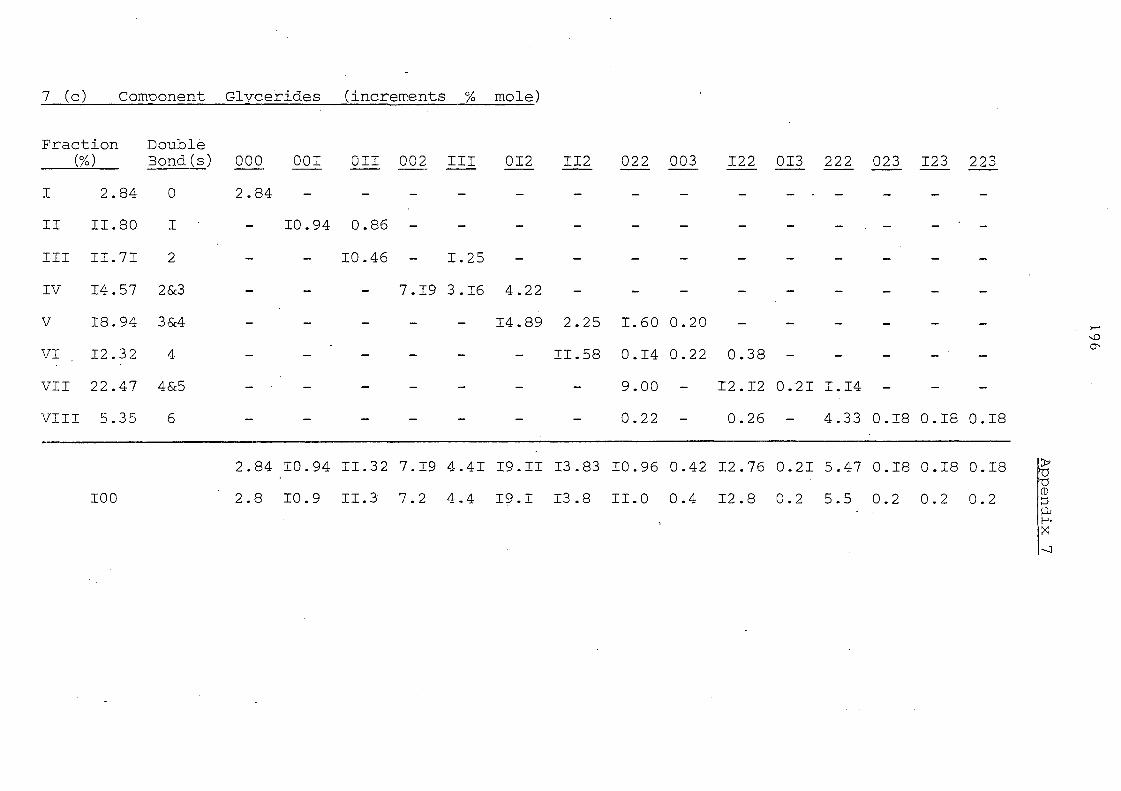
7 (c) Component Glycerides ( increments % mole)
Fraction Double (%) Bond (s) 000 001 all 002 III 012 112 022 003 122 013 222 023 123 223
I 2.84 0 2.84
II 11.80 I 10.94 0.86
III II. 71 2 10.46 1.25
IV 14.57 2&3 7.19 3.16 4.22
v 18.94 3&4 14.89 2.25 1.60 0.20 I-'
--0
VI 12.32 4 11.58 0.14 0.22 0.38 0"'
VII 22.47 4&5 9.00 I2.I2 0.21 1.14
VIII 5.35 6 0.22 0.26 4.33 0.18 0.18 0.18
2.84 10.94 11.32 7.19 4.41 19.11 13.83 10.96 0.42 12.76 0.21 5.47 0.18 0.18 0.18
~ 100 2.8 10.9 11.3 7.2 4.4 19.1 13.8 11.0 0.4 12.8 0.2 5.5 0.2 0.2 0.2 p., 1-'-><:
-...J
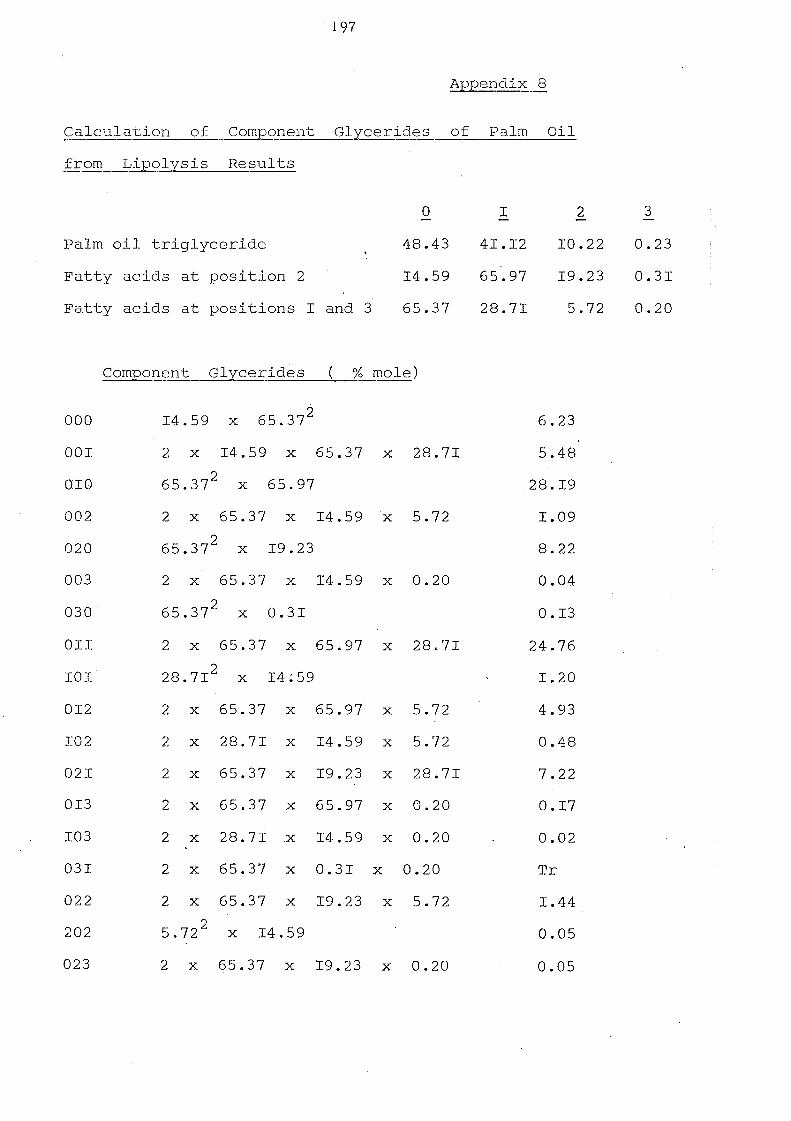
197
Appendix 8
Calculation of Component Glycerides of Palm Oil
from Lipolysis Results
0 I 2 3
Palm oil triglyceride 48.43 41.12 10.22 0.23
Fatty acids at position 2 14.59 65.97 19.23 0.31
Fatty acids at positions I and 3 65.37 28.71 5.72 0.20
Component Glycerides % mole)
000 14.59 x 65.372 6.23
001 2 x 14.59 x 65.37 x 28.71 5.48
010 2 65.97 28.19 65.37 x
002 2 x 65.37 x 14.59 x 5.72 1.09
020 65.37 2 x 19.23 8.22
003 2 x 65.37 x 14.59 x 0.20 0.04
030 65.37 2 x 0.31 0.13
011 2 x 65.37 x 65.97 x 28.71 24.76
101 28.712 x I4~59 I.20
012 2 x 65.37 x 65.97 x 5.72 4.93
102 2 x 28.71 x 14.59 x 5.72 0.48
021 2 x 65.37 x 19.23 x 28.71 7.22
013 2 x 65.37 x 65.97 x 0.20 0.17
103 2 x 28.71 .x 14.59 x 0.20 0.02
031 2 x 65.37 x 0.31 x 0.20 ']~r
022 2 x 65.37 x 19.23 x 5.72 1.44
202 5.72 2 x 14.59 0.05
023 2 x 65.37 x 19.23 x 0.20 0.05
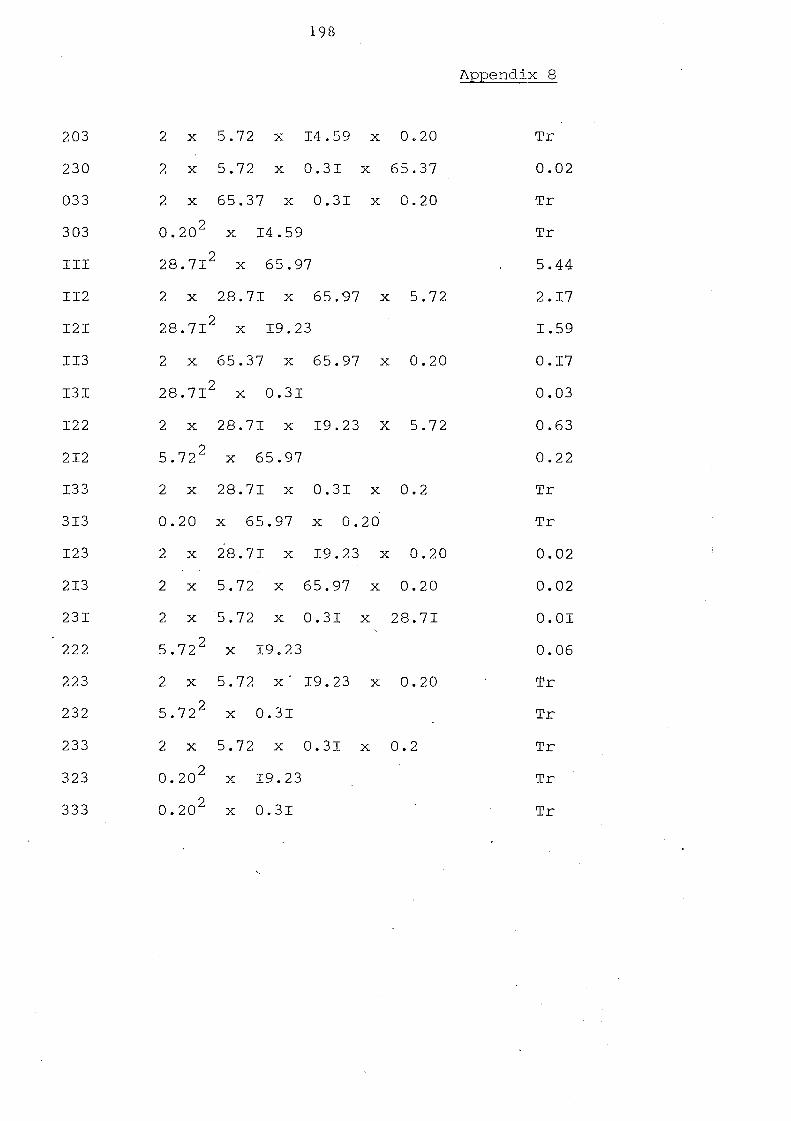
198
Appendix 8
203 2 x 5.72 x 14.59 x 0.20 Tr
230 2 x 5.72 x 0.31 x 65.37 0.02
033 2 x 65.37 x 0.31 x 0.20 Tr
303 0.20 2 x I4.59 Tr
III 28.71 2 x 65.97 5.44
II2 2 x 28.7I x 65.97 x 5.72 2.I7
I2I 28.7I 2 x I9.23 I.59
II3 2 x 65.37 x 65.97 x 0.20 0.I7
I3I 28.7I2 x 0.3I 0.03
I22 2 x 28.7I x I9.23 X 5.72 0.63
2I2 5.72 2 x 65.97 0.22
I33 2 x 28.7I x 0.3I x 0.2 Tr
3I3 0.20 x 65.97 x 0.20 Tr
I23 2 x 28.7I x I9.23 x 0.20 0.02
2I3 2 x 5.72 x 65.97 x 0.20 0.02
23I 2 x 5.72 x 0.3I x 28.7I O.OI
222 5.72 2 x 19.23 0.06
223 2 x 5.72 x I9.23 x 0.20 '1'r
232 5.72 2 x 0.3I Tr
233 2 x 5.72 x 0.3I x 0.2 Tr
323 0.20 2 x I9.23 Tr
333 0.20 2 x 0.31 Tr
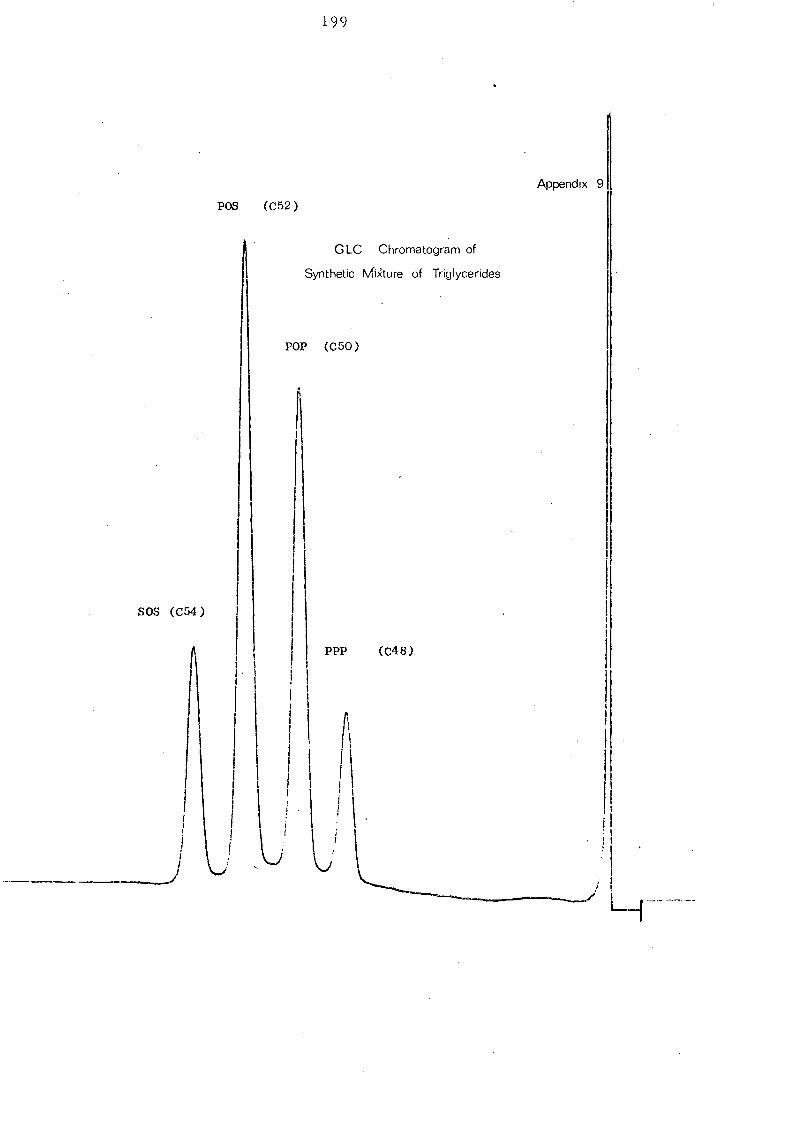
SOS (e54 )
~ \ I
i
} I I
.J
199
POS (e52)
II
I I I
I I I I
I' I I
I I
I I I I
i i I
G LC Chromatogram of
Synthetic Mixture of Triglycerides
POP (e50)
~ d II
I I
I I
I
I , I I I
II
I \ I I I I ! I
PPP (e48)
I I • ! ' I I I I
\
~
I /\ I
i I I
\ II I
I ! \ I I
\ I
\ ! \ I
\ . I !
i lJl U \ ,
~ Appendix 911
,I II If
II II II II
11 II II II
II t I : I I' ; I I I
:'\ I I
j I 4~~~~-
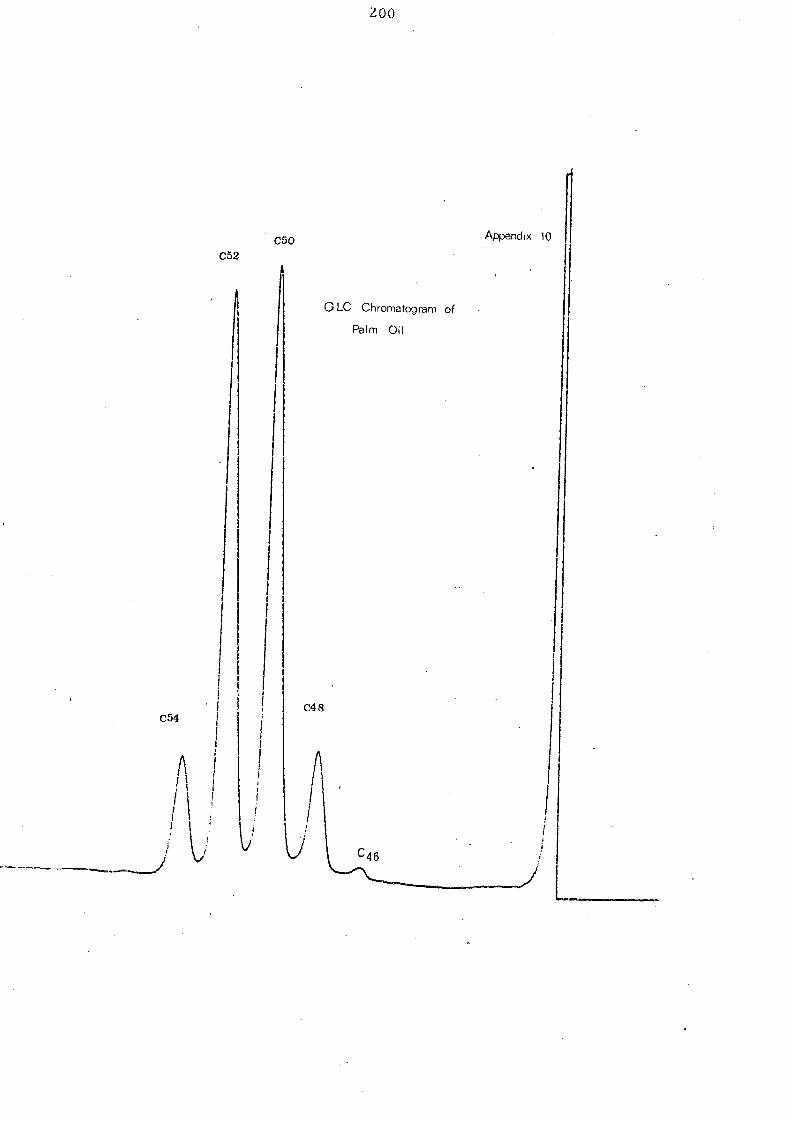
200
C50 . ApPend', 10 ~
C52
'~ I G LC Chromatogram of .
II Palm Oil
I , I
II I I, I II I
I II I {I I I I I
I I I I! I I I I I I I I /' ! I
. I : I C48
C54 I II I I I
A I I I A II I ~ I II ' : \ I \; I J \ i i
. I l i '~! 0/ , I I '.'
j i .. ---.~ -----.J
f
I I
/' I I I j
; I
I
L
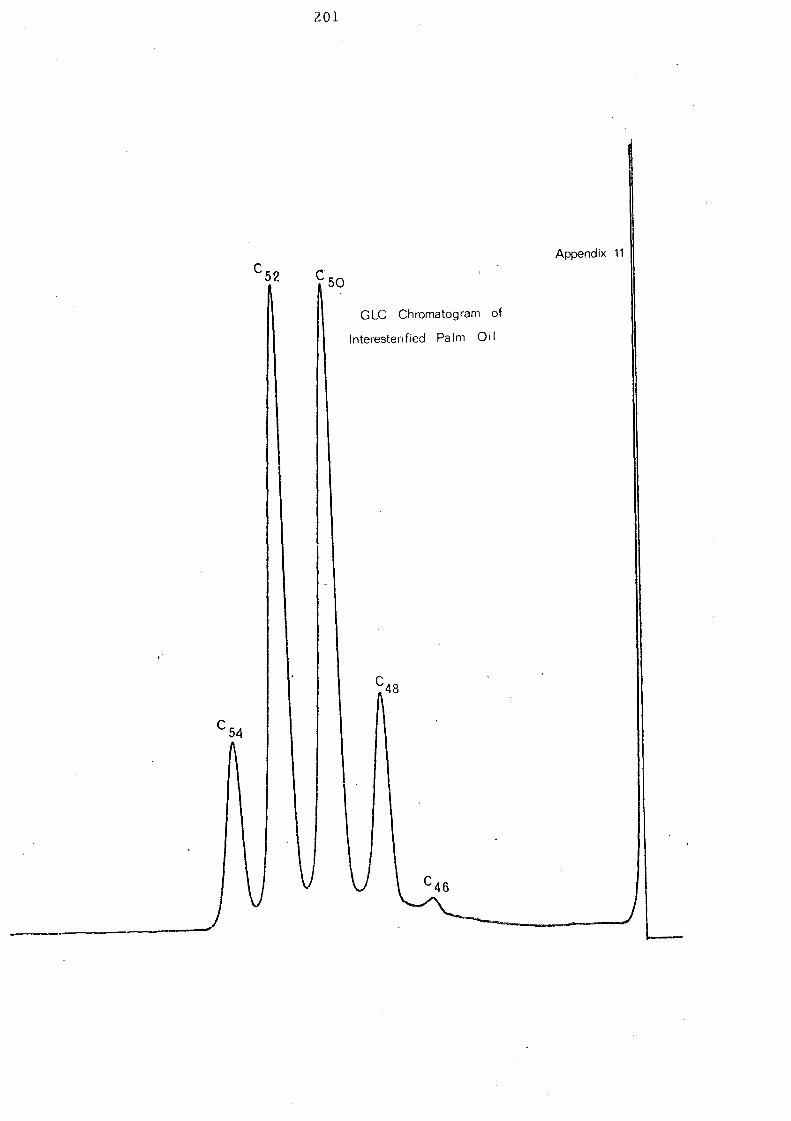
201
G LC Chromatogram of
Interesterified Palm Oi I
Appendix 11
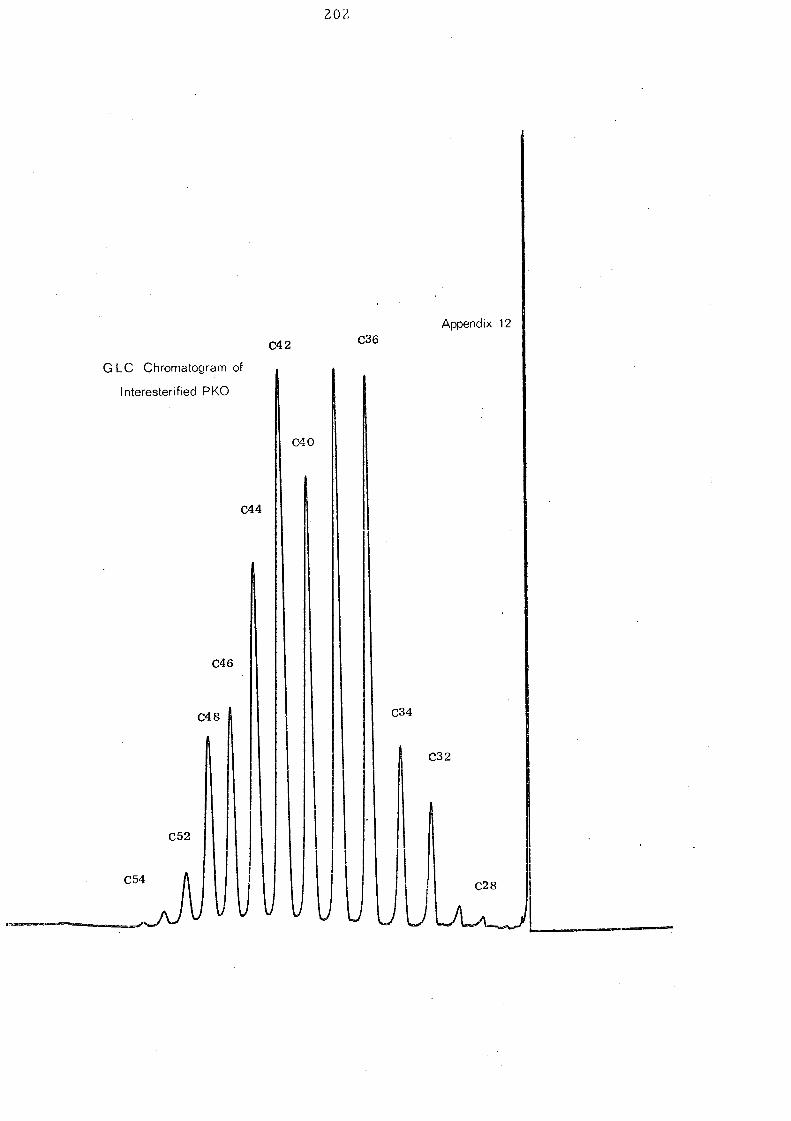
G L C Chromatogram of
I nteresterified P KO
C44
C46
C48
C52
C54
C42
202
Appendix 12 C36
C40
C34
C32
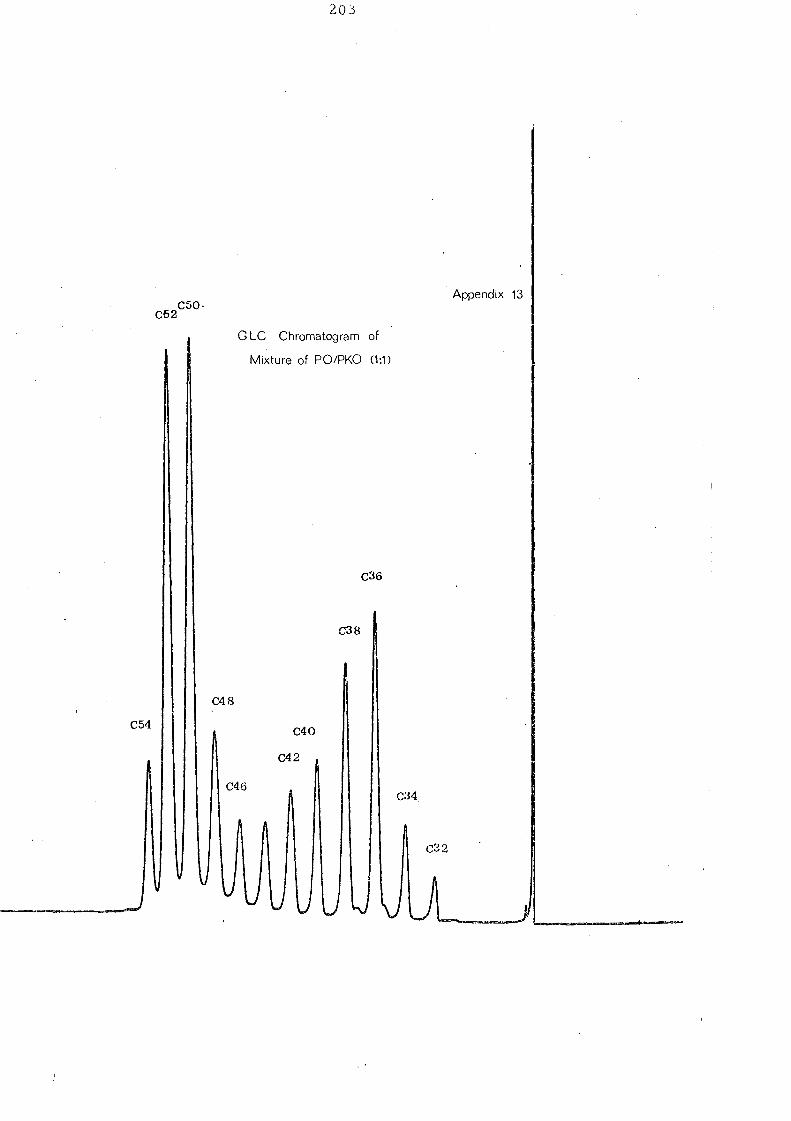
C54
C50· C62
C48
20:5
G LC Chromatogram of
Mixture of PO/PKO (1:1)
C40
C42
C38
C36
C46
Appendix 13
C34
C32
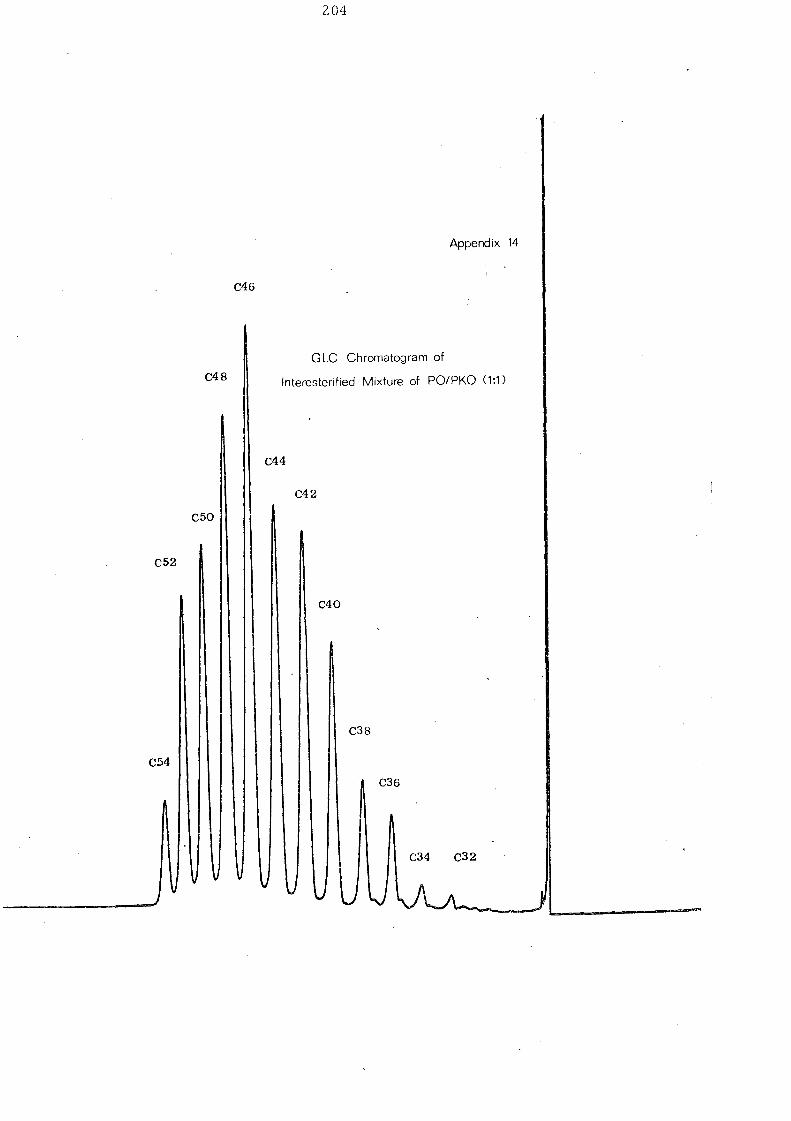
e46
e48
e50
e52
e54
204
Appendix 14
GLC Chromatogram of
Interesterified Mixture of PO/PKO (1:1)
e44
e42
C40
e38
e36
I
U e34 e32
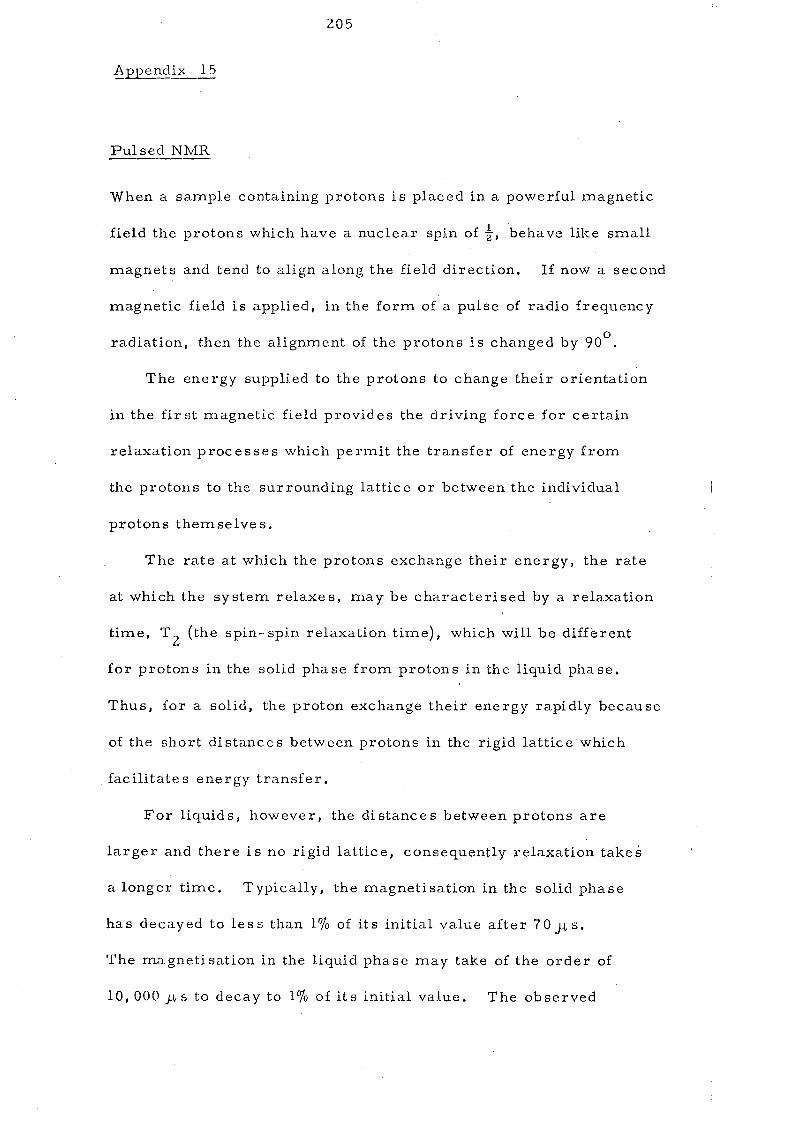
205
Pulsed NMR
When a sample containing protons is placed in a powerful magnetic
field the protons which have a nuclear spin of i, behave like small
magnets and tend to align along the field direction. If now a second
magnetic field is applied, in the form of a pulse of radio frequency
radiation, then the alignment of the protons is changed by 900
•
The energy supplied to the protons to change their orientation
in the first magnetic field provides the dri.ving force for certain
relaxation processes which permit the transfer of energy from
the protons to the surrounding lattice or between the individual
proton s them se 1 ve s.
The rate at which the protons exchange their energy, the rate
at which the system relaxes, may be characterised by a relaxation
time, T 2 (the spin- spin relaxation time), which will be different
for protons in the solid phase from protons in the liquid phase.
Thus, for a solid, the proton exchange their energy rapidly because
of the short distances between protons in the rigid lattice which
facilitate s energy transfer.
For liquid s, however, the di stance s between protons are
larger and there is no rigid lattice, consequently relaxation takes
a longer time. Typically, the magnetisation in the solid phase
has decayed to less than 1% of its initial value after 70fls.
The magnetisation in the liquid phase may take of the order of
10,000 jJ" s to decay to 1% of its initial value. The observed
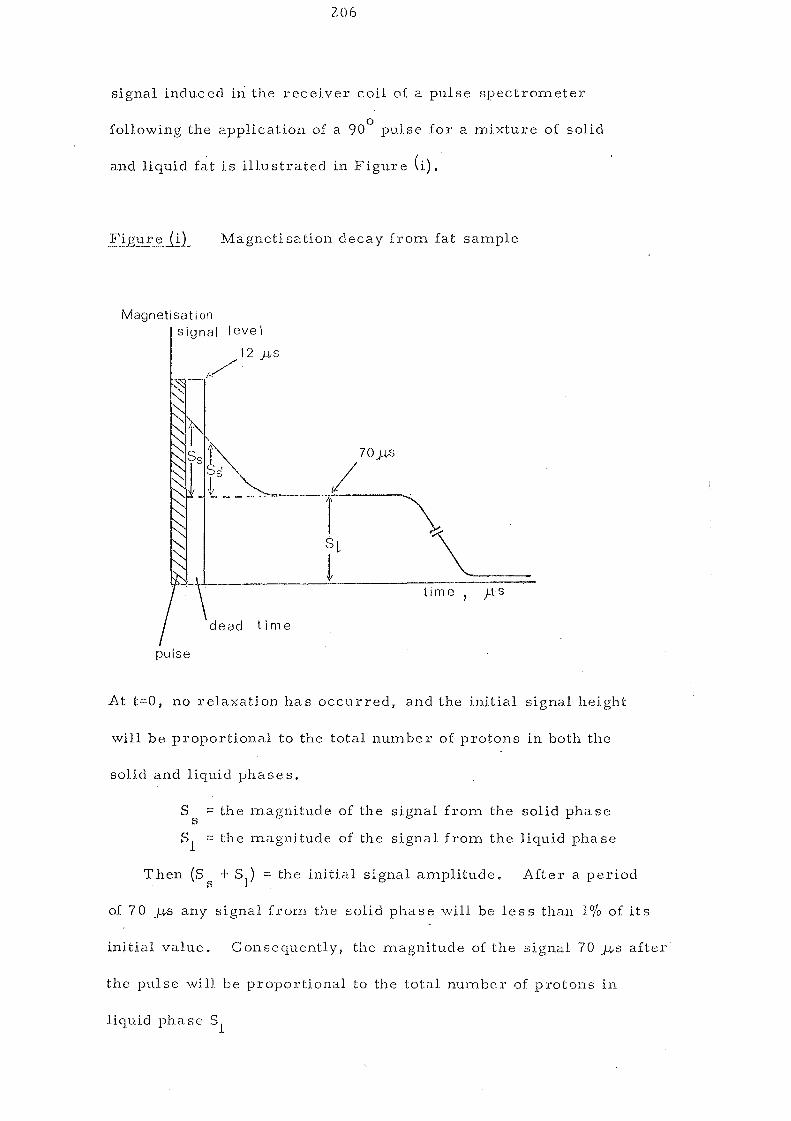
206
signal induced in the receiver coil of a pulse spectrometer
a following the application of a 90 pulse for a mixture of solid
and liquid fat is illustrated in Figure (1).
E1.gure (i) Magneti saUon deca y from fat sample
Magneti sa t i on
6i9na, I eve I
12 jJ;s
~ // '"
time
pulse
time, )-ls
At t:::;O, no relaxation has occurred, and the initial signal height
will be proportional to the total numbe r of protons in both the
solid and liquid phase s.
S ::: the magnitude of the signal from the solid phase s
Sl ;:: the magnitude of the signal from the liquid pha se
Then (S + Sl) ::: the initial signal amplitude. After a period - s
of 70 )J.-s any signal from the solid phase will be less than 1% of its
initial value. Consequently, the magnitude of the signal 70 foS after
the pulse '.vill be proportional to the total number of protons in
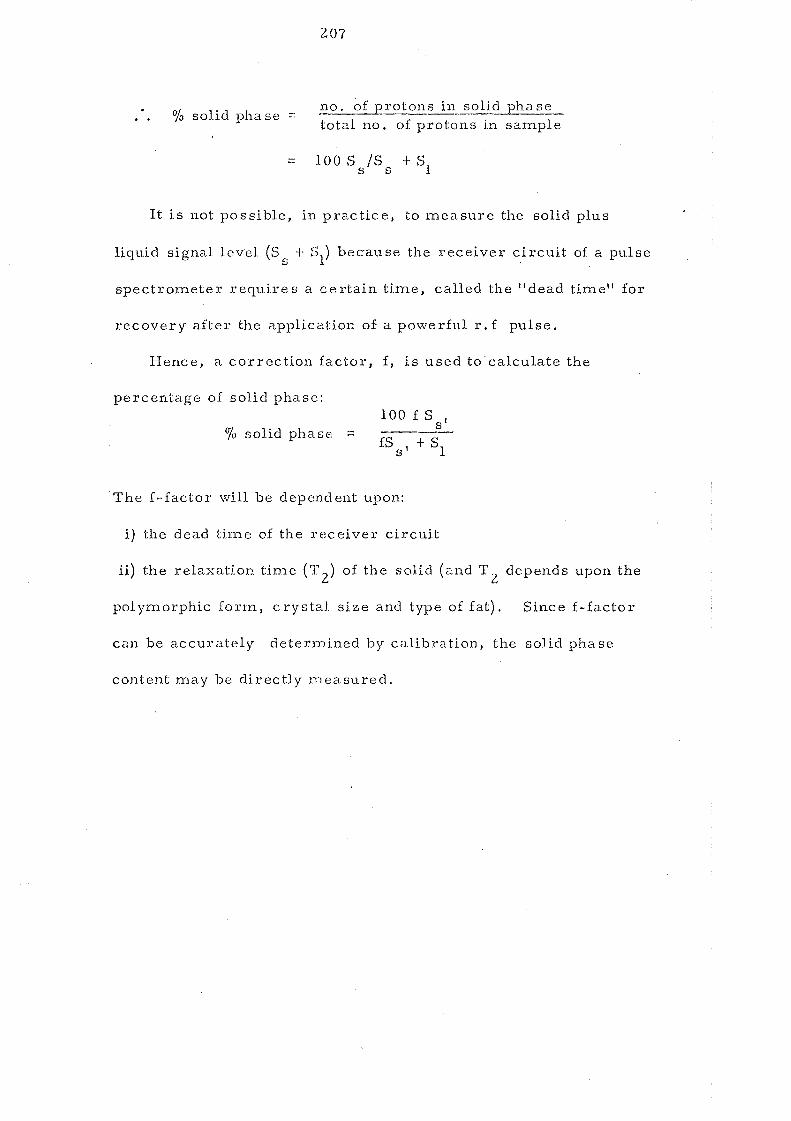
207
% solid pha se _. E~of P,E..~.!:ons in_ solicl~~_ total no. of protons in sarnple
:::
It is not possible, in practice, to measure the solid plus
liquid signal level (Ss -1- 51) because the receiver circuit of a pulse
spectrOlneter requires a certain time, called the "dead ti.me" for
recovery after the application of a powe rful r. f pulse.
Hence, a correction factor, f, is used to calculate the
percentage of solid phase:
% solid phase 100 f S I
S
fS s 1 + Sl
The f-factor will be dependent upon:
i) the dead ti.D.l.e of the receiver circuit
u) the relaxation time (1'2) of the solid (and T 2 depends upon the
polymorphic form, crystal size and type of fat). Since f-factor
can be accurately determined by calibration, the solid phase
content may be directly ITleasured.
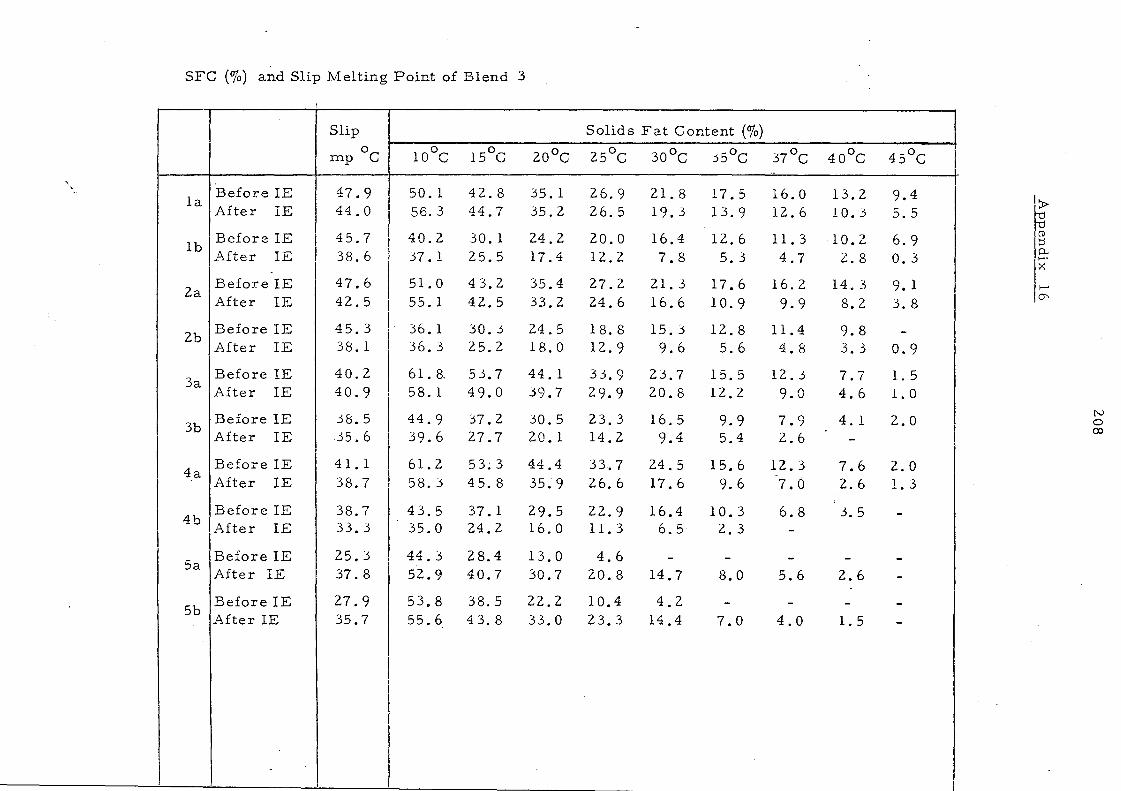
SFe (%) and Slip Melting Point of Blend 3
Slip
° rnp e 100 e 15°C 20 0 e
la Before IE 47.9 50. 1 42.8 35. 1 After IE 44.0 56.3 44.7 35.2
Ib Before IE 45.7 40.2 30. 1 24.2 After IE 38.6 37.1 25.5 17.4
2a Before IE 47.6 51. 0 43.2 35.4 After IE 42.5 55.1 42.5 33.2
2b Before IE 45.3 36.1 30.3 24.5 After IE 38.1 36.3 25.2 18.0
3a Before IE 40.2 61. 8. 53.7 44. 1 After IE 40.9 , 58. 1 49.0 j9.7
3b Before IE :;8.5 44.9 37.2 :;0.5 After IE 35.6 39.6 27.7 20.1
4a Before IE 41.1 61.2 53~3 44.4 After IE 38.7 58.3 45. 8 35.9
4b Before IE 38.7 43.5 37.1 29.5 After IE 33.3 35.0 24.2 16.0
Sa Before IE 25.:; 44.3 28.4 13.0 After IE 37.8 52.9 40.7 30.7
Before IE 27.9 53.8 38.5 22.2 5b
After IE 35.7 55.6 43.8 33.0
I
Solids Fat Content (%)
250
e 30 0 e 35 0 e
26.9 21. 8 17.5 26.5 19.3 13.9
20.0 16.4 12.6 12.2 7.8 5.3
27.2 21. .:$ 17.6 24.6 16.6 10.9
18.8 15.3 12.8 12.9 9.6 5.6
33.9 23.7 15.5 29.9 20.8 12.2
23.3 16.5 9.9 14.2 9.4 5.4
33.7 24.5 15.6 26.6 17.6 9.6
22.9 16.4 10.3 11. 3 6.5 2.3
4.6 - -ZO.8 14.7 8.0
10.4 4.2 -23.3 14.4 7.0
370
e 400
e --
16.0 13.2 12.6 10.3
11. 3 10.2 4.7 2.8
16.2 14. 3
9.9 8.2
11. 4 9.8 4.8 3. 3
12.3 7.7 9.0 4.6
7.9 4.1 2.6 -
12.3 7.6 7.0 2.6
6.8 3.5 -
- -5.6 2.6
- -4.0 1.5
450
e
9.4 5.5
6.9 0.3
9. 1 3.8
-0.9
1.5 1.0
2.0
2.0 1.3
-
----
i I
I
I~
~ ..... X
I-'
0'
N o (Xl
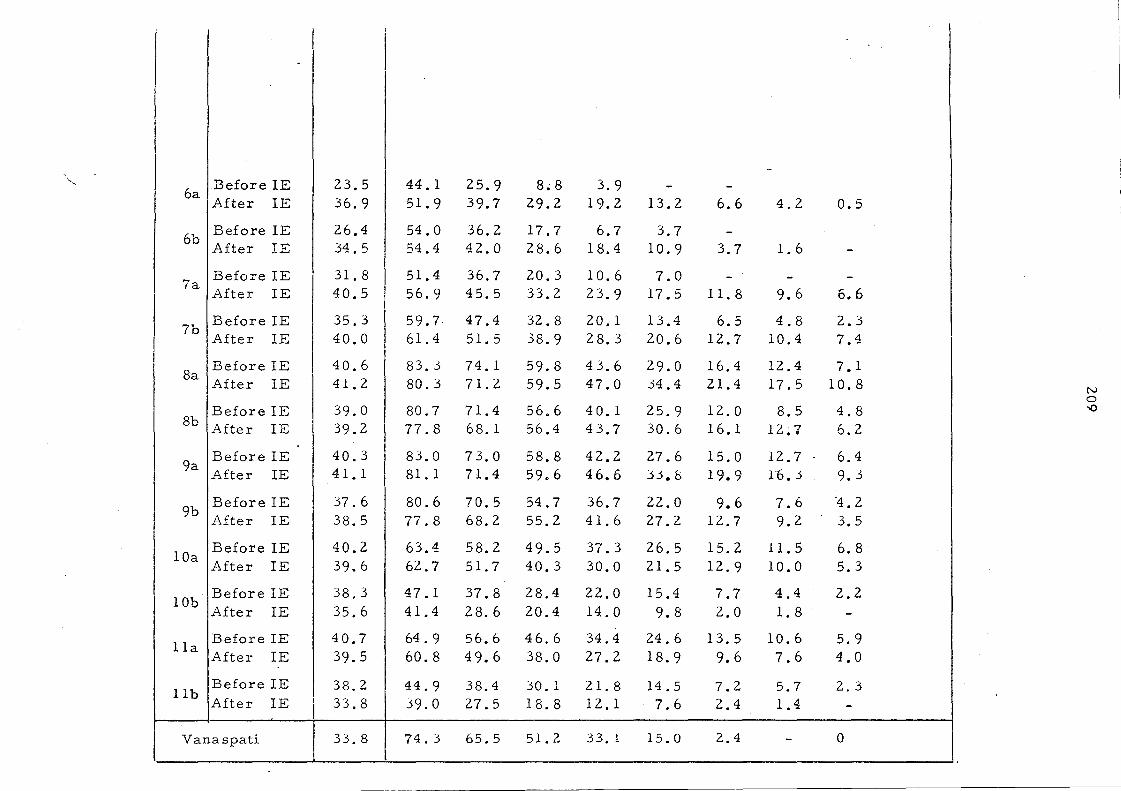
6a .Before IE 23.5 44.1 25.9 After IE 36.9 51. 9 39.7
6b Before IE 26.4 54.0 36.2 After IE 34.5 54.4 42.0
7a Before IE 31. 8 51. 4 36.7 After IE 40.5 56.9 45.5
7b Before IE 35.3 59.7· 47.4 After IE 40.0 61. 4 51.5
8a Before IE 40.6 83 . .:$ 74. 1 After IE 41.2 80.3 71.2
Before IE 39.0 80.7 71.4 8b After IE 39.2 77.8 68.1
9a Before IE 40.3 83.0 73.0 After IE 41.1 81. 1 71.4
9b Before IE 37.6 80.6 70.5 After IE 38.5 77.8 68.2
lOa Before IE 40.2 63.4 58.2 After IE 39.6 62.7 51.7
lOb Before IE 38.3 47.1 37.8 After IE 35.6 41.4 28.6
lla Before IE 40.7 64.9 56.6 After IE 39.5 60.8 49.6
llb Before IE 38.2 44.9 38.4 After IE 33.8 39.0 27.5
Vanaspati 33.8 74.3 65.5
8.8 3.9 29.2 19.2 13.2
17.7 6.7 3.7 28.6 18.4 10.9
20.3 10.6 7.0 33.2 23.9 17.5
32.8 20.1 13.4 38.9 28.3 20.6
59.8 43.6 29.0 59.5 47.0 34.4
56.6 4 O. 1 25.9 56.4 43.7 30.6
58.8 42.2 27.6 59.6 46.6 3.:$.8
54.7 36.7 22.0 55.2 41.6 27.2
49.5 37.3 26.5 40.3 30.0 21. 5
28.4 22.0 15.4 20.4 14.0 9.8
46.6 34.4 24.6 38.0 27.2 18.9
30.1 21.8 14.5 18.8 12. 1 7.6
51.2 33. 1 15.0
6.6 4.2
3.7 1.6
11.8 9.6
6.5 4.8 12.7 10.4
16.4 12.4 21.4 17.5
12.0 8.5 16.1 12.7
15.0 12.7 19.9 10 • .:$
9.6 7.6 12.7 9.2
15.2 11.5 12.9 10.0
7.7 4.4 2.0 1.8
13.5 10.6 9.6 7.6
7.2 5.7 2.4 1.4
2.4
0.5
6.6
2.3 7.4
7.1 10.8
4.8 6.2
6.4 9.3
'4.2 3.5
6.8 5.3
2.2
5.9 4.0
2.3
0
[\J
o -c