Embed Size (px)
Citation preview
To subscribe to our Daily Focus, please contact us at [email protected]
Mirae Asset Sekuritas Indonesia
4 Juli, 2019
Market Index
Last Trade Chg (%) MoM YoY
JCI 6,362.6 -0.3 2.8 11.4
MSCI Indonesia 26.1 -0.1 3.5 19.1
MSCI EM 1,059.6 -0.4 5.8 0.7
HANG SENG 28,855.1 -0.1 7.9 2.2
KOSPI 2,096.0 0.3 1.4 -7.5
FTSE 7,609.3 1 4.8 -0.2
DJIA 26,966.0 0.7 5.7 10.8
NASDAQ 8,170.2 0.8 7.7 8.1
2018F P/E (x) P/B (x) ROE (%)
JCI 15.8 2.3 17.4
Key Rates
Last Trade Chg (bps) MoM YoY
BI 7-Day RR 6.00 0 25 -100
3yr 6.79 -7 -55 -89
10yr 7.29 -6 -67 -45
FX
Last Trade Chg (%) MoM YoY
USD/IDR 14,115.0 0.0 -1.0 -1.7
USD/KRW 1,171.3 0.4 -1.0 5.1
USD/JPY 107.8 -0.1 -0.3 -2.4
USD/CNY 6.9 0.3 -0.4 3.5
Commodities
Last Trade Chg (%) MoM YoY
WTI 57.3 1.9 7.2 9.4
Gold 1,418.8 0.0 7.0 13.1
Coal 72.8 3.9 -0.7 -36.9
Palm Oil 1,890.0 1.3 -6.9 -17.8
Rubber 160.4 0.0 4.1 32.9
Nickel 12,350.0 -2.7 2.8 -17.1
Copper 5,918.0 0.5 0.7 -7.3
Tin 18,310.0 3.4 -7.6 -9.9
JCI Index VS MSCI Emerging Markets
Market commentary
Hariyanto Wijaya CFA, CPA (Aust), CMT ([email protected])
IHSG jatuh 0,3% pada hari Rabu dipimpin oleh sektor pertambangan. Kontributor
terbesar terhadap penurunan IHSG adalah BYAN, ADRO, dan INCO. Kami
perkirakan IHSG akan trade mixed to higher hari ini di balik sentimen positif dari
market US semalam dan dimulainya kembali trade talk antara AS dan Cina.
Indeks US ditutup pada level all-time high pada hari Rabu karena investor
menyambut tanda-tanda bahwa kebijakan moneter global akan menjadi lebih
stimulatif dalam beberapa bulan mendatang karena indikator ekonomi
menunjukkan mode slowing. Private payrolls meningkat 102 ribu pada bulan Juni,
yang berada di bawah proyeksi 140 ribu. Neraca perdagangan AS melebar ke level
tertinggi lima bulan pada Mei karena impor melonjak paling tinggi sejak 2015.
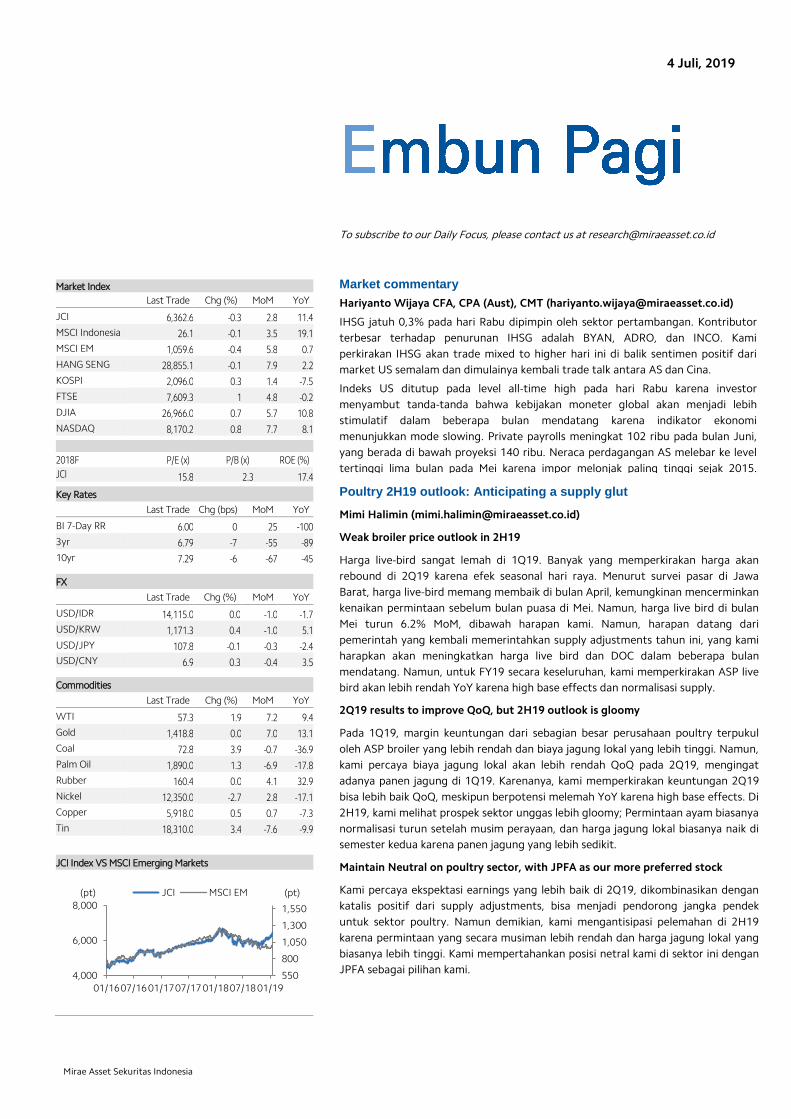
Factory order turun 0,7% pada Mei, yang di bawah ekspektasi penurunan 0,6%. Poultry 2H19 outlook: Anticipating a supply glut
Mimi Halimin ([email protected])
Weak broiler price outlook in 2H19
Harga live-bird sangat lemah di 1Q19. Banyak yang memperkirakan harga akan
rebound di 2Q19 karena efek seasonal hari raya. Menurut survei pasar di Jawa
Barat, harga live-bird memang membaik di bulan April, kemungkinan mencerminkan
kenaikan permintaan sebelum bulan puasa di Mei. Namun, harga live bird di bulan
Mei turun 6.2% MoM, dibawah harapan kami. Namun, harapan datang dari
pemerintah yang kembali memerintahkan supply adjustments tahun ini, yang kami
harapkan akan meningkatkan harga live bird dan DOC dalam beberapa bulan
mendatang. Namun, untuk FY19 secara keseluruhan, kami memperkirakan ASP live
bird akan lebih rendah YoY karena high base effects dan normalisasi supply.
2Q19 results to improve QoQ, but 2H19 outlook is gloomy
Pada 1Q19, margin keuntungan dari sebagian besar perusahaan poultry terpukul
oleh ASP broiler yang lebih rendah dan biaya jagung lokal yang lebih tinggi. Namun,
kami percaya biaya jagung lokal akan lebih rendah QoQ pada 2Q19, mengingat
adanya panen jagung di 1Q19. Karenanya, kami memperkirakan keuntungan 2Q19
bisa lebih baik QoQ, meskipun berpotensi melemah YoY karena high base effects. Di
2H19, kami melihat prospek sektor unggas lebih gloomy; Permintaan ayam biasanya
normalisasi turun setelah musim perayaan, dan harga jagung lokal biasanya naik di
semester kedua karena panen jagung yang lebih sedikit.
Maintain Neutral on poultry sector, with JPFA as our more preferred stock
Kami percaya ekspektasi earnings yang lebih baik di 2Q19, dikombinasikan dengan
katalis positif dari supply adjustments, bisa menjadi pendorong jangka pendek
untuk sektor poultry. Namun demikian, kami mengantisipasi pelemahan di 2H19
karena permintaan yang secara musiman lebih rendah dan harga jagung lokal yang
biasanya lebih tinggi. Kami mempertahankan posisi netral kami di sektor ini dengan
JPFA sebagai pilihan kami. 550
800
1,050
1,300
1,550
4,000
6,000
8,000
01/1607/1601/1707/1701/1807/1801/19
JCI MSCI EM (pt) (pt)
4 Juli, 2019
2
Embun Pagi
Mirae Asset Sekuritas Indonesia
Mirae Asset Sekuritas Indonesia cartoon
4 Juli, 2019
3
Embun Pagi
Mirae Asset Sekuritas Indonesia
Local flashes
PPRO: Penawaran obligasi PP Properti (PPRO) oversubscribed 4,58 kali. Penawaran
Obligasi Berkelanjutan (PUB) I PP Properti Tahap III mengalami kelebihan permintaan atau
oversubscribed hingga 4,58 kali. Nilai permintaannya mencapai Rp 2,45 triliun. Padahal, nilai
yang ditawarkan oleh pengembang properti ini hanya sebesar Rp 534,5 miliar. Direktur
Utama PT PP Properti Tbk (PPRO) Taufik Hidayat mengatakan, kelebihan permintaan ini
menjadi bukti bahwa para investor memiliki apresiasi yang cukup tinggi pada PPRO.
“Keberhasilan penerbitan obligasi ini tidak luput dari pemilihan timing yang tepat,"(Kontan)
UNTR: Penjualan United Tractors (UNTR) turun akibat penurunan harga komoditas. PT
United Tractors (UNTR) mencatatkan penurunan penjualan Komatsu secara kumulatif
sebesar 17,49% secara year on year (yoy) menjadi 1.731 unit dari Januari sampai Mei 2019.
Penurunan ini akibat melambatnya industri pertambangan. Sekretaris Perusahaan UNTR
Sara Loebis menjelaskan, turunnya penjualan sejalan dengan kegiatan pertambangan yang
saat ini melambat. “Hal ini imbas dari harga batubara lebih rendah dibandingkan tahun lalu
(Kontan)
BIRD: Ini Ekspansi Blue Bird (BIRD) pada Semester II/2019. Emiten transportasi, PT Blue
Bird Tbk. masih akan terus melanjutkan ekspansinya pada semester II/2019. Direktur
Keuangan Blue Bird Sandy Permadi menjelaskan bahwa saat ini perseroan menyasar empat
bandar udara (bandara) baru di Pulau Jawa untuk bisnis jasa transportasi. Adapun, bandara
yang menjadi target perseroan di antaranya adalah Bandara Internasional New Yogyakarta,
dan Bandara Kertajati (Bisnis.com)
PTPP: PP (PTPP) Bakal Kembangkan Area Perkantoran Jadi Konsep Mixed Used. PT PP
(Persero) Tbk. berencana mengembangkan konsep mixed used di aset areal kantor milik
perseroan, PP Square, seluas 6 hektare. M. Aprindy, Direktur Strategi Korporasi & HCM PP
mengatakan akan mengembangkan Plaza PP dengan konsep mixed used.Nantinya, di
kawasan itu akan berdiri 5 gedung perkantoran atau office tower, 2 tower apartemen, serta
1 tower rusunami hunian bagi masyarakat berpenghasilan rendah (MBR). “Kami berharap
proyek dimulai paling kuartal IV/2019," jelasnya (Bisnis.com)
BIPI: BIPI kantongi pernyataan efektif dari OJK atas rencana penawaran umum terbatas I.
PT Astrindo Nusantara Infrastuktur Tbk (BIPI) memperoleh pernyataan efektif dari otoritas
jasa keuangan (OJK) atas rencana penawaran umum terbatas I atau HMETD pada Juni 28
2019. Sebelumnya emiten berkode saham BIPI ini sudah mendapat restu dari pemegang
saham pada RUPS Luar Biasa pada 2 Mei 2019 silam. Direktur Utama BIPI, Ray Gerungan
mengatakan penyertaan efektif dari OJK sesuai dengan target tepat waktu. "Dengan
demikian, pelaksanaan HMETD akan berdampak positif dalam mendukung target pencapaian
operasional perusahaan dan pengembangan ke depannya," (Kontan)
CSAP: Catur Sentosa Adiprana (CSAP) Buka Gerai di Yogyakarta. Distributor bahan
bangunan dan peritel, PT Catur Sentosa Adiprana Tbk. (CSAP) membuka gerai kedua pada
tahun ini. Gerai kedua tahun ini berada di Yogyakarta, sekaligus menjadi Mitra10 pertama
yang berada di Jawa Tengah. “Ini merupakan kali pertama kami melakukan penetrasi ke
pasar Jawa Tengah, pemilihan kota Yogyakarta tidak lepas dari perkembangan sektor
properti yang tumbuh pesat dalam beberapa tahun terakhir," tulis Idrus H. Widjajakusuma,
Corporate Secretary Catur Sentosa Adiprana dalam keterangan resmi, Rabu (3/7/2019).
(Bisnis.com)
4 Juli, 2019
4
Embun Pagi
Mirae Asset Sekuritas Indonesia
Technical analysis
Tasrul +62-21-515-1140 [email protected]
Jakarta Composite Index (JCI) – Consolidation
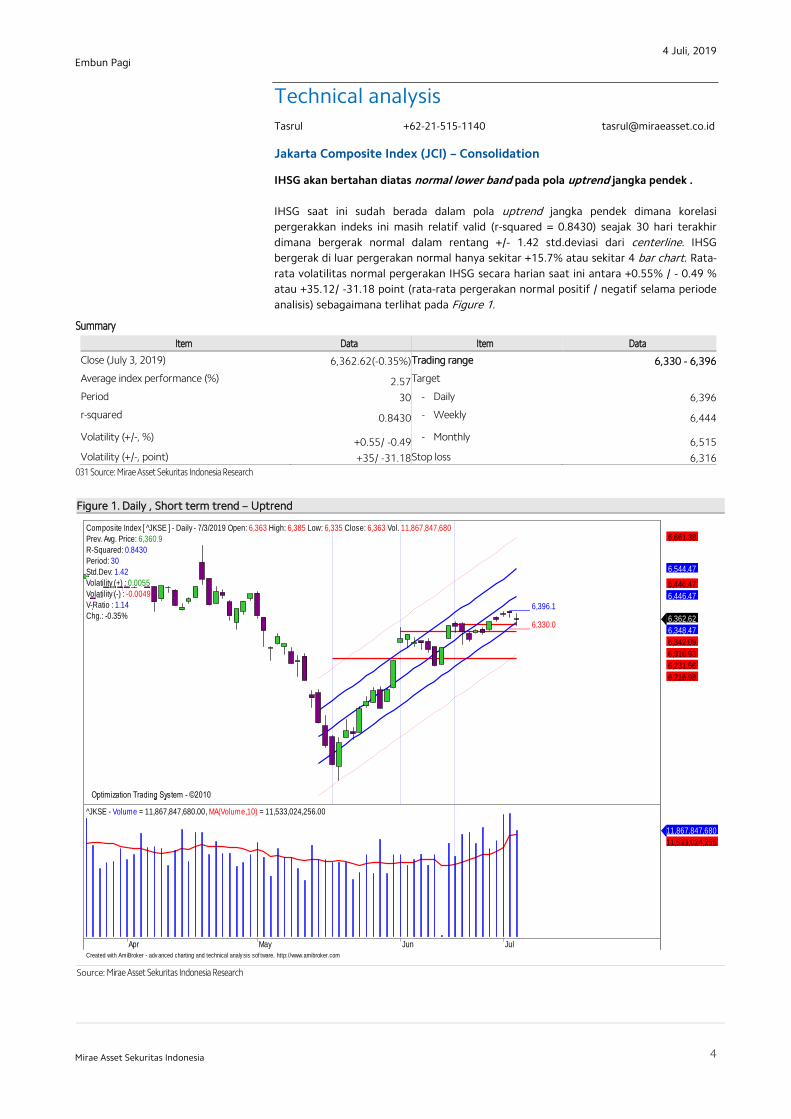
IHSG akan bertahan diatas normal lower band pada pola uptrend jangka pendek .
IHSG saat ini sudah berada dalam pola uptrend jangka pendek dimana korelasi
pergerakkan indeks ini masih relatif valid (r-squared = 0.8430) seajak 30 hari terakhir
dimana bergerak normal dalam rentang +/- 1.42 std.deviasi dari centerline. IHSG
bergerak di luar pergerakan normal hanya sekitar +15.7% atau sekitar 4 bar chart. Rata-
rata volatilitas normal pergerakan IHSG secara harian saat ini antara +0.55% / - 0.49 %
atau +35.12/ -31.18 point (rata-rata pergerakan normal positif / negatif selama periode
analisis) sebagaimana terlihat pada Figure 1.
Summary
Item Data Item Data
Close (July 3, 2019) 6,362.62(-0.35%) Trading range 6,330 - 6,396
Average index performance (%) 2.57 Target
Period 30 - Daily 6,396
r-squared 0.8430 - Weekly 6,444
Volatility (+/-, %) +0.55/ -0.49 - Monthly 6,515
Volatility (+/-, point) +35/ -31.18 Stop loss 6,316
031 Source: Mirae Asset Sekuritas Indonesia Research
Figure 1. Daily , Short term trend – Uptrend
4 - 6,161 Source: Mirae Asset Sekuritas Indonesia Research
Created with AmiBroker - adv anced charting and technical analy sis sof tware. http://www.amibroker.com
_____ 6,396.1
_____ 6,330.0
Optimization Trading System - ©2010 Optimization Trading System - ©2010 Optimization Trading System - ©2010 Optimization Trading System - ©2010 Optimization Trading System - ©2010
Composite Index [ ^JKSE ] - Daily - 7/3/2019 Open: 6,363 High: 6,385 Low: 6,335 Close: 6,363 Vol. 11,867,847,680
Prev. Avg. Price: 6,360.9
R-Squared: 0.8430
Period: 30
Std.Dev: 1.42
Volatility (+) : 0.0055
Volatility (-) : -0.0049
V-Ratio : 1.14
Chg.: -0.35% 6,362.62
6,348.47
6,342.09
6,316.93
6,231.56
6,216.98
6,446.47
6,446.47
6,544.47
6,661.38
Apr May Jun Jul
^JKSE - Volume = 11,867,847,680.00, MA(Volume,10) = 11,533,024,256.00
11,867,847,680
11,533,024,256

4 Juli, 2019
5
Embun Pagi
Mirae Asset Sekuritas Indonesia
Aliran dana keluar dan volatilitas indeks turun sementara akan tertahan.
Pada Figure 2, terlihat dari hasil optimalisasi terakhir pada periode daily indikator MFI
optimized dan indikator W%R optimized akan menguji support trend line. Sementara
pada periode weekly indikator MFI optimized dan indikator RSI optimized masih
cenderung naik. Daily resistance terdekat di 6,396 dan support di 6,330. Cut loss level di
6,316.
Figure 2. Daily, Short term trend, MFI optimized & W%R optimized
X` x`x`
Source: Mirae Asset Sekuritas Indonesia Research
Created with AmiBroker - adv anced charting and technical analy sis sof tware. http://www.amibroker.com
^JKSE - MFI Smoothed = 73.94
73.9426
^JKSE - Will%R Smoothed = -23.86
-23.8561
_____ 6,396.1_____ 6,330.0
Optimization Trading System - ©2010 Optimization Trading System - ©2010 Optimization Trading System - ©2010
Composite Index [ ^JKSE ] - Daily - 7/3/2019 Open: 6,363 High: 6,385 Low: 6,335 Close: 6,363 Vol. 11,867,847,680
Prev. Avg. Price: 6,360.9
R-Squared: 0.8430
Period: 30
Std.Dev: 1.42
Volatility (+) : 0.0055
Volatility (-) : -0.0049
V-Ratio : 1.14
Chg.: -0.35%
6,362.62
6,342.09
6,316.93
6,216.98
2019 Feb Mar Apr May Jun Jul
^JKSE - Volume = 11,867,847,680.00, MA(Volume,10) = 11,533,024,256.0011,867,847,680
11,533,024,256
4 Juli, 2019
6
Embun Pagi
Mirae Asset Sekuritas Indonesia
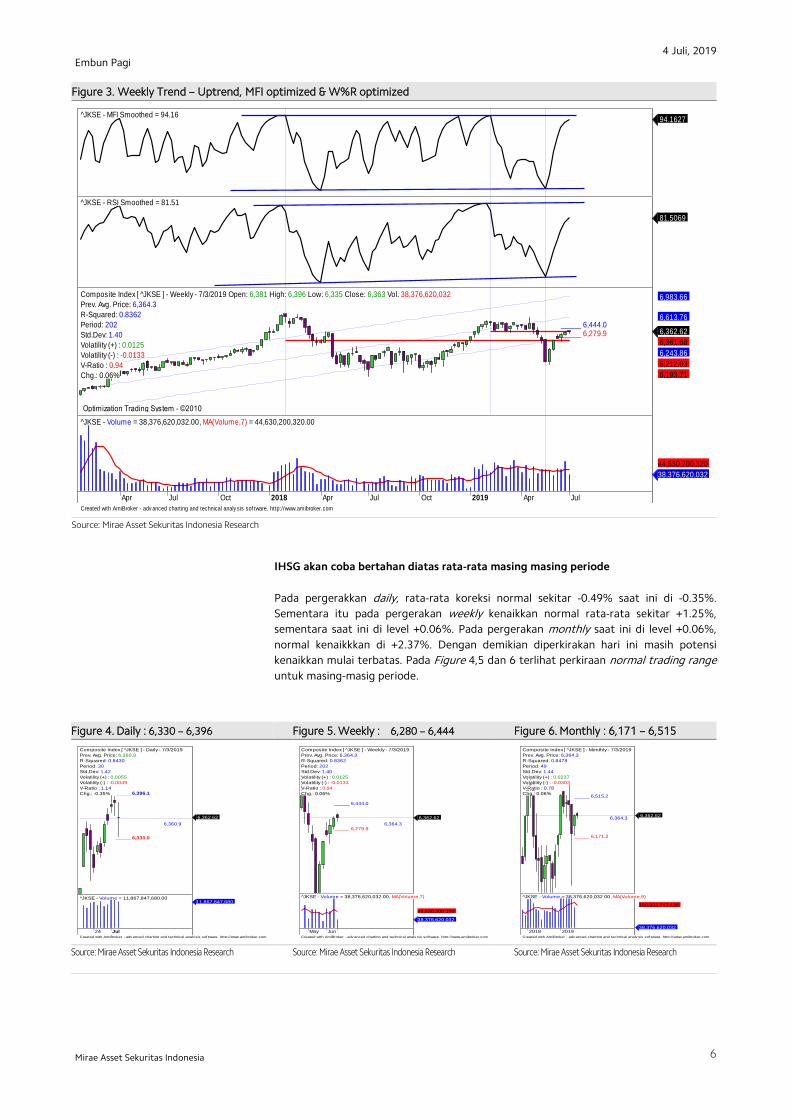
Figure 3. Weekly Trend – Uptrend, MFI optimized & W%R optimized
A
Source: Mirae Asset Sekuritas Indonesia Research
IHSG akan coba bertahan diatas rata-rata masing masing periode
Pada pergerakkan daily, rata-rata koreksi normal sekitar -0.49% saat ini di -0.35%.
Sementara itu pada pergerakan weekly kenaikkan normal rata-rata sekitar +1.25%,
sementara saat ini di level +0.06%. Pada pergerakan monthly saat ini di level +0.06%,
normal kenaikkkan di +2.37%. Dengan demikian diperkirakan hari ini masih potensi
kenaikkan mulai terbatas. Pada Figure 4,5 dan 6 terlihat perkiraan normal trading range
untuk masing-masig periode.
Figure 4. Daily : 6,330 – 6,396 Figure 5. Weekly : 6,280 – 6,444 Figure 6. Monthly : 6,171 – 6,515
x
x x`
Source: Mirae Asset Sekuritas Indonesia Research
Source: Mirae Asset Sekuritas Indonesia Research
Source: Mirae Asset Sekuritas Indonesia Research
Created with AmiBroker - adv anced charting and technical analy sis sof tware. http://www.amibroker.com
^JKSE - MFI Smoothed = 94.16 94.1627
^JKSE - RSI Smoothed = 81.51
81.5069
_____ 6,444.0_____ 6,279.9
Optimization Trading System - ©2010 Optimization Trading System - ©2010 Optimization Trading System - ©2010 Optimization Trading System - ©2010
Composite Index [ ^JKSE ] - Weekly - 7/3/2019 Open: 6,381 High: 6,396 Low: 6,335 Close: 6,363 Vol. 38,376,620,032
Prev. Avg. Price: 6,364.3
R-Squared: 0.8362
Period: 202
Std.Dev: 1.40
Volatility (+) : 0.0125
Volatility (-) : -0.0133
V-Ratio : 0.94
Chg.: 0.06%
6,362.62
6,361.68
6,243.86
6,212.03
6,193.71
6,613.76
6,983.66
Apr Jul Oct 2018 Apr Jul Oct 2019 Apr Jul
^JKSE - Volume = 38,376,620,032.00, MA(Volume,7) = 44,630,200,320.00
38,376,620,032
44,630,200,320
Created with AmiBroker - adv anced charting and technical analy sis sof tware. http://www.amibroker.com
_____ 6,396.1
_____ 6,330.0
6,360.9
Composite Index [ ^JKSE ] - Daily - 7/3/2019
Prev. Avg. Price: 6,360.9
R-Squared: 0.8430
Period: 30
Std.Dev: 1.42
Volatility (+) : 0.0055
Volatility (-) : -0.0049
V-Ratio : 1.14
Chg.: -0.35%
6,362.62
24 Jul
^JKSE - Volume = 11,867,847,680.0011,867,847,680
Created with AmiBroker - adv anced charting and technical analy sis sof tware. http://www.amibroker.com
_____ 6,444.0
_____ 6,279.96,364.3
Composite Index [ ^JKSE ] - Weekly - 7/3/2019
Prev. Avg. Price: 6,364.3
R-Squared: 0.8362
Period: 202
Std.Dev: 1.40
Volatility (+) : 0.0125
Volatility (-) : -0.0133
V-Ratio : 0.94
Chg.: 0.06%
6,362.62
May Jun
^JKSE - Volume = 38,376,620,032.00, MA(Volume,7)
38,376,620,032
44,630,200,320
Created with AmiBroker - adv anced charting and technical analy sis sof tware. http://www.amibroker.com
_____ 6,515.2
_____ 6,171.2
6,364.3
Composite Index [ ^JKSE ] - Monthly - 7/3/2019
Prev. Avg. Price: 6,364.3
R-Squared: 0.8478
Period: 49
Std.Dev: 1.44
Volatility (+) : 0.0237
Volatility (-) : -0.0303
V-Ratio : 0.78
Chg.: 0.06%
6,362.62
2018 2019
^JKSE - Volume = 38,376,620,032.00, MA(Volume,9)
38,376,620,032
158,902,747,136
4 Juli, 2019
7
Embun Pagi
Mirae Asset Sekuritas Indonesia
Stocks on our focus list
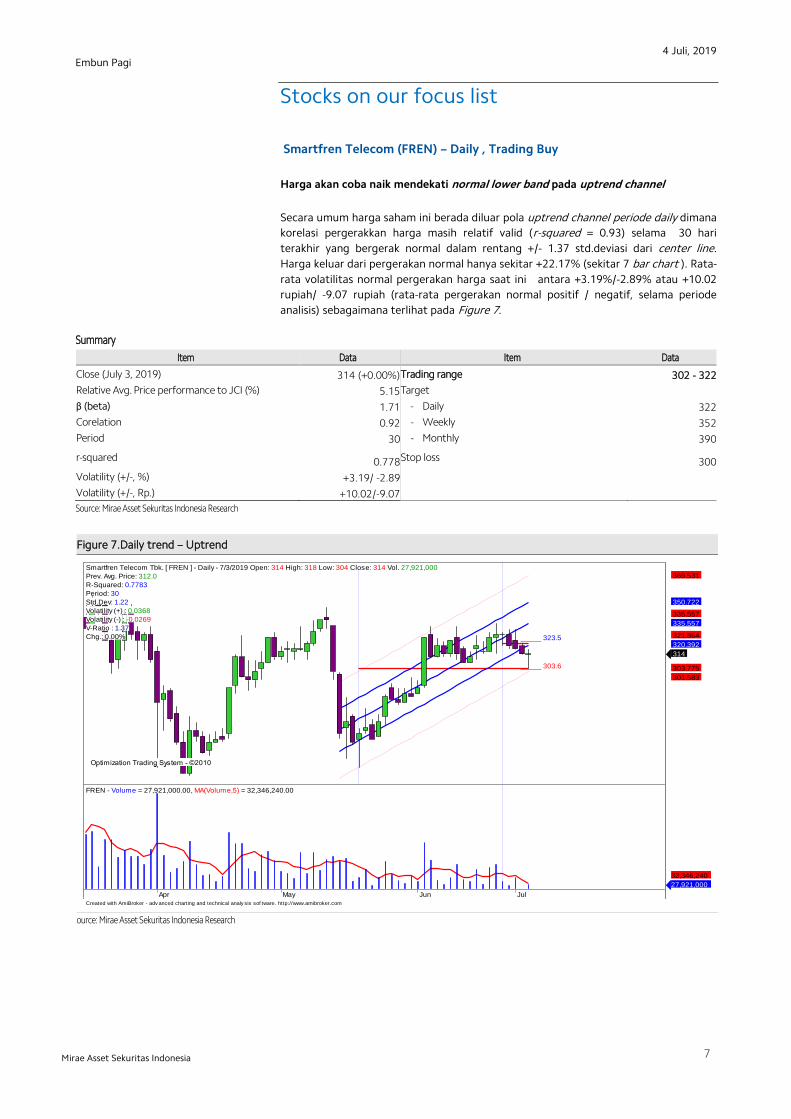
Smartfren Telecom (FREN) – Daily , Trading Buy
Harga akan coba naik mendekati normal lower band pada uptrend channel
Secara umum harga saham ini berada diluar pola uptrend channel periode daily dimana
korelasi pergerakkan harga masih relatif valid (r-squared = 0.93) selama 30 hari
terakhir yang bergerak normal dalam rentang +/- 1.37 std.deviasi dari center line.
Harga keluar dari pergerakan normal hanya sekitar +22.17% (sekitar 7 bar chart ). Rata-
rata volatilitas normal pergerakan harga saat ini antara +3.19%/-2.89% atau +10.02
rupiah/ -9.07 rupiah (rata-rata pergerakan normal positif / negatif, selama periode
analisis) sebagaimana terlihat pada Figure 7.
Summary
Item Data Item Data
Close (July 3, 2019) 314 (+0.00%) Trading range 302 - 322
Relative Avg. Price performance to JCI (%) 5.15 Target
β (beta) 1.71 - Daily 322
Corelation 0.92 - Weekly 352
Period 30 - Monthly 390
r-squared 0.778 Stop loss 300
Volatility (+/-, %) +3.19/ -2.89
Volatility (+/-, Rp.) +10.02/-9.07
Source: Mirae Asset Sekuritas Indonesia Research
Figure 7.Daily trend – Uptrend
ource: Mirae Asset Sekuritas Indonesia Research
Created with AmiBroker - adv anced charting and technical analy sis sof tware. http://www.amibroker.com
_____ 323.5
_____ 303.6
Optimization Trading System - ©2010 Optimization Trading System - ©2010 Optimization Trading System - ©2010 Optimization Trading System - ©2010
Smartfren Telecom Tbk. [ FREN ] - Daily - 7/3/2019 Open: 314 High: 318 Low: 304 Close: 314 Vol. 27,921,000
Prev. Avg. Price: 312.0
R-Squared: 0.7783
Period: 30
Std.Dev: 1.22
Volatility (+) : 0.0368
Volatility (-) : -0.0269
V-Ratio : 1.37
Chg.: 0.00%
314
303.775
301.583
320.392
321.864
335.557
335.557
350.722
369.531
Apr May Jun Jul
FREN - Volume = 27,921,000.00, MA(Volume,5) = 32,346,240.00
27,921,000
32,346,240
4 Juli, 2019
8
Embun Pagi
Mirae Asset Sekuritas Indonesia
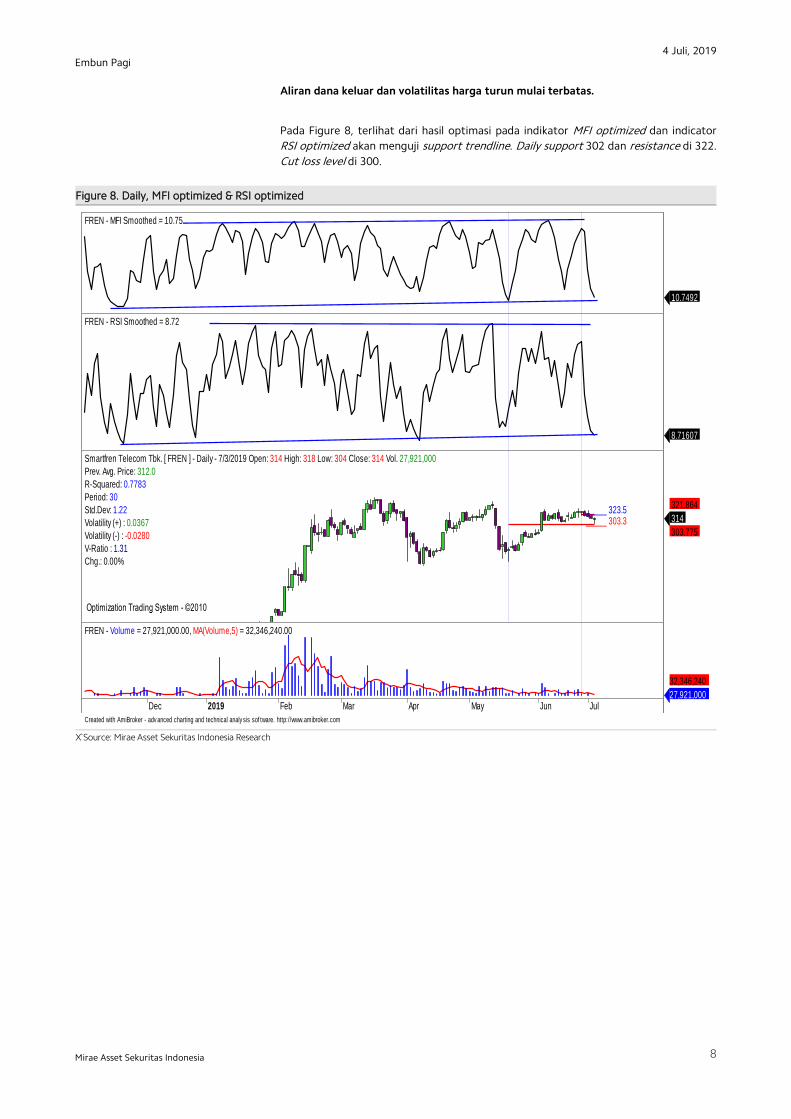
Aliran dana keluar dan volatilitas harga turun mulai terbatas.
Pada Figure 8, terlihat dari hasil optimasi pada indikator MFI optimized dan indicator
RSI optimized akan menguji support trendline. Daily support 302 dan resistance di 322.
Cut loss level di 300.
Figure 8. Daily, MFI optimized & RSI optimized
X`Source: Mirae Asset Sekuritas Indonesia Research
Created with AmiBroker - adv anced charting and technical analy sis sof tware. http://www.amibroker.com
FREN - MFI Smoothed = 10.75
10.7492
FREN - RSI Smoothed = 8.72
8.71607
_____ 323.5_____ 303.3
Optimization Trading System - ©2010 Optimization Trading System - ©2010
Smartfren Telecom Tbk. [ FREN ] - Daily - 7/3/2019 Open: 314 High: 318 Low: 304 Close: 314 Vol. 27,921,000
Prev. Avg. Price: 312.0
R-Squared: 0.7783
Period: 30
Std.Dev: 1.22
Volatility (+) : 0.0367
Volatility (-) : -0.0280
V-Ratio : 1.31
Chg.: 0.00%
314
303.775
321.864
Dec 2019 Feb Mar Apr May Jun Jul
FREN - Volume = 27,921,000.00, MA(Volume,5) = 32,346,240.00
27,921,000
32,346,240
4 Juli, 2019
9
Embun Pagi
Mirae Asset Sekuritas Indonesia
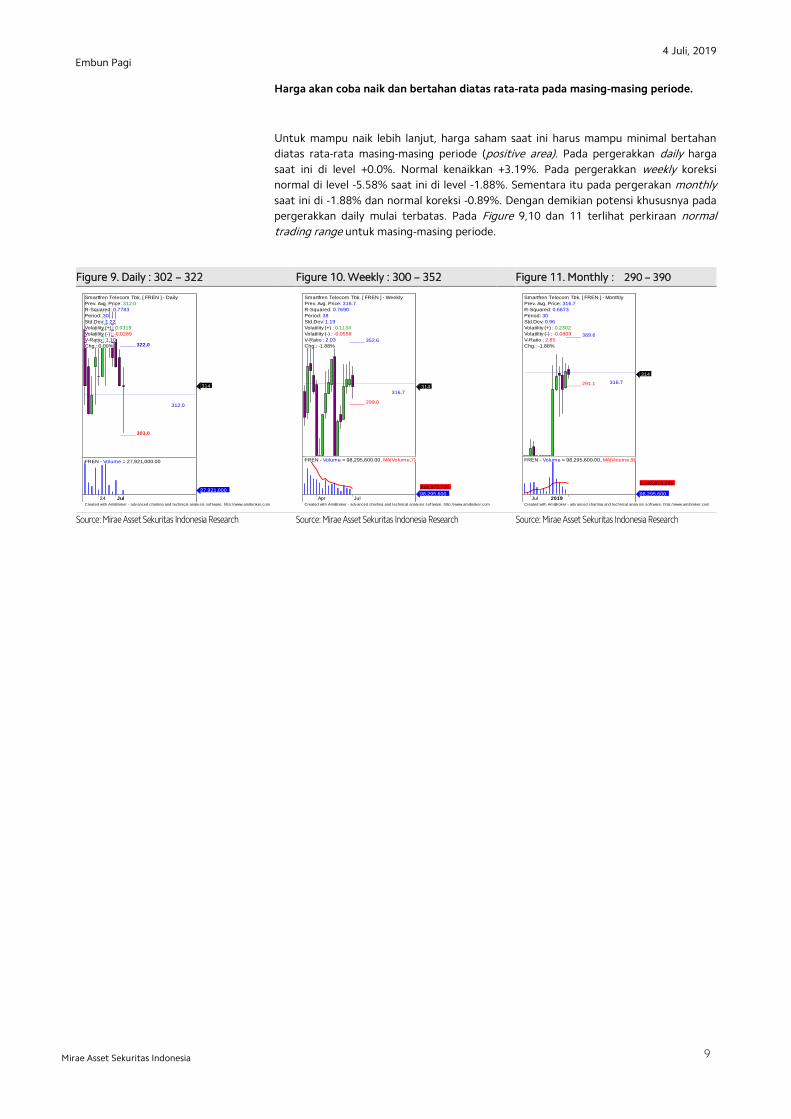
Harga akan coba naik dan bertahan diatas rata-rata pada masing-masing periode.
Untuk mampu naik lebih lanjut, harga saham saat ini harus mampu minimal bertahan
diatas rata-rata masing-masing periode (positive area). Pada pergerakkan daily harga
saat ini di level +0.0%. Normal kenaikkan +3.19%. Pada pergerakkan weekly koreksi
normal di level -5.58% saat ini di level -1.88%. Sementara itu pada pergerakan monthly
saat ini di -1.88% dan normal koreksi -0.89%. Dengan demikian potensi khususnya pada
pergerakkan daily mulai terbatas. Pada Figure 9,10 dan 11 terlihat perkiraan normal
trading range untuk masing-masing periode.
Figure 9. Daily : 302 – 322 Figure 10. Weekly : 300 – 352 Figure 11. Monthly : 290 – 390
x`x`
Source: Mirae Asset Sekuritas Indonesia Research
Source: Mirae Asset Sekuritas Indonesia Research
Source: Mirae Asset Sekuritas Indonesia Research
Created with AmiBroker - adv anced charting and technical analy sis sof tware. http://www.amibroker.com
_____ 322.0
_____ 303.0
312.0
Smartfren Telecom Tbk. [ FREN ] - Daily
Prev. Avg. Price: 312.0
R-Squared: 0.7783
Period: 30
Std.Dev: 1.22
Volatility (+) : 0.0319
Volatility (-) : -0.0289
V-Ratio : 1.10
Chg.: 0.00%
314
24 Jul
FREN - Volume = 27,921,000.00
27,921,000
Created with AmiBroker - adv anced charting and technical analy sis sof tware. http://www.amibroker.com
_____ 352.6
_____ 299.0
316.7
Smartfren Telecom Tbk. [ FREN ] - Weekly
Prev. Avg. Price: 316.7
R-Squared: 0.7690
Period: 38
Std.Dev: 1.19
Volatility (+) : 0.1134
Volatility (-) : -0.0558
V-Ratio : 2.03
Chg.: -1.88%
314
Apr Jul
FREN - Volume = 98,295,600.00, MA(Volume,7)
98,295,600
318,372,736
Created with AmiBroker - adv anced charting and technical analy sis sof tware. http://www.amibroker.com
_____ 389.6
_____ 291.1 316.7
Smartfren Telecom Tbk. [ FREN ] - Monthly
Prev. Avg. Price: 316.7
R-Squared: 0.6673
Period: 30
Std.Dev: 0.96
Volatility (+) : 0.2302
Volatility (-) : -0.0809
V-Ratio : 2.85
Chg.: -1.88%
314
Jul Oct 2019
FREN - Volume = 98,295,600.00, MA(Volume,9)
98,295,600
2,492,873,216
4 Juli, 2019
10
Embun Pagi
Mirae Asset Sekuritas Indonesia
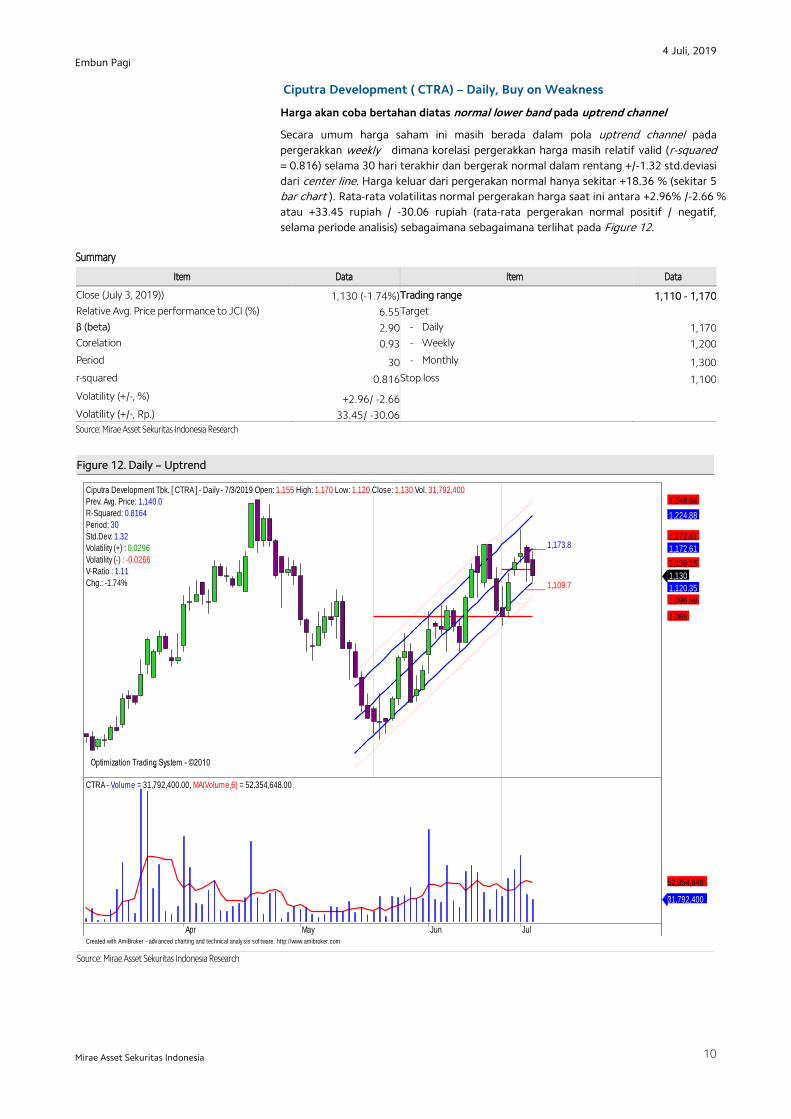
Ciputra Development ( CTRA) – Daily, Buy on Weakness
Harga akan coba bertahan diatas normal lower band pada uptrend channel
Secara umum harga saham ini masih berada dalam pola uptrend channel pada
pergerakkan weekly dimana korelasi pergerakkan harga masih relatif valid (r-squared
= 0.816) selama 30 hari terakhir dan bergerak normal dalam rentang +/-1.32 std.deviasi
dari center line. Harga keluar dari pergerakan normal hanya sekitar +18.36 % (sekitar 5
bar chart ). Rata-rata volatilitas normal pergerakan harga saat ini antara +2.96% /-2.66 %
atau +33.45 rupiah / -30.06 rupiah (rata-rata pergerakan normal positif / negatif,
selama periode analisis) sebagaimana sebagaimana terlihat pada Figure 12.
Summary
Item Data Item Data
Close (July 3, 2019)) 1,130 (-1.74%) Trading range 1,110 - 1,170
Relative Avg. Price performance to JCI (%) 6.55 Target
β (beta) 2.90 - Daily 1,170
Corelation 0.93 - Weekly 1,200
Period 30 - Monthly 1,300
r-squared 0.816 Stop loss 1,100
Volatility (+/-, %) +2.96/ -2.66
Volatility (+/-, Rp.) 33.45/ -30.06
Source: Mirae Asset Sekuritas Indonesia Research
Figure 12. Daily – Uptrend
x`
Source: Mirae Asset Sekuritas Indonesia Research
,
Created with AmiBroker - adv anced charting and technical analy sis sof tware. http://www.amibroker.com
_____ 1,173.8
_____ 1,109.7
Optimization Trading System - ©2010 Optimization Trading System - ©2010 Optimization Trading System - ©2010 Optimization Trading System - ©2010
Ciputra Development Tbk. [ CTRA ] - Daily - 7/3/2019 Open: 1,155 High: 1,170 Low: 1,120 Close: 1,130 Vol. 31,792,400
Prev. Avg. Price: 1,140.0
R-Squared: 0.8164
Period: 30
Std.Dev: 1.32
Volatility (+) : 0.0296
Volatility (-) : -0.0266
V-Ratio : 1.11
Chg.: -1.74% 1,130
1,120.35
1,096.59
1,065
1,139.15
1,172.61
1,172.61
1,224.88
1,248.64
Apr May Jun Jul
CTRA - Volume = 31,792,400.00, MA(Volume,6) = 52,354,648.00
31,792,400
52,354,648
4 Juli, 2019
11
Embun Pagi
Mirae Asset Sekuritas Indonesia
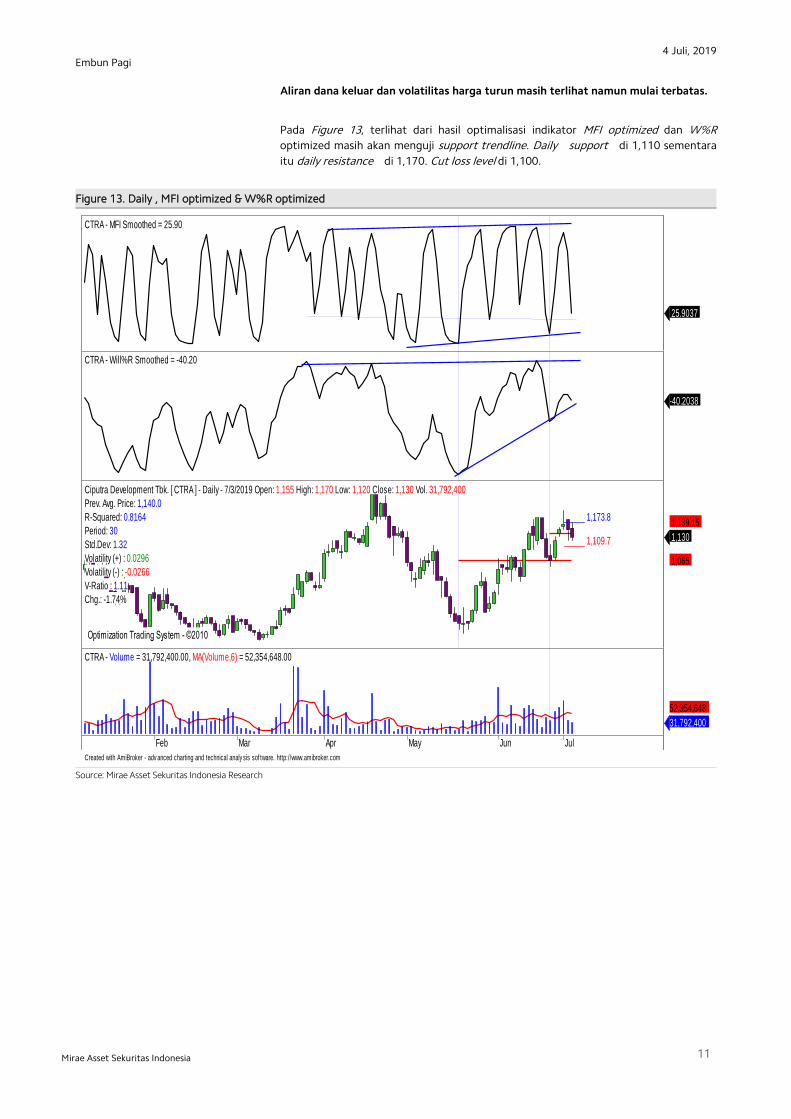
Aliran dana keluar dan volatilitas harga turun masih terlihat namun mulai terbatas.
Pada Figure 13, terlihat dari hasil optimalisasi indikator MFI optimized dan W%R
optimized masih akan menguji support trendline. Daily support di 1,110 sementara
itu daily resistance di 1,170. Cut loss level di 1,100.
Figure 13. Daily , MFI optimized & W%R optimized
,
Source: Mirae Asset Sekuritas Indonesia Research
Created with AmiBroker - adv anced charting and technical analy sis sof tware. http://www.amibroker.com
CTRA - MFI Smoothed = 25.90
25.9037
CTRA - Will%R Smoothed = -40.20
-40.2038
_____ 1,173.8
_____ 1,109.7
Optimization Trading System - ©2010 Optimization Trading System - ©2010
Ciputra Development Tbk. [ CTRA ] - Daily - 7/3/2019 Open: 1,155 High: 1,170 Low: 1,120 Close: 1,130 Vol. 31,792,400
Prev. Avg. Price: 1,140.0
R-Squared: 0.8164
Period: 30
Std.Dev: 1.32
Volatility (+) : 0.0296
Volatility (-) : -0.0266
V-Ratio : 1.11
Chg.: -1.74%
1,130
1,065
1,139.15
Feb Mar Apr May Jun Jul
CTRA - Volume = 31,792,400.00, MA(Volume,6) = 52,354,648.00
31,792,400
52,354,648

4 Juli, 2019
12
Embun Pagi
Mirae Asset Sekuritas Indonesia
Harga saat ini akan coba naik dan bertahan diatas rata-rata pada masing-masing
periode.
Untuk mampu naik lebih lanjut, harga saham saat ini harus mampu minimal bertahan
diatas rata-rata masing-masing periode (positive area) . Lebih lanjut potensi koreksi
normal harga pada pergerakkan daily sekitar -2.66% saat ini di level -1.74%. Sementara
itu pada pergerakkan weekly koreksi normal sekitar -4.51% saat ini harga di level -
1.74%. Pada pergerakan monthly koreksi normal sekitar +9.68% saat ini di -1.74%.
Dengan demikian diperkirakan potensi kenaikkan mulai terbatas secara umum. Pada
Figure 14,15 dan 16 terlihat perkiraan normal trading range untuk masing-masing
periode.
Figure 14. Daily : 1,110 – 1,170 Figure 15. Weekly : 1,100 – 1,200 Figure 16. Monthly : 1,040 – 1,300
, x`
x
Source: Mirae Asset Sekuritas Indonesia Research
Source: Mirae Asset Sekuritas Indonesia Research
Source: Mirae Asset Sekuritas Indonesia Research
Created with AmiBroker - adv anced charting and technical analy sis sof tware. http://www.amibroker.com
_____ 1,173.8
_____ 1,109.7
1,140
Ciputra Development Tbk. [ CTRA ] - Daily
Prev. Avg. Price: 1,140.0
R-Squared: 0.8164
Period: 30
Std.Dev: 1.32
Volatility (+) : 0.0296
Volatility (-) : -0.0266
V-Ratio : 1.11
Chg.: -1.74%
1,130
24 Jul
CTRA - Volume = 31,792,400.00
31,792,400
Created with AmiBroker - adv anced charting and technical analy sis sof tware. http://www.amibroker.com
_____ 1,200.9
_____ 1,099.8
1,151.7
Ciputra Development Tbk. [ CTRA ] - Weekly
Prev. Avg. Price: 1,151.7
R-Squared: 0.6571
Period: 156
Std.Dev: 0.94
Volatility (+) : 0.0428
Volatility (-) : -0.0451
V-Ratio : 0.95
Chg.: -1.74%
1,130
May Jun
CTRA - Volume = 153,764,192.00
153,764,192
Created with AmiBroker - adv anced charting and technical analy sis sof tware. http://www.amibroker.com
_____ 1,304.8
_____ 1,040.2
1,151.7
Ciputra Development Tbk. [ CTRA ] - Monthly
Prev. Avg. Price: 1,151.7
R-Squared: 0.7252
Period: 172
Std.Dev: 1.09
Volatility (+) : 0.1329
Volatility (-) : -0.0968
V-Ratio : 1.37
Chg.: -1.74%
1,130
Jul Oct 2019
CTRA - Volume = 153,764,192.00
153,764,192
4 Juli, 2019
13
Embun Pagi
Mirae Asset Sekuritas Indonesia
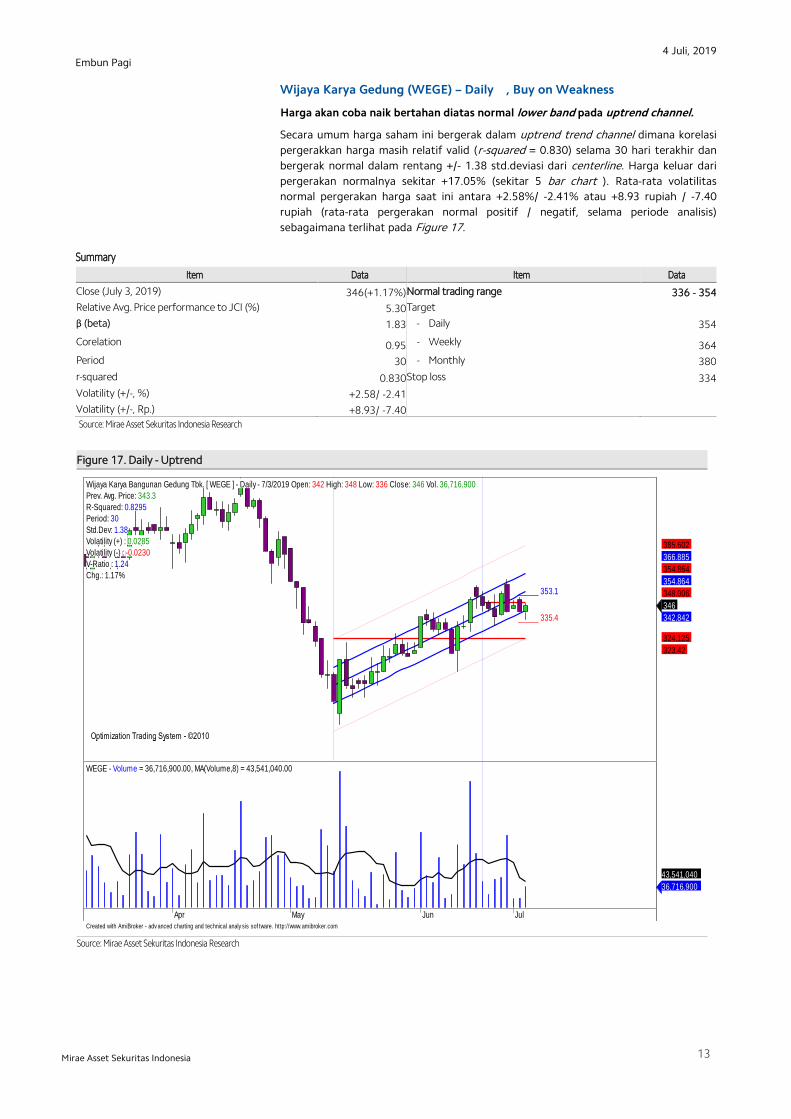
Wijaya Karya Gedung (WEGE) – Daily , Buy on Weakness
Harga akan coba naik bertahan diatas normal lower band pada uptrend channel.
Secara umum harga saham ini bergerak dalam uptrend trend channel dimana korelasi
pergerakkan harga masih relatif valid (r-squared = 0.830) selama 30 hari terakhir dan
bergerak normal dalam rentang +/- 1.38 std.deviasi dari centerline. Harga keluar dari
pergerakan normalnya sekitar +17.05% (sekitar 5 bar chart ). Rata-rata volatilitas
normal pergerakan harga saat ini antara +2.58%/ -2.41% atau +8.93 rupiah / -7.40
rupiah (rata-rata pergerakan normal positif / negatif, selama periode analisis)
sebagaimana terlihat pada Figure 17.
Summary
Item Data Item Data
Close (July 3, 2019) 346(+1.17%) Normal trading range 336 - 354
Relative Avg. Price performance to JCI (%) 5.30 Target
β (beta) 1.83 - Daily 354
Corelation 0.95 - Weekly 364
Period 30 - Monthly 380
r-squared 0.830 Stop loss 334
Volatility (+/-, %) +2.58/ -2.41
Volatility (+/-, Rp.) +8.93/ -7.40
Source: Mirae Asset Sekuritas Indonesia Research
Figure 17. Daily - Uptrend
Source: Mirae Asset Sekuritas Indonesia Research
,
Created with AmiBroker - adv anced charting and technical analy sis sof tware. http://www.amibroker.com
_____ 353.1
_____ 335.4
Optimization Trading System - ©2010 Optimization Trading System - ©2010 Optimization Trading System - ©2010 Optimization Trading System - ©2010
Wijaya Karya Bangunan Gedung Tbk. [ WEGE ] - Daily - 7/3/2019 Open: 342 High: 348 Low: 336 Close: 346 Vol. 36,716,900
Prev. Avg. Price: 343.3
R-Squared: 0.8295
Period: 30
Std.Dev: 1.38
Volatility (+) : 0.0285
Volatility (-) : -0.0230
V-Ratio : 1.24
Chg.: 1.17%
346
342.842
324.125
323.42
348.006
354.864
354.864
366.885
385.602
Apr May Jun Jul
WEGE - Volume = 36,716,900.00, MA(Volume,8) = 43,541,040.00
36,716,900
43,541,040
4 Juli, 2019
14
Embun Pagi
Mirae Asset Sekuritas Indonesia
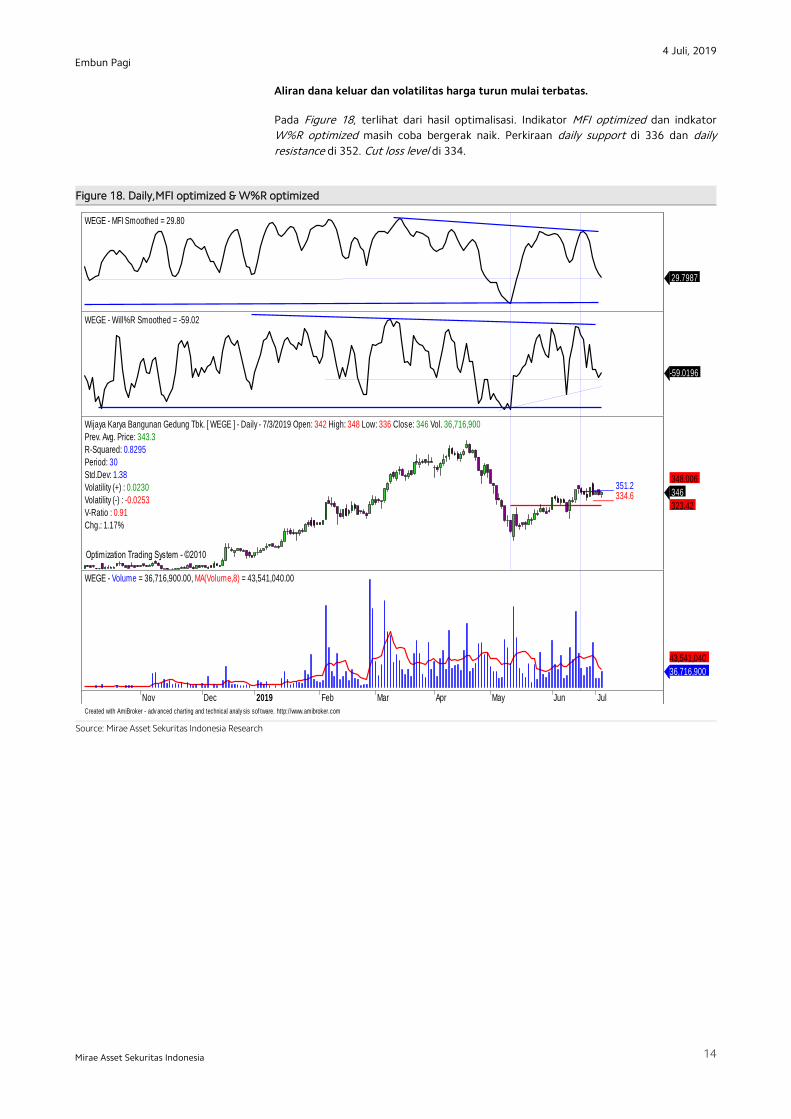
Aliran dana keluar dan volatilitas harga turun mulai terbatas.
Pada Figure 18, terlihat dari hasil optimalisasi. Indikator MFI optimized dan indkator
W%R optimized masih coba bergerak naik. Perkiraan daily support di 336 dan daily
resistance di 352. Cut loss level di 334.
Figure 18. Daily,MFI optimized & W%R optimized
XXXXXXXXXXXXXXX
Source: Mirae Asset Sekuritas Indonesia Research
Created with AmiBroker - adv anced charting and technical analy sis sof tware. http://www.amibroker.com
WEGE - MFI Smoothed = 29.80
29.7987
WEGE - Will%R Smoothed = -59.02
-59.0196
_____ 351.2_____ 334.6
Optimization Trading System - ©2010 Optimization Trading System - ©2010
Wijaya Karya Bangunan Gedung Tbk. [ WEGE ] - Daily - 7/3/2019 Open: 342 High: 348 Low: 336 Close: 346 Vol. 36,716,900
Prev. Avg. Price: 343.3
R-Squared: 0.8295
Period: 30
Std.Dev: 1.38
Volatility (+) : 0.0230
Volatility (-) : -0.0253
V-Ratio : 0.91
Chg.: 1.17%
346
323.42
348.006
Nov Dec 2019 Feb Mar Apr May Jun Jul
WEGE - Volume = 36,716,900.00, MA(Volume,8) = 43,541,040.00
36,716,900
43,541,040
4 Juli, 2019
15
Embun Pagi
Mirae Asset Sekuritas Indonesia
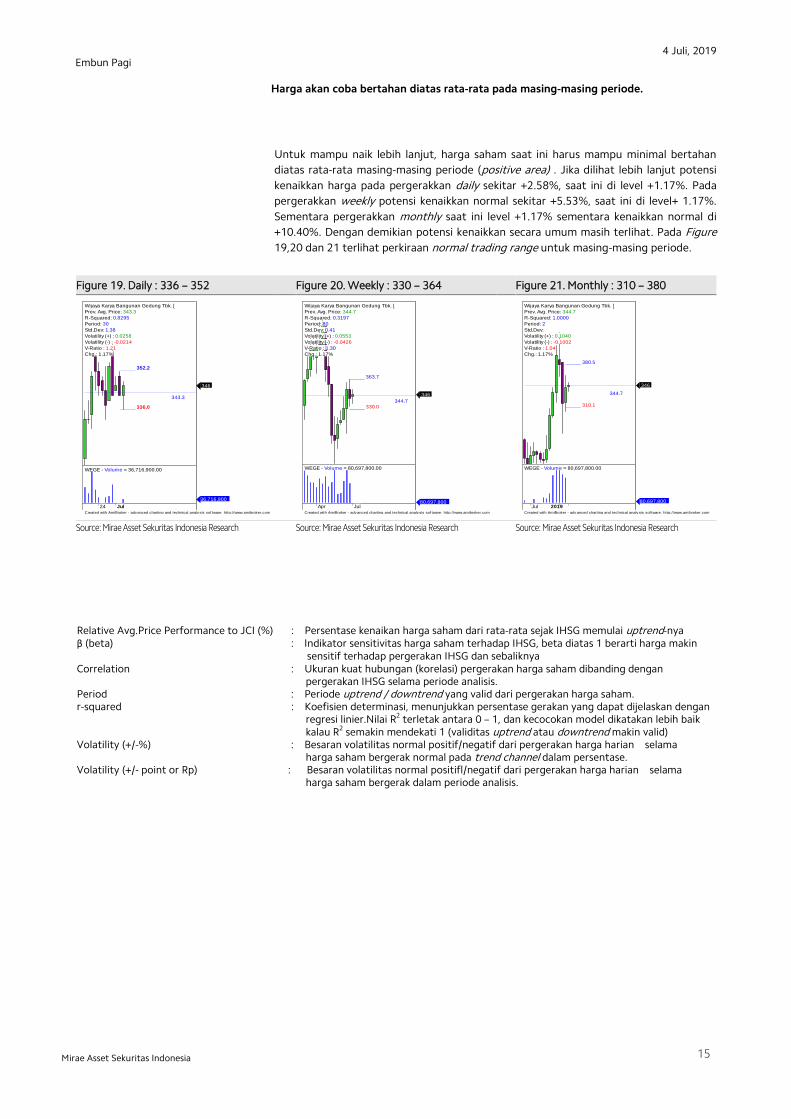
Harga akan coba bertahan diatas rata-rata pada masing-masing periode.
Untuk mampu naik lebih lanjut, harga saham saat ini harus mampu minimal bertahan
diatas rata-rata masing-masing periode (positive area) . Jika dilihat lebih lanjut potensi
kenaikkan harga pada pergerakkan daily sekitar +2.58%, saat ini di level +1.17%. Pada
pergerakkan weekly potensi kenaikkan normal sekitar +5.53%, saat ini di level+ 1.17%.
Sementara pergerakkan monthly saat ini level +1.17% sementara kenaikkan normal di
+10.40%. Dengan demikian potensi kenaikkan secara umum masih terlihat. Pada Figure
19,20 dan 21 terlihat perkiraan normal trading range untuk masing-masing periode.
Figure 19. Daily : 336 – 352 Figure 20. Weekly : 330 – 364 Figure 21. Monthly : 310 – 380
,,
x` x,
Source: Mirae Asset Sekuritas Indonesia Research
Source: Mirae Asset Sekuritas Indonesia Research
Source: Mirae Asset Sekuritas Indonesia Research
Relative Avg.Price Performance to JCI (%) : Persentase kenaikan harga saham dari rata-rata sejak IHSG memulai uptrend-nya β (beta) : Indikator sensitivitas harga saham terhadap IHSG, beta diatas 1 berarti harga makin sensitif terhadap pergerakan IHSG dan sebaliknya Correlation : Ukuran kuat hubungan (korelasi) pergerakan harga saham dibanding dengan pergerakan IHSG selama periode analisis. Period : Periode uptrend / downtrend yang valid dari pergerakan harga saham. r-squared : Koefisien determinasi, menunjukkan persentase gerakan yang dapat dijelaskan dengan regresi linier.Nilai R2 terletak antara 0 – 1, dan kecocokan model dikatakan lebih baik kalau R2 semakin mendekati 1 (validitas uptrend atau downtrend makin valid) Volatility (+/-%) : Besaran volatilitas normal positif/negatif dari pergerakan harga harian selama harga saham bergerak normal pada trend channel dalam persentase. Volatility (+/- point or Rp) : Besaran volatilitas normal positifl/negatif dari pergerakan harga harian selama harga saham bergerak dalam periode analisis.
Created with AmiBroker - adv anced charting and technical analy sis sof tware. http://www.amibroker.com
_____ 352.2
_____ 336.0
343.3
Wijaya Karya Bangunan Gedung Tbk. [
Prev. Avg. Price: 343.3
R-Squared: 0.8295
Period: 30
Std.Dev: 1.38
Volatility (+) : 0.0258
Volatility (-) : -0.0214
V-Ratio : 1.21
Chg.: 1.17%
346
24 Jul
WEGE - Volume = 36,716,900.00
36,716,900
Created with AmiBroker - adv anced charting and technical analy sis sof tware. http://www.amibroker.com
_____ 363.7
_____ 330.0344.7
Wijaya Karya Bangunan Gedung Tbk. [
Prev. Avg. Price: 344.7
R-Squared: 0.3197
Period: 80
Std.Dev: 0.41
Volatility (+) : 0.0553
Volatility (-) : -0.0426
V-Ratio : 1.30
Chg.: 1.17%
346
Apr Jul
WEGE - Volume = 80,697,800.00
80,697,800
Created with AmiBroker - adv anced charting and technical analy sis sof tware. http://www.amibroker.com
_____ 380.5
_____ 310.1
344.7
Wijaya Karya Bangunan Gedung Tbk. [
Prev. Avg. Price: 344.7
R-Squared: 1.0000
Period: 2
Std.Dev:
Volatility (+) : 0.1040
Volatility (-) : -0.1002
V-Ratio : 1.04
Chg.: 1.17%
346
Jul Oct 2019
WEGE - Volume = 80,697,800.00
80,697,800

4 Juli, 2019
16
Embun Pagi
Mirae Asset Sekuritas Indonesia
Chart 22. JCI Vs. USD/IDR Chart 23. JCI performance (absolute vs. relative)
Source: Bloomberg, Mirae Asset Sekuritas Indonesia
Note: Relative to MSCI EM Index
Source: Bloomberg, Mirae Asset Sekuritas Indonesia
Chart 24. Foreigner’s net purchase (EM) Chart 25. Energy price
V
Note: The latest figure for India are July 1st, 2019
Source: Bloomberg, Mirae Asset Sekuritas Indonesia
Source: Bloomberg, Mirae Asset Sekuritas Indonesia
Chart 26. Non-ferrous metal price Chart 27. Precious metal price
Source: Bloomberg, Mirae Asset Sekuritas Indonesia Source: Bloomberg, Mirae Asset Sekuritas Indonesia
13,800
14,200
14,600
15,000
15,400
5,400
5,800
6,200
6,600
4/2 4/30 5/28 6/25
(IDR) (pt) JCI (L) USD/IDR (R)
-0.3
0.8
2.5
11.0
0.0 0.4
-2.9
10.6
-4
0
4
8
12
1D 1W 1M 1Y
Absolute Relative(%, %p)
19
-263
-36
4 5
-225
354 316
726
342
-129
-397
-600
-400
-200
0
200
400
600
800
Korea Taiwan Indonesia Thailand Philippines India
1 Day 5 Days (USDmn) (USDmn)
80
90
100
110
6/27 7/25 8/22 9/19
CPO WTI Coal(D-3M=100) (D-3M=100)
70
80
90
100
110
4/3 5/1 5/29 6/26
CPO WTI Coal(D-3M=100)
80
85
90
95
100
105
110
04/19 05/19 05/19 06/19
(D-3M=100) Copper Nickel Tin
85
95
105
115
04/19 05/19 05/19 06/19
(D-3M=100) Silver Gold Platinum

4 Juli, 2019
17
Embun Pagi
Mirae Asset Sekuritas Indonesia
Table. Key valuation metrics
Company Name Ticker Price Market Cap Price Performance (%) P/E(X)* P/B(X)* ROE(%)*
(IDR) (IDRbn) 1D 1W 1M 1Y FY18 FY19 FY18 FY19 FY18 FY19
Jakarta Composite Index JCI 6,363 7,272,853 -0.3 0.8 2.5 11.0 15.8 14.1 2.3 2.1 17.4 15.8
FINANCIALS
Bank Central Asia BBCA 30,000 739,650 0.0 2.3 3.1 41.3 24.8 28.9 4.2 4.9 18.3 18.3
Bank Mandiri Persero BMRI 8,025 374,500 0.0 0.9 4.6 21.6 13.8 15.6 1.9 2.1 14.4 13.9
Bank Rakyat Indonesia Persero BBRI 4,400 542,722 -0.2 0.9 7.3 50.2 13.8 16.7 2.4 2.9 18.5 18.4
Bank Negara Indonesia Persero BBNI 9,325 173,899 -0.3 5.4 11.0 29.5 10.9 11.4 1.5 1.6 14.5 14.6
Bank Tabungan Negara Persero BBTN 2,450 25,946 -2.4 -5.8 -0.8 -0.8 21.5 10.8 1.8 1.1 9.8 10.5
CONSUMER
HM Sampoerna HMSP 3,120 362,912 1.6 -2.2 -7.7 -19.0 32.0 27.5 12.2 10.4 39.0 38.2
Gudang Garam GGRM 77,725 149,550 -0.6 1.1 -3.4 11.9 20.6 18.3 3.6 3.3 17.8 18.6
Indofood CBP Sukses Makmur ICBP 10,125 118,077 0.0 0.7 3.3 11.6 26.7 26.8 5.6 5.3 22.2 20.9
Indofood Sukses Makmur INDF 7,100 62,341 -0.4 2.2 7.6 10.5 15.7 15.6 1.9 1.9 12.8 12.2
Kalbe Farma KLBF 1,445 67,735 -0.3 -1.7 2.8 15.6 29.0 27.7 4.9 4.6 17.6 17.5
Unilever Indonesia UNVR 44,900 342,587 -0.4 0.2 0.9 -3.4 38.0 42.9 46.9 54.3 145.1 139.8
AGRICULTURAL
Astra Agro Lestari AALI 10,450 20,113 -2.8 0.5 -0.9 -5.0 15.8 13.5 1.2 1.1 7.7 7.6
PP London Sumatera Indonesia LSIP 1,175 8,017 0.0 4.9 2.6 23.0 25.5 15.6 1.0 1.0 4.0 5.8
Sawit Sumbermas Sarana SSMS 995 9,477 -0.5 -1.0 -3.4 -22.0 138.1 16.9 2.9 2.2 2.1 12.8
INFRASTRUCTURE
XL Axiata EXCL 2,860 30,568 -3.4 -2.1 0.0 21.2 N/A 796.4 1.2 1.4 -16.5 0.3
Jasa Marga JSMR 5,800 42,096 -1.7 1.3 1.8 32.1 14.1 18.9 1.8 2.4 13.8 12.7
Perusahaan Gas Negara PGAS 2,100 50,907 -0.5 -1.9 1.9 30.4 11.2 14.9 1.4 1.2 9.7 8.2
Tower Bersama Infrastructure TBIG 3,980 18,035 2.1 5.3 8.7 -17.9 23.0 20.0 4.6 5.6 21.1 27.3
Telekomunikasi Indonesia TLKM 4,240 420,024 -0.2 6.5 10.3 14.4 20.6 21.4 3.8 4.3 18.8 19.5
Soechi Lines SOCI 228 1,609 -0.9 -5.8 11.8 59.4 4.7 N/A 0.2 N/A 4.2 N/A
Garuda Indonesia GIAA 380 9,837 0.5 -3.1 -12.0 62.4 N/A N/A 0.8 1.1 -19.1 -12.0
BASIC-INDUSTRIES
Semen Indonesia SMGR 12,700 75,330 0.0 10.9 10.0 83.4 22.2 29.9 2.2 2.5 10.2 8.3
Charoen Pokphand Indonesia CPIN 5,100 83,630 1.5 15.1 4.1 42.5 26.0 18.6 6.1 4.4 26.0 25.3
Indocement Tunggal Prakarsa INTP 21,450 78,962 -0.1 7.4 1.2 65.0 59.3 73.9 2.9 3.6 4.8 5.3
Japfa Comfeed Indonesia JPFA 1,600 18,763 0.9 5.3 6.7 -2.4 11.5 7.9 2.6 1.7 24.5 22.1
MINING
Indo Tambangraya Megah ITMG 17,275 19,519 0.1 -2.4 -1.4 -22.5 5.8 5.2 1.6 1.4 27.1 27.0
Adaro Energy ADRO 1,360 43,501 -4.2 0.0 5.0 -23.2 6.4 7.4 0.7 0.8 11.7 11.8
Aneka Tambang ANTM 815 19,585 -3.0 -1.2 12.4 1.2 21.0 24.8 0.9 1.0 4.6 3.9
Vale Indonesia INCO 2,930 29,113 -4.9 -3.9 8.5 -28.0 36.8 29.7 1.2 1.1 3.3 4.0
Tambang Batubara Bukit Asam PTBA 3,000 34,562 -0.7 0.3 -2.0 -25.0 9.0 6.8 2.8 2.1 33.9 35.3
TRADE
United Tractors UNTR 28,250 105,376 -0.8 1.6 11.4 -12.0 9.2 9.3 1.9 1.9 22.4 22.1
AKR Corporindo AKRA 4,250 17,062 1.4 3.9 6.8 3.7 24.0 19.2 2.1 2.1 20.7 13.1
Global Mediacom BMTR 410 6,287 6.8 6.8 -0.5 -21.9 4.1 N/A 0.4 N/A 8.8 N/A
Matahari Department Store LPPF 3,410 9,950 -3.7 -1.2 -9.1 -60.6 14.9 5.9 8.8 3.1 53.0 65.7
Media Nusantara Citra MNCN 1,210 17,274 11.0 15.2 6.1 31.5 5.7 12.3 0.9 1.7 16.2 14.1
Matahari Putra Prima MPPA 218 1,641 -6.8 -0.9 13.0 -9.2 N/A N/A 1.0 N/A -77.3 N/A
Surya Citra Media SCMA 1,630 24,073 -0.9 1.6 -1.2 -20.9 18.4 15.7 6.0 5.4 35.0 34.3
Siloam International Hospital SILO 4,890 7,950 6.3 8.2 14.5 10.1 360.8 167.5 0.9 1.2 0.3 0.8
PROPERTY
Bumi Serpong Damai BSDE 1,515 29,159 -0.3 0.0 12.2 3.4 18.6 15.9 0.9 1.1 5.0 6.7
Adhi Karya ADHI 1,650 5,875 -1.8 -0.3 13.8 -2.9 8.8 7.5 0.9 0.9 10.6 11.8
Alam Sutera Relaty ASRI 344 6,759 0.0 -0.6 6.2 11.7 6.3 6.2 0.6 0.7 10.8 11.2
Ciputra Development CTRA 1,130 20,973 -1.7 6.1 15.3 17.1 15.9 20.3 1.3 1.4 8.5 7.0
Lippo Karawaci LPKR 268 7,476 -2.2 -4.3 4.9 -3.0 8.9 6.8 0.3 0.4 3.3 5.6
Pembangunan Perumahan PTPP 2,150 13,330 -1.4 -1.4 9.1 7.8 7.5 8.4 0.9 1.0 12.4 12.5
Pakuwon Jati PWON 715 34,434 -4.0 -2.1 1.4 36.2 11.7 15.1 2.4 2.8 22.2 19.1
Summarecon Agung SMRA 1,150 16,591 -2.5 -1.7 11.1 39.4 25.9 46.8 1.7 2.5 6.7 5.4
Wijaya Karya WIKA 2,410 21,618 -2.8 3.0 6.2 89.8 8.6 14.2 1.0 1.5 12.6 10.8
Waskita Karya WSKT 1,985 26,944 -1.2 2.1 9.7 8.2 5.8 6.6 1.3 1.3 24.8 20.4
MISCELLANEOUS
Astra International ASII 7,275 294,518 -0.3 0.3 -2.3 16.4 15.4 13.2 2.4 2.2 16.6 16.5
4 Juli, 2019
18
Embun Pagi
Mirae Asset Sekuritas Indonesia
Source: Bloomberg, Mirae Asset Sekuritas Indonesia
*Note: Valuation metrics based on Bloomberg consensus estimates
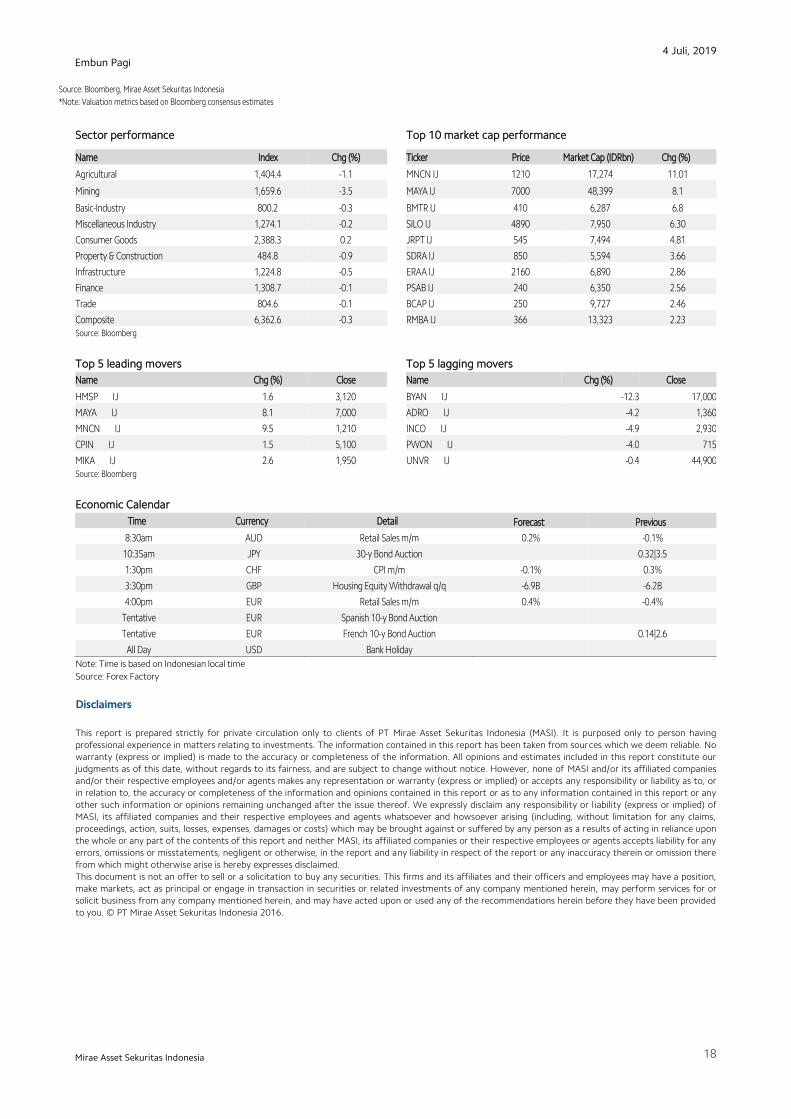
Sector performance Top 10 market cap performance
Name Index Chg (%) Ticker Price Market Cap (IDRbn) Chg (%)
Agricultural 1,404.4 -1.1 MNCN IJ 1210 17,274 11.01
Mining 1,659.6 -3.5
MAYA IJ 7000 48,399 8.1
Basic-Industry 800.2 -0.3 BMTR IJ 410 6,287 6.8
Miscellaneous Industry 1,274.1 -0.2 SILO IJ 4890 7,950 6.30
Consumer Goods 2,388.3 0.2 JRPT IJ 545 7,494 4.81
Property & Construction 484.8 -0.9
SDRA IJ 850 5,594 3.66
Infrastructure 1,224.8 -0.5 ERAA IJ 2160 6,890 2.86
Finance 1,308.7 -0.1 PSAB IJ 240 6,350 2.56
Trade 804.6 -0.1 BCAP IJ 250 9,727 2.46
Composite 6,362.6 -0.3 RMBA IJ 366 13,323 2.23 Source: Bloomberg
Top 5 leading movers Top 5 lagging movers
Name Chg (%) Close Name Chg (%) Close
HMSP IJ 1.6 3,120 BYAN IJ -12.3 17,000
MAYA IJ 8.1 7,000 ADRO IJ -4.2 1,360
MNCN IJ 9.5 1,210 INCO IJ -4.9 2,930
CPIN IJ 1.5 5,100 PWON IJ -4.0 715
MIKA IJ 2.6 1,950 UNVR IJ -0.4 44,900 Source: Bloomberg
Economic Calendar
Time Currency Detail Forecast Previous
8:30am AUD Retail Sales m/m 0.2% -0.1%
10:35am JPY 30-y Bond Auction 0.32|3.5
1:30pm CHF CPI m/m -0.1% 0.3%
3:30pm GBP Housing Equity Withdrawal q/q -6.9B -6.2B
4:00pm EUR Retail Sales m/m 0.4% -0.4%
Tentative EUR Spanish 10-y Bond Auction
Tentative EUR French 10-y Bond Auction 0.14|2.6
All Day USD Bank Holiday
Note: Time is based on Indonesian local time
Source: Forex Factory
Disclaimers
This report is prepared strictly for private circulation only to clients of PT Mirae Asset Sekuritas Indonesia (MASI). It is purposed only to person having
professional experience in matters relating to investments. The information contained in this report has been taken from sources which we deem reliable. No
warranty (express or implied) is made to the accuracy or completeness of the information. All opinions and estimates included in this report constitute our
judgments as of this date, without regards to its fairness, and are subject to change without notice. However, none of MASI and/or its affiliated companies
and/or their respective employees and/or agents makes any representation or warranty (express or implied) or accepts any responsibility or liability as to, or
in relation to, the accuracy or completeness of the information and opinions contained in this report or as to any information contained in this report or any
other such information or opinions remaining unchanged after the issue thereof. We expressly disclaim any responsibility or liability (express or implied) of
MASI, its affiliated companies and their respective employees and agents whatsoever and howsoever arising (including, without limitation for any claims,
proceedings, action, suits, losses, expenses, damages or costs) which may be brought against or suffered by any person as a results of acting in reliance upon
the whole or any part of the contents of this report and neither MASI, its affiliated companies or their respective employees or agents accepts liability for any
errors, omissions or misstatements, negligent or otherwise, in the report and any liability in respect of the report or any inaccuracy therein or omission there
from which might otherwise arise is hereby expresses disclaimed.
This document is not an offer to sell or a solicitation to buy any securities. This firms and its affiliates and their officers and employees may have a position,
make markets, act as principal or engage in transaction in securities or related investments of any company mentioned herein, may perform services for or
solicit business from any company mentioned herein, and may have acted upon or used any of the recommendations herein before they have been provided
to you. © PT Mirae Asset Sekuritas Indonesia 2016.